- Analytics
- News and Tools
- Market News
CFD Markets News and Forecasts — 09-03-2023
- US Dollar Index remains depressed after posting the biggest daily loss in a week.
- Cautious mood ahead of the US data, downbeat early signals for NFP weigh on DXY.
- Pullback in US Treasury bond yields, sluggish markets add strength to the US Dollar Index retreat.
- US employment report for February appears the key amid challenges for Fed hawks.
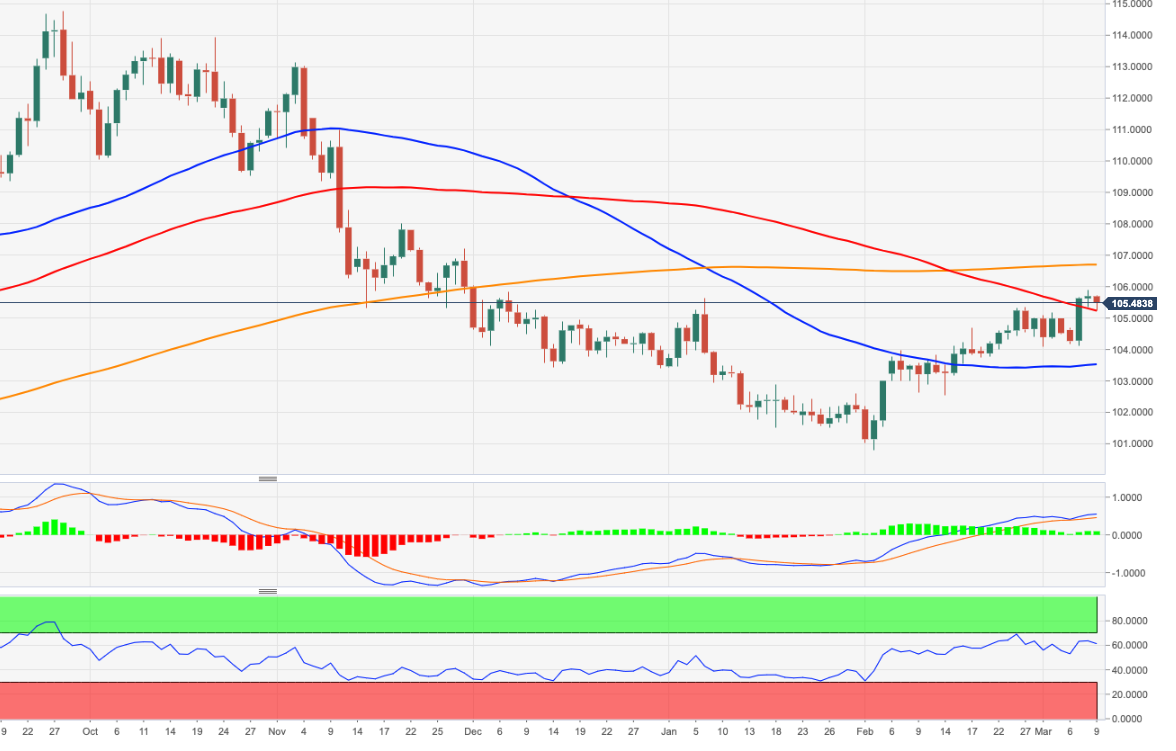
US Dollar Index (DXY) stays dicey around 105.30 amid the initial trading hours of the all-important Friday comprising the US jobs report for February. That said, the greenback’s gauge versus the six major currencies dropped the most in a week the previous day after mixed US data joined a pullback in the US Treasury bond yields. However, risk-off mood and challenges to sentiment put a floor under the prices.
On Thursday, US Initial Jobless Claims rose the most since January, to 211K for the week ended on March 03 versus 195K expected and 190K prior. Additionally, the Challenger Job Cuts were down and the Continuing Jobless Claims were up. Previously, the US ADP Employment Change rose to 242K in February versus 200K market forecasts and 119K prior (revised). Further, January JOLTS job openings were 10.8M, compared to an upwardly revised 11.2M prior and 10.6M market forecast.
With this, the early signals for Friday’s Nonfarm Payrolls (NFP) appear mixed and challenge the market’s push for 0.50% Fed rate hike in March, as backed by Federal Reserve Chairman Jerome Powell’s latest signals.
On the same line, the US 10-year and two-year Treasury bond yields eased to 3.92% and 4.87% versus 5.08% and 4.01% daily open respectively on Thursday. With this, the 10-year coupons marked the biggest daily loss in a week while the two-year counterpart flashed the heaviest fall in two months. As a result, Wall Street benchmarks closed with more than 1.5% daily losses each, with S&P 500 Futures printing mild losses by the press time.
Elsewhere, disappointment from China’s monthly Consumer Price Index (CPI) and Producer Price Index (PPI) data for February dims the prospects of recovery in the world’s second-largest economy, which in turn weigh on sentiment and allow DXY bears to take a breather. On the same line could be the fears of higher taxes in the world’s biggest economy, the US, as well as the political chaos relating to it as US President Joe Biden proposes raising corporation tax to cut $3 trillion from the fiscal deficit over the next decade.
Looking ahead, market forecasts suggest an overall easing in the US employment report for February. The same contrasts with the hawkish Fed bias to highlight the odds of a strong market move in favor of the US Dollar Index in case of a positive surprise.
Also read: Nonfarm Payrolls Preview: Five scenarios for the Fed, USD and stocks reactions, with probabilities
Technical analysis
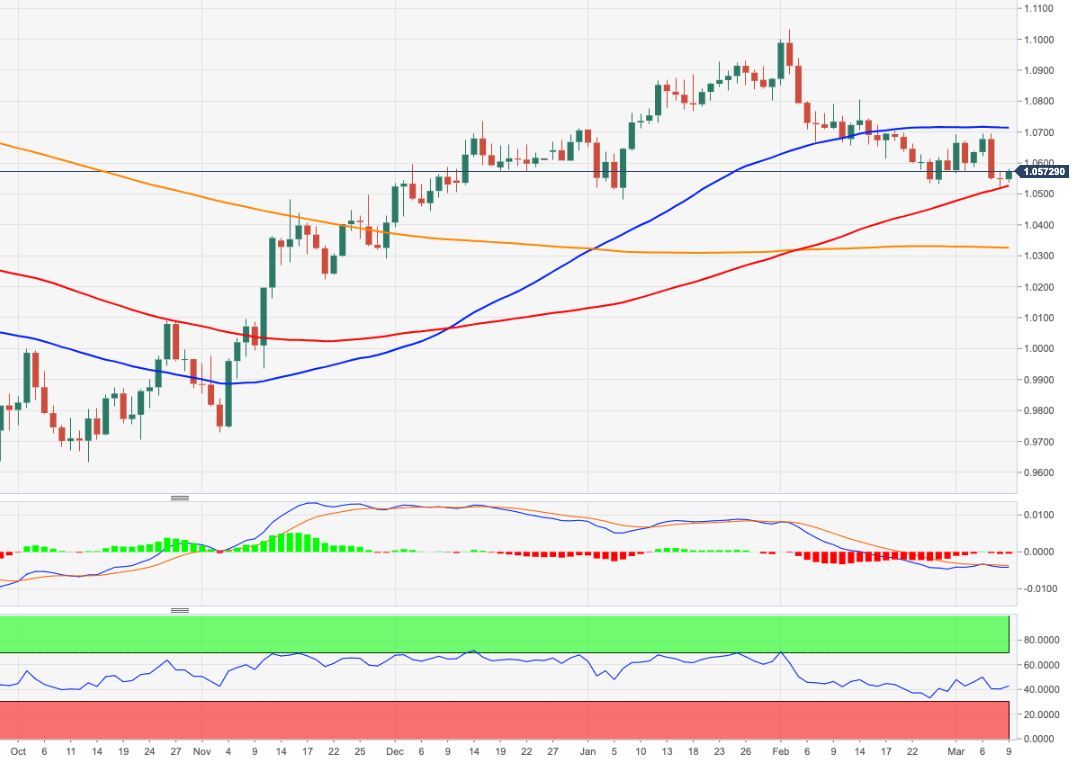
Despite the latest pullback, the 100-DMA level surrounding 105.15 challenges the US Dollar Index bears.
- NZD/USD's resistance between 0.6120 and 0.6150 could lead to a downside extension in failures below the area.
- All eyes are on the US NFP event.
NZD/USD is gliding bid ahead of key US Nonfarm Payroll data tonight while the USD DXY has turned soft ahead of the event putting some wind under the Bird's wings. The following illustrates a corrective bias ahead of the event but bearish overall.
NZD/USD daily charts
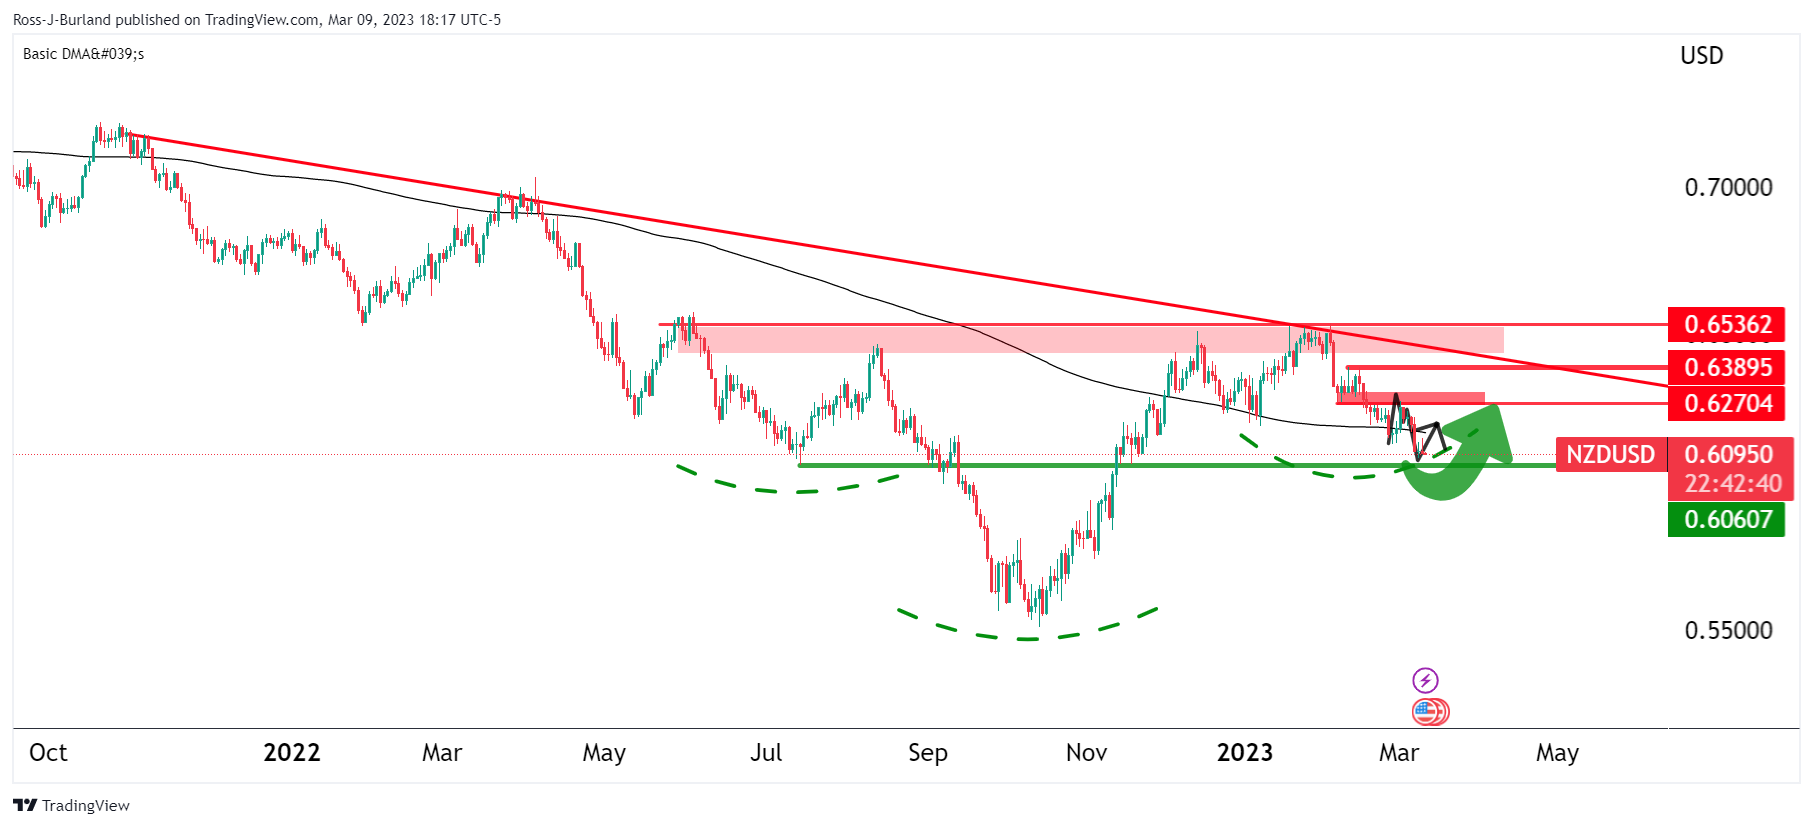
The daily chart's inverse head and shoulders are compelling, but the price remains on the front side of the dominant bear trend still and there are bearish under tones while below 0.6270.

In the meanwhile, there are prospects of a fuller test of the dynamic resistance in line with the 200-DMA and neckline of the M-formation.
With that being said, 0.6150 near the 38.2% Fibonacci that meets the dynamic resistance could prove a tough nut to crack.
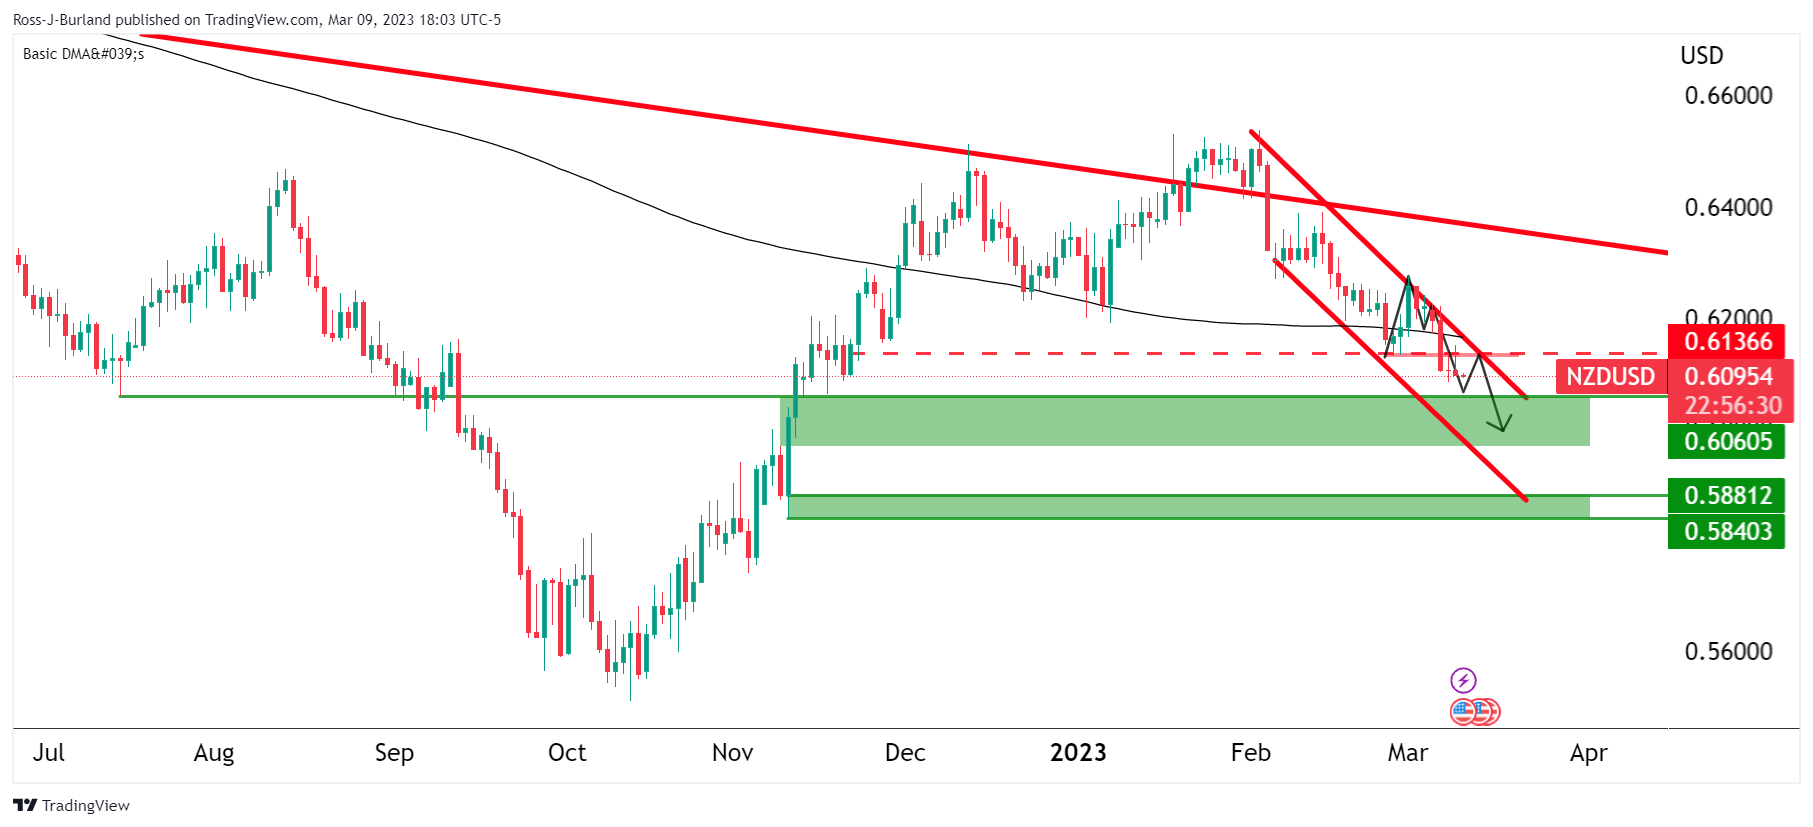
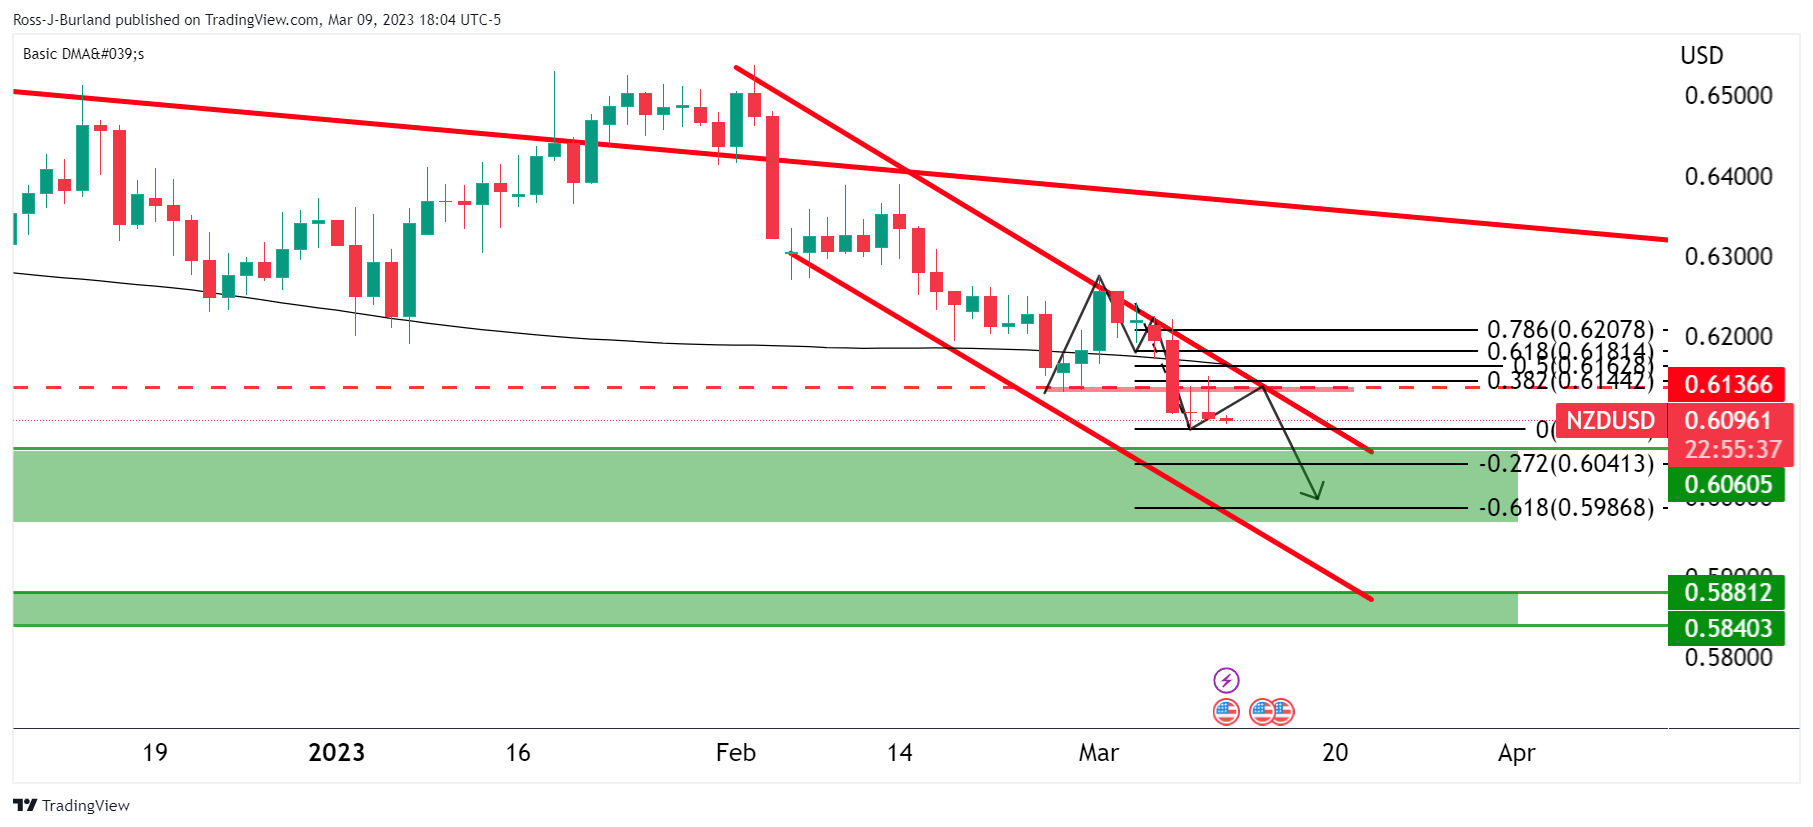
NZD/USD H1 chart
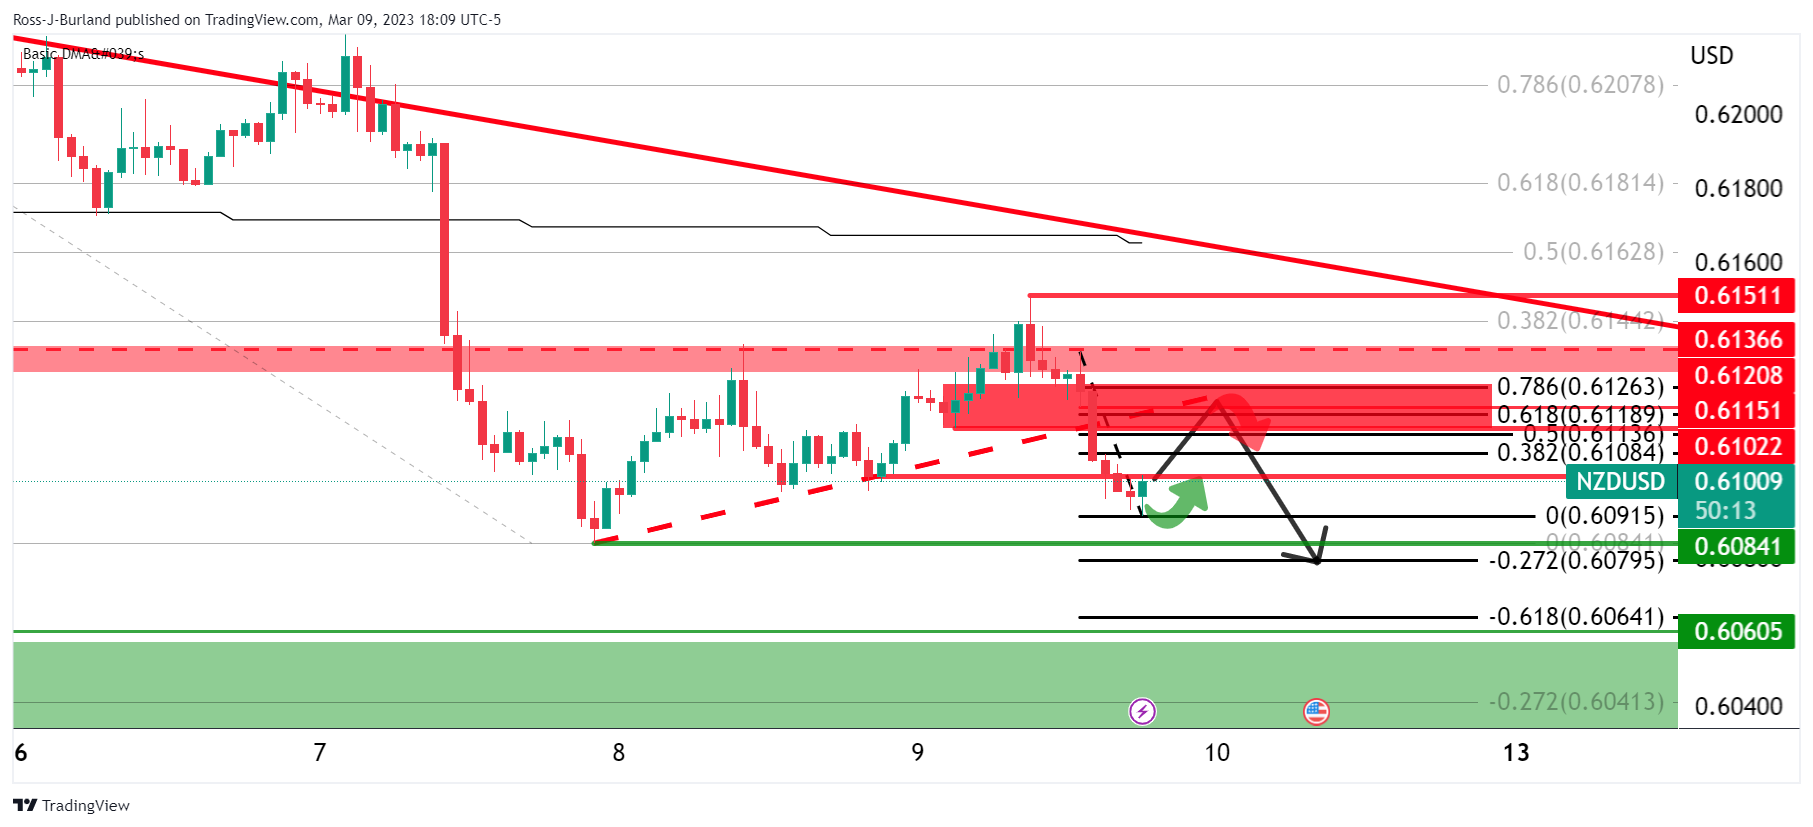
On the lower time frames, such as the hourly, the 0.6120s could prove to be resilient also and lead to a downside extension in failures below the level.
- Gold price pares weekly losses by grinding higher, sidelined of late.
- United States Treasury bond yields retreat amid mixed clues for Nonfarm Payrolls (NFP) and challenge XAU/USD traders of late.
- Fears emanating from China, US President Biden’s budget proposal cap Gold prices amid pre-data anxiety.
- Downbeat NFP forecasts tease positive surprise and XAU/USD decline despite likely comparative deterioration in the actual figures.
Gold price (XAU/USD) portrays the typical pre-data caution as it seesaws around the $1,830 resistance confluence during early Friday, following the biggest daily run-up in a week. Apart from the XAU/USD trader’s anxiety ahead of the United States employment data for February, challenges to sentiment and doubts on the latest retreat in the US Treasury bond yields also probe the bullion buyers of late.
Gold price recovers as sluggish United States employment clues weigh on yields
Gold price cheered mixed prints of the second-tier United States employment data and a pullback in the US Treasury bond yields to print the biggest daily jump in a week that pokes the short-term key resistance around $1,831.
On Wednesday, the US ADP Employment Change rose to 242K in February versus 200K market forecasts and 119K prior (revised). Further, January JOLTS job openings were 10.8M, compared to an upwardly revised 11.2M prior and 10.6M market forecast.
On the same line, US Initial Jobless Claims rose to 211K for the week ended on March 03 versus 195K expected and 190K prior. Additionally, the Challenger Job Cuts were down and the Continuing Jobless Claims were up.
Overall, the early signals for Friday’s Nonfarm Payrolls (NFP) appear mixed. However, analysts’ estimations for the Nonfarm Payrolls (NFP) appear too low at 203K, versus 517K prior, which in turn raises expectations of a positive surprise. The same may help the Gold bears to return to the table if details surrounding the wage growth and Unemployment Rate also refrain from the pessimistic outcome.
Also read: US February Nonfarm Payrolls Preview: Analyzing Gold price's reaction to NFP surprises
It should be noted that the US 10-year and two-year Treasury bond yields eased to 3.92% and 4.87% versus 5.08% and 4.01% daily open respectively on Thursday. With this, the 10-year coupons marked the biggest daily loss in a week while the two-year counterpart flashed the heaviest fall in two months. As a result, Wall Street benchmarks closed with more than 1.5% daily losses each whereas the US Dollar Index (DXY) managed to pare some of the daily losses by the end of Thursday but failed to ignore the biggest daily fall in a week.
Hawkish Fed bets keep XAU/USD sellers hopeful
Despite the latest lack of clarity in the markets due to the mixed United States data, the market’s bets on the Federal Reserve (Fed) remain hawkish, which in turn challenges the Gold buyers ahead of the key US data. On Wednesday, Federal Reserve Chairman Jerome Powell highlighted the data dependency while also signaling that they have underestimated the resilience of growth and inflation. The news defends the hawkish Fed bias as market players expected a 50 bps rate hike in March, versus 0.25% expected in the last week.
Fears from China, US President Biden tax proposal prod Gold bears
Apart from the United States data and Federal Reserve concerns, geopolitical headlines also challenge the Gold price recovery.
That said, disappointment from China’s monthly Consumer Price Index (CPI) and Producer Price Index (PPI) data for February dims the prospects of recovery in the world’s second-largest economy, as well as one of the biggest XAU/USD users.
On the same line could be the fears of higher taxes in the world’s biggest economy, the US, as well as the political chaos relating to it as US President Joe Biden proposes raising corporation tax to cut $3 trillion from the fiscal deficit over the next decade.
Gold price technical analysis
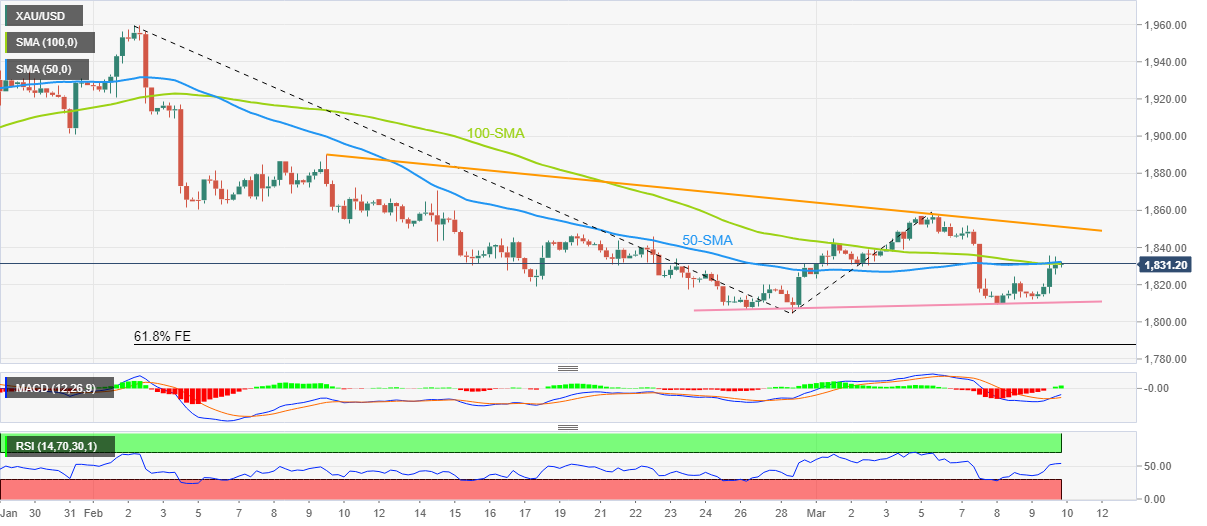
Gold price extends the mid-week rebound from a fortnight-old ascending support line as the bulls poke a convergence of 100 and 50 Simple Moving Averages (SMAs), around $1,831 by the press time.
Adding strength to the recovery movement is the Relative Strength Index (RSI) line, placed at 14, as it gradually rises from the oversold territory. Furthermore, the looming bull cross of the Moving Average Convergence and Divergence (MACD) indicator also keeps the XAU/USD buyers hopeful of overcoming the immediate $1,832 resistance confluence.
However, a downward-sloping trend line from early February, near $1,852 at the latest, acts as the key upside barrier for the Gold buyers to knock to retake control.
Meanwhile, a downside break of the aforementioned two-week-old support line, near $1,810 at the latest, puts a floor under the XAU/USD price.
Ina case where the Gold bears manage to conquer the stated key support trend line, the $1,800 threshold may test the fall targeting the 61.8% Fibonacci Expansion (FE) of the metal’s moves between early February and March 06, close to $1,787.
To sum up, Gold price appears picking up strength but the bulls are far from winning the driver’s seat.
Gold price: Four-hour chart
Trend: Limited upside expected
- GBP/JPY has sensed some buying interest near 162.00 ahead of the BoJ policy.
- Last BoJ Kuroda’s meeting might come with an unchanged stance, however, a power-pack action cannot be ruled out.
- In times when UK CPI is still in the double-digit figure, a steady policy stance could dampen BoE’s efforts.
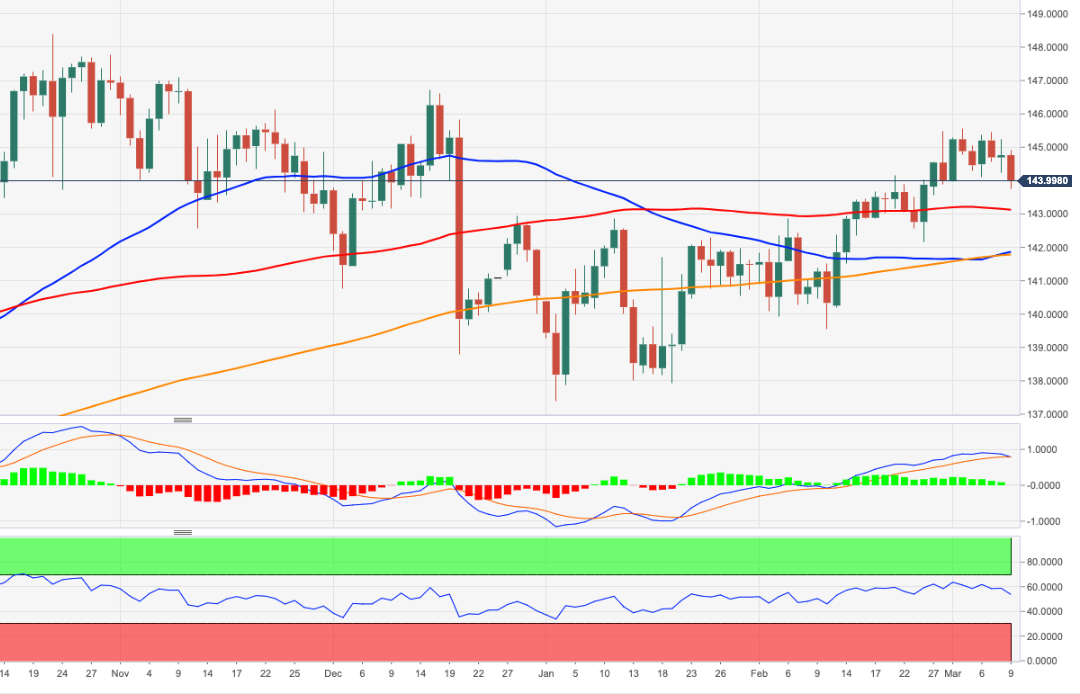
The GBP/JPY pair attempted a rebound to near 162.00 in the early Asian session. The cross is expected to display extremely volatile moves ahead as investors are awaiting the release of the United Kingdom’s monthly Gross Domestic Product (GDP) and Manufacturing sector data, and the interest rate decision by the Bank of Japan (BoJ).
Mounting expectations of the coming pause in the policy-tightening spell by the Bank of England (BoE) is impacting the Pound Sterling. BoE policymaker Swati Dhingra warned against further interest rate increases by citing “Overtightening poses a more material risk at this point.” She further added, “Many tightening effects are yet to fully take hold.”
In times when the UK headline Consumer Price Index (CPI) is still in double-digit figure despite pushing rates to 4%, a steady policy stance could dampen the efforts yet made by BoE Governor Andrew Bailey and his teammates.
On the economic front, Monthly Manufacturing production (Jan) is expected to contract by 0.1% and the Industrial Production is seen contracting by 0.2% in the same period. The consensus shows monthly GDP has expanded by 0.1% vs. December’s contraction of 0.5%.
Meanwhile, the Japanese Yen is likely to display a power-pack action as March’s monetary policy will be the last for BoJ Governor Haruhiko Kuroda. Analysts at Danske Bank are of the view that “The BoJ will tweak its yield curve control in the short-term. It is not likely to happen this week, but we also were surprised the last time they did it in December. Either way, we think it is a matter of time and could happen during Q2.”
- USD/CHF might continue its downside momentum to near 0.9300 amid signs of deceleration in the US labor market.
- Higher planned lay-off and an 11% jump in initial claims indicate that the US labor market is not tight enough.
- The theme of higher rates for a longer time might keep USD Index firmer in the coming months.
The USD/CHF pair has displayed a sheer downside to near 0.9320 as investors have ignored risks associated with bigger rates announcements and higher terminal rates as endorsed by Federal Reserve (Fed) chair Jerome Powell in his testimony before Congress. The Swiss Franc asset is expected to continue its downside move to near the round-level support of 0.9300 amid an absence of loss in the downside momentum.
S&P500 futures faced immense selling pressure on Thursday as the characteristics of reducing a deficit of nearly $3 trillion by the next decade and a big stretch in taxes on corporations, billionaires, and rich investors discouraged investors. The US Dollar Index (DXY) also witnessed pressure and corrected gradually to 105.25 as an expression of fiscal deficit will also restrict inflation from flexing its muscles.
Apart from that, an 11% jump in the number of individuals filing for jobless claims for the very first time conveyed that the United States labor market is not as upbeat as it appears. Also, planned lay-off for February jumped four-fold on an annual basis, as reported by Reuters.
Signs of deceleration in the US labor market supported demand for US government bonds, which trimmed the 10-year US Treasury yields heavily to 3.90%.
Economists at Rabobank see the risks as being titled towards a firmer for longer USD in the coming months. “In the near term, the releases of US payrolls and Consumer Price Index (CPI) data are likely to be instrumental in guiding the direction of the USD Index. However, the risks that inflation could prove sticky suggest that the higher for longer interest rate theme could persist for months.”
On the Swiss Franc front, investors will focus on next week’s Producers and Import Prices data. A contraction of 0.1% is expected on a monthly basis. The annual data could improve to 3.4% from the former release of 3.3%. A monthly decline could delight the Swiss National Bank (SNB), which has already confronted that Swiss’ inflationary pressures are getting beyond its control.
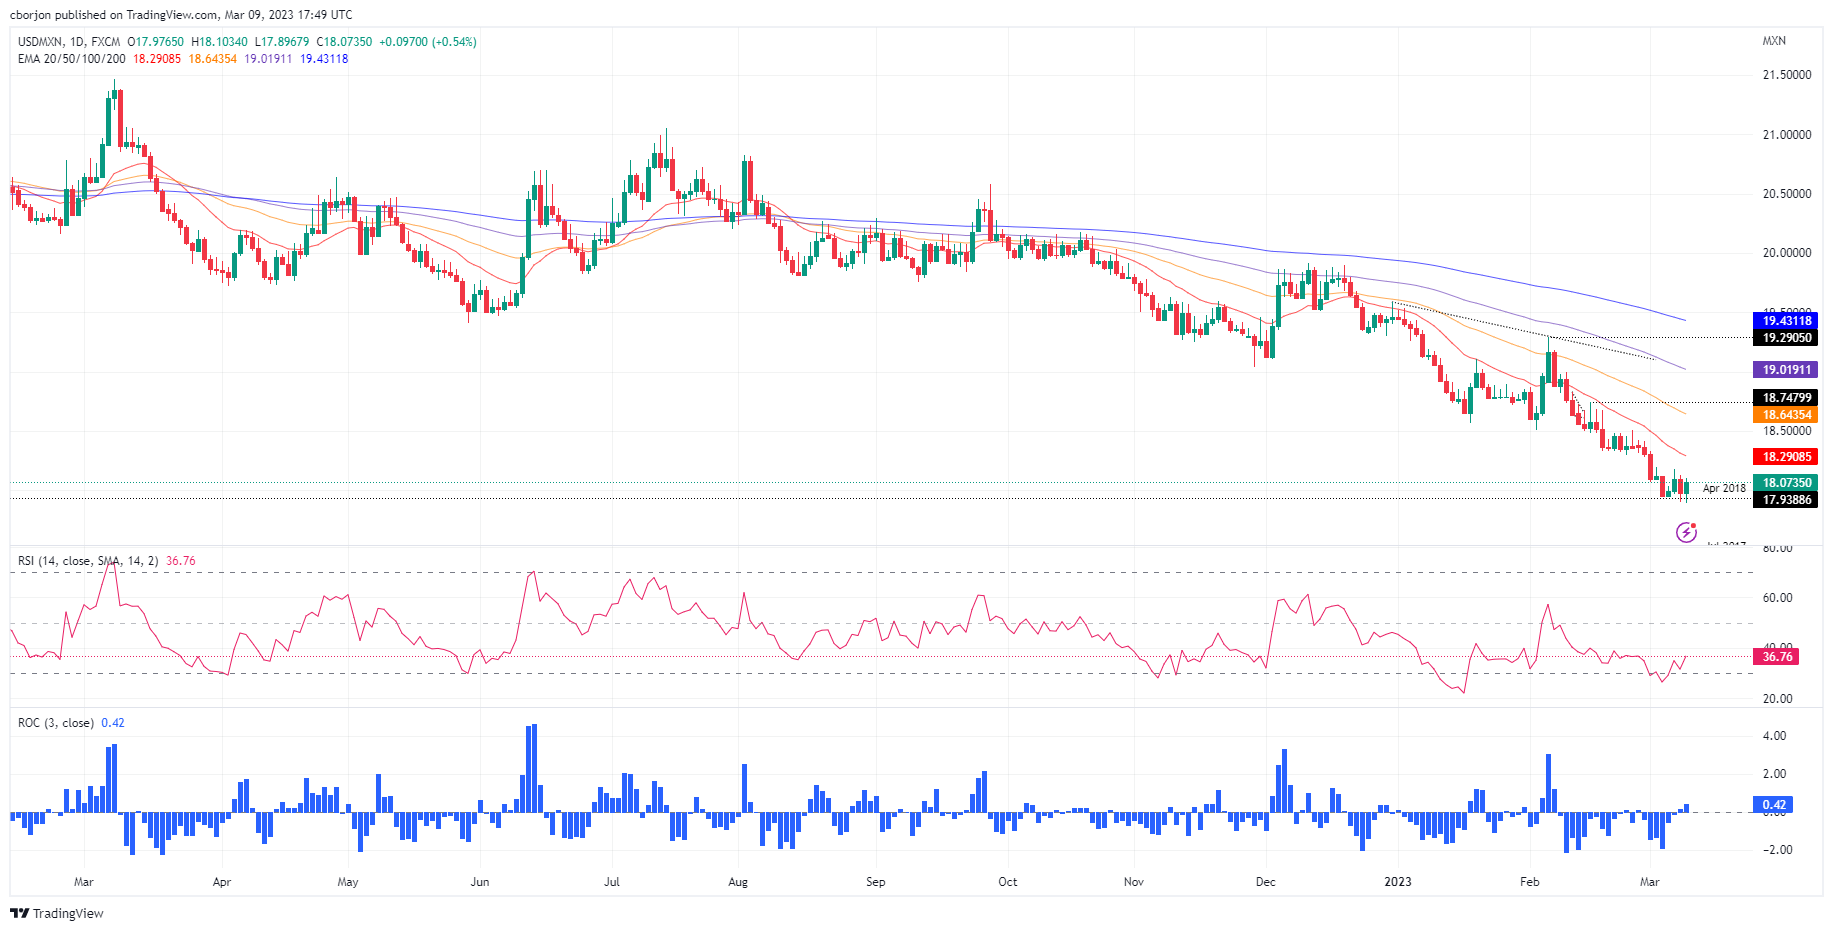
- Risk aversion bolstered the USD/MXN toward new weekly highs above $18.30.
- USD/MXN Price Analysis: The daily close above the 20-day EMA opened the door toward $18.60.
The Mexican Peso (MXN) is under pressure on Thursday; after reaching new 5-year lows at 17.8967, the USD/MXN has risen back towards the 18.0800 area. At around the Wall Street close, risk aversion pushed US equities lower, while the Mexican Peso depreciated the most since February 6, 2023. At the time of writing, the USD/MXN is gaining 2.07%, or 3700 pips, at 18.3323.
Also read: USD/MXN advances above the 18.00 figure as traders rush to safety
USD/MXN Price action
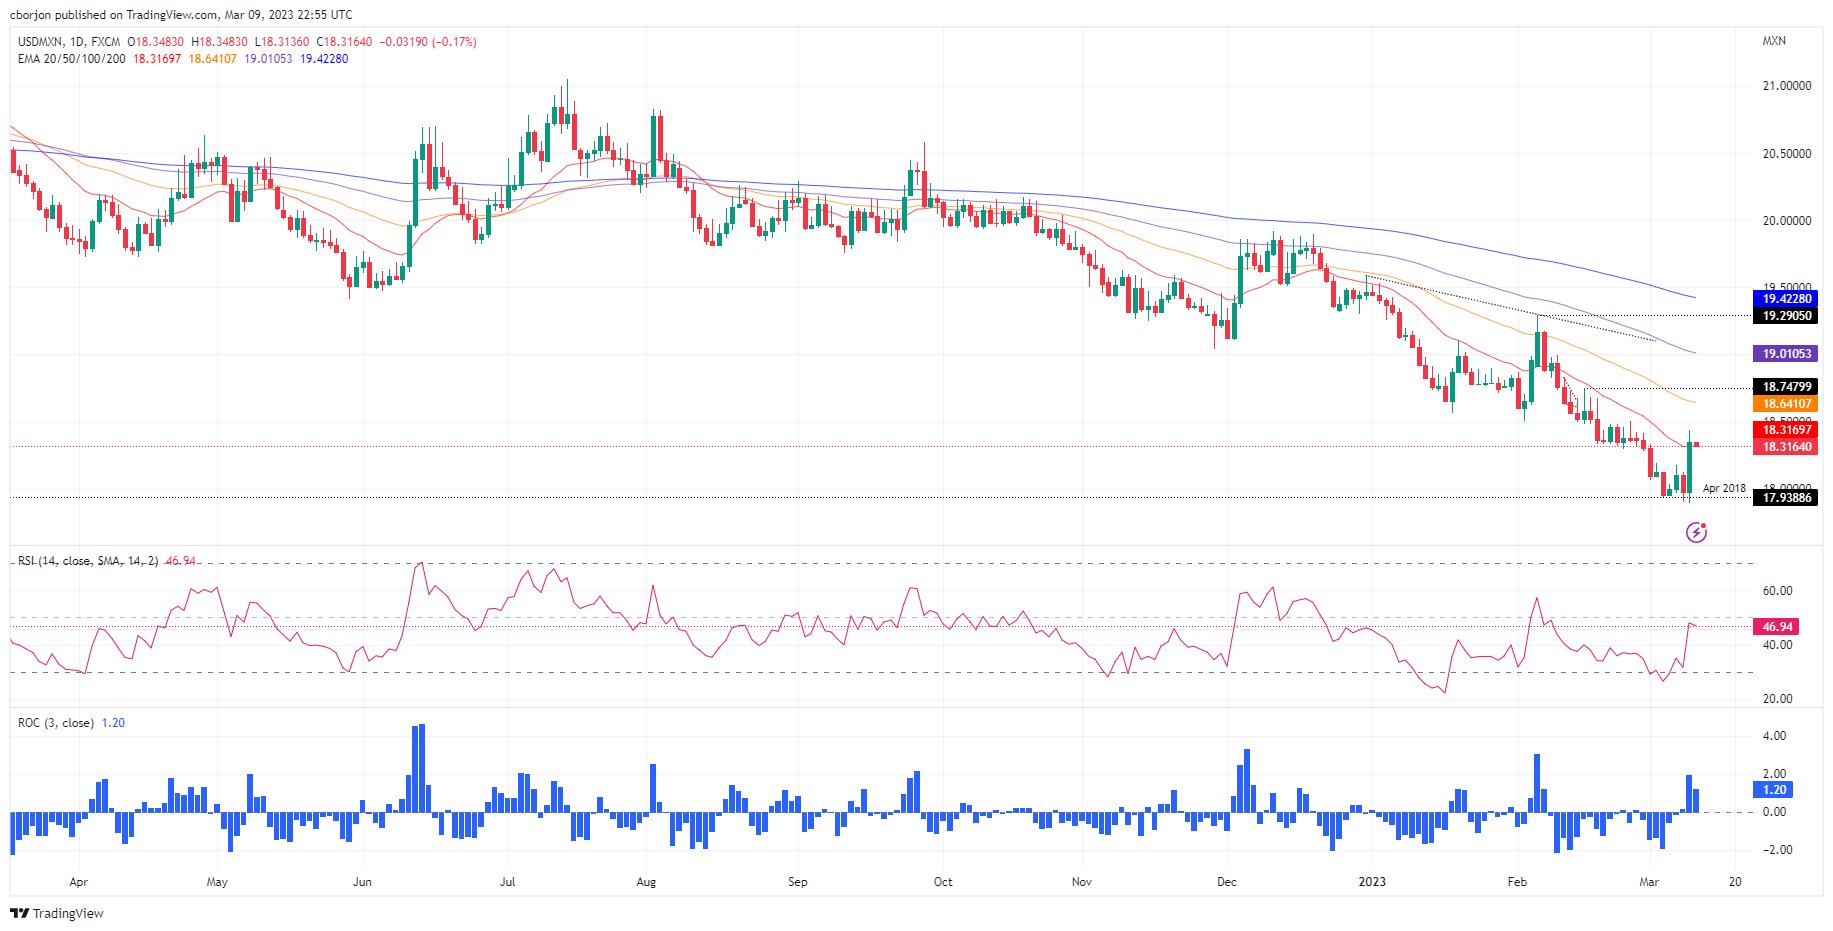
The USD/MXN stages a recovery after trading below the $18.00 barrier during the last few days. Earlier in the day, I wrote, “Nevertheless, USD/MXN bulls are far ahead of declaring victory. They must reclaim the weekly high at 18.1788, followed by the 20-day Exponential Moving Average (EMA) at 18.2898.” Later in the session, USD/MXN bulls reclaimed those levels as the exchange rate rests comfortably above the 20-day EMA. Additionally, Thursday’s close for the USD/MXN was 18.3483, which has opened the door for further upside.
That said, the USD/MXN first resistance would be the new weekly high of 18.4391. A breach of the latter will expose the $18.50 barrier, closely followed by the 50-day EMA at 18.6410 and the 100-day EMA at 19.0105.
On the flip side, the USD/MXN first support would e the 20-day EMA at 18.3169. Once cleared, and the USD/MXN pair will dive towards the March 7 high turned support at 18.1788, followed by the $18.00 psychological level.
USD/MXN Daily chart
USD/MXN Technical levels
- USD/CAD pares the biggest weekly gains since late September, snaps four-day uptrend with mild losses.
- BoC’s Rogers terms the latest rate hike pause as conditional but failed to impress Loonie buyers amid downbeat Oil price.
- WTI remains sidelined around a fortnight low after declining in the last three consecutive days.
- US NFP, Canada Employment Change for February will be crucial amid BoC vs. Fed tussle.
USD/CAD dribbles around 1.3830-20 as bulls catch a break around the highest levels since late October 2022 after a four-day uptrend. In doing so, the Loonie pair portrays the market’s anxiety ahead of the key employment data from the US and Canada while also justifying a pause in the WTI crude oil’s fall, due to Ottawa’s reliance on Oil as the key export item.
The Loonie pair rose in the last four consecutive days as the monetary policy divergence between the Bank of Canada (BoC) and the Federal Reserve (Fed) joins downbeat Oil price. Adding strength to the pair’s upside momentum could be the broad US Dollar strength, ignoring the latest retreat, during the uncertain times.
On Thursday, Bank of Canada Senior Deputy Governor Carolyn Rogers signaled that the Canadian central bank’s latest pause in the interest rate hikes is a conditional one. The policymaker added, “If economic developments unfold as we projected and inflation comes down as quickly as we forecast in the January Monetary Policy Report (MPR), then we shouldn’t need to raise rates further. But if evidence accumulates suggesting inflation may not decline in line with our forecast, we’re prepared to do more.”
Elsewhere, mixed employment clues from the US probed the US Dollar bulls ahead of the key jobs report. That said, US Initial Jobless Claims marked the biggest jump since January by rising to 211K for the week ended on March 03 versus 195K expected and 190K prior. Additionally, the Challenger Job Cuts were down and the Continuing Jobless Claims were up.
It should be noted that fears emanating from softer China inflation data and US President Joe Biden’s proposed tax hike exert downside pressure on the market sentiment and the Oil price. With this, the WTI crude oil dropped to a two-week low during the three-day losing streak, before making rounds to $75.70.
Amid these plays, Wall Street benchmarks closed with more than 1.5% daily losses each but the US 10-year and two-year Treasury bond yields eased to 3.92% and 4.87% versus 5.08% and 4.01% daily open respectively. Though, the US Dollar Index (DXY) pared some of the daily losses by the end of Thursday but failed to ignore the biggest daily fall in a week.
To sum up, the USD/CAD pair appears indecisive but the bears are likely firming their grips with hopes of witnessing negative surprises from the US data. However, market consensus for the Canadian jobs report for February also appears less optimistic and hence the Loonie pair traders should remain cautious ahead of the all-important releases.
Also read: Nonfarm Payrolls Preview: Five scenarios for the Fed, USD and stocks reactions, with probabilities
Technical analysis
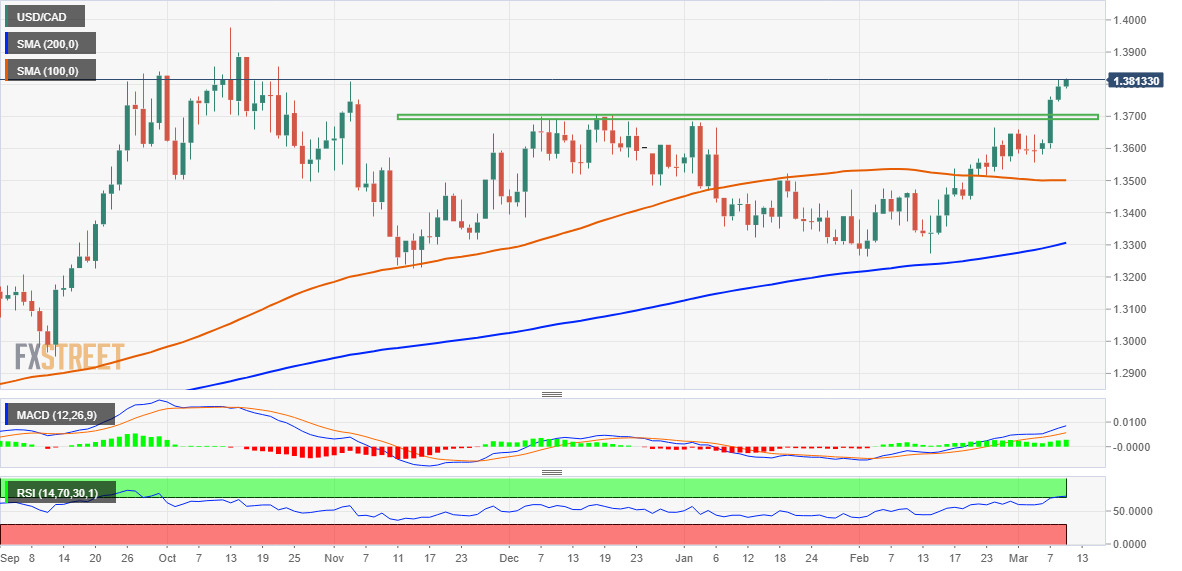
A daily closing beyond the 1.3800 hurdle, encompassing multiple levels marked during late September-October 2022, keeps the USD/CAD buyers hopeful of challenging the previous yearly top surrounding .3980.
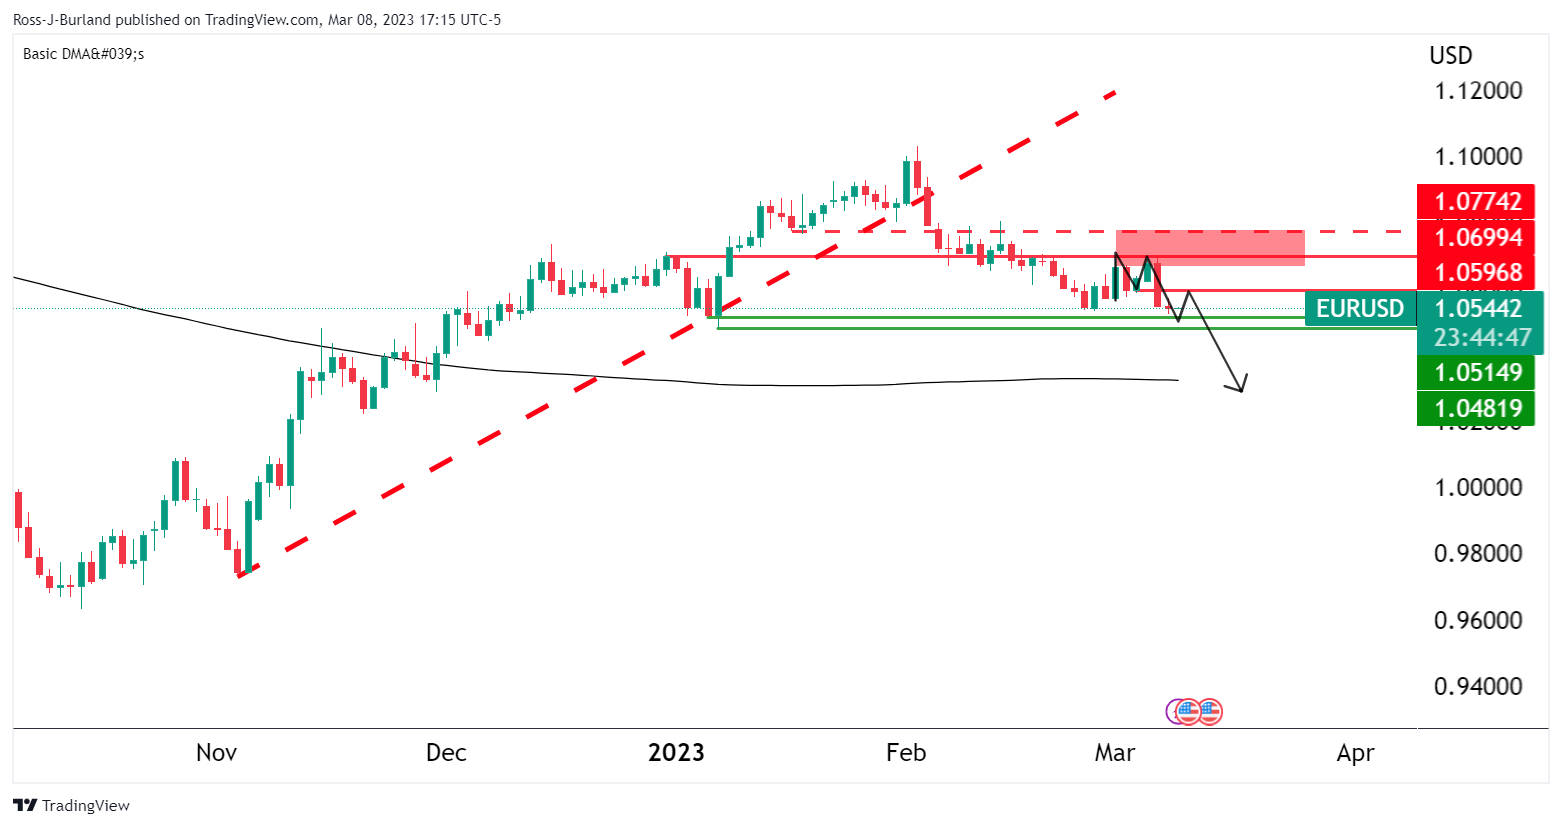
- EUR/USD is facing selling pressure in extending its recovery above the supply zone placed in a range of 1.0577-1.0589.
- An absence of strength in the recovery move from EUR/USD has kept the room open for bears.
- The RSI (14) is struggling to sustain in the bullish range of 60.00-80.00.
The EUR/USD pair has scaled above 1.0580 in the early Tokyo session despite a lack of strength in the recovery move. It seems that investors are putting less focus on building positions as the release of the United States Nonfarm payrolls (NFP) (Feb) data will provide more clarity on further guidance.
According to the estimates, the United States economy has added fresh 205K jobs, lower than the mega addition of 514K payrolls in January. The Unemployment Rate is expected to remain steady at 3.4%. The catalyst that might grab major attention is the Average Hourly Earnings data. Firms are offering higher payouts to hire fresh talent amid an extreme shortage of labor. And higher payouts are forcing households to stretch their spending, which is ultimately fueling the US Consumer Price Index (CPI). The economic data is seen higher at 4.7% vs. the former release of 4.4%.
The US Dollar Index (DXY) is oscillating above 105.20 after a gradual correction. A release of an upbeat US NFP gamut might strengthen US Dollar bulls further.
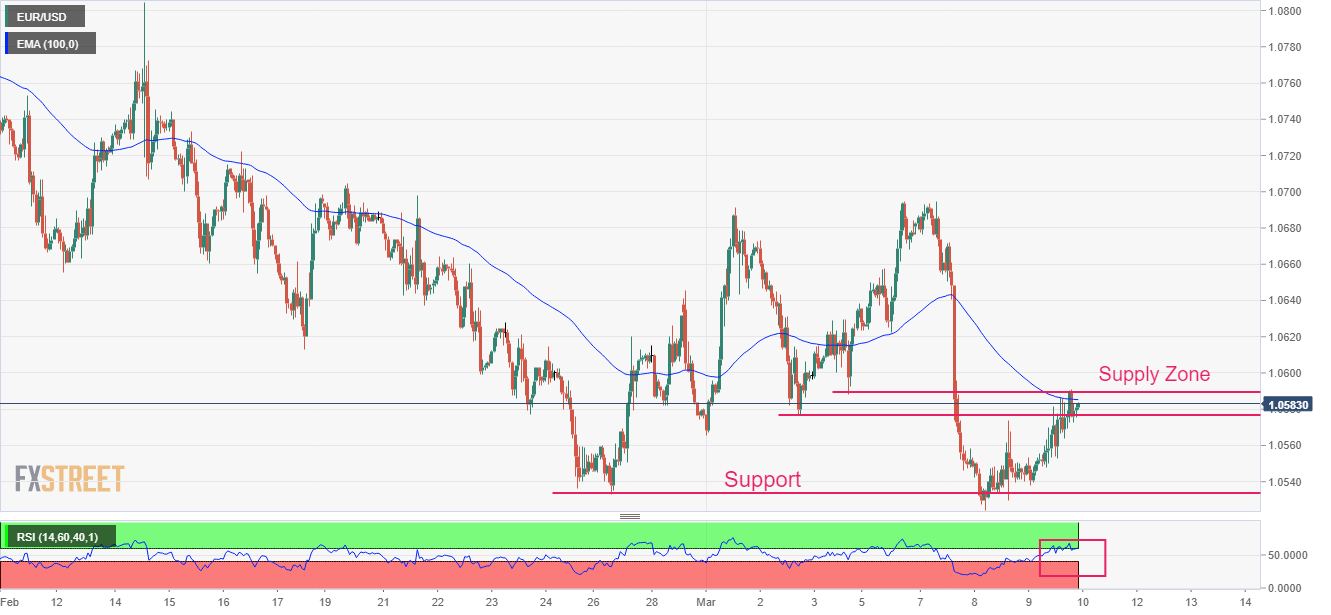
EUR/USD is facing selling pressure in extending its recovery above the supply zone in a range of 1.0577-1.0589 on an hourly scale. The 100-period Exponential Moving Average (EMA) at 1.0585 also acts as a barricade for the Euro.
Meanwhile, the Relative Strength Index (RSI) (14) is struggling to sustain in the bullish range of 60.00-80.00. An absence of strength in the RSI (14) could result in exhaustion in the uptrend.
A break below March 01 low at 1.0565 might drag the major currency pair toward March 08 low at 1.0524. A slippage below the same will drag the asset further toward the psychological support at 1.0500.
On the flip side, a decisive move above the round-level resistance at 1.0600 will drive the asset toward February 28 high at 1.0645. A breach above the latter will expose the asset to March 01 high at 1.0691.
EUR/USD hourly chart
- GBP/USD seesaws within a choppy range after two-day rebound from the lowest levels since late November 2022.
- Hopes of no recession in the UK, upbeat efforts to lure more stock market listings help Cable buyer.
- Mixed US data, pullback in yields weigh on US Dollar ahead of the key US jobs report.
- UK’s monthly GDP for January will be crucial to watch amid economic slowdown chatters but US NFP is the key.
GBP/USD makes rounds to 1.1930-20 during early Friday morning in Asia as bulls take a breather after the biggest daily jump in more than a week ahead of the key statistics from the UK and the US.
That said, the risk-off mood failed to extend the US Dollar’s run-up on Thursday amid US data, which in turn joined a retreat in the key US Treasury bond yields to weigh on the greenback. While portraying the mood, Wall Street benchmarks closed with more than 1.5% daily losses each but the US 10-year and two-year Treasury bond yields eased to 3.92% and 4.87% versus 5.08% and 4.01% daily open respectively. It should be noted that the US Dollar Index (DXY) managed to pare some of the daily losses by the end of Thursday but failed to ignore the biggest daily fall in a week.
At home, hopes of economic recovery and more stock market listings seem to help the Cable pair amid a light calendar during the week.
“The country's economy is on track to shrink less than expected this year and avoid the two quarters of negative growth which mark a technical recession,” the British Chambers of Commerce (BCC) forecast on Wednesday per Reuters.
Britain’s finance ministry said on Wednesday it will launch a review into how investor research on companies could be improved to attract more listings, a step that follows a decision by UK chip designer Arm Ltd to only list in New York, reported Reuters.
On the same line, Britain's revamped financial market rules will largely be aligned with U.S. and European Union regulations to minimise disruption to global companies, its financial services minister Andrew Griffith said on Thursday per Reuters.
It’s worth observing, however, that BoE policy maker Swati Dhingra warned against interest rate hikes on Wednesday while saying that overtightening poses a more material risk at this point. On the contrary, Fed Chairman Jerome Powell keeps his hawkish bias intact.
Technical analysis
GBP/USD managed to regain its place above the 200-DMA level of 1.1900, after a two-day absence, which in turn keeps buyers hopeful.
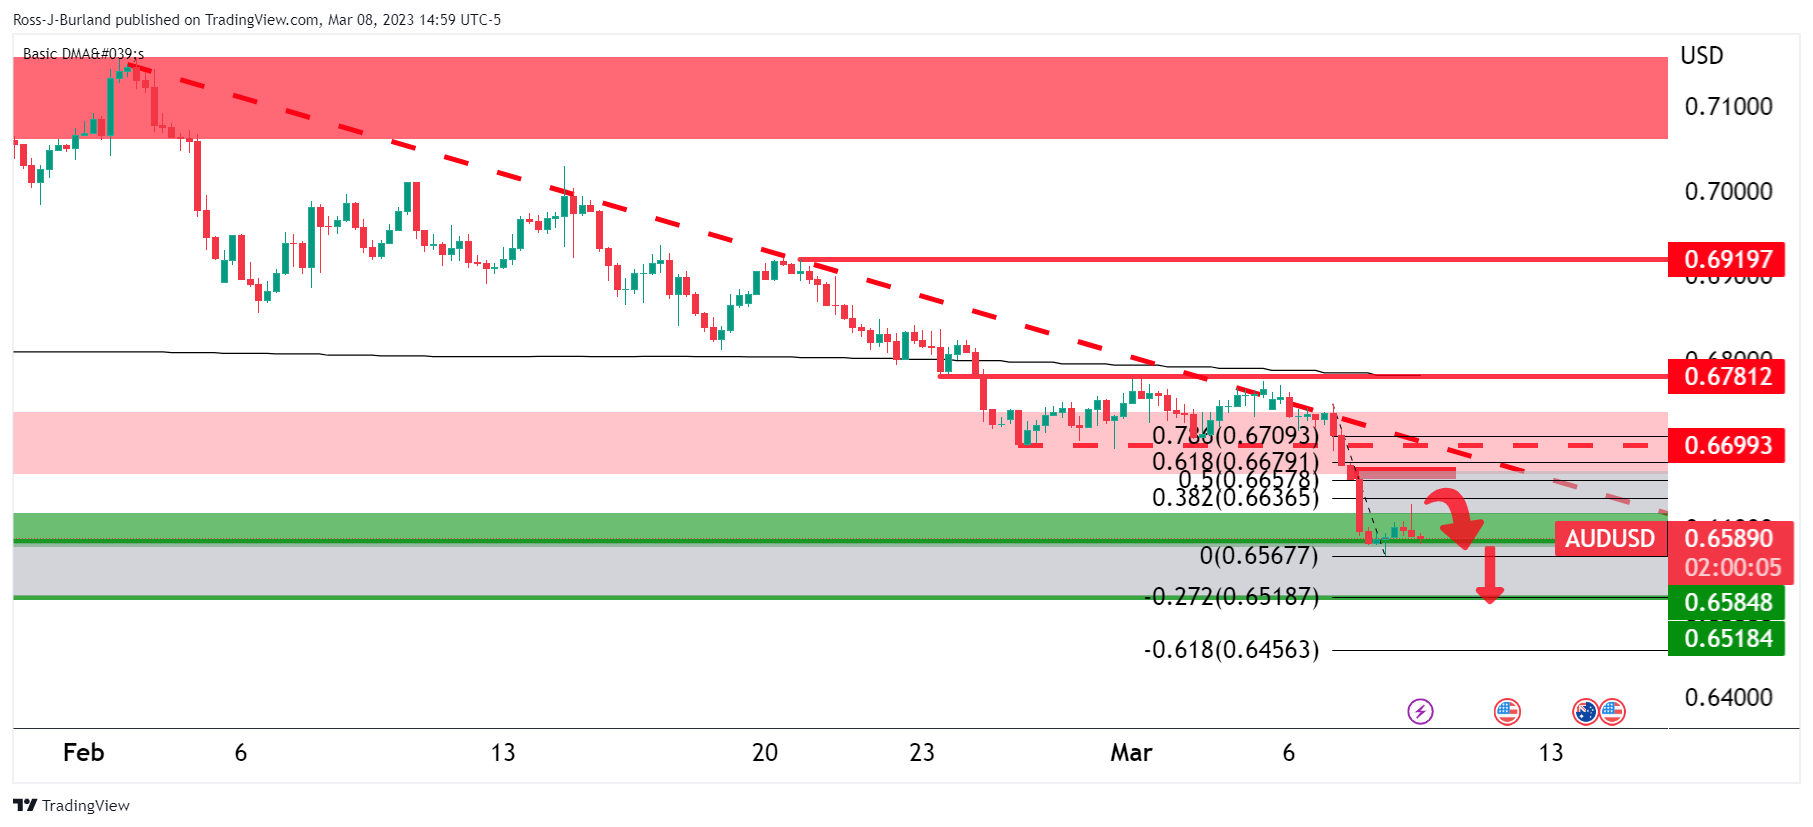
- AUD/USD fails to recover from four-month trough, holds lower ground of late.
- Global markets remained vulnerable on mixed US data amid cautious mood ahead of NFP.
- Downbeat China inflation, US President Biden’s budget proposal also strengthens risk-off mood.
- Equities drop but a retreat in yields weigh on US Dollar despite sour sentiment.
AUD/USD justifies its risk-barometer status while revisiting the sub-0.6600 area early Friday, after a failed attempt to recover from the four-month low. In doing so, the Aussie pair traces the downbeat equities and fears emanating from China, as well as failing to cheer the retreat in the US Treasury bond yield and the US Dollar, amid the market’s cautious mood ahead of the all-important US employment data.
Wall Street benchmarks closed with more than 1.5% daily losses each but the US 10-year and two-year Treasury bond yields eased to 3.92% and 4.87% versus 5.08% and 4.01% daily open respectively. It should be noted that the US Dollar Index (DXY) managed to pare some of the daily losses by the end of Thursday but failed to ignore the biggest daily fall in a week.
While tracing the key catalysts mixed employment clues from the US gain major attention. That said, US Initial Jobless Claims marked the biggest jump since January by rising to 211K for the week ended on March 03 versus 195K expected and 190K prior. Additionally, the Challenger Job Cuts were down and the Continuing Jobless Claims were up.
Elsewhere, disappointment from China’s monthly Consumer Price Index (CPI) and Producer Price Index (PPI) data for February also dims the prospects of recovery in the world’s second-largest economy and weighs on the risk profile. On the same line could be the fears of higher taxes in the world’s biggest economy, the US, as well as the political chaos relating to it as US President Joe Biden proposes raising corporation tax from 21% to 28% in his latest budget guide ahead of Friday’s release.
Above all, hawkish comments from Fed Chair Jerome Powell join dovish rhetoric from Reserve Bank of Australia (RBA) Governor Philip Lowe to keep the AUD/USD bears hopeful as traders await the key US Nonfarm Payrolls, expected 205K versus 517K prior.
Given the mixed early clues and the strong prints in the last, fewer odds favor the positive surprise from the US jobs report and hence the AUD/USD pair may witness a corrective bounce. The hopes of recovery also take clues from the quote’s repeated failure to drop below 0.6550.
Technical analysis
AUD/USD dribbles inside a 100-pip trading range between 0.6640 and 0.6540 comprising levels marked during late October and November 2022.
- Silver remains firm at around $20.00 a troy ounce, ahead of essential US data.
- XAG/USD Price Analysis: Despite consolidating around $20.00, the bias is still downwards.
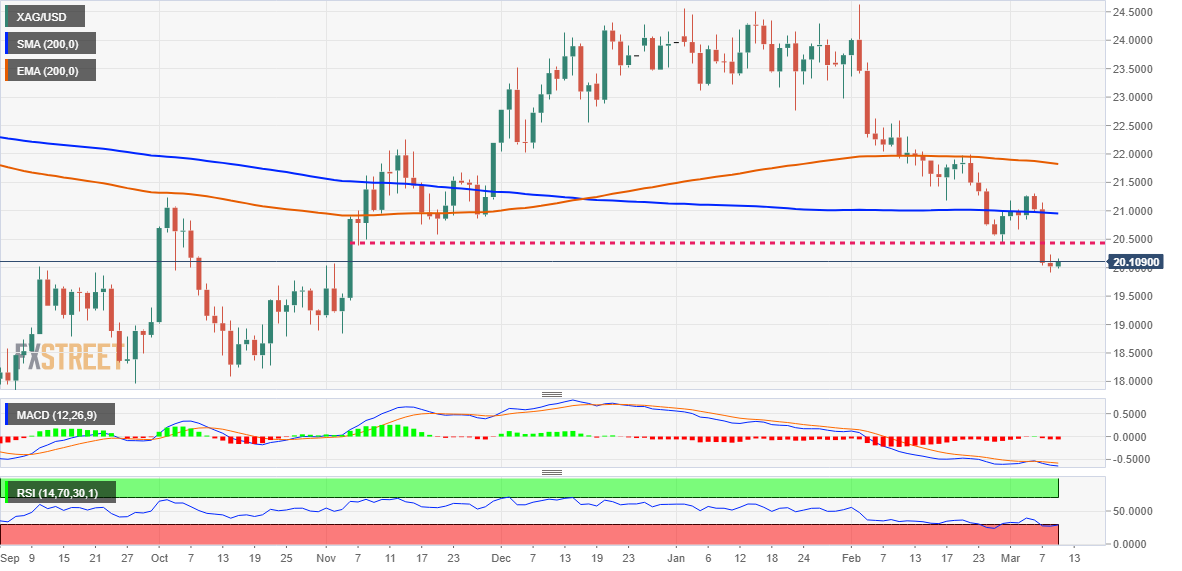
Silver price continues to trade sideways on Thursday, amidst the lack of a catalyst, ahead of the release of crucial US economic data. The US Nonfarm Payrolls report for February looming keeps investors risk averse, as shown by US equities and emerging market currencies, with the Mexican Peso (MXN) weakening. At the time of writing, the XAG/USD is trading at $20.05, up 0.19%.
XAG/USD Price action
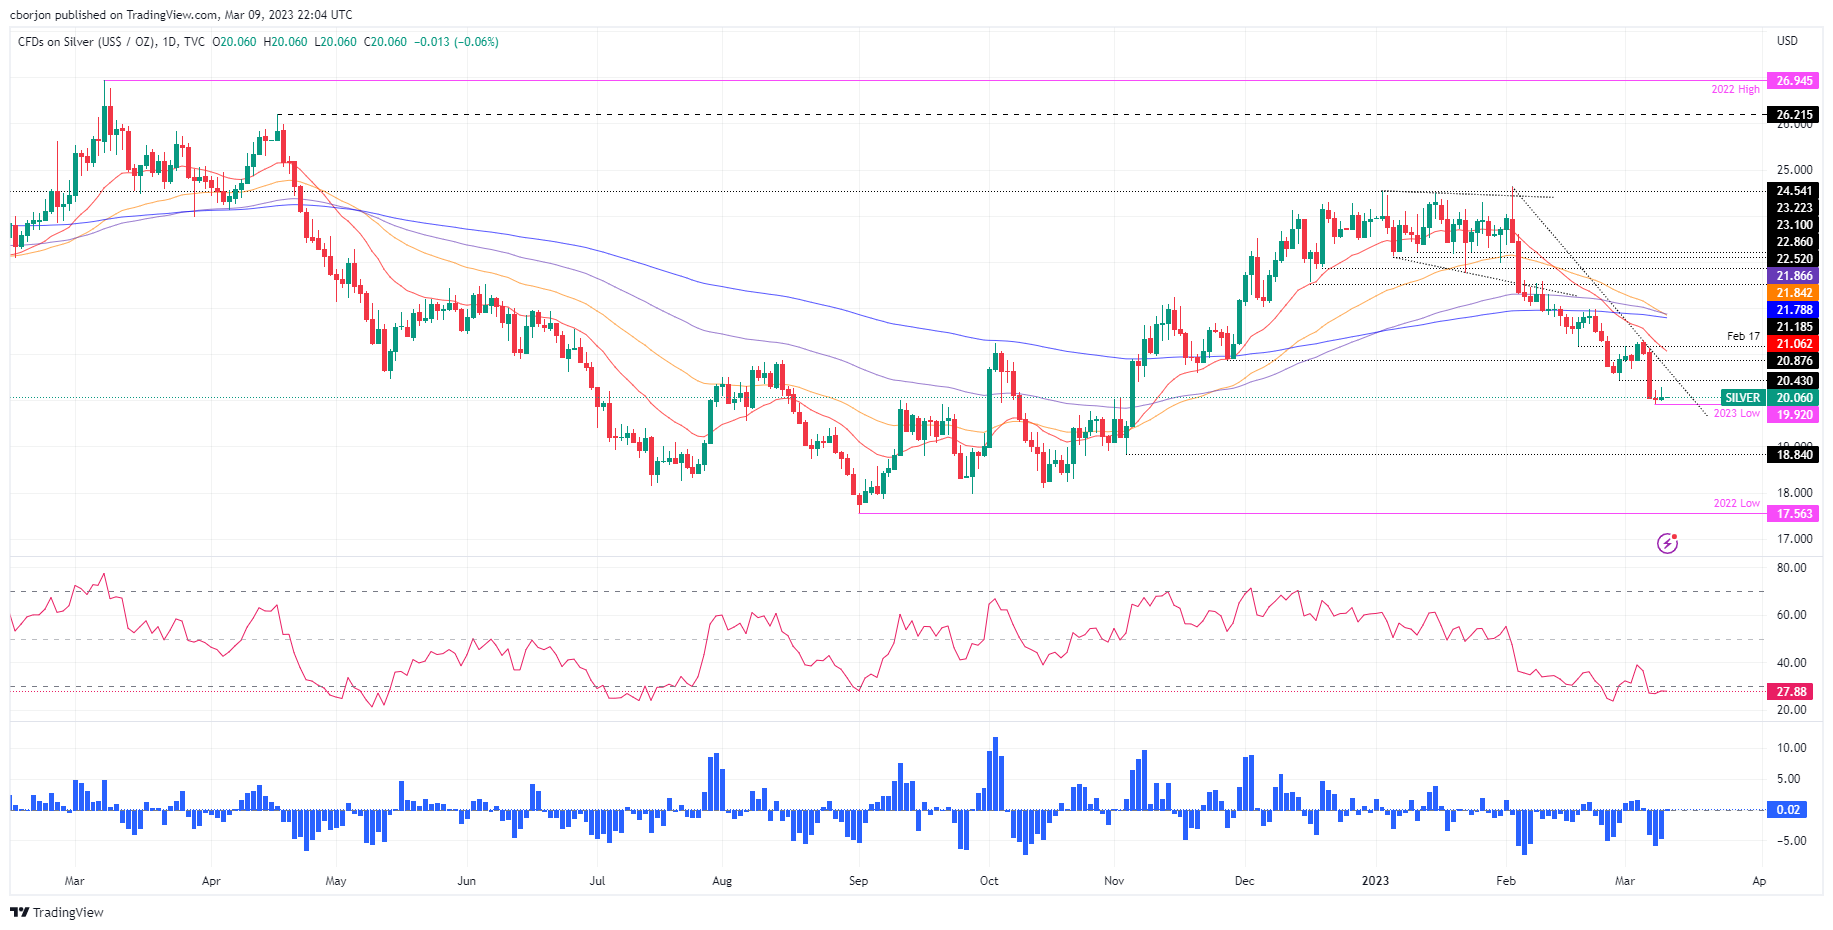
XAG/USD remained firm during the day, unable to crack the top/bottom of the $19.98-$20.28 range. Nevertheless, traders should know Silver stumbled below the 200-day Exponential Moving Average (EMA) at $21.80, so the white metal is downward biased. Notable, the 50-day EMA is closing to the 200-day EMA, and once it crosses below the latter, a death cross would exacerbate a fall toward the November 3 daily low at $18.84.
But firstly, XAG/USD needs to clear the YTD low at $19.92. A breach of the latter will expose the $19.00 psychological level, followed by the November 3 daily low at $18.84.
As an alternate scenario, the XAG/USD first resistance would be the daily high of $20.06. Once cleared, the next resistance level would be the February 28 daily low-turned resistance at $20.43, followed by the November 28 daily low-turned resistance at $20.87.
XAG/USD Daily chart
XAG/USD Technical levels
- USD/JPY is expected to witness more losses below 136.00 as investors have ignored Fed’s bigger rate hike fears.
- The proposal of higher taxes by US Biden has spooked the interest of investors towards US equities.
- An unchanged monetary policy is expected from BoJ Kuroda.
The USD/JPY pair is delivering a sideways performance above 136.00 in the early Asian session. The asset looks vulnerable above 136.00 and is expected to deliver a break below the same as investors have shrugged-off fears associated with expectations of bigger rates from the Federal Reserve (Fed).
Thursday’s Initial Jobless Claims data reported an 11% jump in the number of candidates claiming for the very first time. This was the highest jump in the past five months, which conveyed that the United States labor market is not tight enough as it appears to the market participants. The street believes that a mega jump in initial claims was the outcome of the mid-winter school break in New York. So it is a one-time blip and can be ignored.
The US Dollar Index (DXY) is juggling above 105.25 after a gradual correction from Wednesday’s high at 105.86. S&P500 futures witnessed an intense sell-off on Thursday as investors got distressed by high taxes proposed by US President Joe Biden on billionaires and rich investors. Citing the Budget as a blue-collar blueprint, more taxes on riches will be utilized for medical claims of retired individuals.
Squeezing fears for Fed’s blunt statement on using higher rates to bring down inflation also supported the demand for US government bonds. The alpha generated on 10-year US Treasury bonds dropped firmly to near 3.90%.
On the Japanese Yen front, investors are awaiting the interest rate decision by the Bank of Japan (BoJ) for fresh impetus. Analysts at TD Securities are of the view that “It is unlikely that the BoJ will rock the boat at this meeting even as CPI inflation hit a 41-year high. Governor Kuroda at his last meeting will likely keep policy unchanged, with further changes having to wait for incoming governor Ueda starting in April. We think the BoJ could shift the top end of the YCC band again in the months ahead, potentially as early as April.”
- Gold price bulls are moving in to test a 38.2% Fibonacci retracement.
- Gold price bears are lurking and eye a break of $1,804 to then test the 200 DMA.
- All eyes are on the Nonfarm Payrolls event and next week's US Consumer Price Index.
Gold price is up some 0.9% and has traveled from a low of $1,812.02 and moved higher sharply to test $1,835.64 as the US Dollar shed some more points in the DXY index, moving from a three-month high set earlier in the week.
A risk on appetite came about in early trade on Wall Street which benefitted the Gold price as United States of America economic data has proven that there are signs of cracks in a tight US jobs market. This occurred a day before Friday's US Nonfarm Payrolls event and is in contrast to how the markets were starting to position following Federal Reserve's Chair Jerome Powell's hawkish rhetoric to Congress earlier in the week. However, US stocks have come undone buyt the Gold price remains bid nevertheless.
US Jobless Claims moved higher by 11% last week. This was the largest increase in five months. At the same time, planned layoffs for February quadrupled year-on-year. This data might be indicating that the Federal Reserve's hiking cycle has been playing out as intended and negates the need to hike aggressively. Consequently, the Gold price shot higher with US Treasury yields easing which is a bullish sign for Gold price since the metal offers no interest. The US 10-year note was last seen paying 3.927%, down from the highs of 4.019%.
The rise in the Gold price comes following another red day for the US Dollar index, DXY, which is losing around 0.33% at the time of writing after falling from a high of 105.729 and after making a low for the day of 105.153. The US Dollar surged earlier in the week following hawkish Congressional testimony by Federal Reserve chair Jerome Powell. Fed's Powell explained to lawmakers that the central bank will raise rates higher and faster after a series of strong economic reports showed the economy continues to run hot. Consequently, market expectations for a 50 basis point rate hike from the Federal Reserve shot higher.
As noted by analysts at Brown Brothers Harriman, WIRP now suggests nearly 70% odds of a 50 bp hike at the March 21-22 Federal Open Market Committee meeting:
''Looking ahead, 25 bp hikes in May and June are priced in that would take Fed Funds to 5.50-5.75%, with over 30% odds of a last 25 bp hike in Q3 that would move the range up to 5.75-6.0%.''
''After all this repricing, an easing cycle is still expected to begin in the fourth quarter, albeit at much lower odds. Eventually, it should be totally and unequivocally priced out into 2024 during the next stage of Fed repricing,'' the analysts added and said, ''for now, we believe the uptrends in US yields and the US Dollar remain intact.''
US Nonfarm Payrolls and US Consumer Price Index headwinds
As for the Nonfarm Payrolls, this event will be part of a duo that is going to be instrumental in guiding market expectations regarding the policy guidance likely to be offered by the FOMC at the March meeting.
''We look for payroll gains to mean-revert to 230k in February following the gangbuster report that saw job creation surge to 517k in January,'' analysts at TD Securities said. ''We also expect the Unemployment Rate to remain unchanged at a historically low level; while average hourly earnings likely accelerated to a 0.4% m/m gain, lifting the YoY measure to a still-elevated 4.8%.'' The analysts added, ''we think the hurdle is rather high to see USD weakness prevail; data would have to materially surprise to the downside.''
We then have the US Consumer Price Index next week and analysts see this increase by 0.4% MoM and headline CPI to rise by 0.5% in February.
''Price pressures were intense and broad-based in January, more so than in previous months. A potential sign that inflation pressures are intensifying again,'' analysts at ANZ Bank said. ''Annual revisions to the CPI seasonal factors by the BLS show inflation over the course of H2 2022 did not ease as much as initially reported. This means the Fed is facing a more persistent sticky inflation battle than it thought earlier this year,'' the analysts argued.
''Recent activity and inflation data portray a resilient economy suggesting the Fed still has more work to do to slow demand, particularly in the labor market. We expect there will be upward revisions to the terminal fed funds rate (FFR) forecast at the March FOMC meeting,'' the analysts at ANZ added leaving scope for a headwind for the Gold price bugs for the imminent future.
Gold price technical analysis
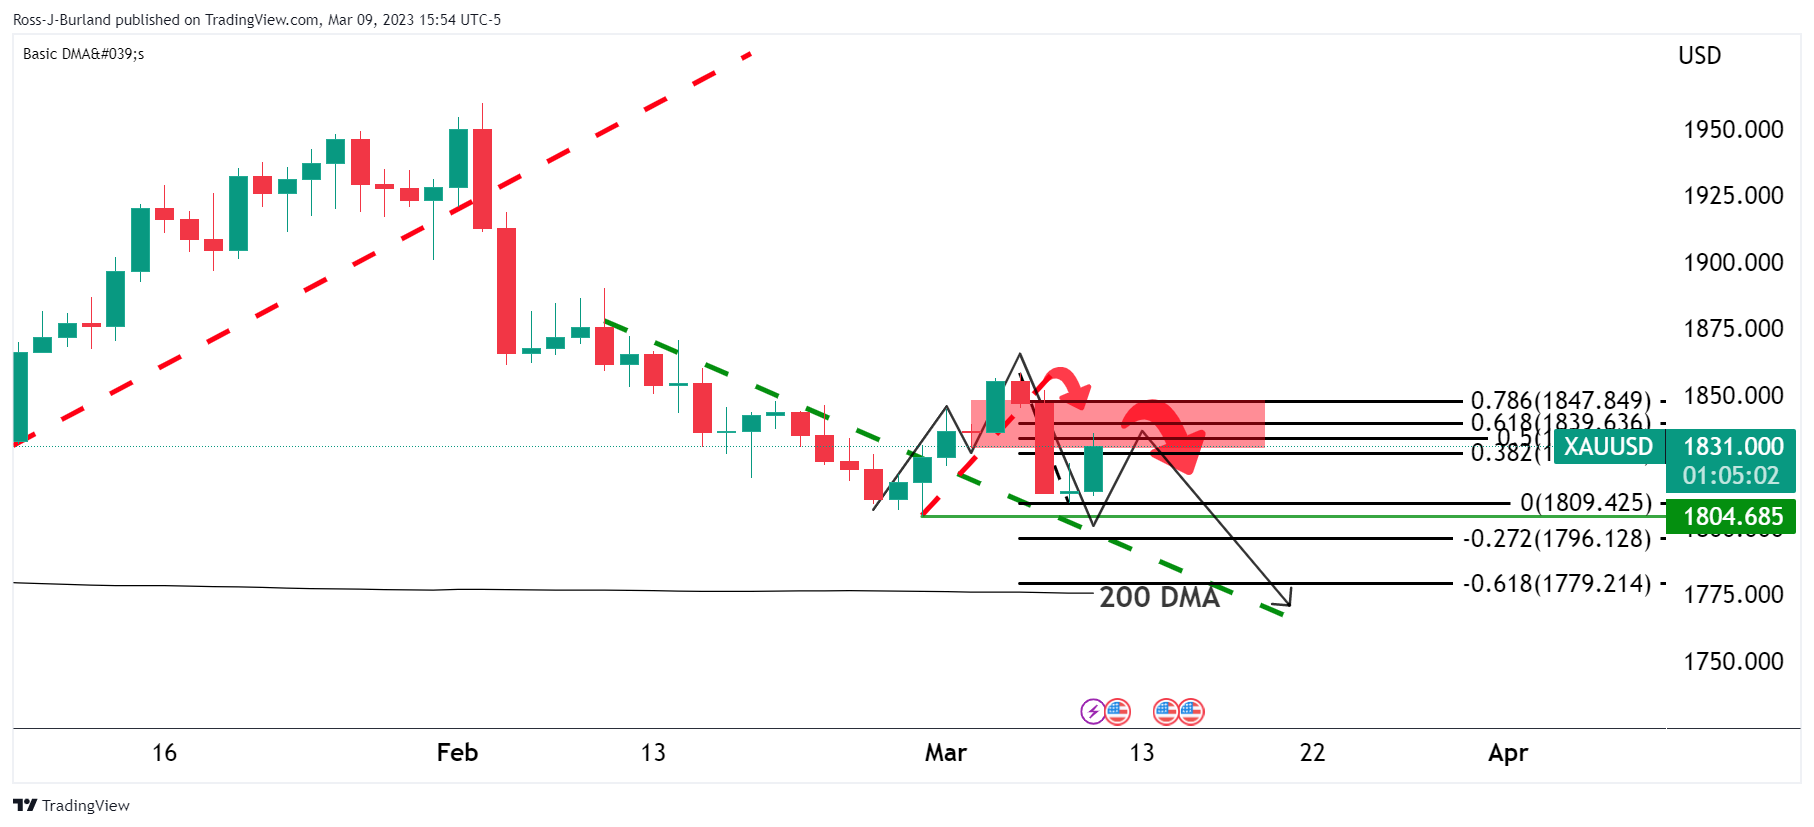
Gold price crossed back above the $1,825 mark in the pursuit of the neckline of M-formation's neckline. We have Gold price support at $1,804 and resistance above $1,850 with territories between the move into the 38.2% and 78.6% Fibonacci scale open to a test. Should the bears commit, then there will be prospects of a move to test the Gold price 200 DMA in the coming days with the $1,1770s eyed in that regard.
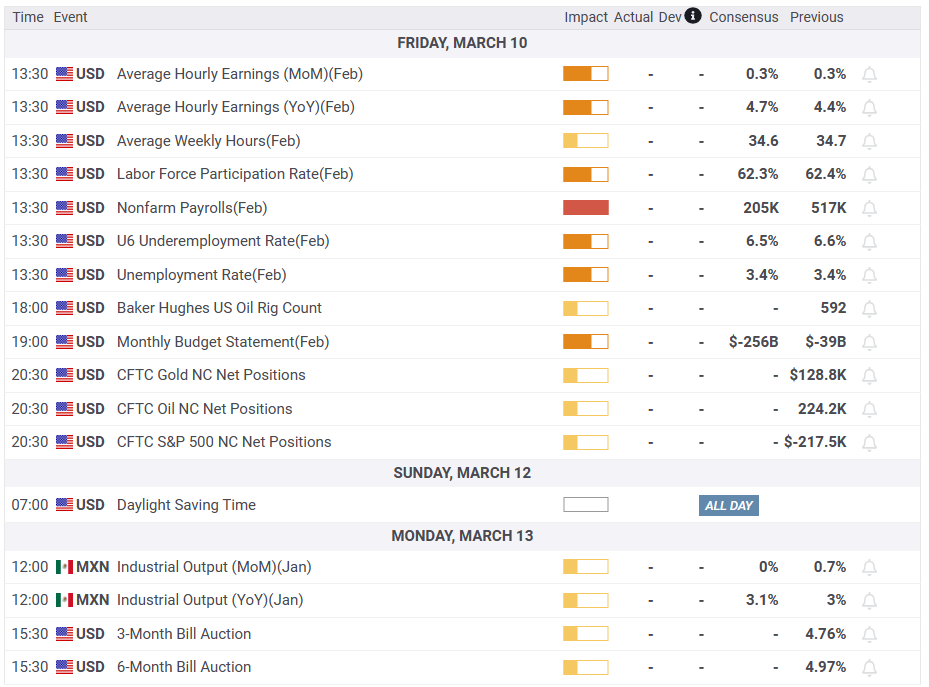
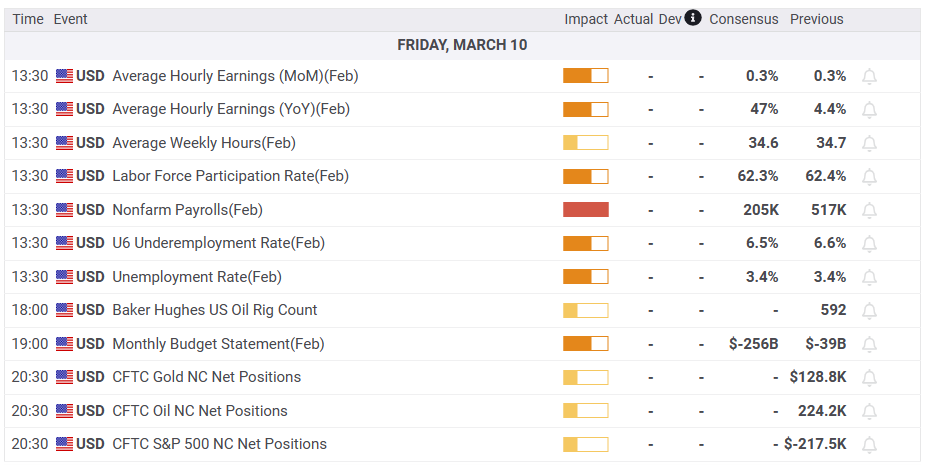
Here is what you need to know on Friday, March 10:
US stocks dropped sharply on Thursday and US Treasuries rose ahead of Friday’s Nonfarm Payrolls report. Initial Jobless Claims unexpectedly climbed to the highest level in ten weeks, taking some bets for a 50 basis points Fed rate hike off the table.
US yields moved further to the downside during the American session. The US 2-year yield fell to 4.95% and the 10-year to 3.92%. The slide in yields weighed on the US Dollar. The DXY pulled back for the second day in a row, falling to 105.20. The retreat of the Greenback is still a correction from Tuesday’s rally, which was boosted by Federal Reserve Chair Powell's hawkish remarks.
US February Nonfarm Payrolls Preview: Analyzing Gold price's reaction to NFP surprises
The US employment report will be released on Friday, with traders seemingly on the sidelines ahead of payrolls. The numbers could be critical for Fed rate expectations as the odds of a 50 basis points rate hike jumped during the current week.
EUR/USD rose for the second day but was unable to retake 1.0600. Voices against the guidance of “significant rate hikes ahead” emerged at the European Central Bank (ECB), with Bank of Italy Governor Ignazio Vizco criticizing his colleagues. GBP/USD had the best day of the week so far, peaking at 1.1937, the highest in two days. EUR/GBP pulled back below 0.8900.
The Bank of Japan will announce its monetary policy decision (no change expected) at Governor Kuroda’s last policy meeting. His term expires on April 8, after a ten-year tenure. Japan’s Lower House of Parliament approved Kazuo Ueda to become the next governor and two deputy governors (Ryozo Himino and Shinichi Uchida). The Upper House will vote on the nominees Friday. USD/JPY lost more than a hundred pips on Thursday, going all the way back to 136.00.
The US Dollar posted mixed results awaiting key data. Commodity and emerging market currencies were hit late on Thursday as Wall Street plunged. USD/MXN rebounded 2.5% from fresh multi-year lows.
AUD/USD and NZD/USD turned negative hit by risk aversion, falling to 0.6580 and 0.6100, respectively. The weak Canadian Dollar extended losses; USD/CAD rose for the fourth consecutive day, reaching the highest level since mid-October, above 1.3830.
Gold climbed above $1,830/oz, boosted by lower yields and unaffected by the risk-off tone. Silver failed to hold to gains and pulled back to $20.00. Bitcoin broke below $21,000 to the lowest since January 20. Crude oil prices fell by more than 1%.
Like this article? Help us with some feedback by answering this survey:
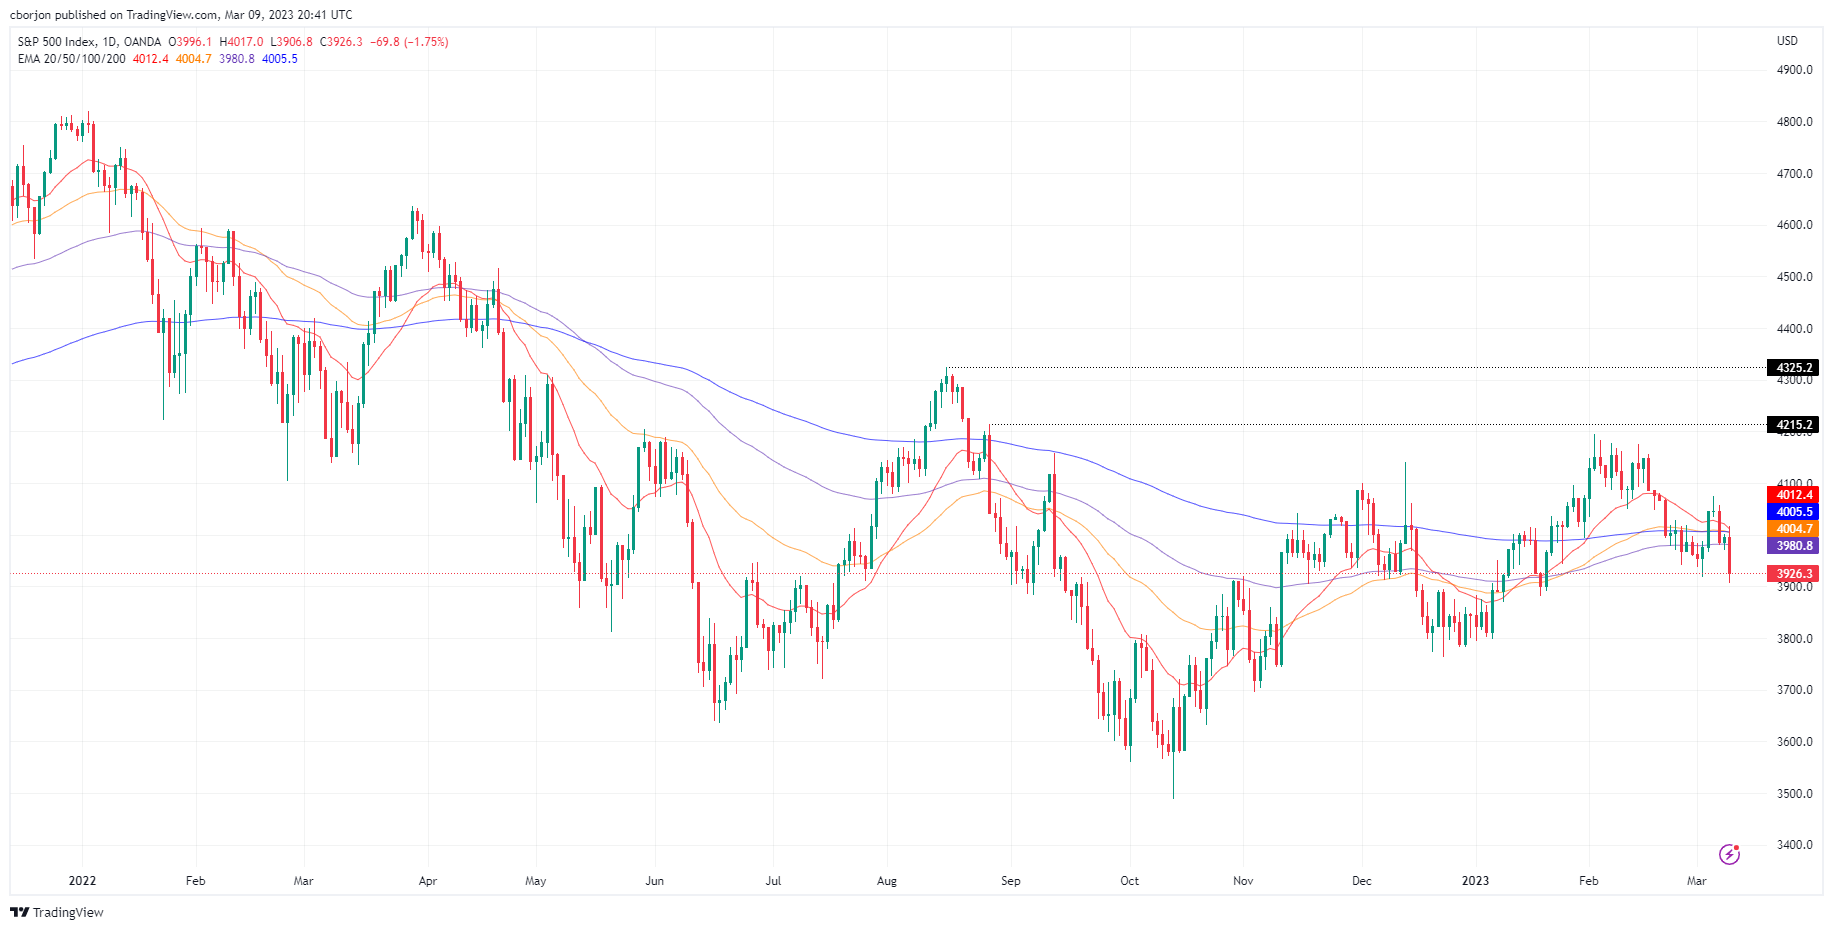
- The S&P 500, the Nasdaq 100, and the Dow Jones dropped as traders prepared for US NFP.
- The latest round of US economic data spurred a hawkish shift in the Federal Reserve.
- US President Joe Biden presented his budget for 2024.
Wall Street maintains a downbeat mode late in the New York session, with US equities registering substantial losses. Sentiment shifted sour, with traders expecting additional labor market data and next week’s inflationary figures as the Federal Reserve (Fed) prepares for the upcoming meeting.
At the time of typing, the S&P 500 is falling 1.43%, at 3,925.50. Following suit is the heavy-tech Nasdaq 100, down 1.58% at 11,390.53, while the Dow Jones drops 1.31%, at 32,367.39.
US equity indices, the US Dollar, and UST bond yields are down, ahead of US NFP
The latest economic data from the United States (US) shifted the US Federal Reserve (Fed), notably the Fed Chair Jerome Powell, more hawkish than expected. February’s 500K plus jobs added to the economy, inflation cooling but above estimates, ISM Manufacturing and Services PMIs improving, and financial conditions loosening sounded the alarms at the Fed.
On Tuesday, Jerome Powell began his two-day testimony before the US Senate and the House of Representatives. Powell said that the Federal Funds Rate (FFR) would peak higher than estimates, and if upcoming data warranted a larger hike, the Fed has the tools to do it. When asked about the March 21-22 meeting, he said, “We have not made any decision,” leaving the door open for a 50 or 25 bps lift.
Powell’s words rattled the financial markets, with the S&P 500 plunging from around 4,056.90 to 3,927.00 for a 3.22% fall. The greenback advanced, as shown by the US Dollar Index, which went up 1.50% and printed a weekly high of 105.883. US Treasury bond yields skyrocketed, with 2s and 10s peaking at 5.084% and 4.019%, respectively. Consequently, the US bond yield curve inverted the most since the 1980s, at over 100 bps. The US 2s-10s yield curve has functioned as a forecast indicator of recessions within a 12-month period.
Thursday’s data in the US economic docket alleviated the tightness of the labor market, with unemployment claims rising above estimates. Traders’ focus is on Friday’s US Nonfarm Payrolls report and next week’s US Consumer Price Index.
An upbeat labor market data and higher inflation could reinforce the Fed’s hawkish shift of late. Otherwise, it could pave the way for 25 bps increases. The CME FedWatch Tool has fully priced in a 25 bps rate increase, and odds for a 50 bps lie at 62.4%.
US President Joe Biden filled his budget for the 2024 fiscal year, which includes a plan to cut $3 trillion from the deficit over the next decade. Some of the highlights are:
- Taxes on wealthy people and large corporations.
- Increase of corporate tax rate to 28%.
- Hiking taxes on oil and gas companies.
Of late, Bitcoin is plummeting 4.52%, at 20,705 a coin, in what appears to be traders squaring off positions ahead of volatile US economic data.
S&P 500 Daily chart
- WTI bears are in the market as the countdown to NFP is underway.
- WTI dropped around 1% on the third day of losses.
West Texas Intermediate is down by some 1% on the day in late Wall Street trade. The black gold fell from a high of $78.01bbls to a low of $75.63 despite a softer US Dollar ahead of Friday's main event for the week in the US Nonfarm Payrolls.
The US Dollar index was last seen down 0.4 points to 105.17 yet oil remains heavily offered. ''Trend signals in WTI crude have been bolstered by Chair Powell's hawkish rhetoric during his Congressional testimony. With downside momentum signals firing on all cylinders, CTAs have bolstered sufficient dry-powder to raise the risk of yet another round of short covering,'' analysts at TD Securities argued. ''This has been typical behavior over the last few months, in line with range-bound price action in energy markets.''
Oil is also pressured this week due to recession worries as the Federal Reserve turned hawkish. A series of data releases have been showing the US economy continues to run hot. However, data released on Thursday took some of the sting out of Fed Chairman Jerome Powell's hawkish tone.
US jobless claims leaped by 11% last week. This was the heaviest move up in five months. Planned layoffs for February quadrupled year-on-year. This data might be indicating that the Federal Reserve's hiking cycle has been playing out as intended and negates the need to hike aggressively. Consequently, all three major US stock indexes were up and the US Dollar has drifted lower in a correction from a three-month high near 105.90 printed at the start of the week.
US Nonfarm Payrolls eyed
Next up, Friday's Nonfarm Payrolls and next week's Consumer Price Index will be instrumental in guiding market expectations regarding the policy guidance likely to be offered by the FOMC at the March meeting.
''We look for payroll gains to mean-revert to 230k in February following the gangbuster report that saw job creation surge to 517k in January,'' analysts at TD Securities said. ''We also expect the Unemployment Rate to remain unchanged at a historically low level; while average hourly earnings likely accelerated to a 0.4% m/m gain, lifting the YoY measure to a still-elevated 4.8%.'' The analysts added, ''we think the hurdle is rather high to see USD weakness prevail; data would have to materially surprise to the downside.''
Bank of Canada Senior Deputy Governor Carolyn Rogers said on Thursday they are looking for more evidence that the current interest rate levels are high enough. In a prepared speech to be delivered at the Manitoba Chambers of Commerce approximately at 18:55 GMT, she talks “about the factors behind high inflation and how we know inflation is falling.”
Key takeaways
“Yesterday, we decided to leave the policy rate at its current level of 4.50%. We also continued our policy of quantitative tightening.”
“It’s a conditional pause, though. If economic developments unfold as we projected and inflation comes down as quickly as we forecast in the January Monetary Policy Report (MPR), then we shouldn’t need to raise rates further. But if evidence accumulates suggesting inflation may not decline in line with our forecast, we’re prepared to do more.”
“We’ll need to see more evidence to fully assess whether monetary policy is restrictive enough to return inflation to 2%. For now, let me unpack recent developments and share some insight into what we discussed and how we’ll be thinking about things going forward.”
“And with inflation still well above our target, we’re still more worried about upside risks.”
“Major economies around the world are highly interconnected—but while we’re always thinking globally, we have to act locally. We must tailor our policy to Canadian circumstances. And monetary policy needs to be forward-looking.”
“We’re watching closely to see how things unfold. And we are committed to getting inflation all the way back to 2% so Canadians can once again count on low, stable and predictable inflation with sustainable economic growth.”
Market reaction
The USD/CAD erased gains during the American session and is approaching the 1.3800 zone. The Canadian Dollar is among the worst G10 performers on Thursday.
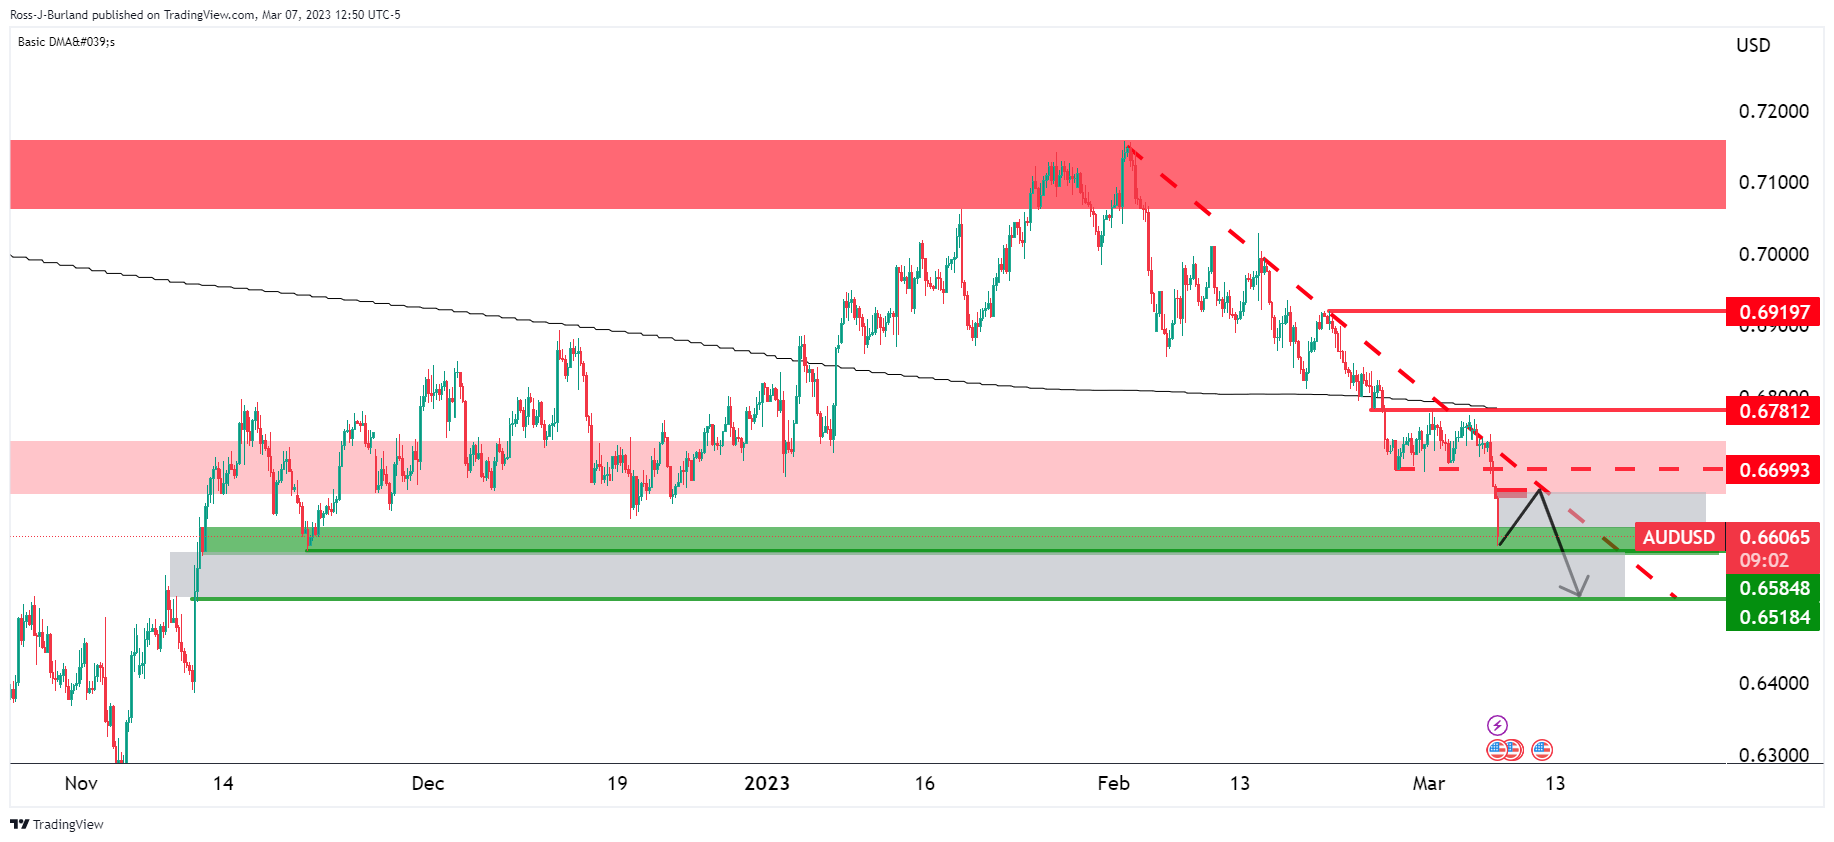
- AUD/USD bears eye a breakout to the downside.
- AUD/USD daily chart's 38.2% Fibonacci is yet to be tested higher up near 0.6650.
As per the prior analysis, AUD/USD Price Analysis: Bears eye a break to 0.6520, and AUD/USD falls heavily as bears move in towards the 0.6580s target area, AUD/USD moved in on the target and is now folding with a bearish bias still ahead of the US Nonfarm Payrolls this Friday.
AUD/USD prior analysis
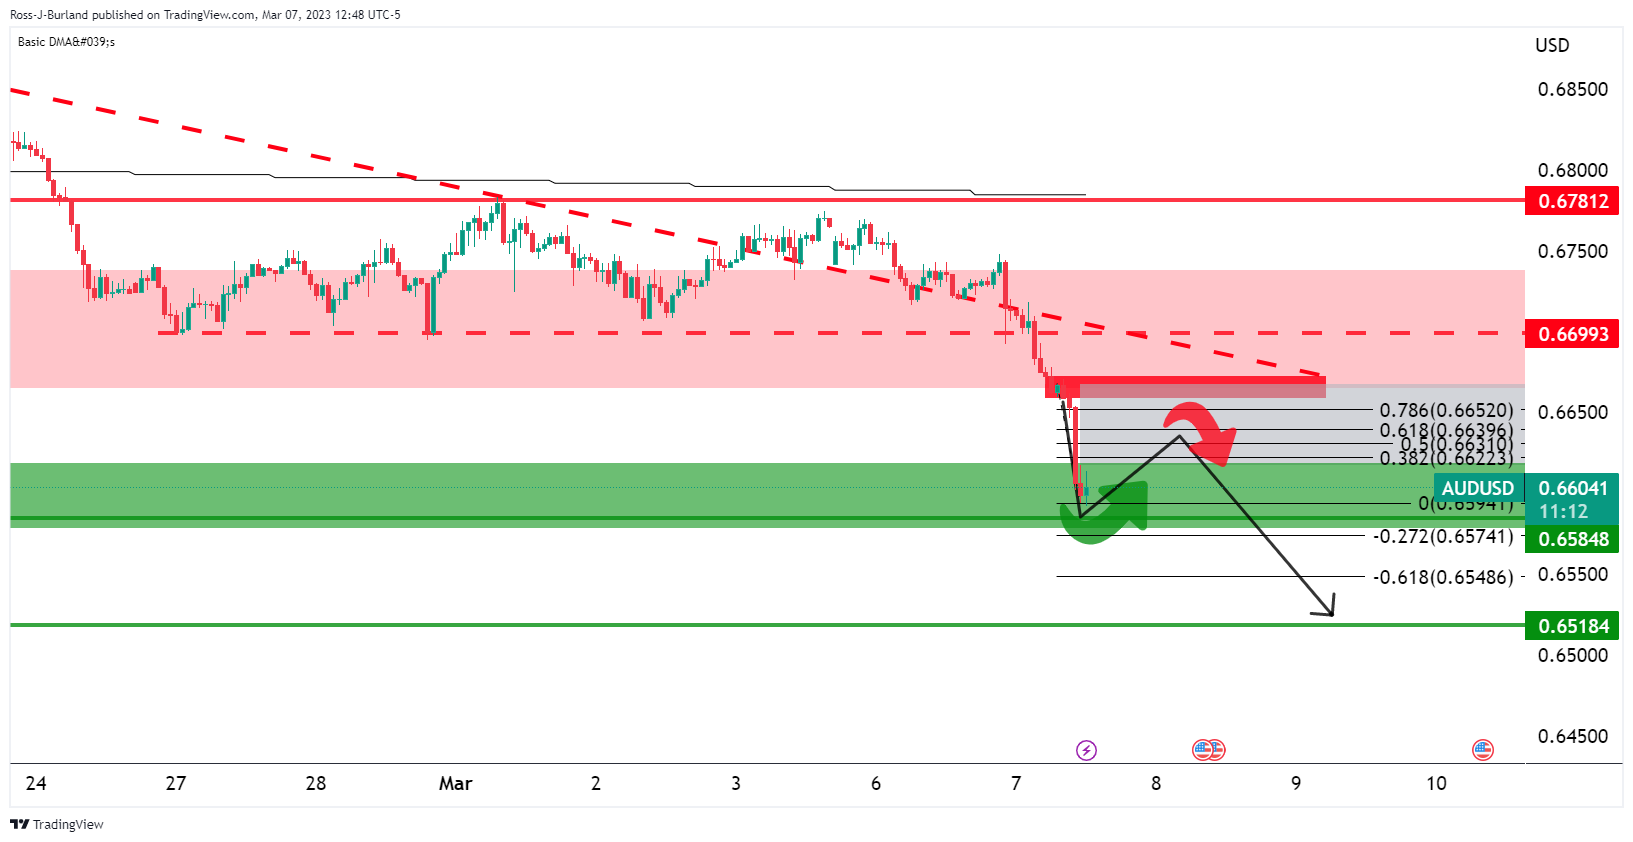
''AUD/USD has already made a recovery that came in close contact with the 38.2% ratio which leaves prospects of a move to the downside with 0.6520 eyed.''
AUD/USD update
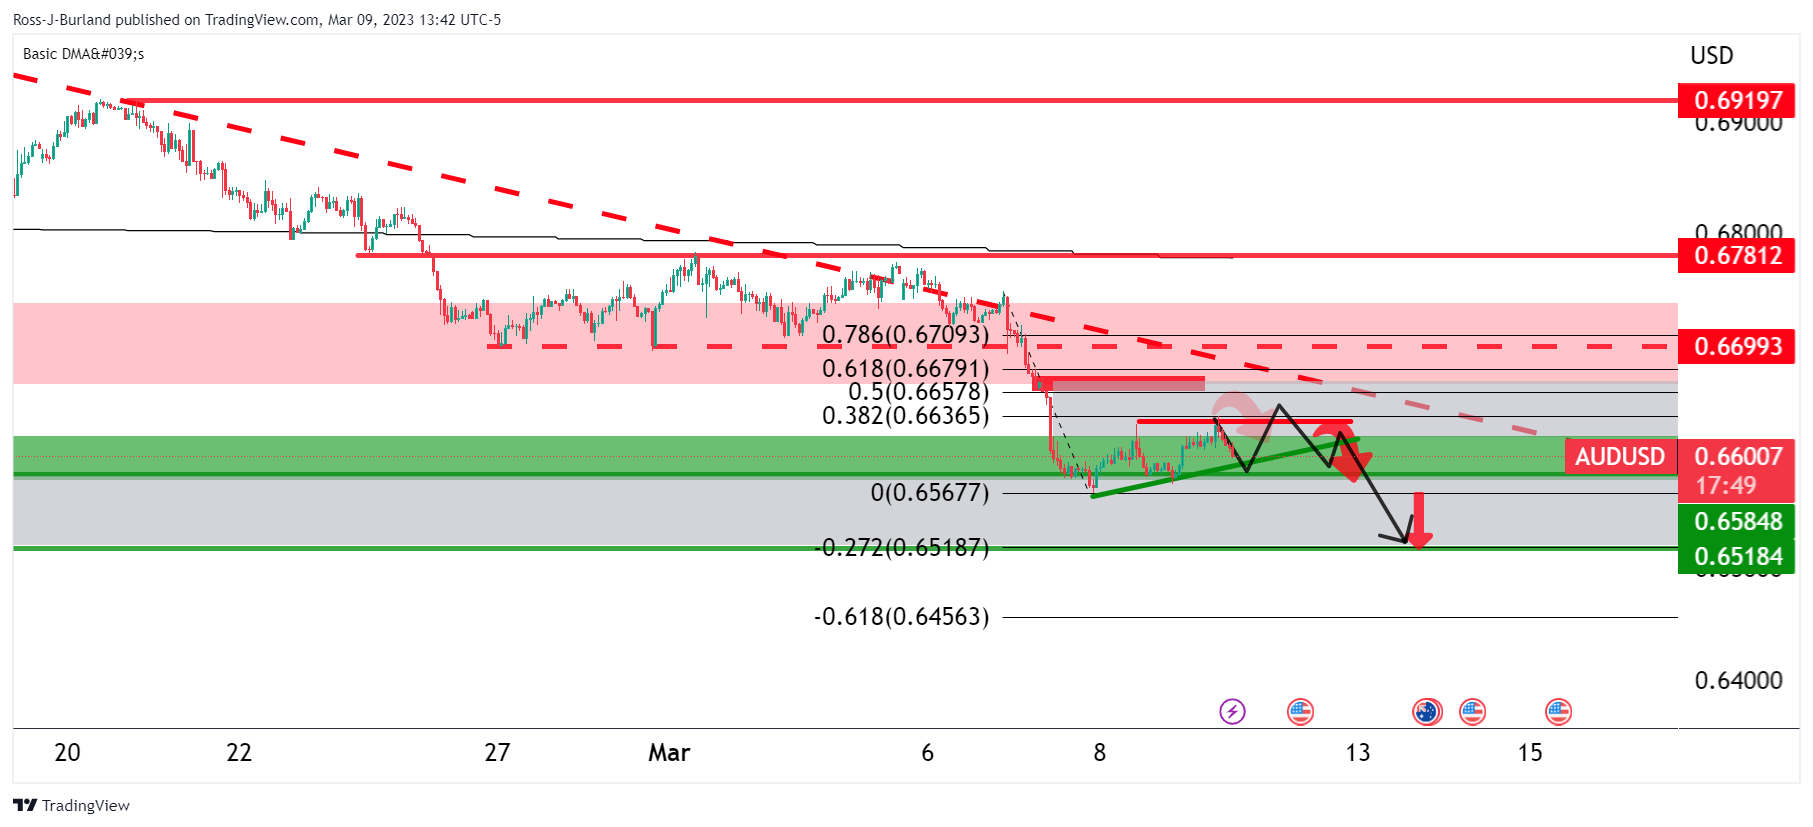
The price is carving out a geometrical box, an ascending triangle, in a downtrend which is considered a bearish chart pattern. Two-way price action can be expected from here with a bearish bias while on the front side of the bear trend and below the 200 DMA. 0.6520 is key in this regard as it guards a move towards 0.6380:
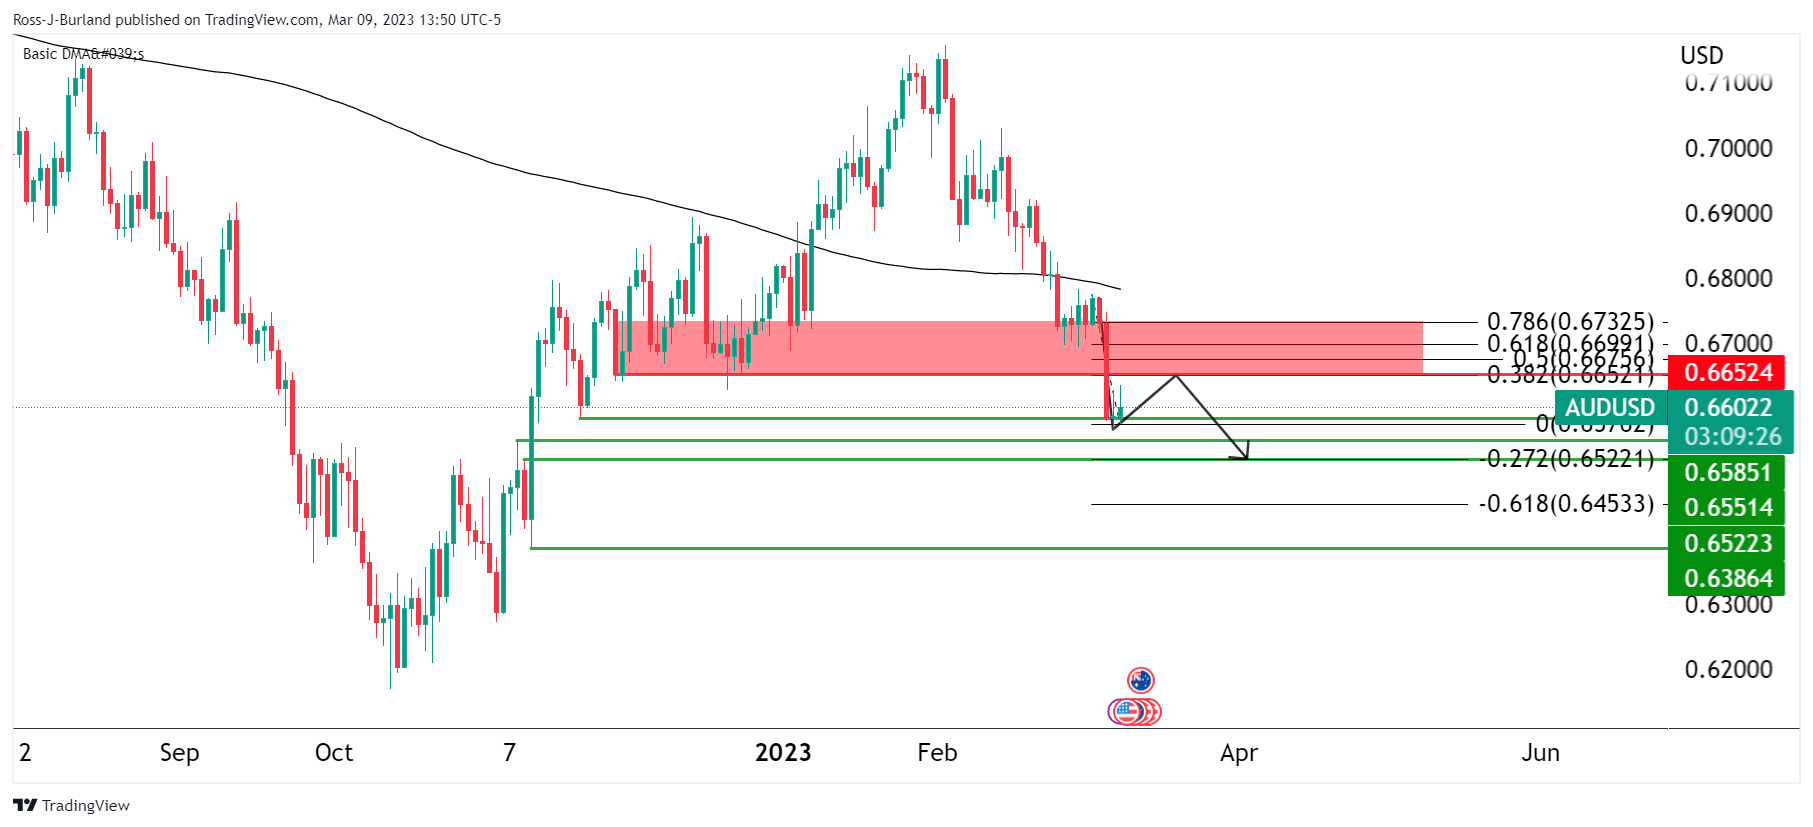
With all that being said, the daily chart's 38.2% Fibonacci is yet to be tested higher up near 0.6650.
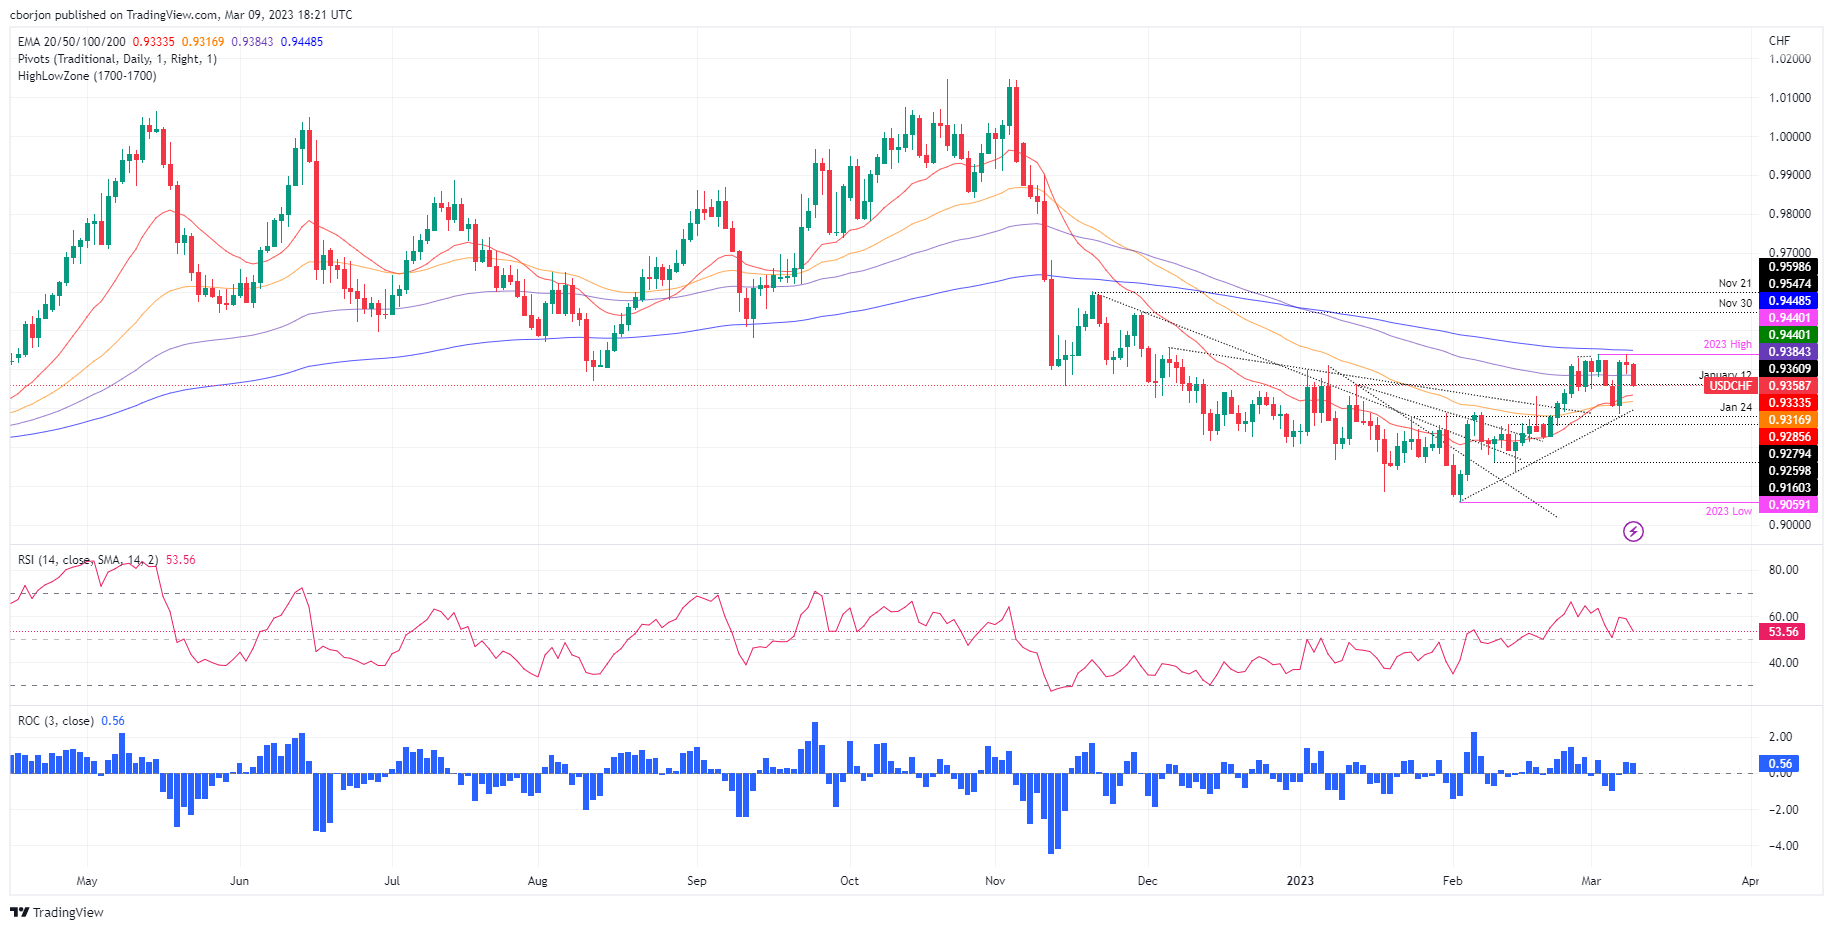
- USD/CHF plunges below the 100-day EMA, with sellers eyeing the 50-day EMA at 0.9310s.
- Oscillators remain in negative territory, warranting further downside in the USD/CHF pair.
- USD/CHF Price Analysis: Sellers reclaiming the 20-day EMA would pave the way to 0.9300.
The USD/CHF reverses its upward course and trims some of its weekly gains after the pair was shy of testing the 200-day Exponential Moving Average (EMA) at 0.9448. Consequently, sellers stepped in and tumbled the USD/CHF pair below 0.9400. At the time of typing, the USD/CHF is trading at 0.9357, down 0.59%.
USD/CHF Price action
During Thursday’s session, the USD/CHF retreated below 0.9400, with sellers reclaiming the 100-day EMA at 0.9384. Even though the USD/CHF is falling, it’s facing solid support around 0.93500, which, once cleared, could pave the USD/CHF’s way toward the 20-day EMA at 0.9333. A breach of the latter and the USD/CHF could fall to the 50-day EMA at 0.9316.
Oscillators like the Relative Strength Index (RSI) favor sellers, while the Rate of Change (RoC), portrays buyers losing momentum. Therefore, the USD/CHF could test the 0.9300 figure in the near term.
As an alternate scenario, the USD/CHF first resistance would be the 0.9400 figure. Once broken, the USD/CHF could test the YTD low at 0.9440 before reaching the 200-day EMA at 0.9448.
USD/CHF Daily chart
USD/CHF Technical levels
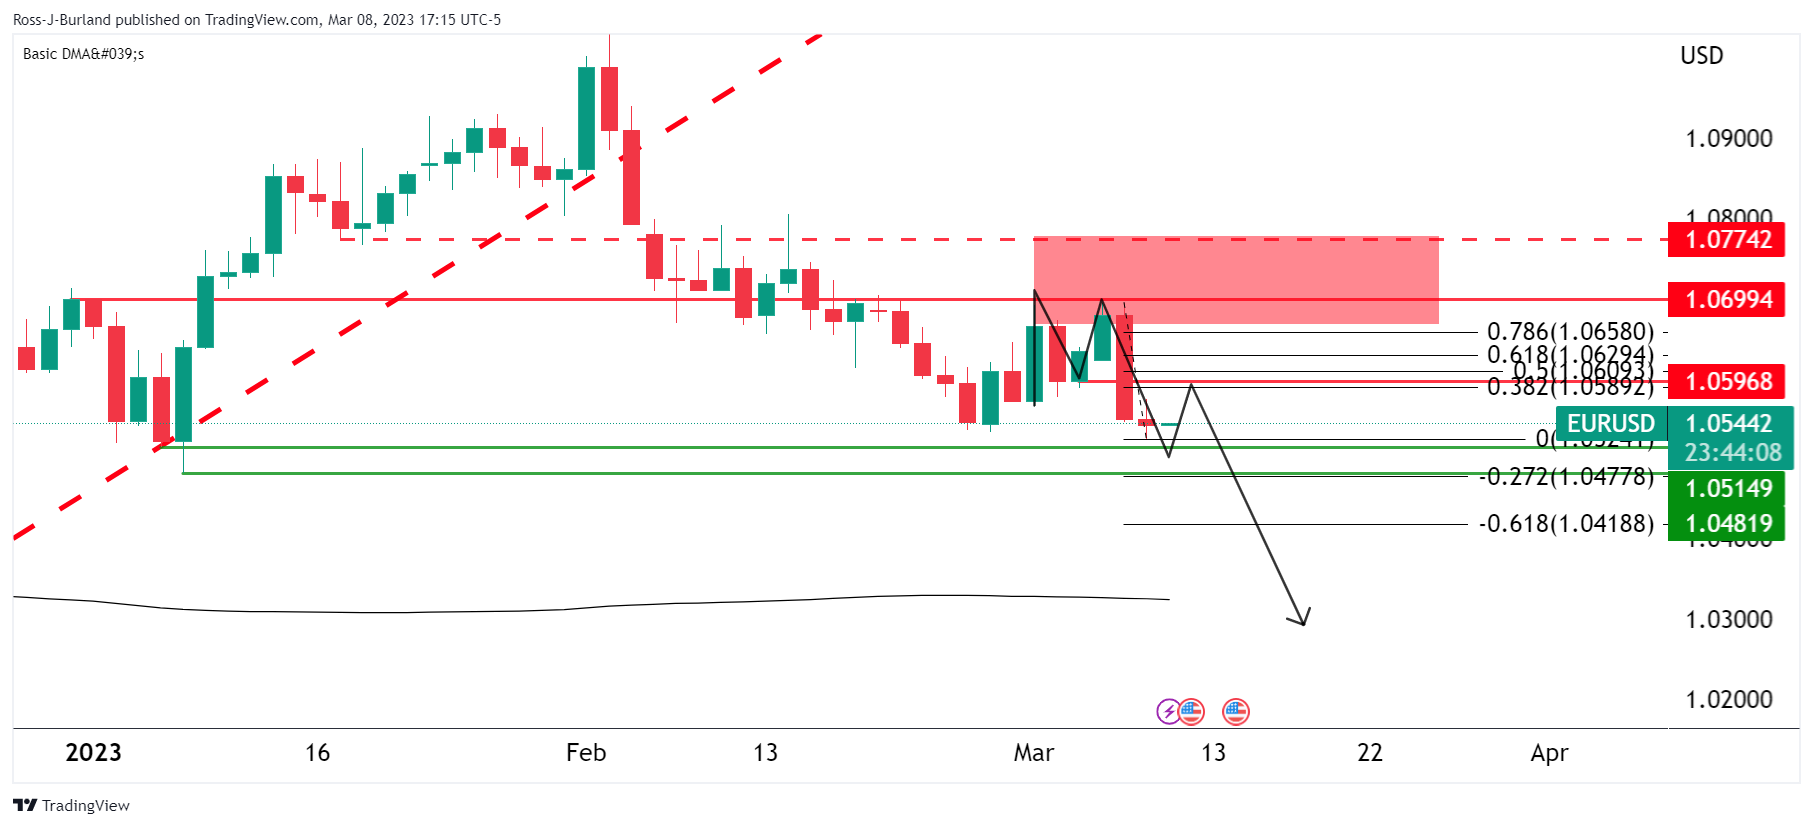
- EUR/USD bears are monitoring the price action and are on the lookout for opposing structures to align with.
- A break above the 78.6% may deter bears from getting heavily involved but the 1.0470s area eyed.
- Counting down to the Nonfarm Payrolls and US CPI.
EUR/USD is under making ground on Thursday and has moved up from a low of 1.0536 to score a corrective high of 1.0586 so far in the New York session ahead of the key US Nonfarm Payrolls on Friday. European stocks were held back by higher-for-longer interest rate worries but Treasury yields have eased on Wall Street supporting risk appetite.
US economic data has proven that there are signs of cracks in a tight US jobs market which is in contrast to how the markets were starting to position following Federal Reserve's Chair Jerome Powell's hawkish rhetoric to Congress earlier in the week.
Data released on Thursday took some of the sting out of Fed Chairman Jerome Powell's hawkish tone and has shown US jobless claims leaped by 11% last week. This was the biggest increase in five months. At the same time, planned layoffs for February quadrupled year-on-year. This data might be indicating that the Federal Reserve's hiking cycle has been playing out as intended and negates the need to hike aggressively.
Consequently, all three major US stock indexes were up and the US Dollar has drifted lower in a correction from a three-month high near 105.90 printed at the start of the week. The benchmark US Treasury yields have pulled back 0.8% and printed a low of 3.94% from 4.019%. In turn, the Euro is higher. However, Friday's Nonfarm Payrolls and next week's Consumer Price Index will be instrumental in guiding market expectations regarding the policy guidance likely to be offered by the FOMC at the March meeting.
Looking to tomorrow's event, the earlier ADP report pointed to another solid jobs report. It’s worth noting that NFP has beaten ADP for seven straight months. Will this streak continue in February? The ADP headline reading came in at 242k vs. 200k expected and a revised 119k (which was 106k) in January. ''The print adds to the sense that the economy is still humming along in February,'' analysts at Brown Brothers Harriman explained.
''Of course, recall that ADP missed big in January even after the revision and so the predictive power of ADP leaves a lot to be desired. That said, the consensus for Friday's NFP has edged higher to 225k vs. 517k in January. The unemployment rate is seen steady at 3.4% and average hourly earnings picking up to 4.7% y/y vs. 4.4% in January. Obviously, one big question is whether January NFP gets revised significantly in either direction,'' the analysts explained further. When giving their outlook for EURUSd, they said that they believe it remains on track to test 2023 low near $1.0485.
Meanwhile, ING analyst Chris Turner said in a webinar that ''the euro may struggle to recover until the third quarter when the US Dollar is likely to fall in tandem with the short-end of the U.S. Treasury yield curve.''
"Our baseline view for the second quarter had been a 1.05-1.10 range and clearly we are more towards the lower end of that and I suspect that the 1.05 area is going to be more pressured and more vulnerable during that period," Turner says, adding:
''However, the European Central Bank has been pretty hawkish about the prospect of further interest rate rises which may prevent EUR/USD from falling below the 1.05 support level even as the U.S. Federal Reserve signals higher rates.''
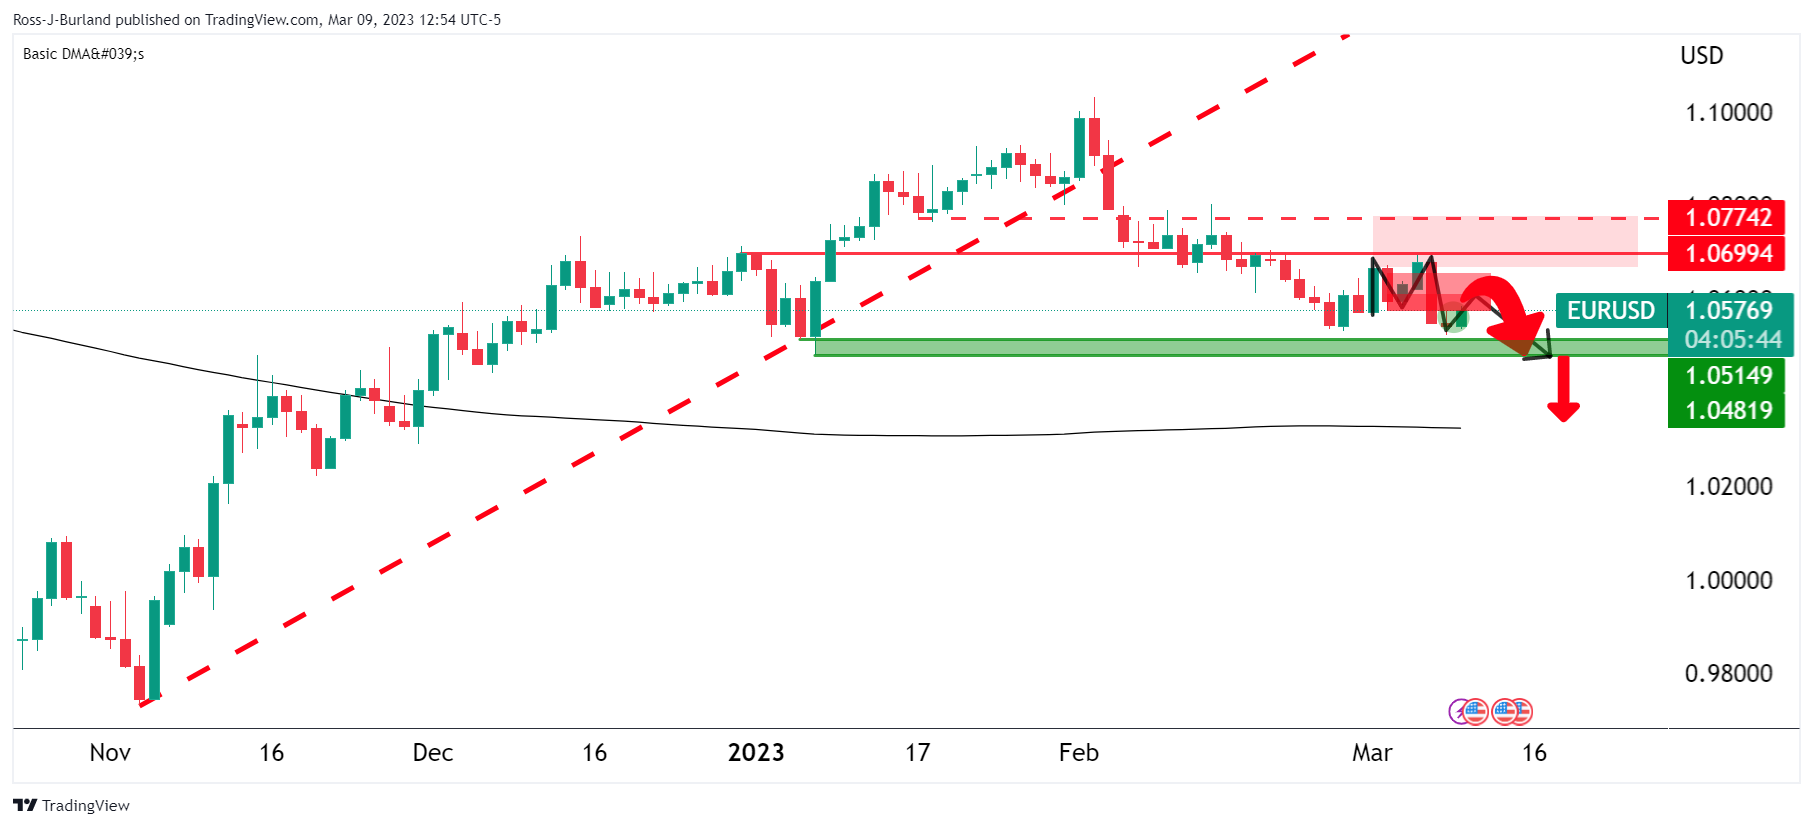
EUR/USD daily charts
In prior analysis, it was shown that an M-formation was forming on the daily chart as follows:
''The price has carved out an M-formation which is a pattern that tends to see a retest of the neckline near a 50% mean reversion in this particular case. 1.0520 guards 1.0480 while bulls will need to get above 1.06 to open risk to 1.0700.''
EUR/USD update
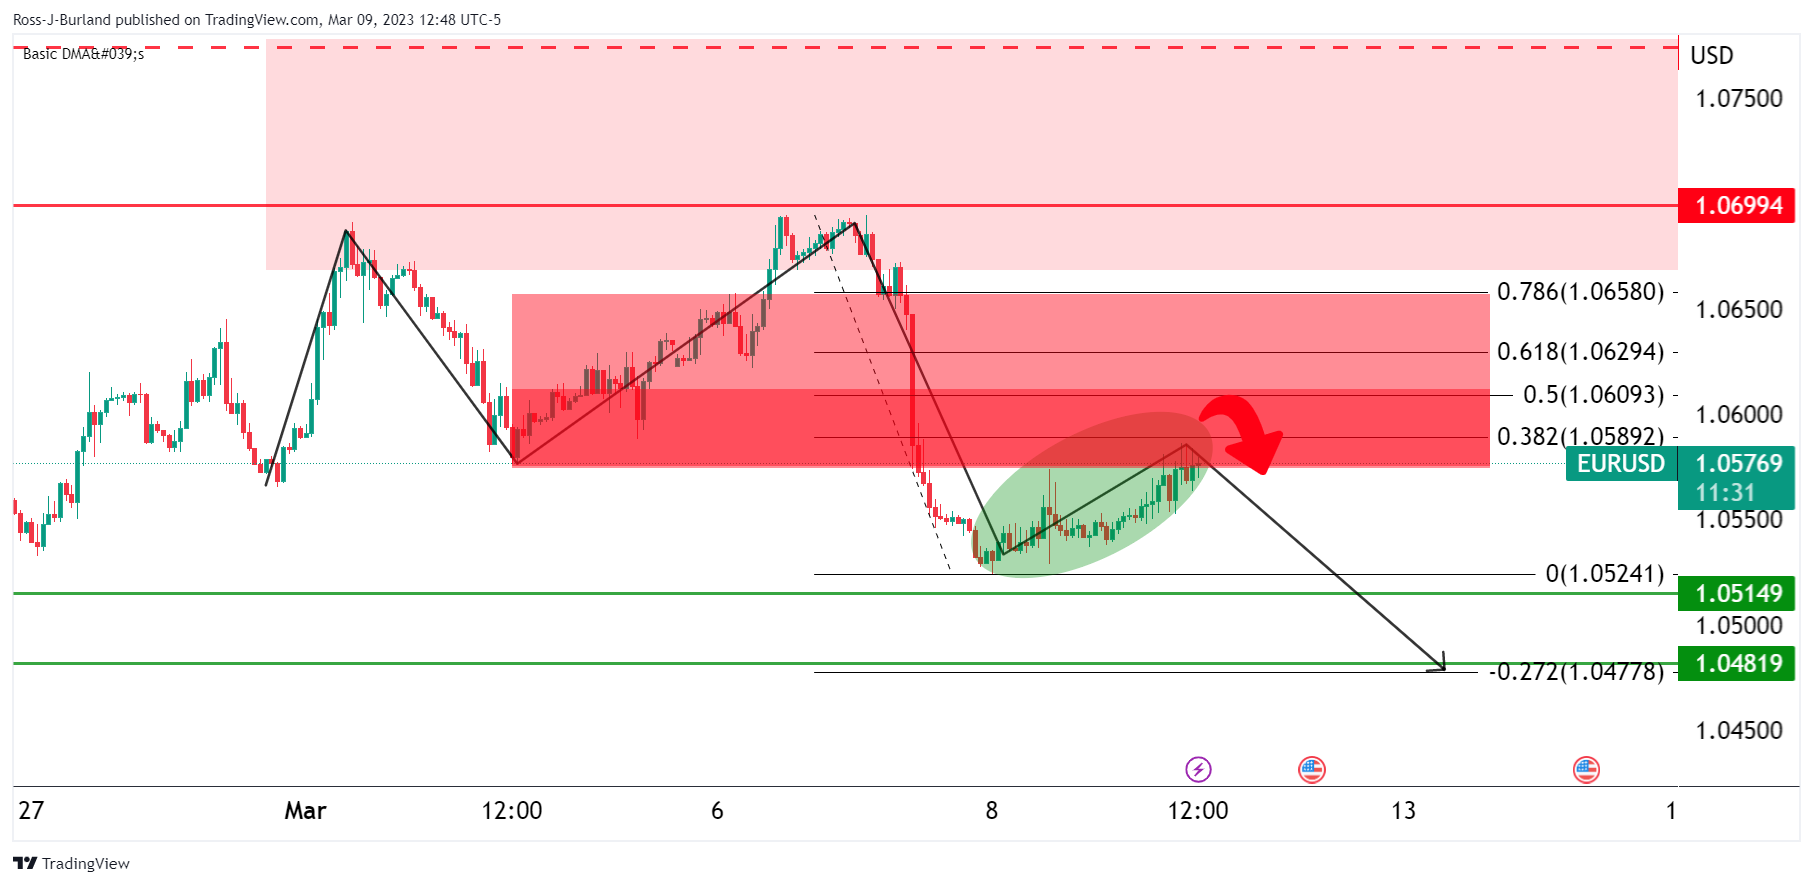
From the hourly chart, we can see how the M-formation has played out with the price moving up into the neckline area's resistance approaching the 38.2% Fibonacci retracement level.
At this juncture, bears will be monitoring the price action and on the lookout for opposing structures to align their shorts positions with. A break above the 78.6% Fibo may deter bears from getting heavily involved but the 1.0470s area is eyed as a downside target for a test of critical support on the way to the 200 DMA as per the daily chart:
- USD/MXN turned positive after buyers stepped in and dragged prices above 18.00.
- US Initial Jobless Claims aimed higher, suggesting that the Fed could increase rates gradually.
- Inflation in Mexico cooled down, with analysts speculating that Banxico could rise in 25 bps increments.
The Mexican Peso (MXN) is under pressure on Thursday; after reaching new 5-year lows at 17.8967, the UXD/MXN has risen back towards the 18.0800 area. Traders seeking safety ahead of important US economic data to be released, with the US Nonfarm Payrolls and next week’s CP, bought the US Dollar (USD). Hence, the USD/MXN climbs 0.60%, trading at around 18.0860.
Unemployment claims rose, though bolstered the USD vs. the MXN
Market mood has deteriorated, as shown by Wall Street, retracing its earlier gains. The Bureau of Labor Statistics (BLS) revealed the Initial Jobless Claims for the week ending on March 4 were 211K higher than expected at 195K. Although claims rose, the ADP Employment Change data, and job openings, continued to portray a tight labor market, justifying the Federal Reserve’s Chair Jerome Powell’s hawkishness at his appearance before the US Congress.
The US Dollar Index (DXY) is losing 0.38%, down at 105.250, putting a lid on the USD/MXN recovery towards the weekly highs at around 18.1788.
On the Mexican front, inflation slumped in the headline and core readings. The Consumer Price Index for February came at 7.62% YoY, below estimates of 7.68% and the previous month’s readings of 7.91%. Core CPI rose by 8.29% YoY, above the consensus but beneath January’s 8.45%.
“Today’s (inflation) print reduces the odds that (the Mexican central bank) chooses to go ahead with a 50 bps hike, though incoming data as well as the outlook for the Fed remain key influences on the bank’s decision,” Scotiabank economists said in a note.
Following the Mexican inflation release, the USD/MXN climbed above the $18.00 figure, extending its gains ahead of a busy US economic calendar. Nevertheless, the bias is downwards, but it could shift to neutral if buyers reclaim 18.3000.
USD/MXN Price action
The USD/MXN stages a recovery after trading below the $18.00 barrier during the last few days. Nevertheless, USD/MXN bulls are far ahead of declaring victory, as they need to reclaim the weekly high at 18.1788, followed by the 20-day Exponential Moving Average (EMA) at 18.2898. Once done, the USD/MXN could consolidate around the 18.1800-18.3000 area before testing the 50-day EMA at 18.6430. Otherwise, the USD/MXN is at the brisk of falling below 18.0000, which could pave the way for a new YTD low print.
What to watch?
US President Joe Biden presented his budget for the fiscal year 2024. It includes a plan to cut $3 trillion from the fiscal deficit over the next decade and higher taxes on wealthy people and large corporations.
More revenue would come from an increase in the corporate tax rate to 28%, hiking taxes on oil and gas companies and allowing Medicare to negotiate drug prices. The 2024 budget totals $6.8 trillion in spending, slightly above the current year.
The budget sets the stage for a battle between Democrats and Republicans, that control the House of Representatives. Still, Congress has to pass an increase to the debt ceiling. Republicans oppose raising taxes and their leaders said they won’t seek reductions to Social Security or Medicare.
The budget’s blueprint projects an annual deficit of more than $1 trillion each year through 2033 (deficits between 4.6% and 6.8% of GDP), with the debt-to-GDP ratio reaching 109% by that year. It assumes an annual growth of 1.5%.
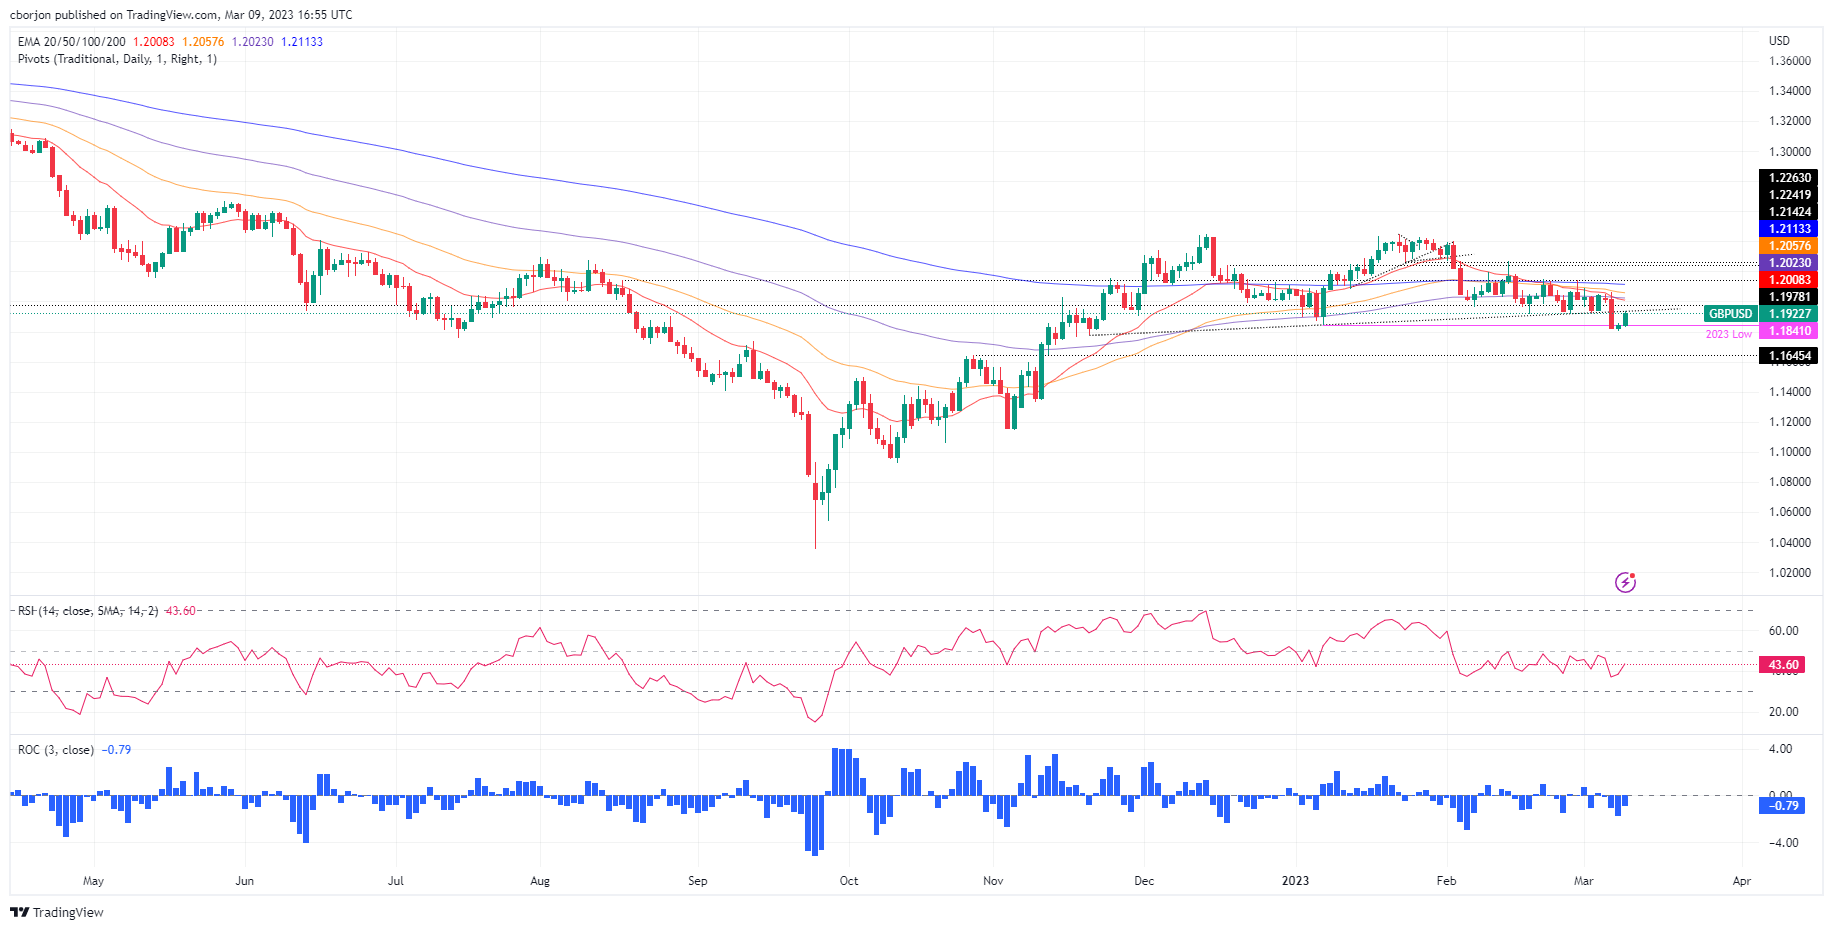
- GBP/USD is on track to finish Thursday’s session with gains of 0.70%.
- Unemployment claims in the US take off some pressure from the Federal Reserve as the labor market cools down.
- GBP/USD Price Analysis: To remain downward bias unless bulls reclaim 1.2000.
GBP/USD bounces off the YTD lows of 1.1802 and rises above 1.1900, following Powell’s two-day appearance at the US Congress. Although Powell’s stance turned hawkish, US Thursday’s data might help the Fed to gradually increase rates, though further confirmation is needed on Friday’s Nonfarm Payrolls. At the time of writing, the GBP/USD is trading at 1.1905 after hitting a low of 1.1828.
Rising unemployment claims improved market sentiment, so the GBP rises
Data revealed by the BLS, Jobless Claims for the week ending on March 4 were 211K higher than expected at 195K. Despite a strong ADP report on Wednesday and more job openings than anticipated, rising unemployment claims could ease the tightness of the labor market. A downbeat US Nonfarm Payrolls report, coupled with high unemployment claims, could reduce the Federal Reserve’s (Fed) needs to tighten conditions at a faster pace.
The US Dollar Index (DXY) edges down by 0.40%, at 105.225, a tailwind for the previously battered Pound Sterling (GBP). In addition, US Treasury bond yields are easing ahead of an essential jobs report and next Tuesday’s inflation data.
On the UK front, an employment report will be released on March 14. Furthermore, the Chancellor of the Exchequer, Jeremy Hunt, will announce the spring budget. Aside from this, money market futures are pricing in a 91% chance that the Bank of England (BoE) will increase rates by 25 bps on the BoE’s next meeting on March 23.
GBP/USD Technical analysis
After the GBP/USD fell to fresh YTD lows at 1.1802, the pair recovered some ground but clashed on an upslope trendline; previous support turned resistance around 1.1930s. The daily Exponential Moving Averages (EMAs) reinforced the downtrend following the formation of a death cross that happened on February 3, which exacerbated the GBP/USD’s fall. Also, for a bullish continuation, the GBP/USD must conquer 1.2000. Contrarily, the GBP/USD first support would be 1.1900, which, once cleared, could pave the way to retest the YTD lows and 1.1800.
Economists at Rabobank have revised their economic forecasts for the Eurozone. They have significantly upgraded projections for the Eurozone in 2023 from -0.5% to 0.3%.
Good news, but with a disclaimer
“Lower energy prices, generous government subsidies and overall economic resilience will boost economic growth in the short run. As a consequence, we expect inflation to stay elevated for longer, just as interest rates. Combined with the fact that in most countries there is no more pandemic-related pent-up demand to be expected, this makes us forecast lackluster growth in the medium run.”
“We have quite substantially upgraded our forecast for 2023; we expect the economy to grow by 0.3% rather than contract with -0.5%. At the same time, we have slightly downgraded our forecast for 2024 from 1.2% to 0.9%.”
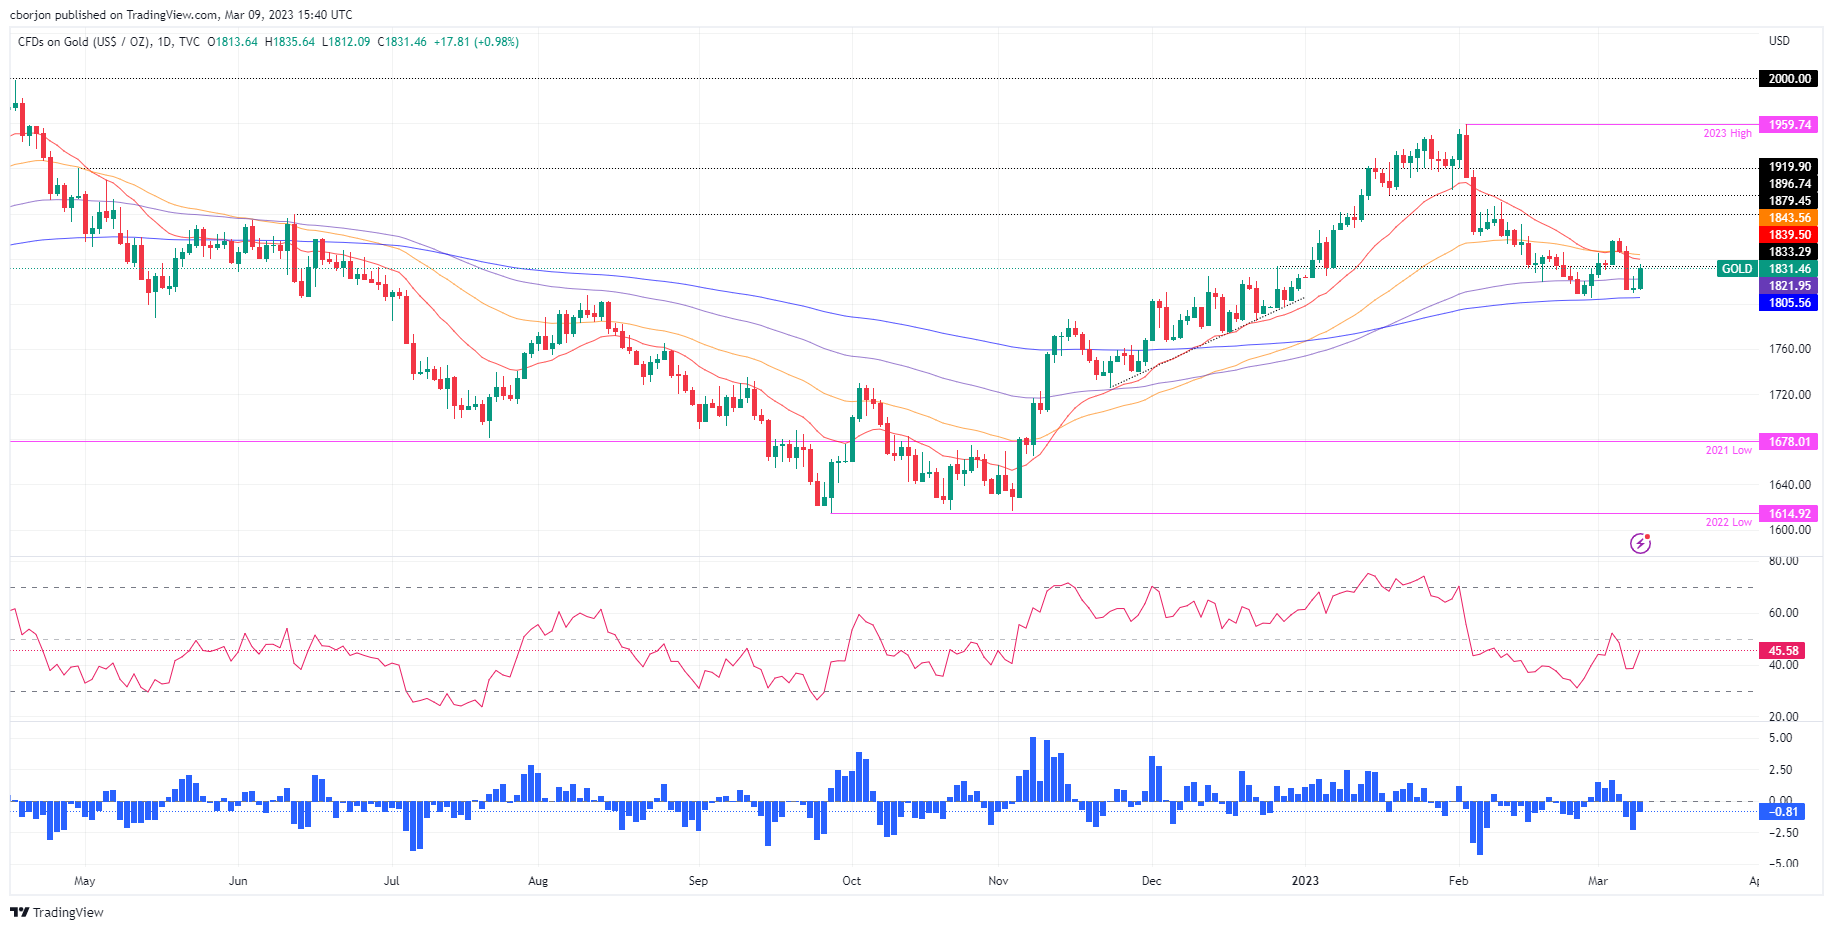
- Gold price jumps off the week’s lows, around $1810s, despite Fed’s Powell hawkish remarks.
- US Initial Jobless Claims rose above estimates, signaling that the labor market is cooling.
- XAU/USD Price Analysis: Neutral upwards, but downside risks remain.
Gold price climbs sharply in the North American session after dropping more than 1.70% on Tuesday. Hawkish remarks by the US Federal Reserve (Fed) Chair Jerome Powell at his appearance at the US Congress bolstered the US Dollar (USD). However, the US employment and inflation figures on Friday and the next week could influence the Fed’s path on interest rates. At the time of writing, the XAU/USD is trading at $1831.87 after hitting a low of $1812.09.
A fall in US jobless claims, a prelude of Friday’s NFP?
XAU/USD jumped sharply on the release of US economic data. The Bureau of Labor Statistics (BLS) revealed that Initial Jobless Claims for the week ending on March 4 rose by 211K above estimates of 195K. Even though Wednesday’s ADP report was solid, job openings exceeded forecasts; increasing unemployment claims could alleviate the labor market’s tightness. A solid US Nonfarm Payrolls report on Friday would pressure the Federal Reserve to deliver price stability. Hence, further tightening would be needed.
The US Dollar softened, and US Real Yields dropped from around 1.68%
In the meantime, the greenback is on the back foot, with traders booking profit ahead of tomorrow’s US jobs report. The US Dollar Index (DXY), which tracks the buck’s value against a basket of peers, retraces 0.46% at 105.172, a tailwind for the yellow metal prices.
US Treasury bond yields have come off the highs, with the 10-year rate at 3.944%, down five bps. The 10-yeas US TIPS, a proxy for Real Yields, are down from 1.686% to 1.614%, giving XAU/USD buyers a respite.
XAU/USD Technical analysis
XAU/USD jumped from around $1810, shy of testing the 200-day Exponential Moving Average (EMA) At $1805.56. On its way north, the XAU/USD reclaimed the 100-day EMA at $1821.94 and reduced the gap of the 20-day EMA, resting at $1839.43. For a bullish resumption, XAU/USD must reclaim the confluence of the 20 and 50-day EMAs at around $1844. Once cleared, it will expose the $1850 area. On the flip side, if XAU/USD tumbled back below the 100-day EMA, the path toward the 200-day EMA would be open.
What to watch?
The Fed has more to do. At some point, it is going to hurt, Kit Juckes, Chief Global FX Strategist at Société Générale reports.
Fed still closer to the end of its hiking cycle than either the ECB or the BoJ
“The Fed is still closer to the end of its hiking cycle than either the ECB or the BoJ, even if that cycle has further to go. Hence the inversion and the fear that the harder the inflation nut will be to crack, the more damage will be done to the economy its sitting on. That adds up to a slightly stronger Dollar but not dramatically stronger – it’s retraced a third of the fall from its end-September peak. This is set to grind on until the weight of forward-looking recession indicators (the curve, leading indicators, profits, the real estate sector, t name a few) becomes too heavy to ignore.”
“In the meantime, we watch investors move to the relative safety of credit markets, which appeals to boomers and is fine until it really isn’t. At which point, we’re in a recession.”
The Bank of Japan (BoJ) will announce its monetary policy decision on Friday, March 10 at 03:00 GMT and as we get closer to the release time, here are the expectations forecast by the economists and researchers of six major banks.
This will be the last one under current Governor Kuroda, as Kazuo Ueda has been appointed to succeed Kuroda from April on. No changes are expected in this March meeting. A policy shift by Kuroda in his last meeting would be a shocker.
Danske Bank
“The current BoJ Governor, Kuroda, has his last monetary policy meeting. We still think BoJ will tweak its yield curve control in the short-term. It is not likely to happen this week, but we also were surprised last time they did it in December. Either way, we think it is a matter of time and could happen during Q2.”
TDS
“It is unlikely that the BoJ will rock the boat at this meeting even as CPI inflation hit a 41-year high. Governor Kuroda at his last meeting will likely keep policy unchanged, with further changes having to wait for incoming governor Ueda starting in April. We think the BoJ could shift the top end of the YCC band again in the months ahead, potentially as early as April.”
SocGen
“We expect the BoJ to maintain its main monetary policy, i.e. YCC and ETF purchases. The BoJ is likely to want to see the results of this year’s spring wage negotiations, or the shunto in Japanese. Going forward, the BoJ is also likely to keep its policies unchanged in April, at the first meeting under the governor nominee, Kazuo Ueda. However, we expect that the BoJ will widen the range of fluctuation permitted on 10-year JGB yields from ±50 bps to ±100 bps at the June monetary policy meeting. In addition, the BoJ could make it clear that it will hold the current range or YCC until further progress is made in prices and wages. We continue to expect that the YCC will not be abolished in June.”
Deutsche Bank
“We expect the BoJ to adhere to its present monetary policy, with YCC removal seen unlikely, although you can't rule it out given December's surprise. This will also be the last monetary policy meeting for Governor Kuroda.”
Citibank
“BoJ will hold a policy meeting on March 9-10, the last one for Governor Kuroda. We expect to see the policy status quo maintained.”
BofA
“We expect no change in the BoJ's key policy targets, including the +/-50 bps band around the zero% 10yr JGB long rate target. We summarize expected market reactions to tail risks: No change: the market to await Ueda (USD/JPY 137). Shortening target from 10yr to 5yr: It could eventually be bearish for JPY if Ueda confirms dovish stance on the front-end as a 5yr ceiling can work as forward guidance (USD/JPY 134-136). Raising 10yr target band ceiling to 1% from 0.5%: Policy uncertainty to remain high (USD/JPY 132-134). YCC removal: Market may price in earlier and faster rate hikes on the front-end (USD/JPY 128-130).”
Gold price edges higher on Thursday. Bets for rate hikes by the Federal Reserve have failed to cap the yellow metal, strategists at TD Securities report.
More substantial CTA buying activity is unlikely below the $1,920 mark
“Gold prices are failing to print new lows ahead of this week's jobs report, and instead, have traded incredibly resiliently given rates markets pricing for the terminal rate rising sharply to 5.65% with 43 bps of hikes priced for March (72% chance of a 50 bps hike). This continues to underscore that substantial physical inflows into Gold markets have more than offset investor outflows in recent months.”
“In response to the resilient price action, CTA trend followers could already be set to marginally add to their Gold length this session, but more substantial CTA buying activity is unlikely below the $1,920 mark. Still, substantial selling flows are equally unlikely until prices break below the $1,710 mark, suggesting that CTA flows may take a backseat in the yellow metal for the time being.”
- EUR/USD manages to regain some poise and revisits 1.0580.
- Further losses could see the YTD low near 1.0480 retested.
EUR/USD regains some buying interest and advances to the 1.0580/85 band following two daily drops in a row.
The continuation of the downtrend seems favoured for the time being. Against that, the pair could dispute the 2023 low at 1.0481 (January 6) once the March low at 1.0524 (March 8) is cleared. Further losses are expected to retest the minor support at 1.0443 (weekly low December 7 2022).
Looking at the longer run, the constructive view remains unchanged while above the 200-day SMA, today at 1.0324.
EUR/USD daily chart
USD/CAD pushed higher and touched its strongest level since October at 1.3817. Economists at MUFG Bank expect the Loonie to remain under pressure.
Clear policy divergence lifting USD/CAD
“While we expect the US economy to slow more as well in response to higher rates it is happening with more of a lag that is opening up a widening policy divergence between the BoC and Fed in the near-term.”
“Short-term yield spreads between the US and Canada have hit fresh highs this week taking out the highs from late last year, and are placing further upward pressure on USD/CAD that has jumped from around 1.3600 to 1.3800.”
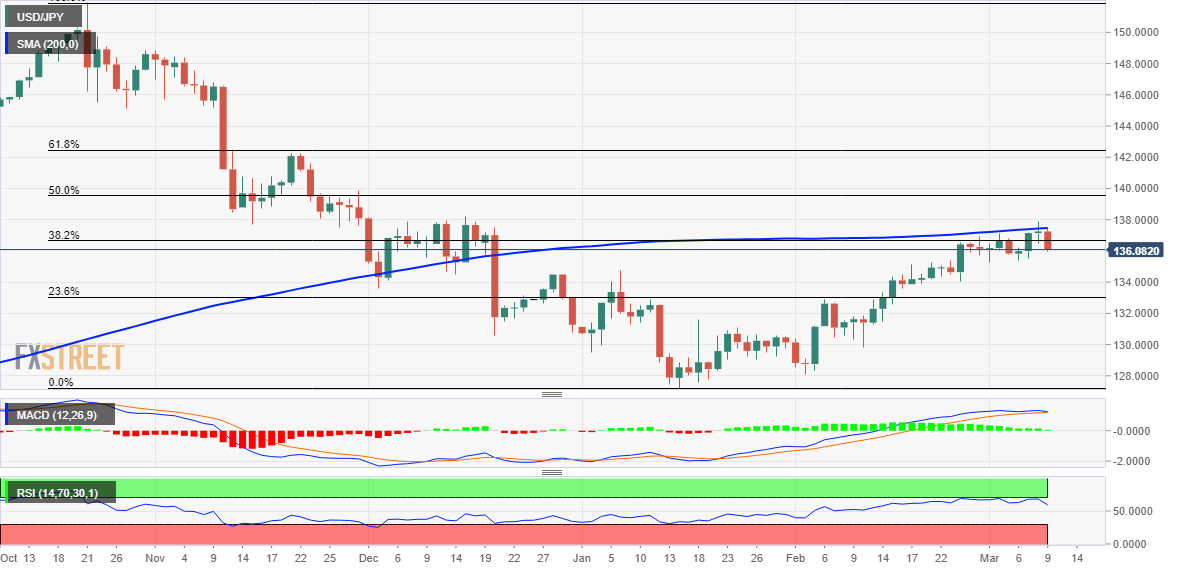
- USD/JPY comes under heavy selling pressure amid a sharp USD pullback from a multi-month top.
- The Fed-BoJ policy divergence supports prospects for the emergence of dip-buying at lower levels.
- The overnight failure to find acceptance above the 200-day SMA warrants some caution for bulls.
The USD/JPY pair meets with a fresh supply on Thursday and extends the previous day's modest pullback from the vicinity of the 138.00 mark, or its highest level since mid-December. The intraday selling picks up pace during the early North American session and momentarily drags spot prices below the 136.00 mark in the last hour.
The US Dollar (USD) bulls opt to take some profits off the table following the recent strong rally to over a three-month peak and turn out to be a key factor exerting pressure on the USD/JPY pair. Apart from this, the downfall could further be attributed to some repositioning trade ahead of the Bank of Japan (BoJ) monetary policy decision, scheduled to be announced during the Asian session on Friday.
The downside for the USD, however, is more likely to remain cushioned amid rising bets for a jumbo 50 bps lift-off at the March FOMC meeting. In contrast, the BoJ is expected to stick to its ultra-easy policy settings to support the fragile domestic economy. The divergent policy stance adopted by the two major central banks supports prospects for the emergence of some dip-buying around the USD/JPY pair.
From a technical perspective, the overnight failure to find acceptance above the very important 200-day Simple Moving Average (SMA) warrants caution for bullish traders. This makes it prudent to wait for a sustained move beyond the overnight swing high, around the 137.90 area, before positioning for any further gains. The USD/JPY pair might then climb to the 138.50 intermediate barrier en route to the 139.00 round figure.
On the flip side, any further decline is more likely to attract fresh buyers near the 135.35 horizontal support zone. That said, a convincing breakthrough, leading to a subsequent weakness below the 135.00 psychological mark, might shift the near-term bias in favour of bearish traders. Spot prices might then accelerate the fall towards the 134.75-134.70 area before eventually dropping to the 134.25 area and the 134.00 round figure.
USD/JPY daily chart
Key levels to watch
- Initial Jobless Claims in the US increased by 21,000 in the week ending March 4.
- US Dollar Index stays in negative territory below 105.50.
There were 211,000 initial jobless claims in the week ending March 4, the weekly data published by the US Department of Labor (DOL) showed on Thursday. This print followed the previous week's print of 190,000 and came in worse than the market expectation of 195,000.
Further details of the publication revealed that the advance seasonally adjusted insured unemployment rate was 1.2% and the 4-week moving average was 197,000, an increase of 4,000 from the previous week's unrevised average.
"The advance number for seasonally adjusted insured unemployment during the week ending February 25 was 1,718,000, an increase of 69,000 from the previous week's revised level," the DOL noted.
Market reaction
The US Dollar Index extended its downward correction after this data and was last seen losing 0.35% on the day at 105.28.
- USD/CAD climbs to its highest level since October and seems poised to appreciate further.
- A slightly overbought RSI on the daily chart might hold back bulls from placing fresh bets.
- Any meaningful corrective slide could be seen as a buying opportunity and remain limited.
The USD/CAD pair attracts some dip-buying near the 1.3785 region and climbs to a fresh high since October 21 during the early North American session on Thursday. The pair currently trades just above the 1.3800 mark and seems poised to extend its recent upward trajectory witnessed over the past three weeks or so.
Crude Oil prices languish near the weekly low amid concerns that a deeper global economic downturn will dent fuel demand and fading optimism over a strong recovery in China. This, in turn, is seen undermining the commodity-linked Loonie and acting as a tailwind for the USD/CAD pair. Bulls, meanwhile, seem rather unaffected by a modest US Dollar pullback from over a three-month peak.
The downside for the USD, however, remains cushioned amid bets for a 50 bps lift-off at the upcoming FOMC policy meeting on March 21-22. Moreover, looming recession risks should benefit the safe-haven buck. This, along with the fact that the Bank of Canada (BoC) became the first major central bank to pause its rate-hiking cycle on Wednesday, validates the positive outlook for the USD/CAD pair.
From a technical perspective, a sustained move beyond the 1.3700 horizontal barrier on Tuesday was seen as a fresh trigger for bullish traders. The subsequent move up validates the breakout and supports prospects for a further near-term appreciating move. That said, Relative Strength Index (RSI) on the daily chart is flashing slightly overbought conditions and warrants caution before placing fresh bets.
Nevertheless, the USD/CAD pair remains on track to climb further towards an intermediate hurdle near the 1.3870-1.3880 region en route to the 1.3900 round-figure mark. The positive momentum could get extended further, which should allow bulls to challenge the 2022 swing high, around the 1.3975-1.3980 zone, and then aim to reclaim the 1.4000 psychological mark.
On the flip side, any meaningful corrective decline now seems to find some support near the 1.3750-1.3745 area. Any further decline is more likely to attract fresh buyers near the 1.3700 horizontal resistance breakpoint. The latter should act as a pivotal point, which if broken might prompt some technical selling and drag the USD/CAD pair back towards the 1.3600 mark en route to the 1.3560 support zone.
USD/CAD daily chart
Key levels to watch
- DXY comes under some selling pressure following new YTD highs.
- Extra upside continues to target the 200-day SMA.
DXY gives away part of recent gains to the vicinity of the 106.00 mark, or new 2023 peaks.
The continuation of the rebound in the dollar seems like for the time being. The breakout of the round level at 106.00 should put the index en route to a probable test of the key 200-day SMA, today at 106.60.
A convincing move beyond the latter should shift the outlook to constructive in the short-term horizon and allow for the continuation of the uptrend.
DXY daily chart
Economists at Rabobank see the risks as being titled towards a firmer for longer USD in the coming months.
King Dollar (again)?
“In the near-term, the releases of US payrolls and CPI inflation data are likely to be instrumental in guiding the direction of the USD. However, the risks that inflation could prove sticky suggests that the higher for longer interest rate theme could persist for months.”
“We maintain our three-month forecast of EUR/USD 1.05 and continue to see risk of a dip to EUR/USD 1.03 on a six-month view.”
“We see risk of Cable moving to 1.16 on a six-month view.”
“We are forecasting AUD/USD holding close to 0.66 in the coming months with downside risk to this view.”
- Silver enters a bearish consolidation phase and oscillates in a narrow range around the $20.00 mark.
- The technical setup supports prospects for an extension of the recent well-established downtrend.
- A slightly oversold RSI on the daily chart is holding back bearish traders from placing fresh bets.
Silver struggles to gain any meaningful traction and extends its sideways consolidative price move around the $20.00 psychological mark through the mid-European session on Thursday. The white metal, meanwhile, remains well within the striking distance of over a four-month low touched on Wednesday and seems vulnerable to prolonging its downward trajectory witnessed since early February.
The recent breakdown through a technically significant 200-day Exponential Moving Average (EMA) was seen as a fresh trigger for bearish traders. Furthermore, this week's sustained weakness below the $20.50-$20.40 horizontal support, which coincided with the previous YTD low, adds credence to the negative outlook. This, in turn, suggests that the path of least resistance for the XAG/USD is to the downside.
That said, Relative Strength Index (RSI) on the daily chart is hovering in the oversold territory. Moreover, repeated failures to find acceptance below the $20.00 psychological mark make it prudent to wait for near-term consolidation before placing fresh bets around the XAG/USD. Nevertheless, the metal's inability to attract any buyers suggests that the near-term descending trend is still far from being over.
Hence, a subsequent slide towards testing the $19.60 intermediate support, en route to the $19.00 round-figure mark, looks like a distinct possibility. Some follow-through selling should pave the way for a slide towards the next relevant support near the $18.80-$18.75 region before the XAG/USD eventually drops to $18.30-$18.25 horizontal zone and the $18.00 level, which should offer strong support.
On the flip side, the $20.40-$20.50 support breakpoint now seems to act as an immediate barrier. Any further recovery is likely to attract fresh sellers and remains capped near the 200-day Simple Moving Average (SMA), currently pegged just ahead of the $21.00 mark. The latter should act as a pivotal point, which if cleared decisively could lift the XAG/USD to the mid-$21.00s. Bulls
might then aim to reclaim the $22.00 mark.
Silver daily chart
Key levels to watch
EUR/USD failed to make a decisive move in either direction on Wednesday. Economists at OCBC Bank expect the pair to trade within a 1.0520-1.0580 range today.
Await outcome of the US NFP on Friday
“Day ahead, expect EUR to consolidate around 1.0520-1.0580 range within wider perimeters of 1.0460-1.0680 range as we await outcome of the US NFP event risk tomorrow.”
“Resistance at 1.0640 (21-Day Moving Average), 1.0680 (23.6% fibo) and 1.0720 (50 DMA).”
“Support at 1.0520 (100 DMA), 1.0460 (38.2% fibo retracement of Sep low.”
- EUR/JPY accelerate losses and drops to the sub-144.00 region.
- There is an interim support at the 100-day SMA just above 143.00.
EUR/JPY fades Wednesday’s small advance and drops to new multi-day lows below the 144.00 level on Thursday.
While further side-lined trading seems likely for the time being, the cross could face bouts of selling pressure and confront the provisional 100-day SMA at 143.09. The loss of the latter could spark a deeper move to the weekly low at 142.14 (February 24).
In the meantime, while above the 200-day SMA, today at 141.75, the outlook for the cross is expected to remain positive.
EUR/JPY daily chart
The UK growth numbers are slated for release on Friday, March 10 at 07:00 GMT as we get closer to the release time, here are forecasts from economists and researchers of three major banks regarding the upcoming Gross Domestic Product (GDP) data.
January GDP is expected at 0.1% month-on-month vs. -0.5% in December.
ING
“UK economic output fell sharply in December, and probably only partially rebounded in January. Admittedly, these monthly GDP figures have been hard to read, owing to distortions surrounding both the Queen’s funeral last September and then the World Cup (which threw around consumer services activity). That December plunge, however, means that the economy is likely to register an overall first-quarter GDP decline (our current forecast is for a 0.2% fall). The underlying trend in the economy appears to be one of very gradual contraction, thanks in part to an ongoing downtrend in retail spending. We’re expecting a technical recession in the UK in the first half of this year, albeit one that’s not much to write home about. The fall in wholesale gas prices should help consumer bills fall by the summer, which should limit further damage to consumer spending.”
SocGen
“We expect a minor fall of 0.1% in services output. Manufacturing output should have been roughly flat but the milder-than-usual weather should have reduced energy output with the result being a fall of 0.2% in overall industrial production. Construction output should have been flat. Putting that altogether leads to a forecast of a 0.1% fall in both mom and 3m/3m GDP growth in January.”
Credit Suisse
“We expect UK GDP to fall by 0.2% MoM in January.”
- NZD/USD gains strong positive traction amid a modest USD pullback from a multi-month top.
- Bets for a 50 bps Fed rate hike in March should help limit the USD losses and act as a headwind.
- Looming recession risks could also contribute to capping the upside for the risk-sensitive Kiwi.
The NZD/USD pair attracts some buyers on Thursday and moves away from its lowest level since mid-November, around the 0.6085 region touched the previous day. The momentum lifts spot prices to a two-day high, closer to mid-0.6100s heading into the North American session, and is sponsored by a modest US Dollar weakness.
Signs of stability around the equity markets prompt traders to take some profits and lighten their bullish bets around the safe-haven Greenback, which, in turn, is seen benefitting the risk-sensitive Kiwi. That said, looming recession fears, along with fading hopes over a strong economic recovery in China, should keep a lid on any optimism in the markets. Apart from this, expectations for more aggressive policy tightening by the Federal Reserve should act as a tailwind for the buck and contribute to capping the upside for the NZD/USD pair.
In fact, investors started pricing in a greater chance of a jumbo 50 bps lift-off at the March FOMC meeting after Fed Chair Jerome Powell said that interest rates would have to go higher and possibly faster to tame stubbornly high inflation. This is evident from elevated US Treasury bond yields and favours the USD bulls. The market sentiment, meanwhile, remains fragile amid growing worries about economic headwinds stemming from rapidly rising borrowing costs, which adds credence to the near-term positive outlook for the Greenback.
The aforementioned fundamental backdrop suggests that the path of least resistance for the NZD/USD pair is to the downside. Hence, any subsequent move up might still be seen as a selling opportunity and runs the risk of fizzling out rather quickly. Next on tap is the release of the usual Weekly Initial Jobless Claims data from the US. This, along with the US bond yields and the broader risk sentiment, should influence the USD price dynamics and provide some impetus to the NZD/USD pair ahead of the crucial NFP report on Friday.
Technical levels to watch
Senior Economist at UOB Group Alvin Liew and Rates Strategist Victor Yong reviews the recent semiannual testimonies by Chief J.Powell.
Key Takeaways
“FOMC Chair Powell in his testimony to the Senate Banking Committee (7 Mar) was hawkish as he warned that the process of getting inflation back to 2% has ‘a long way to go’ and the ultimate level of interest rates is likely to be higher than previously anticipated. He added restoring price stability will likely require the Fed to maintain a restrictive policy stance for some time.”
“Revising Our Fed Outlook – Terminal Rate Extended Further, Mar FOMC A Close Call. Powell’s latest Congressional testimony not only indicated we are not near the end [of the tightening cycle], but we may have underestimated when the Fed hikes will end. We continue to expect the Fed to hike in the next two meetings in clips of 25bps at the Mar and May 2023 FOMC meetings, but we further expect another two more 25 bps hikes in Jun and Jul FOMC, bringing our terminal FFTR level to 5.50-5.75%. We continue to expect this terminal rate of 5.75% to last through 2023. And while we keep our the 25bps rate hike call for Mar FOMC unchanged, we note that it is now a very close call, with the increasing risk for a bigger 50-bps hike, according to the changes in market pricing.’
EUR/CHF has struggled to surpass the 1.005/1.0100 area. Economists at ING expect the pair to tick down toward 0.9800/0.9825.
The 1.0050/1.0100 area is becoming a hard ceiling
“The SNB has been selling FX since 3Q last year and given Swiss inflation is still proving very sticky, it looks like the 1.0050/1.0100 area is becoming a hard ceiling for EUR/CHF in the first half of the year.”
“We would say the direction of travel here is back towards the 0.9800/0.9825 area over the coming months. It could even be lower were the SNB to surprise with a 75 bps hike on 23 March.”
GBP/USD broke out of its descending triangle and traded at a low of 1.1804 low yesterday. The pair has since stabilised. Economists at OCBC Bank analyze Cable’s outlook.
Support at 1.18, resistance at 1.19
“Next catalyst is likely to still come from the USD side of the equation and that puts focus on US NFP data tomorrow.”
“Daily momentum shows signs of turning mild bearish while the decline in RSI moderated near oversold conditions.”
“Support at 1.18, 1.1720 levels.”
“Resistance at 1.19 (200-Day Moving Average), 1.1950 levels.”
The CAD lost further ground after the Bank of Canada kept interest rates on hold as expected at 4.50%. Economists at Société Générale expect the USD/CAD pair to grind higher toward 1.3860, then 1.3980/1.4040
CAD to languish
“The Loonie looks poised to head towards 1.3860 and the peak of last year at 1.3980/1.4040.”
“Disappointing US employment or a second successive month of above forecast Canadian job gains and hawkish BoC repricing could elicit CAD dip buying at oversold levels relative to 2y2y forwards.”
Tomorrow will be the last BoJ meeting under the leadership of the departing Governor Haruhiko Kuroda. Will the departing governor leave with a big bang? Ulrich Leuchtmann, Head of FX and Commodity Research at Commerzbank, reports.
Kuroda’s final bang?
“I am not part of the camp of all those who expect a major change of monetary policy tomorrow.”
“Anyone trying to predict their approach with the rules of logic will only ever be able to project some of the BoJ’s actions. There is still a lot that is beyond rational explanation and that makes BoJ meetings tense.”
- Gold price attracts some buying amid a modest US Dollar pullback from a multi-month top.
- Bets for a 50 bps rate hike by the Federal Reserve to limit the USD downfall and cap gains.
- Traders might also prefer to wait on the sidelines ahead of the key US jobs data on Friday.
Gold price edges higher on Thursday, albeit lacks any follow-through buying and remains confined well within the previous day's broader trading range. The XAU/USD currently trades just above the $1,815 level and seems vulnerable to prolonging its downward trajectory witnessed since early February.
Weaker US Dollar, recession fears lend support to Gold price
The US Dollar (USD) bulls opt to take some profits off the table following the recent strong bullish run to over a three-month top. This, in turn, is seen as a key factor lending some support to the US Dollar-denominated Gold price. Apart from this, a generally softer risk tone - amid looming recession risks - benefits traditional safe-haven assets and acts as a tailwind for the XAU/USD. The upside, however, remains capped amid the prospects for more aggressive policy tightening by the Federal Reserve (Fed).
Hawkish Federal Reserve expectations cap gains for Gold price
In fact, the markets are now pricing a greater chance of a 50 basis points (bps) lift-off at the next Federal Open Market Committee (FOMC) meeting on March 21-22. The bets were reaffirmed by hawkish comments by Fed Chair Jerome Powell on Wednesday, reiterating that interest rates would have to go higher and possibly faster to tame stubbornly high inflation. This remains supportive of elevated US Treasury bond yields and keeps a lid on any meaningful gains for the non-yielding Gold price.
Focus remains on Friday’s jobs data from United States
Hawkish Fed expectations, meanwhile, should help limit the downside for the USD, which, in turn, warrants some caution before placing bullish bets around the XAU/USD. Traders might also prefer to move to the sidelines and await the release of the closely-watched monthly jobs data from the United States (US) - popularly known as NFP - on Friday. Hence, strong follow-through buying is needed to confirm that the Gold price has formed a bottom near the $1,800 mark and positioning for a further appreciating move.
Thursday’s US macro data could provide some impetus
Market participants now look to the US economic docket, featuring the release of Challenger Job Cuts and the usual Weekly Initial Jobless Claims data later during the early North American session. This, along with the US bond yields, should influence the USD price dynamics. Apart from this, the broader risk sentiment could provide some impetus to Gold price. The fundamental backdrop, however, favours bearish traders and suggests that the path of least resistance for the XAU/USD is to the downside.
Gold price technical outlook
From a technical perspective, bearish traders need to wait for a sustained break below the $1,800 round figure, which coincides with the 100-day Simple Moving Average (SMA), before placing fresh bets. The gold price might then accelerate the fall towards testing the next relevant support near the $1,775 horizontal zone before eventually dropping to the $1,740-$1,738 region.
On the flip side, any subsequent move beyond the overnight swing high, around the $1,824 area, could attract fresh sellers near the $1,835 horizontal zone. A sustained strength beyond the latter could trigger a short-covering rally and lift Gold price towards the monthly peak, around the $1,858 region. This is followed by the 50-day SMA barrier, currently near the $1,869 region, which should keep a lid on any further gains, at least for the time being.
Key levels to watch
The Dollar is consolidating near recent highs. Economists at ING expect a quiet session ahead of tomorrow's February US jobs release.
DXY could push up to 107.80
“Expect US Dollar Index (DXY) to stay supported into the US Nonfarm Payrolls tomorrow.”
“We doubt the Dollar will turn substantially lower ahead of the 22 March FOMC meeting and indeed there is an outside risk that DXY could push up to 107.80 were US February activity and price data not to slow as much as expected.”
EUR/CHF is trading below the 1.00 level. Economists at Danske Bank expect the pair to remain below parity.
SNB to hike 50 bps in March
“The Swiss National Banks (SNB) Governor Jordan reiterated that monetary policy was still too loose and that the need for further tightening could not be excluded. With headline and core inflation showing no signs of easing and Jordan not closing the door for another significant policy rate increase, we now expect the SNB to increase its policy rate by 50 bps (up from 25 bps) at its meeting on 23 March.”
“Likewise we maintain our view of a cap in EUR/CHF of around 1.00 given continuous intervention by the SNB to limit significant depreciation of the Swiss Franc.”
A potential test of 7.0200 remains on the cards once USD/CNH clears the 7.0000 barrier, comment UOB Group’s Economist Lee Sue Ann and Markets Strategist Quek Ser Leang.
Key Quotes
24-hour view: “We highlighted yesterday that the ‘overbought USD advance could edge above 7.0000 but it remains to be seen if it can stay above this level’. Our expectations did not turn out as USD dropped to 6.9475 before rebounding to close at 6.9699 (-0.37%). The price movements are likely part of a consolidation phase. Today, USD is likely to trade sideways, expected to be between 6.9400 and 6.9840.”
Next 1-3 weeks: “There is no change in our view from yesterday (08 Mar, spot at 6.9880). As highlighted, while the outlook for USD is still positive, it has to break and stay above 7.0000 before further advance to 7.0200 is unlikely. The upside risk is intact as long as USD stays above 6.9140 (no change in ‘strong support’ level from yesterday).”
- AUD/USD attracts some buying on Thursday amid a modest USD pullback from a multi-moth peak.
- A combination of factors should limit the USD losses and cap any meaningful upside for the major.
- The RBA’s dovish shift also suggests that the path of least resistance for the pair is to the downside.
The AUD/USD pair regains positive traction on Thursday and moves further away from a nearly four-month low, around the 0.6570-0.6565 area touched the previous day. The pair maintains its bid tone through the first half of the European session and is currently placed near the daily high, comfortably above the 0.6600 round-figure mark.
The US Dollar (USD) eases from over a three-month high and turns out to be a key factor pushing the AUD/USD pair higher. The USD downtick, meanwhile, lacks any obvious fundamental catalyst and is more likely to remain limited amid expectations for more aggressive policy tightening by the Fed. In fact, the markets are now pricing in a jumbo 50 bps lift-off at the next FOMC policy meeting on March 21-22 and the bets were reaffirmed by hawkish comments by Fed Chair Jerome Powell.
On the second day of his testimony to the US Congress, Powell reiterated on Wednesday that interest rates would have to go higher and possibly faster to tame stubbornly high inflation. This remains supportive of elevated US Treasury bond yields and supports prospects for the emergence of some USD dip-buying. Apart from this, the prevalent cautious mood might further contribute to limiting losses for the safe-haven Greenback and capping gains for the risk-sensitive Australian Dollar.
The market sentiment remains fragile amid worries about economic headwinds stemming from rapidly rising borrowing costs. Adding to this, fading optimism over a strong economic recovery in China tempers investors' appetite for riskier assets. This, along with the Reserve Bank of Australia's dovish shift earlier this week, signalling that it might be nearing the end of its rate-hiking cycle, warrants caution for bulls and positioning for any further appreciating move for the AUD/USD pair.
Market participants now look to the US economic docket, featuring the release of Challenger Job Cuts and the usual Weekly Initial Jobless Claims data later during the early North American session. This, along with the US bond yields and the broader risk sentiment, should influence the USD price dynamics and provide some impetus to the AUD/USD pair. The focus, however, will remain glued to the closely-watched US monthly employment report, popularly known as the NFP on Friday.
Technical levels to watch
- EUR/USD picks up some upside traction and revisits 1.0560.
- The dollar appears mildly offered ahead of Friday’s Payrolls.
- Weekly US Initial Claims will be the only release of note on Thursday.
The combination of some profit taking in the greenback and bargain hunters breath in some life to EUR/USD and lift it to the 1.0565/70 band on Thursday.
EUR/USD cautious ahead of US NFP
EUR/USD trades with decent gains near 1.0570 and leaves behind two consecutive daily pullbacks, including a drop to 2-month lows near 1.0520 on Wednesday.
The so far recovery in the pair comes amidst the moderate pullback in the dollar, which appears propped up at the same time by some lack of traction in US yields, all against the backdrop of rising cautiousness among traders ahead of the release of US Non-farm Payrolls on Friday.
In the meantime, firmer conviction of a 50 bps rate hike by the Fed at its March gathering continue to support the recent solid bounce in the greenback, while speculation that the ECB could extend its hiking cycle beyond the March meeting has so far failed to lent lasting legs to the European currency.
Nothing scheduled data wise in the old continent should leave all the attention to the usual weekly Initial Claims across the pond.
What to look for around EUR
EUR/USD gives some signs of life following the recent drop to multi-week lows in the 1.0525/20 band in the wake of the hawkish intervention by Fed’s Powell before the Congress (Tuesday and Wednesday).
In the meantime, price action around the European currency should continue to closely follow dollar dynamics, as well as the potential next moves from the ECB after the bank has already anticipated another 50 bps rate raise at the March event.
Back to the euro area, the likely continuation of the normalization process by the ECB beyond the March meeting carries the potential to reignite recession concerns.
Key events in the euro area this week: Germany Final Inflation Rate, ECB Lagarde (Friday).
Eminent issues on the back boiler: Continuation of the ECB hiking cycle amidst dwindling bets for a recession in the region and still elevated inflation. Impact of the Russia-Ukraine war on the growth prospects and inflation outlook in the region. Risks of inflation becoming entrenched.
EUR/USD levels to watch
So far, the pair is advancing 0.16% at 1.0558 and the breakout of 1.0712 (55-day SMA) would target 1.0804 (weekly high February 14) en route to 1.1032 (2023 high February 2). On the downside, the initial support comes at 1.0524 (monthly low March 8) seconded by 1.0481 (2023 low January 6) and finally 1.0324 (200-day SMA).
GBP/USD has traded down to 1.1800. Economists at ING expect the pair to extend its fall toward 1.1650.
Sterling risks getting run over by more hawkish central banks elsewhere
“We highlighted the outside risk of GBP/USD trading down to 1.1650. This certainly looks like the direction of travel looking at the stronger Fed policy trajectory now.”
“We continue to favour EUR/GBP trading up to and staying near 0.90 over coming months given the risk of the Bank of England shifting to a pause far earlier than the Fed or the ECB.”
- USD/JPY meets with some supply on Thursday and is pressured by a combination of factors.
- Recession fears benefit the safe-haven JPY and weigh on the pair amid a modest USD slide.
- The Fed-BoJ policy divergence favours bulls and should help limit any meaningful downfall.
The USD/JPY pair comes under some selling pressure on Thursday and moves away from its highest level since mid-December, around the 137.90 region touched the previous day. The pair extends its steady intraday descent through the first half of the European session and drops to a fresh daily low, around the 136.20 region in the last hour.
Worries about a deeper global economic downturn continue to weigh on investors' sentiment, which, in turn, is seen benefiting the safe-haven Japanese Yen (JPY) and dragging the USD/JPY pair lower. The concerns were further fueled by softer Chinese inflation figures released earlier this Thursday, which showed that domestic demand remains tepid and dashed hopes for a strong recovery in the world's second-largest economy. This, along with a modest US Dollar pullback from a three-month top, contributes to the offered toe surrounding the major.
The downside for the USD/JPY pair, however, is more likely to remain limited, at least for the time being, amid expectations that the Bank of Japan (BoJ) will stick to its dovish stance to support the fragile domestic economy. The bets were reaffirmed by the release of the final GDP print, which pointed to continued weakness in the economy. Moreover, the incoming BoJ Governor Kazuo Ueda recently stressed the need to maintain the ultra-loose policy settings and said that the central bank isn't seeking a quick move away from a decade of massive easing.
In contrast, Federal Reserve Chair Jerome Powell reiterated on Wednesday that interest rates would have to go higher and possibly faster to tame stubbornly high inflation. In fact, the markets are now pricing in a greater chance of a jumbo 50 bps lift-off at the next FOMC meeting on March 21-21, which remains supportive of elevated US Treasury bond yields. This, in turn, favours the USD bulls and supports prospects for the emergence of some dip-buying around the USD/JPY pair, warranting caution before positioning for any meaningful corrective fall.
Market participants now look to the US economic docket, featuring the release of Challenger Job Cuts and the usual Weekly Initial Jobless Claims later during the early North America session. The focus, however, will remain on the BoJ monetary policy decision, scheduled to be announced during the Asian session on Friday. This will be followed by the US monthly jobs data, popularly known as the NFP report, which should help investors to determine the next leg of a directional move for the USD/JPY pair.
Technical levels to watch
The continuation of the upside bias could encourage USD/JPY to retest the 138.20 zone in the next few weeks, note UOB Group’s Economist Lee Sue Ann and Markets Strategist Quek Ser Leang.
Key Quotes
24-hour view: “While we expected USD to rise further yesterday, we were of the view that ‘138.20 could be out of reach’. USD subsequently rose to 137.91, dropped to 136.46 before rebounding to end the day at 137.34 (+0.15%). The price actions are likely part of a consolidation phase. Today, USD is likely to trade in a range, expected to be between 136.50 and 137.55.”
Next 1-3 weeks: “Yesterday (08 Mar, spot at 137.30), we highlighted that the surge in momentum from Tuesday is expected to lead to further USD strength, likely towards 138.20. There is no change in our view. Only a breach of 136.20 (no change in ‘strong support’ level) would indicate that USD is not strengthening further.”
The Bank of Canada (BoC) left rates unchanged. The Canadian Dollar fell to its weakest level since October against the US Dollar. The Loonie is expected to continue under downside pressure, economists at Commerzbank report.
No surprise from the BoC as it takes a break
“The BoC left its key rate unchanged at 4.5% as expected. In its statement it confirmed its wait and see approach, but underlined that it was prepared to hike rates further if that was necessary to return the rate of inflation to the 2% target. So no surprise there.”
“The BoC’s approach stands in sharp contrast to the Fed and ECB, as they have signalled further tightening. As a result, the Loonie should continue to find it difficult to assert itself against USD and EUR.”
“The market will probably be positioning itself for the labor market reports from both the US and Canada which are due for publication on Friday. The US data is likely to be of greater effect as far as USD/CAD is concerned. In case of a strong Canadian report combined with equally strong US data the Loonie is likely to experience only limited support against USD.”
Open interest in natural gas futures markets remained choppy and shrank by just 805 contracts on Wednesday, according to preliminary readings from CME Group. Volume followed suit and went down for the second straight session, this time by around 36.8K contracts.
Natural Gas: Solid support aligns at $2.50
Prices of the natural gas retreated modestly on Wednesday amidst the ongoing weekly choppiness. The daily pullback was on the back of diminishing open interest and volume and bolsters the idea that further weakness looks unlikely in the very near term at least. The commodity, in the meantime, seems well supported by the $2.50 region per MMBtu for the time being.
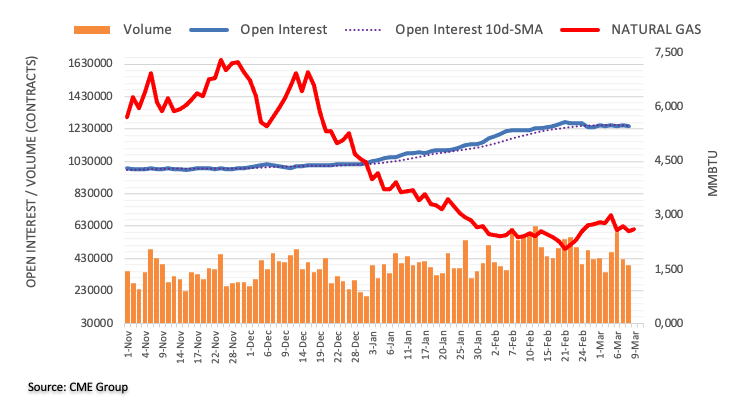
FX option expiries for Mar 9 NY cut at 10:00 Eastern Time, via DTCC, can be found below.
- EUR/USD: EUR amounts
- 1.0500 1.1b
- 1.0530 1.1b
- 1.0575 1.1b
- 1.0585 504m
- 1.0600 1.7b
- GBP/USD: GBP amounts
- 1.1950 690m
- USD/JPY: USD amounts
- 136.50 1.0b
- 137.00 1.5b
- 138.00 810m
- AUD/USD: AUD amounts
- 0.6755 570m
- 0.6785 1.3b
- USD/CAD: USD amounts
- 1.3500 1.1b
- 1.3875 605m
- EUR/GBP: EUR amounts
- 0.8915 738m
- 0.8950 684m
According to UOB Group’s Economist Lee Sue Ann and Markets Strategist Quek Ser Leang, NZD/USD could be now headed to the 0.6050 region in the short term.
Key Quotes
24-hour view: “Our expectations for NZD to drop further did not materialize as it traded between 0.6086 and 0.6138 before closing largely unchanged at 0.6105 (-0.03%). Today, NZD could continue to trade in a range, expected to be between 0.6090 and 0.6140.”
Next 1-3 weeks: “There is no change in our view from yesterday (08 Mar, spot at 0.6110) that the recent NZD weakness has resumed. Overall, as long as NZD stays below 0.6180 (‘strong resistance’ level was at 0.6195 yesterday), it is likely to weaken to 0.6050.”
“We will bring inflation back to 2% by end-2024 or end-2025,” European Central Bank (ECB) policymaker Francois Villeroy de Galhau said on Thursday.
Additional quotes
“Inflation is still too high in France and in Europe.”
“Inflation should peak during the first semester.”
Market reaction
At the time of writing, EUR/USD is 0.16% higher on the day, trading at 1.0559.
EUR/USD continues to move up and down in a narrow channel at around 1.0550. Economists at ING expect the pair to remain within 1.0500-1.0600.
ECB division could prove costly
“We were surprised to see comments from ECB dove, Ignazio Visco, yesterday openly criticising ECB colleagues for making forward-looking statements about monetary policy. Public dissension amongst monetary policymakers is never welcomed by currency markets. And presumably, ECB President Christine Lagarde's job will only become harder on this front as the ECB takes rates higher into the summer.”
“For the time being expect EUR/USD to trade in a 1.0500-1.0600 range and tomorrow's US jobs report will determine whether it needs to break below 1.0500.”
- GBP/USD gains some positive traction for the second successive day amid a modest USD downtick.
- The fundamental backdrop warrants caution before positioning for any further appreciating move.
- Bets for a 50 bps Fed rate hike in March, recession risks could limit the USD losses and cap the pair.
The GBP/USD pair builds on the overnight modest bounce from the 1.1800 neighbourhood, or its lowest level since November and edges higher for the second successive day on Thursday. The pair sticks to a mildly positive tone and trades above the mid-1.1800s during the early part of the European session, though any meaningful upside still seems elusive.
The US Dollar (USD) bulls take a breather following the recent strong run-up to over a three-month high, which, in turn, is seen as a key factor lending some support to the GBP/USD pair. That said, the prospects for more aggressive policy tightening by the Federal Reserve (Fed), along with looming recession risks, act as a tailwind for the safe-haven Greenback and should cap gains for the major, at least for the time being.
In fact, the markets are now pricing in a greater chance of a jumbo 50 bps lift-off at the upcoming FOMC monetary policy meeting on March 21-22. The bets were lifted by hawkish comments by Fed Chair Jerome Powell, reiterating that interest rates would have to go higher and possibly faster to tame stubbornly high inflation. This remains supportive of elevated US Treasury bond yields and favours the USD bulls.
The market sentiment, meanwhile, remains fragile amid growing worries about economic headwinds stemming from rapidly rising borrowing costs. Apart from this, fading optimism over a strong economic recovery in China tempers investors' appetite for perceived riskier assets, which is evident from a softer tone around the equity markets and adds credence to the near-term positive outlook for the Greenback.
Apart from this, speculations that the Bank of England (BoE) would pause the current tightening cycle suggest that the path of least resistance for the GBP/USD pair is to the downside. Hence, any subsequent move up might still be seen as a selling opportunity. Traders now look to the US macro data - Challenger Job Cuts and the usual Weekly Initial Jobless Claims - for a fresh impetus and short-term opportunities.
Technical levels to watch
Considering advanced prints from CME Group for crude oil futures markets, open interest rose for the second session in a row on Wednesday, this time by around 5.5K contracts. On the other hand, volume kept the erratic activity unchanged and dropped by more than 144K contracts.
WTI: Next support comes near $73.80
Prices of the barrel of the WTI extended the weekly decline on Wednesday. The downtick was in tandem with increasing open interest and allows for the continuation of the selling pressure. That said, the immediate contention now emerges at the weekly low near $73.80 (February 22, 23).
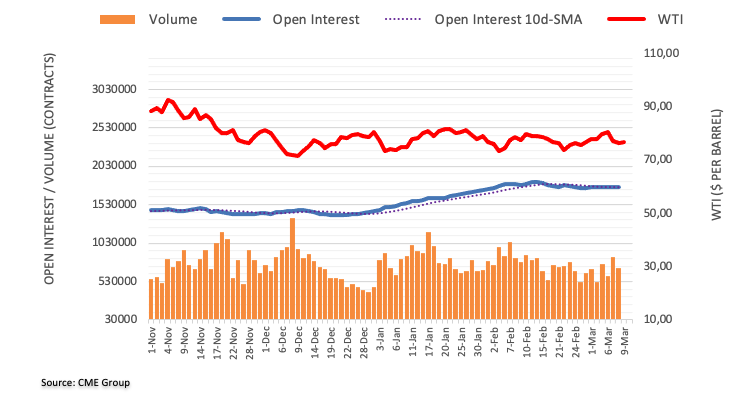
Kit Juckes, Chief Global FX Strategist at Société Générale, expects the JPY, CAD and AUD to remain under downside pressure in the short term.
USD/CHF is closer to being a sell than DXY is
“I can see no support coming for the Yen, the Loonie or even the Australian Dollar in the near-term.”
“But as the SNB reminds us, it’s more allergic to inflation than even the most hawkish central banks, GBP/CHF charts look ominous (sigh) and USD/CHF is closer to being a sell than DXY is.”
“Now, we head onwards to Friday’s BoJ meeting, UK GDP data and of course, US ISM and jobs. Thursday is setting itself up to be an in-between, not-very-exciting day. Maybe it’ll surprise. Maybe the snow will stick, the sun will come out and I’ll have a great day.”
In the view of UOB Group’s Economist Lee Sue Ann and Markets Strategist Quek Ser Leang, extra pullbacks could motivate GBP/USD to revisit the 1.1750 zone in the near term.
Key Quotes
24-hour view: “After the sharp drop on Tuesday, we highlighted yesterday that ‘While further sharp decline is unlikely, there is room for GBP to weaken to 1.1790 before stabilization is likely’. Our expectations did not materialize as GBP traded mostly sideways, aside from dipping briefly to a low of 1.1805 in NY trade. GBP could continue to trade sideways today, expected to be within a range of 1.1800/1.1865.”
Next 1-3 weeks: “Our update from yesterday (08 Mar, spot at 1.1830) is still valid. As highlighted, while GBP could weaken further, the pace of any further decline is likely to be slower. Support is at 1.1750. The downside risk is intact as long as GBP stays below 1.1950 (no change in ‘strong resistance’ level) in the next couple of days.”
CME Group’s flash data for gold futures markets noted traders increased their open interest positions by around 1.2K contracts on Wednesday, extending the uptrend in place since February 28. Volume, instead, maintained the choppy performance well and sound and shrank by around 21.8K contracts.
Gold: A drop to $1800 remains in store
Wednesday’s inconclusive price action in gold came amidst rising open interest and this suggests that extra consolidation remain likely in the very near term. Against that, a probable drop to the 2023 low near the $1800 mark per ounce troy should not be discarded for now.
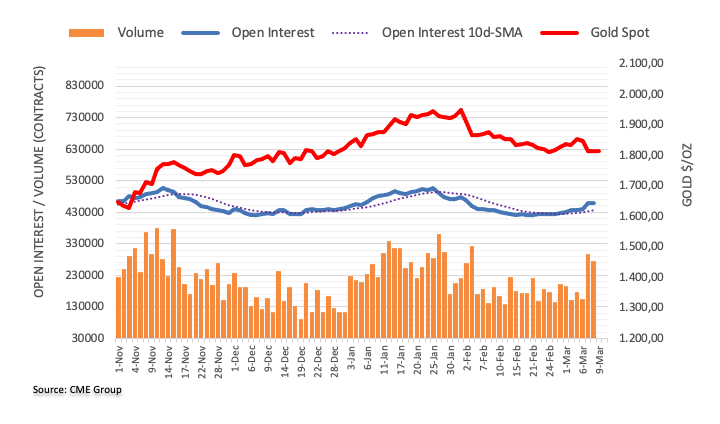
Today, Ulrich Leuchtmann, Head of FX and Commodity Research at Commerzbank, is interested in the question of how FX traders would have to prepare for a scenario where central bankers’ nightmare were to become reality – if the massive rate hikes that were implemented and are yet to be realized were not sufficient to control inflation.
What would happen to EUR/USD in an inflationary nightmare scenario?
“I think anyone choosing between USD and EUR will be more likely to decide in favor of the greenback in view of these criteria. The ECB seems to have the reputation on the market of being a bit slow in the uptake. The fact that the Euro is not trading at stronger levels is likely to be at least partially due to its long hesitation. The FX market punishes those who come too late with a weak currency.
“I was asked yesterday why I nonetheless expect EUR/USD to be stronger at year-end than now anyway. The answer is simple: because we project that this horror scenario does not arise. As a result every day when this does not happen is a good day for the European single currency.”
- USD/CAD is seen consolidating its recent strong gains to the highest level since October.
- A modest USD pullback from a multi-month top cap gains amid an uptick in Oil prices.
- The fundamental backdrop supports prospects for an extension of the bullish trajectory.
The USD/CAD pair enters a bullish consolidation phase and oscillates in a narrow trading band around the 1.3800 mark, just below its highest level since October touched earlier this Thursday.
The subdued price action comes on the back of a modest US Dollar pullback from over a three-month high. This, along with an uptick in Crude Oil prices underpin the commodity-linked Loonie and acts as a headwind for the USD/CAD pair. That said, the downside remains cushioned amid hawkish Fed expectations and worries about a deeper global economic downturn.
In fact, the markets have started pricing in a jumbo 50 bps lift-off at the upcoming FOMC meeting on March 21-22. The bets were lifted by Fed Chair Jerome Powell on Wednesday, reiterating that interest rates would have to go higher and possibly faster to tame stubbornly high inflation. This remains supportive of elevated US Treasury bond yields and favours the USD bulls.
Meanwhile, the prospects for further tightening the Fed add to worries about economic headwinds stemming from rapidly rising borrowing costs. This, along with fading optimism over a strong Chinese economic recovery, which could dent fuel demand, should keep a lid on Crude Oil prices, suggesting that the path of least resistance for the USD/CAD pair is to the upside.
The bullish outlook is reinforced by the fact that the Bank of Canada became the first major central bank to pause its rate-hiking cycle on Wednesday amid signs of easing inflationary pressure. The USD/CAD pair seems poised to aim to reclaim the 1.3900 mark and extend the positive momentum further towards the October 2022 swing high, around the 1.3975-1.3980 zone.
Traders now look to the US economic docket, featuring the release of Challenger Job Cuts and the usual Weekly Initial Jobless Claims data, due later during the early North American session. The focus, however, will remain on the monthly Canadian jobs data, which, along with the crucial US NFP report, should provide a fresh directional impetus to the USD/CAD pair.
Technical levels to watch
Further weakness could drag EUR/USD to the 1.0485 level in the next weeks, suggest UOB Group’s Economist Lee Sue Ann and Markets Strategist Quek Ser Leang.
Key Quotes
24-hour view: “We expected EUR to weaken further yesterday but we were of the view that ‘any decline is unlikely to break the major support at 1.0485’. We indicated ‘there is another support at 1.0530’. EUR dipped to 1.0523 in Asian trade before trading sideways for the rest of the sessions. EUR appears to have moved into a consolidation phase, and it is likely to trade in a range today, expected to be between 1.0520 and 1.0575.”
Next 1-3 weeks: “There is not much to add to our update from yesterday (08 Mar, spot at 1.0550). As highlighted, after the sharp drop on Tuesday, downward momentum has improved, albeit not much. All in all, as long as EUR does not move above 1.0630 (‘strong resistance’ was at 1.0650 yesterday), it is likely to gravitate lower towards 1.0485.”
- The index seems to have met some resistance near 105.90.
- Bets for a 50 bps rate hike by the Fed continue to rise.
- Weekly Claims, FOMC’s Barr next of note on Thursday.
The greenback, in terms of the USD Index (DXY), starts the European trading hours slightly on the defensive and around the 105.50 region on Thursday.
USD Index looks at yields, data
The index navigates a narrow range amidst a broad consolidative stance, which is in turn propped up by increasing cautiousness ahead of the release of the US jobs report on Friday.
In the meantime, investors continue to digest Powell’s testimonies (Tuesday and Wednesday) against the backdrop renewed bets of a 50 bps interest rate hike by the Federal Reserve at the March 22 event.
According to FedWatch Tool measured by CME Group, the probability of a half point raise in March hovers around 77%, from just over 9% a month ago.
In the docket, Initial Jobless Claims will be the sole release seconded by the speech of FOMC M.Barr (permanent voter, centrist).
What to look for around USD
The index is expected to keep the prudent stance well in place for the time being in light of the upcoming publication of the US Non-farm Payrolls (March 10).
The dollar now appears well supported by firmer expectations of a 50 bps rate raise at the Fed’s gathering later in the month. This view has been propped up by hawkish message from Fed speakers from many weeks now and lately by Chief Powell at both his testimonies earlier in the week.
In addition, the still elevated inflation as well as the solid labour market and the resilient economy in general also seem to underpin the tighter-for-longer stance from the Federal Reserve.
Key events in the US this week: Initial Jobless Claims (Thursday) – Nonfarm Payrolls, Unemployment Rate, Monthly Budget Statement (Friday).
Eminent issues on the back boiler: Rising conviction of a soft landing of the US economy. Persistent narrative for a Fed’s tighter-for-longer stance. Terminal rates near 5.5%? Fed’s pivot. Geopolitical effervescence vs. Russia and China. US-China trade conflict.
USD Index relevant levels
Now, the index is retreating 0.15% at 105.50 and the breakdown of 104.09 (weekly low March 1) would open the door to 103.52 (55-day SMA) and finally 102.58 (weekly low February 14). On the other hand, the next up-barrier aligns at 105.88 (2023 high March 8) seconded by 106.60 (200-day SMA) and then 107.19 (weekly high November 30 2022).
The Swiss Franc remained in a relatively tight range in February after initially strengthening from above parity versus the Euro. Economists at MUFG Bank expect the pair to trade slightly above 1.00 over the coming months.
Renewed CHF strength vs. EUR seems the greater risks over the short-term
“Renewed CHF strength versus EUR seems the greater risks over the short-term, especially if EUR/USD continues to drift back toward parity.”
“The SNB is using FX to help fight inflation and has been selling foreign currency bought previously when fighting deflation risks. This is likely to continue and hence Eurozone growth improvement after a weak H1, and improved broader risk sentiment as inflation declines will only have a limited impact on weakening CHF.”
“EUR/CHF – Q1 2023 1.0000 Q2 2023 1.0100 Q3 2023 1.0200 Q4 2023 1.0100.”
Here is what you need to know on Thursday, March 9:
Following Tuesday impressive rally, the US Dollar Index (DXY) closed flat on Wednesday and edged slightly lower early Thursday. Investors seem to have moved to the sidelines ahead of Friday's eagerly-awaited February jobs report from the US. Later in the session, weekly Initial Jobless Claims will be featured in the US economic docket.
On the second day of his semi-annual testimony, FOMC Chairman Jerome Powell said that they have not yet made any decisions about the March policy meeting and reminded that they are data-dependent. Meanwhile, the data from the US showed that employment in the private sector increased by 242,000 in February. Nevertheless, the DXY spent the day moving up and down in a narrow channel and the benchmark 10-year US Treasury bond yield registered small gains on Wednesday. Wall Street's main indexes closed mixed after having suffered heavy losses on Tuesday.
Following its March policy meeting, the Bank of Canada (BoC) announced left its benchmark interest rate unchanged at 4.5% as expected. In its policy statement, the BoC repeated that it intends to hold the rate at this level, "conditional on the economy developing broadly in line with its forecasts." USD/CAD continued to push higher and touched its strongest level since October at 1.3817 before retreating to the 1.3800 area early Thursday.
USD/JPY turned south during the Asian trading hours on Thursday and broke below 137.00. The data from Japan showed that the real Gross Domestic Product (GDP) grew at an annualized rate of 0.1% in the fourth quarter, missing the market expectation of 0.8% by a wide margin. On Friday, the Bank of Japan will announce its monetary policy decisions at the last policy meeting led by Governor Haruhiko Kuroda.
EUR/USD failed to make a decisive move in either direction on Wednesday. The pair continues to move up and down in a narrow channel at around 1.0550 in the European morning on Thursday.
GBP/USD registered small daily gains on Wednesday and edged slightly higher toward 1.1850 early Thursday. The UK's Office for National Statistics will release the GDP, Industrial Production and Trade Balance data for January on Friday.
Gold price managed to hold above $1,810 on Wednesday as the US Treasury bond yields held steady. Early Thursday, the benchmark 10-year US T-bond yield is testing 4%, not allowing XAU/USD to gain traction.
Bitcoin extended its weekly slide and lost nearly 3% on the day, touching its lowest level since mid-February near $21,500. BTC/USD stays relatively quiet in the European morning and fluctuates at around $21,700. Ethereum continued to push lower and came within a touching distance of $1,500 on Wednesday before recovering modestly on Thursday. ETH/USD was last seen rising 0.5% on the day at $1,540.
- Gold price struggles to convince buyers inside a bearish chart formation.
- US Dollar Index traces two-year Treasury bond yields to retreat from multi-day high.
- Fears of higher US taxes, fading recovery hopes from China and hawkish Fed bets challenge XAU/USD bulls.
- Earlier signals for Friday’s US jobs report appear promising ahead of second-tier data.
Gold price (XAU/USD) remains indecisive around $1,813 during the initial hours of Thursday’s European session as traders seek more clues to defend the corrective bounce off a one-week low. Also challenging the metal’s immediate moves is a lack of major data/events, as well as a cautious mood ahead of Friday’s all-important US employment report for February.
The bullion bounced off a one-week low earlier in the day while cheering the US Dollar’s recent retreat amid the two-year Treasury bond yields’ pullback from the highest levels since 2007. That said, the US Dollar Index (DXY) snaps a two-day uptrend while easing from the highest levels since December 01, 2022, down 0.13% intraday near 105.55 by the press time, whereas the US two-year Treasury bond yields drop half a percent on a day to 5.05%
It should be noted that the hawkish comments from Fed Chair Jerome Powell, showing the readiness for further rate hikes if needed, join the optimistic prints of employment clues to challenge the XAU/USD’s latest rebound.
On the same line could be disappointment from China’s inflation data for February. Furthermore, the fears of higher taxes in the world’s biggest economy, the US, as well as the political chaos relating to it as US President Joe Biden proposes raising corporation tax from 21% to 28% in his latest budget guide ahead of Friday’s release, also challenge Gold buyers.
While portraying the mood, the S&P 500 Futures struggles for clear directions after bouncing off a one-week low the previous day. Further, the US 10-year Treasury bond yields rise to 3.99%, up one basis point (bp) on a day.
Looking ahead, US Initial Jobless Claims for the week ended on March 03 will join the Challenger Job Cuts for February to offer more details to predict Friday’s top-tier employment data, mainly the Nonfarm Payrolls (NFP) and can direct intraday XAU/USD moves.
Gold price technical analysis
Gold price portrays a “bear flag” on the hourly formation, suggesting the precious metal’s further downside on confirmation. Adding strength to the downside bias for the XAU/USD is the looming bear cross on the MACD and the latest retreat in RSI (14), not to forget the sustained trading below the 200-Hour Moving Average (HMA).
It’s worth noting, however, that the bullion needs to provide a clear break of the flag’s lower line, around $1,812 by the press time, to convince the XAU/USD sellers to aim for the $1,772 theoretical target.
During the fall, the $1,800 threshold and mid-December 2022 low near $1,775 may act as intermediate halts.
Alternatively, the aforementioned flag’s top line, close to $1,823 by the press time, guards the immediate upside of the Gold price ahead of the 200-HMA level of $1,830. Also acting as the upside hurdle is a downward-sloping resistance line from Monday, near $1,840 as we write.
Overall, Gold price is likely to remain weak but fresh selling awaits a clear break of $1,812.
Gold price: Hourly chart
-09032023-638139421682057573.png)
Trend: Further downside expected
- GBP/JPY meets with a fresh supply on Thursday and drops closer to the overnight swing low.
- Looming recession risks benefit the safe-haven JPY and exert downward pressure on the cross.
- A modest pickup in demand for the GBP could limit losses ahead of the BoJ decision on Friday.
The GBP/JPY cross comes under some renewed selling pressure on Thursday and extends its steady intraday descent through the early European session. Spot prices slide back below the 162.00 mark in the last hour and remain well within the striking distance of a nearly two-week low touched on Wednesday.
The Japanese Yen (JPY) attracts some haven flows amid worries about a deeper global economic downturn and turns out to be a key factor dragging the GBP/JPY cross lower. The market concerns were fueled by weaker Chinese inflation figures, which showed that domestic demand remains tepid despite the lifting of anti-COVID measures earlier this year and pointed to a sluggish economic recovery.
The downside for the GBP/JPY cross, however, seems cushioned, at least for the time being, amid expectations that the Bank of Japan (BoJ) will stick to its dovish stance to support the fragile domestic economy. The bets were further lifted by the release of the final GDP print, which showed that Japan narrowly averted a technical recession in the final months of 2022 and reaffirmed continued weakness in the economy.
Moreover, the incoming BoJ Governor Kazuo Ueda recently stressed the need to maintain the ultra-loose policy settings and said that the central bank isn't seeking a quick move away from a decade of massive easing. This, along with a pickup in demand for the British Pound, bolstered by a modest US Dollar pullback from a three-month peak, could offer some support to the GBP/JPY cross and help limit deeper losses.
In the absence of any relevant economic data from the UK, the aforementioned mixed fundamental backdrop makes it prudent to wait for some follow-through selling below the overnight swing low, around the 161.70 area, before placing fresh bearish bets. Traders might also prefer to move to the sidelines ahead of the BoJ monetary policy decision, scheduled to be announced during the Asian session on Friday.
Technical levels to watch
Gold price is coiling up in a parallel channel, gathering strength to yield a sustained downside move below $1,800, FXStreet’s Dhwani Mehta reports.
XAU/USD challenges bullish commitments at critical 100 DMA support
“Daily closing below $1,808, where the bullish 100 DMA and the February 28 low coincide, will confirm the parallel channel breakdown, calling for a test of the $1,800 psychological level. A firm break below that support will trigger a fresh downswing toward the flattish 200-Daily Moving Average (DMA) at $1,775.”
“On the upside, the Gold price finds the initial hurdle at the previous day’s high of $1,824, above which the $1,830 round figure could be put to test. The next stop for Gold buyers is seen at the bearish 21 DMA, now at $1,836.”
See – Gold Price Forecast: XAU/USD to see a test of its 200-DMA at $1,775 – Credit Suisse
- NZD/USD seesaws around intraday high while keeping the bounce off 3.5-month low.
- 50-HMA, two-week-old horizontal resistance area restrict immediate run-up inside short-term bullish channel.
- Oscillators suggest slower grind towards the north but buyers need validation from 0.6200.
NZD/USD pares weekly losses around 0.6120 amid the early Thursday morning in Europe. In doing so, the Kiwi pair prints mild gains while snapping the previous three-day downtrend, as well as keeping the early-day rebound from the lowest levels since November 17, 2022.
While portraying the quote’s latest rebound, an ascending trend channel from Tuesday gains major attention.
That said, the NZD/USD price currently pokes a convergence of the fortnight-long horizontal resistance area, as well as the 50-Hour Moving Average (HMA), around 0.6130 by the press time.
It’s worth noting, however, that the bullish MACD signals and the recently firmer RSI (14) hint at the Kiwi pair’s further recovery, which in turn highlights the stated bullish channel’s top line near 0.6140.
In a case where the NZD/USD price remains firmer past 0.6140, a downward-sloping resistance line from March 01, close to 0.6195 by the press time, lures the buyers, a break of which could quickly propel the quote towards the monthly high of 0.6277.
On the flip side, a clear break of the stated bullish channel’s bottom line, around the 0.6100 round figure, could trigger a south-run targeting the 0.6000 psychological magnet. Though, the early September 2022 low near 0.5995 can act as an extra filter towards the south.
Overall, NZD/USD remains on the bear’s radar despite the latest corrective bounce.
NZD/USD: Hourly chart
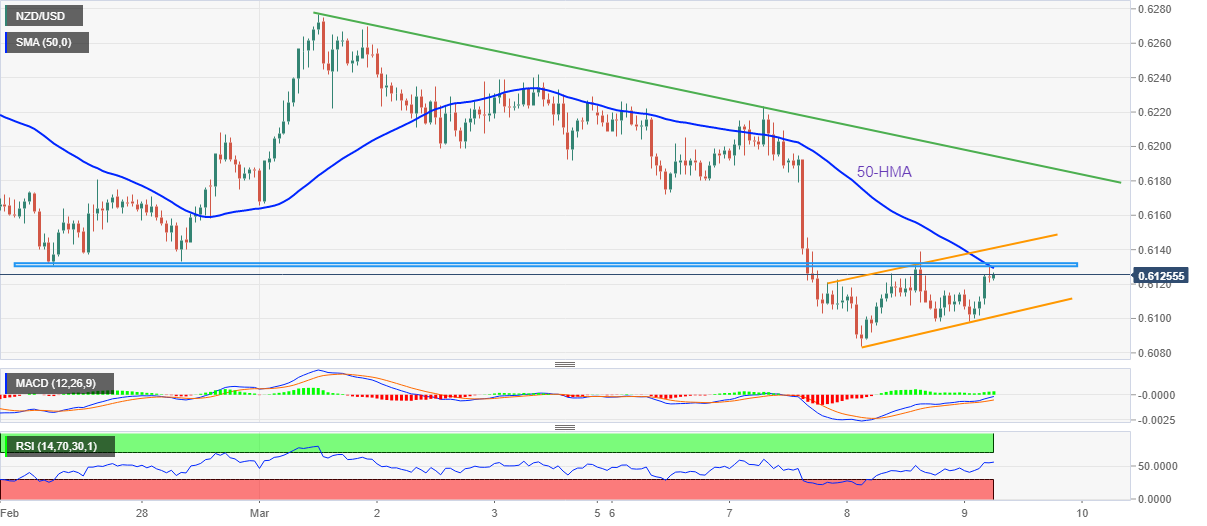
Trend: Limited recovery expected
- EUR/USD has scaled above 1.0550 after a recovery move, however, the recovery move lacks fundamental strength.
- Federal Reserve has confirmed a higher terminal rate than previously anticipated.
- European Central Bank might continue its 50 bps rate hike spell despite contracting German Retail Sales.
- EUR/USD is expected to deliver a sheer downside amid the formation of an Inverted Flag pattern.
EUR/USD has stretched its recovery above the immediate resistance of 1.0550 in the early European session. The major currency pair attempted recovery from 1.0540 as the US Dollar Index (DXY) surrendered the critical support of 105.20. For building an upside bias, the shared currency pair has to fulfill plenty of filters.
The USD Index has shifted into a volatility contraction phase after Federal Reserve (Fed) chair Jerome Powell’s hawkish remarks-led perpendicular upside. The mighty USD Index is expected to remain sideways further till the release of the United States Nonfarm Payrolls (NFP) data. S&P500 futures have trimmed minor losses, however, the downside bias is still favored as US recession fears are escalating on expectations that Federal Reserve Powell will announce a bigger rate hike in March to press down the recovery move from the Consumer Price Index (CPI).
A consideration of a higher terminal rate than previously anticipated from Federal Reserve Powell has already pushed two-year US Treasury yields to the highest level recorded in 2007. According to DoubleLine Capital LP Chief Investment Officer Jeffrey Gundlach, the bond market is doubling down on the prospect of a US recession after Federal Reserve Chair Jerome Powell warned of a return to large interest rate hikes, prompting the yield on two-year notes to rise to as much as 5.08%. The analyst believes that the Two-year US Treasury yields have not peaked yet, Bloomberg reported.
A further increase in two-year US Treasury yields could dampen interest in growth and technology stocks as investors would be required to discount them with higher rates, which will trim their future cash flows.
US Nonfarm Payrolls hogs limelight
There is no denying the fact that Federal Reserve Powell has already warned the street that the central bank is prepared to raise rates further to bring down persistent inflation. However, the release of the US Nonfarm Payrolls (NFP) data on Friday will provide more cues.
According to the estimates, the official US Employment data is expected to show a decline in the number of payrolls added in February to 203K from the former release of 514k. A figure of 203K is not so bad but looks worthless in front of January’s 514K figure. Investors should be aware that a figure of 514K was an exceptional one in the past seven months.
Apart from that, the Unemployment Rate is expected to remain steady at multi-decade low figures. Also, the Average Hourly Earnings are expected to increase to 4.8% on an annual basis as the shortage of labor would be offset by higher pay-off. Higher funds in the pocket of households might bring more resilience to consumer spending.
Weak German Retail Sales look insufficient to press down hawkish ECB bets
The spree of contracting German Retail Sales continued on Wednesday as households are facing higher price pressures. Individuals are struggling to offset the impact of inflation-adjusted prices of goods and services as the increment in the labor cost index is lower than the pace of the rising Consumer Price Index (CPI). Annual German Retail Sales (Jan) contracted consecutively for the ninth time. The economic data contracted by 6.9% while the street was expecting a contraction of 6.1%. Also, monthly Retail Sales data contracted by 0.3% against an expansion of 2.0% as expected.
Despite contracting German Retail Sales, the European Central Bank (ECB) could not consider a slowdown in the policy-tightening pace as the current inflation is four times the desired level. European Central Bank President Christine Lagarde is expected to continue the 50 basis points (bps) rate hike cycle in March to tame the stubborn inflation.
EUR/USD technical outlook
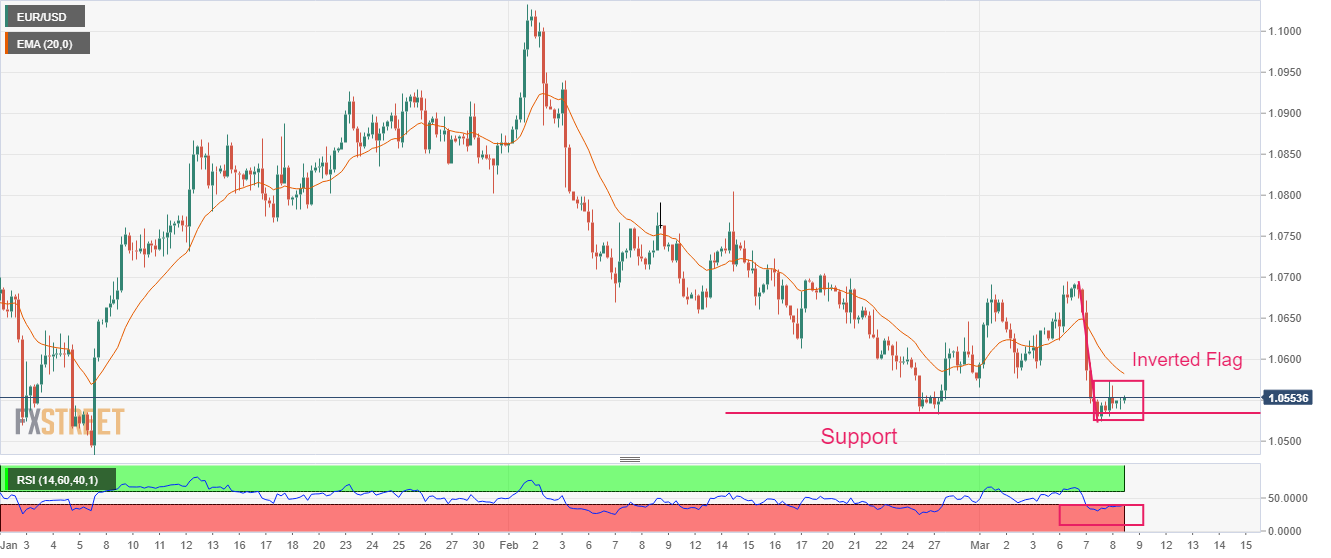
EUR/USD is forming an Inverted Flag chart pattern near the horizontal support plotted from February 27 low at 1.0533 on a four-hour scale. The chart pattern indicates a long consolidation that is followed by a breakdown. Usually, the consolidation phase of the chart pattern serves as an inventory adjustment in which those participants initiate shorts, which prefer to enter an auction after the establishment of a bearish bias.
The Euro might continue facing selling pressure near the 20-period Exponential Moving Average (EMA), which is around 1.0583.
An oscillation in the 20.00-40.00 range by the Relative Strength Index (RSI) (14) indicates that the bearish momentum is currently active. The momentum indicator is not shown any sign of divergence and a situation of oversold.
- WTI clings to mild gains around intraday high, snaps two-day downtrend.
- US Dollar retreat, upbeat Oil inventories seem to underpin WTI’s corrective bounce.
- Downbeat China inflation, upbeat signals of US jobs join proposed increase in US taxes on rich to probe Oil buyers.
- Friday’s US employment data becomes the key to clear directions.
WTI crude oil grinds near the intraday high of $76.86 during the first profit-making day in three amid early Thursday. In doing so, the black gold cheers the broad-based US Dollar retreat and upbeat Oil inventory data. However, downbeat inflation from China and fears of hawkish monetary policies prod the commodity buyers.
US Dollar Index (DXY) snaps a two-day uptrend while easing from the highest levels since December 01, 2022, down 0.13% intraday near 105.55 by the press time, as markets brace for Friday’s key employment data amid mixed US statistics.
On Wednesday, the US ADP Employment Change rose to 242K in February versus 200K market forecasts and 119K prior (revised). Further, the US Goods and Services Trade Balance dropped to $-68.3B from the $-67.2B previous reading (revised) and $-68.9B analysts’ estimations. It should be noted that the US JOLTS Job Openings for January improved to 10.824M versus 10.6M expected but eased from 11.234M revised prior.
It should be noted that the WTI crude oil’s official inventory data from the US Energy Information Administration (EIA) traced the industry stockpile report from the American Petroleum Institute (API) while posting a draw in the stocks during the week ended on March 03.
Elsewhere, disappointment from China’s inflation data also dims the prospects of recovery in the world’s second-largest economy and weighs on the risk profile. On the same line could be the fears of higher taxes in the world’s biggest economy, the US, as well as the political chaos relating to it as US President Joe Biden proposes raising corporation tax from 21% to 28% in his latest budget guide ahead of Friday’s release.
Amid these plays, the S&P 500 Futures struggles for clear directions after bouncing off a one-week low the previous day. Further, the US 10-year Treasury bond yields rise to 3.99%, up one basis point (bp), whereas the two-year counterpart pares intraday losses near 5.05% at the latest.
US yield curve inversion widened to the highest levels since 1981 and propelled the recession fears on Wednesday. However, an absence surprise in Fed Chair Powell’s Testimony 2.0 and mixed US data seemed to have triggered the US Dollar’s latest pullback.
Moving on, a light calendar may allow the WTI crude oil to pare some of its weekly gains ahead of Friday’s all-important US Nonfarm Payrolls.
Technical analysis
WTI crude oil rebound remains elusive unless crossing $81.00 while an upward-sloping support line from early February challenge the commodity bears near $75.15.
- Silver price prints mild gains as it reverses from four-month low.
- Short-term descending support line, oversold RSI adds strength to recovery.
- Doji candlestick, 100-DMA challenge XAG/USD buyers amid sluggish moves.
Silver price (XAG/USD) picks up bids to rebound from the Year-To-Date (YTD) lows while printing mild gains around $20.00, up 0.18% intraday heading into Thursday’s European session.
In doing so, the bright metal bounces off a three-week-old descending support line, around $19.80 by the press time, amid an oversold RSI (14).
The XAG/USD rebound, however, appears elusive unless the quote stays below the previous day’s top surrounding $20.22.
That said, a clear upside break of $20.22 will defy the bearish candlestick formation and can propel the Silver price toward a late February swing low surrounding $20.45.
It’s worth noting, though, that the XAG/USD run-up beyond $20.45 needs validation from the $21.00 round figure and the 100-SMA hurdle of $21.15 to convince the buyers.
Meanwhile, pullback moves may retest the aforementioned support line, near $19.80. Following that, the $19.00 and November 2022 low surrounding $18.85 may entertain the Silver traders.
In a case where the XAG/USD bears keep the reins past $18.85, the previous yearly low surrounding $17.75, marked in September 2022, will be in focus.
Overall, the Silver bears appear running out of steam but the bulls have a long way to go before retaking control.
Silver price: Four-hour chart
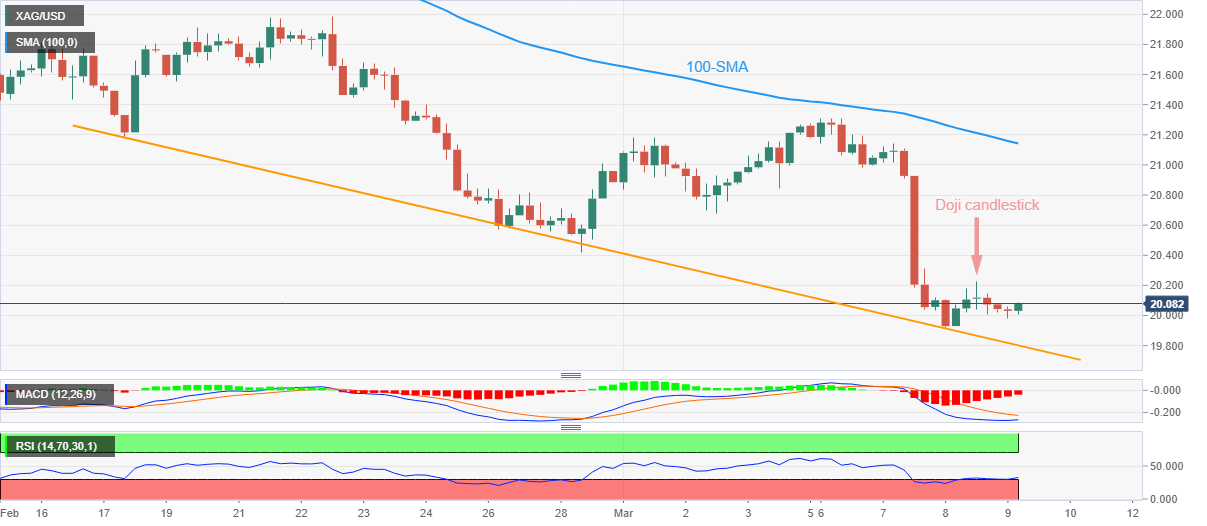
Trend: Further downside expected
- Asian stocks are demonstrating caution amid fears of bigger Fed rates and China’s weak economic recovery.
- Nikkei225 has gained strength as the street is anticipating an ultra-dovish stance by BoJ Kuroda.
- The US EIA reported a decline in the oil inventories by 1.694 million barrels for the week ending March 03.
Markets in the Asian domain are mostly cautious as a bigger interest rate hike by the Federal Reserve (Fed) in its March monetary policy meeting looks almost confirmed. This has fueled fears of a recession in the United States. S&P500 futures are facing pressures after the release of headlines claiming that US President Joe Biden has proposed higher taxes for United States billionaires and rich investors. Corporation tax is expected to scale to 28% from 21% in the upcoming budget.
At the press time, Japan’s Nikkei225 jumped 0.47%, ChinaA50 surrendered 0.60%, Hang Seng eases 0.08%, and Nifty50 dropped 0.62%.
Chinese stocks have turned vulnerable to a dismal economic outlook. A contraction in the monthly Consumer Price Index (CPI) by 0.5% has conveyed that the economic recovery is extremely sluggish and investors have to maintain patience for a long period to discover China’s reopening-led recovery. The street was expecting that after the rollback of lockdown curbs, Chinese recovery will be quick. However, the economic data is not portraying the same. Producer Price index (PPI) figures have shown deflation on an annual basis, indicating poor demand from households.
Meanwhile, Nikkei225 has gained strength as the street is anticipating the maintenance of an ultra-dovish stance by Bank of Japan (BoJ) Governor Haruhiko Kuroda in his last monetary policy meeting. A Reuters poll on an end to the expansion policy cycle dictates that BoJ will start unwinding its ultra-easy policy in April. Also, the market participants are expecting further tweaks in the Yield Curve Control (YCC) in April-June.
On the oil front, the oil price is expected to resume its downside journey as weak recovery in the Chinese economy and expectations of more rates from the Fed are indicating a sheer fall in the global demand for oil. Investors have also ignored the slippage in the oil stockpiles managed by the US Energy Information Administration (EIA). The US EIA reported a decline in the oil inventories by 1.694 million barrels for the week ending March 03.
- USD/INR extends the previous day’s pullback from one-week high, pressured around intraday low of late.
- US Dollar bulls take a breather at three-month high as traders await the key employment data amid mixed feelings.
- Cautious optimism in Asia adds strength to the Indian Rupee’s rebound.
- Second-tier data, risk catalysts eyed for intraday directions.
USD/INR clings to mild losses around 81.85-90 during early Thursday in Europe, extending the previous day’s pullback from a one-week high.
In doing so, the Indian Rupee (INR) pair cheers the US Dollar’s positioning for Friday’s jobs report amid sluggish early hours of trading. Adding strength to the USD retreat could be the inaction in the bond market as major yields remain sidelined after posting. With this, US Dollar Index (DXY) prints the first daily loss in three while keeping the early Asian session pullback from the highest levels since December 01, 2022.
It should be noted, however, that the cautious optimism in Asia, mainly due to the sluggish S&P 500 Futures joining downbeat China inflation data, seems to cap the INR strength. On the same line could be the downbeat Japan growth numbers and downbeat sentiment in India after the Holi holidays.
Elsewhere, an absence surprise in Fed Chair Powell’s Testimony 2.0 and mixed US data seemed to have triggered the US Dollar’s latest pullback. Furthermore, the US 10-year Treasury bond yields seesaw near 3.99% whereas the two-year counterpart pares intraday losses around 5.05% at the latest. It’s worth noting that US yield curve inversion widened to the highest levels since 1981 and propelled the recession fears on Wednesday.
It’s worth observing that the mixed US data seemed to have favored the USD/INR bears even if the early signals for Friday’s employment report are upbeat. That said, the US ADP Employment Change rose to 242K in February versus 200K market forecasts and 119K prior (revised). Further, the US Goods and Services Trade Balance dropped to $-68.3B from the $-67.2B previous reading (revised) and $-68.9B analysts’ estimations. It should be noted that the US JOLTS Job Openings for January improved to 10.824M versus 10.6M expected but eased from 11.234M revised prior.
To sum up, USD/INR is more likely a technical play than a fundamental as the pair’s inability to cross the 100-DMA keeps bears hopeful despite the likely improvement in the US Dollar.
Technical analysis
USD/INR’s failure to cross the 100-DMA hurdle during the previous day’s run-up, around 82.13 by the press time, keeps the bears hopeful of witnessing a slump towards an ascending support line from early November, close to 81.35 at the latest.
- AUD/USD is attempting to scale above 0.6600, however, the risk-off mood is still intact.
- A Doji candlestick formation indicates indecisiveness among market participants.
- An oscillation in the 20.00-40.00 range by the RSI (14) indicates that the bearish momentum is currently active.
The AUD/USD pair is displaying a subdued performance below 0.6600 in the Asian session. The upside in the Aussie asset seems restricted as Reserve Bank of Australia (RBA) Governor Philip Lowe has considered a pause in the rate-hiking spree and the Chinese economy is struggling to accelerate domestic demand despite significant reopening measures.
S&P500 futures have witnessed immense pressure as a sense of deflation conveyed by Chinese Consumer Price Index (CPI) and Producer Price Index (PPI) data indicates that the economy will take plenty of time to strengthen its economic outlook.
The US Dollar Index (DXY) is auctioning in a limited range above 105.20 as investors are awaiting the release of the United States Nonfarm Payrolls (NFP) data for fresh impetus.
AUD/USD has formed a Doji candlestick pattern, which indicates indecisiveness among the sentiment of market participants for further direction. Usually, a Doji formation indicates a reversal after an established trend. However, it requires more filters to confirm a reversal. Also, the negligence of Doji is considered as the continuation of the ongoing trend.
The Australian Dollar might continue to face selling pressure from the 10-period Exponential Moving Average (EMA) at around 0.6700.
An oscillation in the 20.00-40.00 range by the Relative Strength Index (RSI) (14) indicates that the bearish momentum is currently active. The momentum indicator is not shown any sign of divergence and a situation of oversold.
Going forward, a breakdown of Wednesday’s low at 0.6568 will drag the asst toward the horizontal support plotted from October 4 high at 0.6547 followed by the round-level support at 0.6500.
In an alternate scenario, a break above Doji’s high at 0.6629 will push the Aussie asset toward December 22 low at 0.6650. A break above the same might expose the major to February 27 low near 0.6700.
AUD/USD daily chart
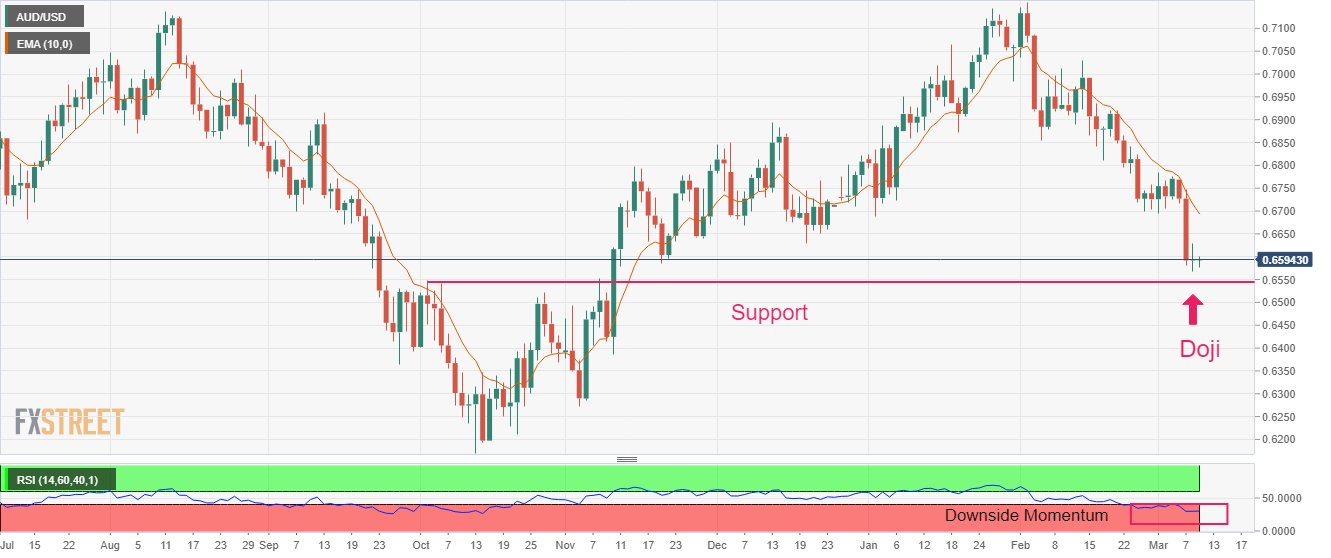
- USD/IDR holds lower ground near intraday bottom after reversing from multi-day top.
- Indonesia Retail Sales growth plummets to multi-month low in January.
- US Dollar’s pullback amid sluggish markets, positioning for Friday’s NFP seem to probe pair buyers.
USD/IDR remains sidelined near 15,440, recently making rounds to the intraday low, even as Indonesia Retail Sales flashed disappointing data early Thursday. In doing so, the Indonesia Rupiah (IDR) pair retreats from a two-month high while snapping a three-day uptrend amid a broad US Dollar retreat.
That said, Indonesia’s Retail Sales marked a 0.6% YoY contraction in January versus 0.7% previous rise. With this, the key statistics dropped to the lowest levels since September 2021 while snapping the 15-month winning streak.
US Dollar Index (DXY) prints the first daily gains in three while keeping the early Asian session pullback from the highest levels since December 01, 2022. That said, the DXY’s latest moves seem to pay a little attention to the sour sentiment as the greenback buyers brace for Friday’s all-important US jobs report for February amid upbeat early signals.
Talking about the sentiment, the S&P 500 Futures struggles for clear directions after bouncing off a one-week low the previous day. On the same line, the US 10-year Treasury bond yields rise to 3.99%, up one basis point (bp), whereas the two-year counterpart pares intraday losses near 5.05% at the latest. It’s worth noting that US yield curve inversion widened to the highest levels since 1981 and propelled the recession fears on Wednesday. However, an absence surprise in Fed Chair Powell’s Testimony 2.0 and mixed US data seemed to have triggered the US Dollar’s latest pullback.
On Wednesday, the US ADP Employment Change rose to 242K in February versus 200K market forecasts and 119K prior (revised). Further, the US Goods and Services Trade Balance dropped to $-68.3B from the $-67.2B previous reading (revised) and $-68.9B analysts’ estimations. It should be noted that the US JOLTS Job Openings for January improved to 10.824M versus 10.6M expected but eased from 11.234M revised prior.
It should be noted that the risk profile weakened early Thursday amid headlines suggesting US President Joe Biden’s proposal for higher taxes, which in turn appears an extra economic burden amid the looming recession woes.
Looking forward, US Initial Jobless Claims for the week ended on March 03 will join the Challenger Job Cuts for February to entertain intraday traders of the USD/IDR.
Technical analysis
Despite the latest retreat, a daily closing below the 100-DMA level surrounding 15,420 becomes necessary for the USD/IDR bears to retake control.
- GBP/USD is struggling to cross the immediate resistance of 1.1850 as the dismal market mood is solidifying further.
- An increase in US taxes will deliver an expression of contracting fiscal policy that might contribute to restricting inflation.
- The BoE could consider a pause in the policy-tightening spell amid the vulnerable UK manufacturing sector.
The GBP/USD pair is juggling near the immediate resistance of 1.1850 in the Asian session. The Cable is gathering strength to scale above the aforementioned resistance. However, the odds are favoring for resumption of the downside as the US Dollar Index (DXY) is expected to remain in the driving seat ahead of the release of the United States Nonfarm Payrolls (NFP) data.
S&P500 futures have given up their entire gains earned on Wednesday, portraying further strengthening of the risk-aversion theme. The weak risk appetite of investors has allowed the 10-year US Treasury yields to rebound above 3.98%.
The latest headline of higher taxes on US billionaires and rich investors, a proposal endorsed by US President Joe Biden for the Budget is putting more pressure on US stocks. US President Joe Biden has proposed raising corporation tax from 21% to 28%. This might result in a contraction in US fiscal policy, which could contribute firmly to softening US inflation.
No doubt Federal Reserve (Fed) chair Jerome Powell has confirmed bigger rates and a higher terminal rate to strengthen its defense in the battle against stubborn inflation, the release of the US Nonfarm Payrolls (NFP) data will deliver more clarity. The economic data is expected to show a decline in the payrolls to 203K from the former release of 514k.
Meanwhile, Pound Sterling might deliver a power-pack action after the release of the United Kingdom’s manufacturing sector data. Monthly Manufacturing production (Jan) and Industrial Production are expected to contract by 0.1% and 0.2% respectively.
Investors should be aware of the fact that the performance of the UK manufacturing sector has remained vulnerable in the past few months. This could force the Bank of England (BoE) to pause the policy-tightening process for the time being and allow current monetary policy to show its impact.
- Gold price is struggling to sustain above $1,800.00 amid rising bets for hawkish Fed policy.
- The risk-aversion theme has heated further as China has shown deflation in the CPI and PPI figures.
- Higher funds in the pocket of US households due to rising labor cost index might propel consumer spending.
Gold price (XAU/USD) looks vulnerable above $1,810.00 as the upside looks capped amid rising bets for bigger rates by the Federal Reserve (Fed). The precious metal is expected to resume its downside journey as strong United States Employment data reported by Automatic Data Processing (ADP) has confirmed that January’s strong consumer spending and higher payrolls were not a one-time shock to the declining Consumer Price Index (CPI).
S&P500 futures have surrendered their marginal gains added on Wednesday in the Asian session. The risk-aversion theme has heated further as China has shown deflation in the CPI and Producer Price Index (PPI) figures. The US Dollar Index (DXY) has continued its sideways performance above 105.20 as investors are awaiting the release of the US Nonfarm Payrolls (NFP) data for fresh cues. Meanwhile, the alpha provided on 10-year US Treasury bonds has rebounded above 3.98%.
The official US Employment data is expected to show a decline in the payrolls to 203K from the former release of 514k. A figure of 203K is not as bad but looks worthless in front of January’s 514K figure. Investors should be aware that a figure of 514K was an exceptional one in the past seven months.
Apart from that, the Unemployment Rate is expected to maintain the lowest multi-decade figure of 3.4%. The Average Hourly Earnings are expected to climb to 4.8% on an annual basis. Higher funds in the pocket of households might propel consumer spending. Fed chair Jerome Powell has already confirmed bigger rates to scale down sticky inflation.
Gold technical analysis
Gold price is auctioning in an Inverted Flag chart pattern on an hourly scale, which is a trend-following pattern and is bolstering the case of further downside ahead. The chart pattern displays a long consolidation that is followed by a breakdown. Usually, the consolidation phase of the chart pattern serves as an inventory adjustment in which those participants initiate shorts, which prefer to enter an auction after the establishment of a bearish bias.
The 30-period Exponential Moving Average (EMA) at $1,817.24 is acting as a major barricade for the Gold bulls.
Meanwhile, the Relative Strength Index (RSI) (14) is struggling to sustain in the 40.00-60.00 range. A breakdown into the bearish range of 20.00-40.00 will trigger the downside momentum.
Gold four-hour chart
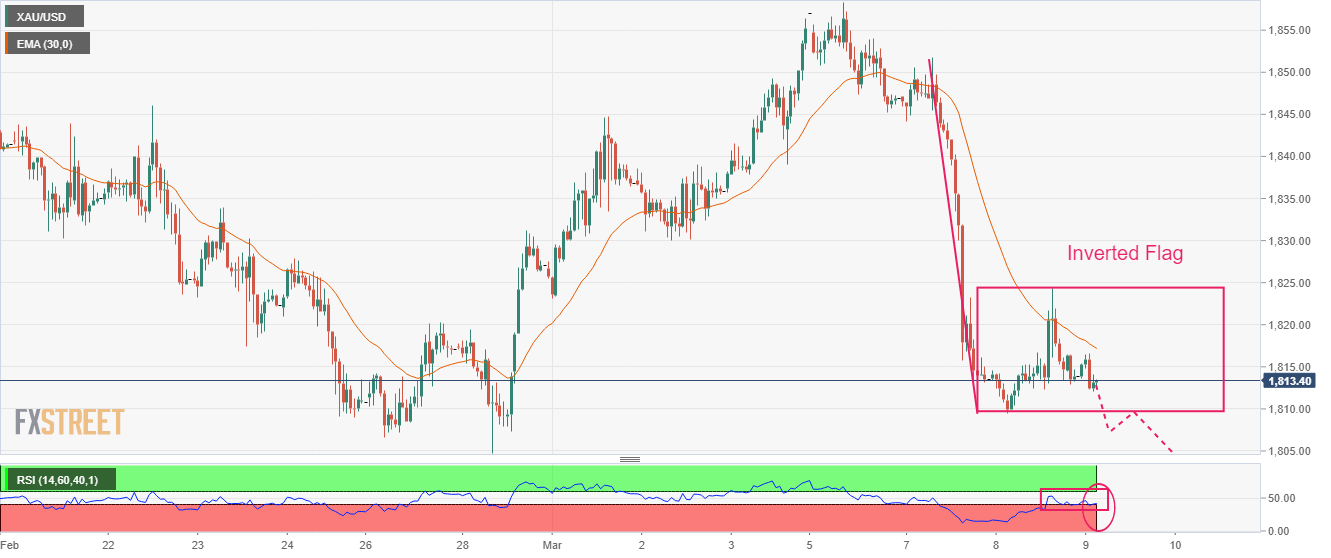
- EUR/USD struggles for clear directions after challenging the bears at two-month low.
- Trend reversal suggesting candlestick, rebound from 100-DMA join sluggish oscillators to lure buyers.
- Previous support line from the last December challenges Euro buyers.
EUR/USD treads water around 1.0550, despite fading the previous day’s bounce off the lowest level since January 2023, as mixed technical details challenge traders during early Thursday’s sluggish trading session.
The Euro pair dropped to a fresh two-month low on Wednesday before bouncing off 1.0524. However, the quote ended the day’s trading with minor changes from the opening levels and hence portrayed a Doji candlestick that suggests a corrective bounce in the EUR/USD price.
It should be noted that the Doji’s existence at a whisker beyond 100-DMA also keeps the EUR/USD buyers hopeful, especially amid the sluggish MACD and RSI signals.
In a case where the Euro pair breaks the immediate 100-DMA support of around 1.0525, bears may have a bumpy road ahead due to the lows marked in January and early December 2022, respectively near 1.0480 and 1.0440. Also acting as a downside filter is the 200-DMA support of 1.0325.
On the flip side, a daily closing beyond the previous support line from December 07, 2022, near 1.0570 by the press time, becomes necessary for the EUR/USD buyer’s conviction.
Even so, the weekly high of around 1.0700 and the mid-February peak surrounding 1.0800 can act as extra filters towards the north.
Overall, EUR/USD is likely to remain bearish even if a corrective bounce is expected for the short term.
EUR/USD: Daily chart
-09032023-638139281055085684.png)
Trend: Limited recovery expected
- USD/MXN retreats towards multi-year low as US Dollar struggles to cheer risk-off mood.
- US Dollar grinds despite President Biden’s controversial tax proposal, higher yields and hawkish Fed bets.
- Banxico shows more clarity over rate hike than Fed with no talks of policy pivot fueling Mexican Peso.
USD/MXN eases to 17.96 during early Thursday, after a failed attempt to recover from the lowest levels since September 2017, tested the previous day. The quote’s latest weakness pays little to the risk-off mood while bracing for the key Mexican inflation data.
Market sentiment sours as US President Joe Biden’s proposal for higher taxes appears an extra economic burden amid the looming recession woes. That said, Biden proposes raising corporation tax from 21% to 28% in his latest budget guide ahead of Friday’s release. The US Leader also aims for a 25% billionaire tax and large levies on rich investors.
Additionally, disappointment from China’s inflation data also dims the prospects of recovery in the world’s second-largest economy and weighs on the risk profile and should have favored the US Dollar’s haven demand.
On the same line Fed Chairman Powell repeated his hawkish calls of readiness to lift the rate while highlighting stronger-than-expected inflation pressure. The same bolstered bets for the Fed’s 50 bps rate hike but the Testimony 2.0 didn’t have anything new from what’s already heard on Tuesday and hence the US Dollar traders were mostly afraid of taking any major steps.
Alternatively, Banxico appears more clear in its hawkish monetary policy bias and has already signaled a further rate hike in its latest monetary policy meeting where the Mexican central bank lifted the benchmark rate by 50 bps.
Against this backdrop, S&P 500 Futures reverses the previous day’s bounce off a one-week low while refreshing the intraday bottom around 3,985. On the same line, the US 10-year Treasury bond yields rise to 3.99%, up one basis point (bp), whereas the two-year counterpart pares intraday losses near 5.05% at the latest. It’s worth noting that US yield curve inversion widened to the highest levels since 1981 and propelled the recession fears the previous day.
Although the bears are in the driver’s seat, the USD/MXN pair’s further moves rely on the Mexican Inflation data for February. That said, downbeat forecasts for the Headline Inflation, Core Inflation and 12-month Inflation, join the recent challenge to sentiment to prod the bears.
Technical analysis
A daily closing below April 2018 lows surrounding 17.93 becomes necessary for the bears to keep the reins. That said, the oversold RSI (14) challenges USD/MXN pair’s further downside.
| Raw materials | Closed | Change, % |
|---|---|---|
| Silver | 20.017 | -0.38 |
| Gold | 1813.62 | -0.02 |
| Palladium | 1373.69 | -0.63 |
- Market sentiment sours as fears of higher taxes, hawkish monetary policies call for recession.
- S&P 500 Futures takes offers to refresh intraday low, reverses the previous day’s bounce off a one-week low.
- Benchmark US Treasury bond yields portray the widest differentials in many years, suggesting a rush to risk safety.
Risk profile again weakens early Thursday, following mixed moves the previous day, as headlines from the US join hawkish signals from the key central banks and top-tier data.
Amid these plays, S&P 500 Futures reverses the previous day’s bounce off a one-week low while refreshing the intraday bottom around 3,985. On the same line, the US 10-year Treasury bond yields rise to 3.99%, up one basis point (bp), whereas the two-year counterpart pares intraday losses near 5.05% at the latest. It’s worth noting that US yield curve inversion widened to the highest levels since 1981 and propelled the recession fears the previous day. That said, Wall Street closed mixed on Wednesday as traders failed to cheer mixed US data amid an absence of fresh directives from Fed Chair Jerome Powell.
That said, US President Joe Biden proposes raising corporation tax from 21% to 28% in his latest budget guide ahead of Friday’s release. Biden also aims for a 25% billionaire tax and large levies on rich investors. A likely lack of acceptance amid jittery economic concerns and political chaos due to the said budget proposal seems to weigh on the market sentiment of late.
Additionally, Fed’s Powell repeated his hawkish calls of readiness to lift the rate while highlighting stronger-than-expected inflation pressure. The same bolstered calls for the Fed’s 50 bps rate hike but the Testimony 2.0 didn’t have anything new from what’s already heard on Tuesday and hence traders were mostly afraid of taking any major steps.
Not only Fed’s Powell, but policymakers from the European Central Bank (ECB) and the Bank of England (BoE) have also defended their hawkish moves and marked overall tighter monetary policies at the major central banks, which in turn favor risk-off mood.
Elsewhere, disappointment from China’s inflation data also dims the prospects of recovery in the world’s second-largest economy and weighs on the risk profile. That said, China’s headline Consumer Price Index (CPI) dropped to 1.0% YoY versus 1.9% expected and 2.1% prior while the Producer Price Index (PPI) also declines to -1.4% from -0.8% previous readings and -1.3% market consensus.
Talking about the US data, the ADP Employment Change rose to 242K in February versus 200K market forecasts and 119K prior (revised). Further, the US Goods and Services Trade Balance dropped to $-68.3B from the $-67.2B previous reading (revised) and $-68.9B analysts’ estimations. It should be noted that the US JOLTS Job Openings for January improved to 10.824M versus 10.6M expected but eased from 11.234M revised prior.
Moving forward, US Initial Jobless Claims for the week ended on March 03 will join the Challenger Job Cuts for February to offer more details to predict Friday’s top-tier employment data, mainly the Nonfarm Payrolls (NFP).
- USD/JPY bulls committing to the price on the front side of the micro bull trend.
- Bulls eye a break of the 200 DMA.
USD/JPY remains on the front side of the bull trend with the US Dollar still perched near a three-month high on Thursday. Traders have repriced a more aggressive pace of interest rate hikes in the wake of Federal Reserve chairman Jerome Powell's comments. Fed funds futures are now implying a 70% chance the Fed will raise rates by 50 basis points this month. This is up from just about 9% a month ago and favouring USD/JPY bulls as the following illustrates:
USD/JPY H4 charts
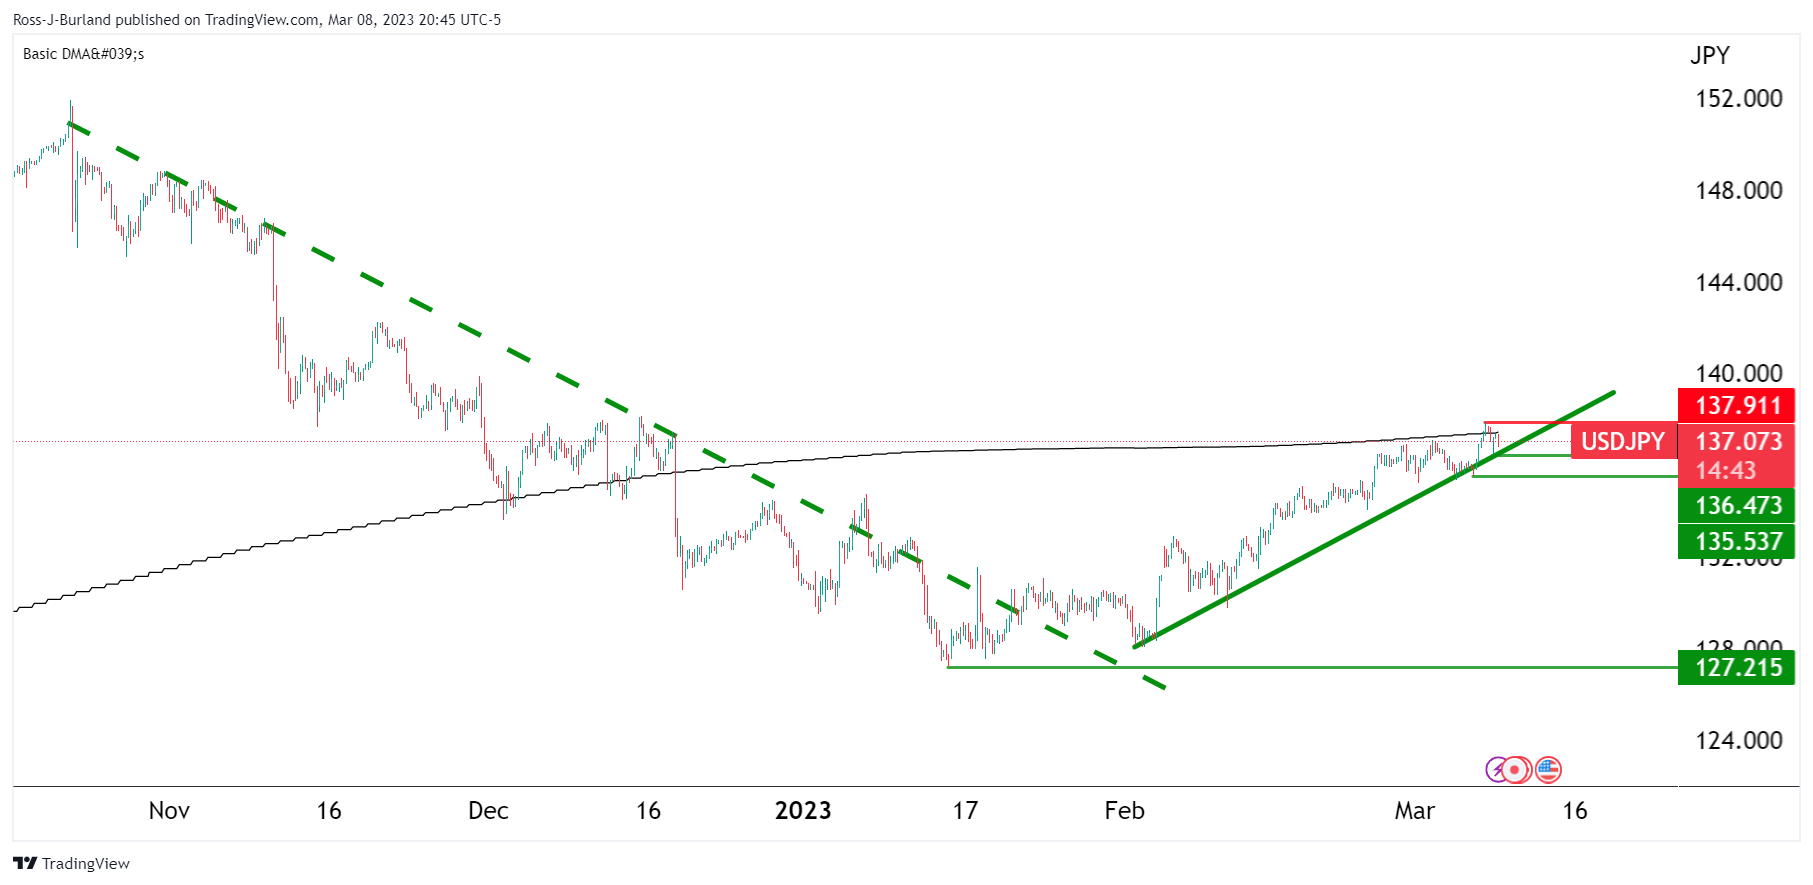
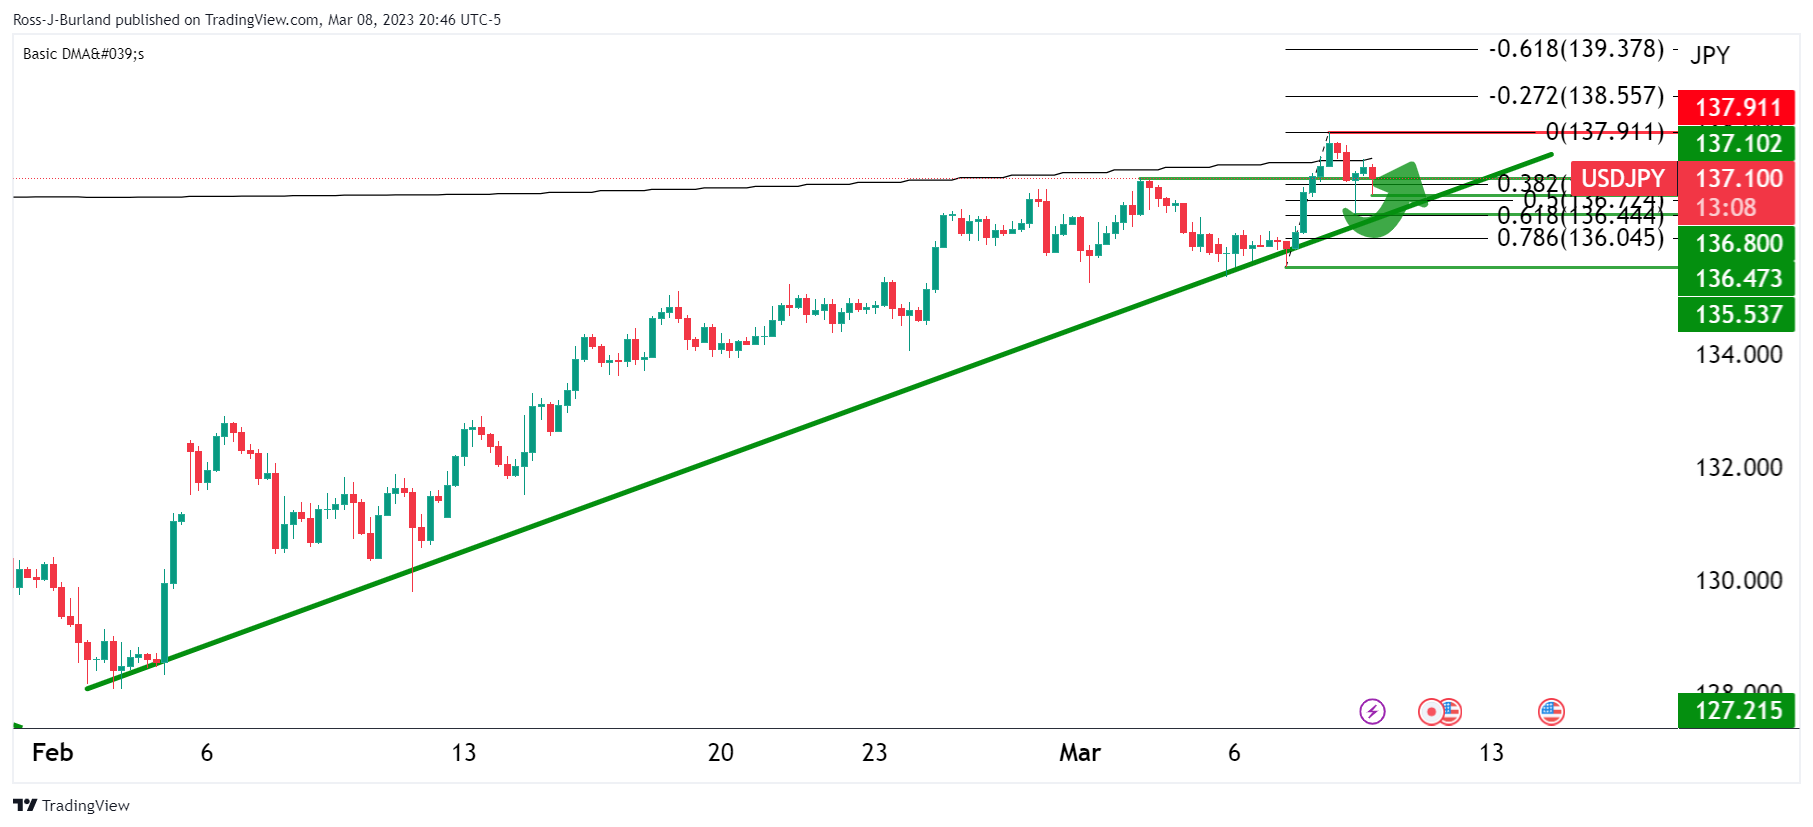
The 4-hour chart shows the bulls in control in and around the 200 DMA following a pullback into the Fibonacci scale.
USD/JPY H1 chart
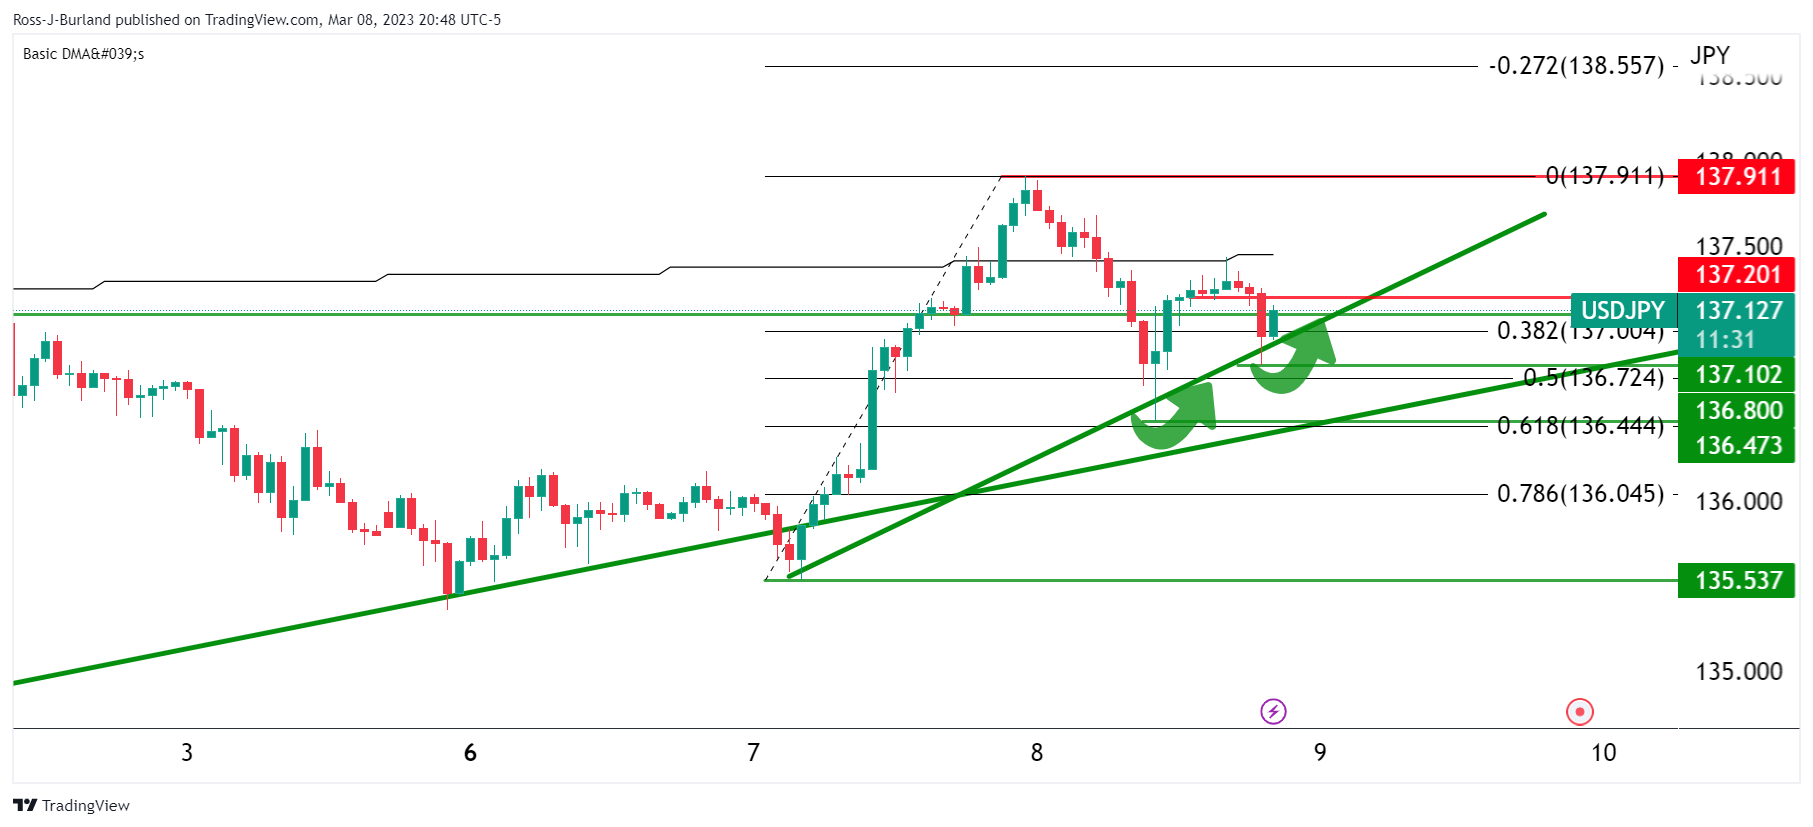
A meanwhile micro trendline has formed on the hourly chart and bulls appear to be committing to the price on the front side so far.
- AUD/JPY renews seven-week low as China prints downbeat CPI, PPI for February.
- Convergence of two-month-old ascending trend line, 50% Fibonacci retracement challenge bears amid oversold RSI (14) line.
- Recover remains elusive unless crossing 91.75 hurdle; MACD teases buyers.
AUD/JPY sellers attack the short-term key support around 90.20 after China released downbeat inflation data early Thursday. Also weighing on the cross-currency pair are the headlines suggesting challenges to sentiment emanating from US President Joe Biden’s budget proposal for 2024, up for publishing on Friday.
As per the latest inflation data from the National Bureau of Statistics of China, the headline Consumer Price Index (CPI) dropped to 1.0% YoY versus 1.9% expected and 2.1% prior while the Producer Price Index (PPI) also declines to -1.4% from -0.8% previous readings and -1.3% market consensus.
Also read: China CPI in at 1.0% vs 1.9% expected, AUD unchanged
With the downbeat inflation numbers from Australia’s key customer China, as well as the risk-off mood, AUD/JPY bears poke a convergence of the two-month-old ascending trend line and 50% Fibonacci retracement level of the pair’s January-February upside, near 90.20.
It’s worth noting that the oversold RSI (14) joins the looming bull cross on the MACD to challenge the quote’s further downside. Also acting as an important nearby support is the 90.00 round figure.
Should the quote breaks the 90.00 mark, the odds of witnessing a slump toward the 61.8% Fibonacci retracement level surrounding 89.55, also known as the golden ratio, can’t be ruled out.
Meanwhile, AUD/JPY rebound needs validation from the 38.2% Fibonacci retracement level surrounding 90.90.
However, a convergence of the 200-SMA and a 12-day-old descending resistance line, around 91.75 at the latest, appears a tough nut to crack for the AUD/JPY buyers.
AUD/JPY: Four-hour chart
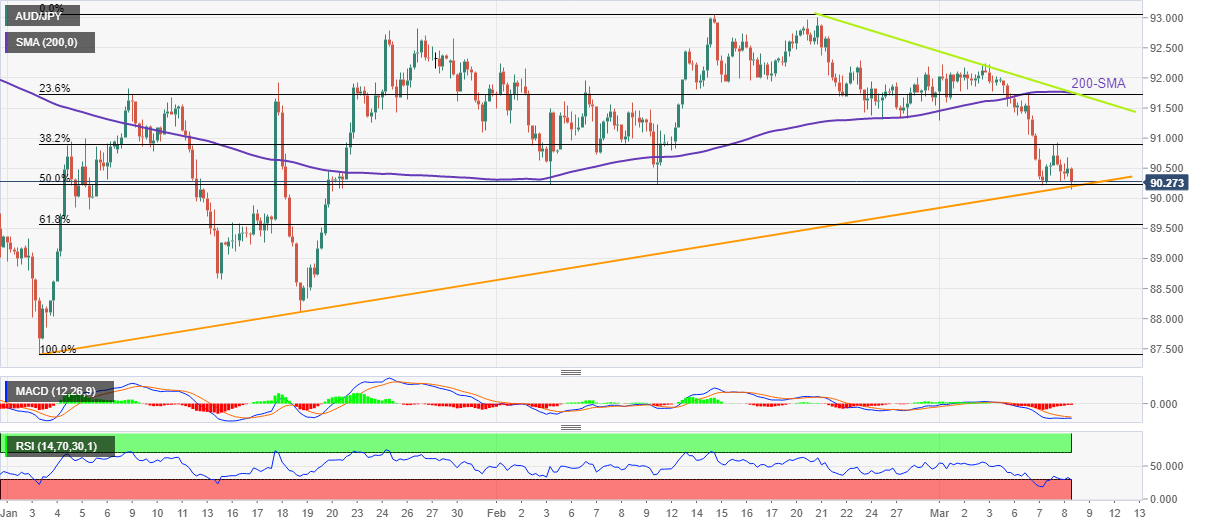
Trend: Further downside expected
- USD/CNH has scaled above 6.9750 as the Chinese economy has registered a deflation by 0.5%.
- Producers have lowered prices of goods and services at factory gates due to sluggish demand.
- Upbeat US ADP Employment data has confirmed that January’s strong data was not a one-time blip.
The USD/CNH pair has jumped above 6.9750 as China’s National Bureau of Statistics (NBS) has reported a sense of deflation in the Consumer Price Index (CPI) (Feb) data. Monthly CPI figures have contracted by 0.5% while the street was anticipating a decline to 0.2% from the former release of 0.8%. The prices of goods and services in China have accelerated by 1% annually, lower than the consensus of 1.9% and the prior release of 2.1%.
Apart from that, the annual Producer Price Index (PPI) has contracted by 1.4% vs. the consensus of 1.3% contraction and 0.8% contraction in the prior release. This indicates that producers lowered the prices of goods and services at factory gates. The reason behind lowering prices could be sluggish demand. It seems that China’s reopening has failed to propel domestic demand.
A sense of deflation might force the People’s Bank of China (PBoC) and the Chinese administration to inject helicopter money into the economy to support the overall demand.
The US Dollar Index (DXY) is gathering strength as United States President Joe Biden has proposed an increase in corporation taxes from 21% to 28%. US Biden wants a 25% billionaire tax and large levies on rich investors. He has also proposed a tax on income over $400,000 at 39.6% in the budget.
More taxes on US individuals will be considered as contracting Fiscal policy, which might support the Federal Reserve (Fed) in bringing down the stubborn inflation.
Fed chair Jerome Powell has confirmed a higher terminal rate than previously anticipated as the battle against sticky inflation is getting complicated. Also, upbeat US Automatic Data Processing (ADP) Employment data has confirmed that January’s strong data on the labor market and consumer spending was not a one-time blip.
- AUD/USD takes offers to refresh intraday low on softer inflation from Australia’s key customer.
- China CPI slides to 1.0% YoY, PPI declines to -1.4% YoY in February.
- Hawkish Fed bets, US President Biden’s budget proposal also exert downside pressure on the risk-barometer pair.
- Second-tier US data, risk catalysts can offer immediate directions ahead of the all-important NFP.
AUD/USD reverses the previous day’s corrective bounce off a four-month low, taking offers to refresh the intraday bottom near 0.6580, as inflation numbers from Australia’s key customer China came in softer for February. Adding strength to the downside bias could be the risk-off mood and hawkish Federal Reserve (Fed) bets versus the dovish tone of the Reserve Bank of Australia (RBA) Governor.
China’s headline Consumer Price Index (CPI) dropped to 1.0% YoY versus 1.9% expected and 2.1% prior while the Producer Price Index (PPI) also declines to -1.4% from -0.8% previous readings and -1.3% market consensus.
Also read: China CPI in at 1.0% vs 1.9% expected, AUD unchanged
Apart from the downbeat Chinese inflation numbers, the market’s risk-off mood also seems to weigh on the AUD/USD price, mainly due to the pair’s risk-barometer status.
It’s worth noting that the US yield curve inversion keeps recession fears on the table while US President Joe Biden’s budget proposal acts as an extra catalyst to weigh on sentiment, as well as the AUD/USD price. That said, the benchmark US Treasury bond yields rose in the last three consecutive days and raised recession fears via the widest difference between the two-year and 10-year bond coupons since 1981 the previous day.
On the other hand, US President Joe Biden proposes raising corporation tax from 21% to 28% in his latest budget guide ahead of Friday’s release. Biden also aims for a 25% billionaire tax and large levies on rich investors. A likely lack of acceptance and political chaos due to the said budget proposal seems to weigh on the market sentiment of late.
With this, the S&P 500 Futures remain 0.05% down on a day and fail to mark any notable moves on a broader front by tracing Wall Street’s sluggish close.
Above all, the divergence between the Fed and the RBA policymakers’ latest bias, with Fed Chair Jerome Powell advocating higher rates while RBA Governor Philip Lowe signaling a policy pivot, keeps the AUD/USD bears hopeful.
Looking ahead, US Initial Jobless Claims for the week ended on March 03 will join the Challenger Job Cuts for February to offer more details to predict Friday’s top-tier employment data. Should the scheduled job numbers appear firmer, the AUD/USD bears may have a happy journey ahead.
Technical analysis
Although the oversold RSI conditions join the 0.6540-20 support zone to challenge AUD/USD bears, bulls remain off the table unless witnessing a clear upside break of a one-month-old previous support line, near 0.6615 by the press time.
China's Consumer Price Index has been released as follows:
- CPI 1.0% YoY (expected 1.9%).
- PPI -1.4% YoY (exp. -1.3%).
- CPI MoM 0.5% vs. 0.2% exp and 0.8% prior.
AUD/USD update
AUD/USD is tucked in below 0.6600 in the Asian session and has shown little reaction to the data thus far. Instead, markets are fixated on prospects of higher rates by the Federal Reserve (Fed) which has weighed on risk appetite this week.
About China Consumer Price Index
The Consumer Price Index is released by the National Bureau of Statistics of China. It is a measure of retail price variations within a representative basket of goods and services. The result is a comprehensive summary of the results extracted from the urban consumer price index and rural consumer price index. The purchase power of the CNY is dragged down by inflation. The CPI is a key indicator to measure inflation and changes in purchasing trends. A substantial consumer price index increase would indicate that inflation has become a destabilizing factor in the economy, potentially prompting The People’s Bank of China to tighten monetary policy and fiscal policy risk. Generally speaking, a high reading is seen as positive (or bullish) for the CNY, while a low reading is seen as negative (or Bearish) for the CNY.
In recent trade today, the People’s Bank of China (PBOC) set the yuan at 6.9666 vs. the prior close of 6.9565.
About the fix
China maintains strict control of the yuan’s rate on the mainland.
The onshore yuan (CNY) differs from the offshore one (CNH) in trading restrictions, this last one is not as tightly controlled.
Each morning, the People’s Bank of China (PBOC) sets a so-called daily midpoint fix, based on the yuan’s previous day's closing level and quotations taken from the inter-bank dealer.
- NZD/USD is declining towards 0.6100 as US Biden has proposed more taxes for riches.
- Contracting Fiscal policy along with rising interest rates by the Fed might show a synergic impact on US Inflation.
- Higher liquidity infusion in the Chinese economy will bring more business for the New Zealand Dollar.
The NZD/USD pair has failed to recapture the critical resistance of 0.6120 in the Asian session. The Kiwi asset is declining towards the round-level support of 0.6100 as the headlines that US President Joe Biden has proposed raising corporation tax from 21% to 28% has strengthened negative market sentiment further.
US Biden wants a 25% billionaire tax and large levies on rich investors. He has also proposed a tax on income over $400,000 at 39.6% in the budget. It looks like the United States fiscal policy is coming into play to restrict Consumer Price Index (CPI) from flexing its muscles further. Liquidity squeezing from the market in the form of higher taxes might have a decent impact on consumer spending.
The headline of taxing US riches more is also putting pressure on the S&P500 futures. The 500-US stocks basket futures are showing losses in the Asian session. It seems that insignificant Wednesday’s recovery move will be capitalized as a selling opportunity by the market participants.
The US Dollar Index (DXY) might show some upside moves on the proposal of higher taxes from US Biden. At the time of writing, the USD Index is hovering above 105.20 and is expected to resume its upside journey.
This week, the US Nonfarm Payrolls (NFP) data will remain in the spotlight. As per the consensus, the US economy has added fresh 203K payrolls in February, lower than the former bumper release of 517K. The Unemployment Rate is seen steady at 3.4%. Investors would be worried about Average Hourly Earnings data, which is expected to increase to 4.8% vs. the prior release of 4.4% on an annual basis. An increase in the labor cost index will bolster the chances of bigger rate hikes from the Federal Reserve (Fed).
Meanwhile, China’s Consumer Price Index (CPI) data is on investors’ radar. China’s CPI is expected to decline to 1.9% from the prior release of 2.1% on an annual basis. Monthly CPI is likely to trim to 0.2% from the former release of 0.8%. Lower inflation might force China’s administration and the people’s Bank of China (PBoC) to infuse more liquidity into the economy.
It is worth noting that New Zealand is one of the leading trading partners of China and higher liquidity infusion in the Chinese economy will bring more business for the New Zealand Dollar.
- GBP/USD retreats from intraday high, fades bounce off the lowest levels since late November 2022.
- Bearish MACD signals, sustained trading below the key support line and 200-DMA favor sllers.
- Buyers lack conviction below 1.2150, one-month-old descending trend line adds to the upside filter.
GBP/USD struggles to extend the previous day’s corrective bounce off the lowest levels since November 21, 2022, making rounds to 1.1850 on Thursday morning in Asia.
In doing so, the Cable pair fails to justify the previous day’s bullish candlestick on the daily chart, namely the bullish spinning top.
The reason could be linked to the pair’s sustained downside break of a 15-week-old ascending trend line, previous support near 1.1935, as well as the 200-DMA breakdown. Also adding strength to the downside bias are the bearish MACD signals.
That said, the GBP/USD quote’s fresh weakness could aim for the 50% Fibonacci retracement level of November 2022 to January 2023 upside, near 1.1800.
Following that, a slump toward the 61.8% Fibonacci retracement level surrounding 1.1645, also known as the golden ratio, can’t be ruled out.
Meanwhile, the 200-DMA hurdle of around 1.1900 restricts immediate GBP/USD recovery before highlighting the support-turned-resistance line close to 1.1935.
Even if the Cable pair crosses the 1.1935 hurdle, a downward-sloping resistance line from early February, near 1.2055 could act as the last defense of the GBP/USD bears.
To sum up, GBP/USD remains on the bear’s radar despite the latest rebound, as well as posting the bullish candlestick.
GBP/USD: Daily chart
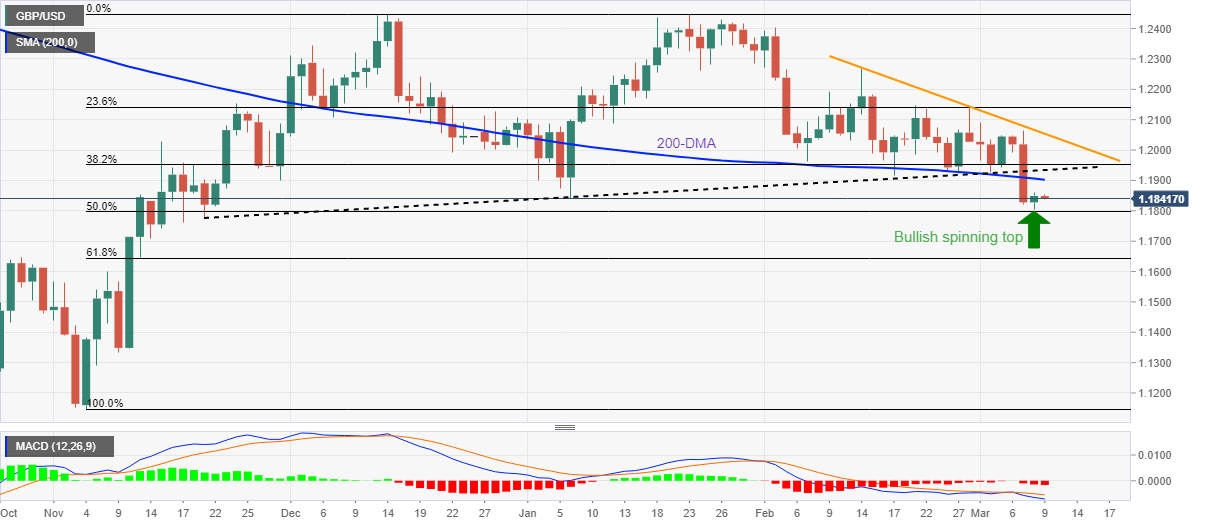
Trend: Bearish
- AUD/USD is struggling to recapture the immediate resistance of 0.6600 amid the risk-off mood.
- A decline in China’s CPI might force the PBoC to infuse more liquidity into the economy.
- Solid US Employment data confirms that fears of stubborn inflation among Fed policymakers were real.
The AUD/USD pair is displaying a back-and-forth action below the round-level resistance of 0.6600 in the Asian session. The Aussie asset looks vulnerable around the same as deepening fears of a recession in the United States amid expectations of higher rates by the Federal Reserve (Fed) have solidified the risk-aversion theme.
S&P500 futures are showing nominal losses after a weak recovery move. It seems that the dead cat bounce move by the 500-US stocks basket is fading away. The US Dollar Index (DXY) has turned sideways above 105.20 after a mild correction, however, the upside looks favored amid upbeat United States Employment data.
The solid addition of fresh payrolls in the US labor market in February due to rising demand has confirmed that fears of stubborn inflation among Fed policymakers were real. The US Automatic Data Processing (ADP) has reported an addition of 242K jobs in February, higher than the expectations of 200K and the former release of 119K. Therefore, Fed chair Jerome Powell cited “Fed is prepared to announce more rates to bring down inflation.”
Investors will get more clarity on the US labor market after the release of the US Nonfarm Payrolls (NFP) data, which will release on Friday. Apart from that, the release of the Unemployment Rate and the Average Hourly Earnings data will be of utmost importance.
After the fifth consecutive 25 basis points (bps) rate hike by the Reserve Bank of Australia (RBA) and a consideration of a policy-tightening pause led by a one-time blip in the monthly Consumer Price Index (CPI) by RBA Governor Philip Lowe, the Australian Dollar has faced immense heat.
Now, investors are shifting their focus toward China’s Consumer Price Index (CPI) (Feb) data. Annual China’s CPI is expected to decline to 1.9% from the prior release of 2.1%. On a monthly basis, China’s CPI has been trimmed to 0.2% from the former release of 0.8%. Lower inflation might force China’s administration and the people’s Bank of China (PBoC) to infuse more liquidity into the economy.
- EUR/USD portrays corrective bounce from a two-month low marked the previous day.
- Absence of impressive data/events, repeat comments from ECB, Fed policymakers limit immediate Euro moves.
- Upbeat yields favor bears despite recent action on US President Biden’s push for higher taxes.
- Second-tier US job numbers can entertain traders ahead of Friday’s US NFP.
EUR/USD struggles to extend the previous day’s recovery moves from a two-month low, making rounds to 1.0550 during early Thursday. In doing so, the major currency pair traces the sluggish markets amid a light calendar and an absence of major surprises from the central bankers. It’s worth noting that the mixed data from the US and Eurozone join the cautious mood ahead of Friday’s key jobs report to also restrict the Euro currency pair’s latest moves.
Recently, US President Joe Biden’s proposal to inflate the corporation tax seems to weigh on the mood and tease EUR/USD sellers. Even so, the S&P 500 Futures remain 0.05% down on a day and fail to mark any notable moves on a broader front.
On Wednesday, German Retail Sales dropped to -6.9% YoY for January from -6.4% prior and -6.1% analysts’ estimations while Industrial Production growth jumped to 3.5% versus 1.4% expected and -2.4% previous readings (revised).
Further, the Eurozone Employment Change eased to 0.3% QoQ during the fourth quarter (Q4) versus 0.4% market forecasts and prior whereas the seasonally adjusted Gross Domestic Product (GDP) eased to 1.8% YoY during the said pair versus 1.9% expected and previous readings.
Considering the data, ECB Governing Council member Ignazio Visco said in a statement on Wednesday, “monetary policy will have to remain prudent.” The policymaker also added, “Monetary policy should be guided by data as it becomes available.”
On the other hand, the US ADP Employment Change rose to 242K in February versus 200K market forecasts and 119K prior (revised). Further, the US Goods and Services Trade Balance dropped to $-68.3B from the $-67.2B previous reading (revised) and $-68.9B analysts’ estimations. It should be noted that the US JOLTS Job Openings for January improved to 10.824M versus 10.6M expected but eased from 11.234M revised prior.
It should be noted that the benchmark US Treasury bond yields rose in the last three consecutive days and raised recession fears via the widest difference between the two-year and 10-year bond coupons.
That said, Federal Reserve Chairman Jerome Powell repeated his hawkish remarks in front of the House Financial Service Committee. The policymaker highlighted the data dependency of the Fed while also signaling that they have underestimated the resilience of growth and inflation.
Looking ahead, the second-tier US job numbers may entertain EUR/USD traders ahead of Friday’s United States employment report.
Technical analysis
Although Wednesday’s Doji Candlestick challenges the EUR/USD bears around a two-month low, recovery remain elusive unless the quote offers a successful trading beyond an upward-sloping trend line from early December 2022, around 1.0555 by the press time.
US President Joe Biden proposes raising corporation tax from 21% to 28% and this is moving the needle in markets.
Key notes
- Biden wants a 25% billionaire tax and large levies on rich investors.
- Biden proposes tax on income over $400,000 at 39.6% in budget.
''My budget will ask that the rich pay their fair share so the millions of workers who helped build that wealth can retire with the Medicare they paid into,'' Biden posted to Twitter.
US stocks futures are softer on the news.
| Index | Change, points | Closed | Change, % |
|---|---|---|---|
| NIKKEI 225 | 135.03 | 28444.19 | 0.48 |
| Hang Seng | -483.23 | 20051.25 | -2.35 |
| KOSPI | -31.44 | 2431.91 | -1.28 |
| ASX 200 | -56.9 | 7307.8 | -0.77 |
| FTSE 100 | 10.42 | 7929.92 | 0.13 |
| DAX | 72.34 | 15631.87 | 0.46 |
| CAC 40 | -14.51 | 7324.76 | -0.2 |
| Dow Jones | -58.06 | 32798.4 | -0.18 |
| S&P 500 | 5.64 | 3992.01 | 0.14 |
| NASDAQ Composite | 45.67 | 11576 | 0.4 |
- USD/JPY bears are making a move following Japan GDP.
- 137 is being tested while investors await the next catalyst in US jobs data.
USD/JPY is slightly pressured and is testing below 137.00 in the Tokyo open while the US Dollar paused its advance following Federal Reserve Jerome Powell's second day on Capitol Hill. Meanwhile, in recent trade, Japan's Gross Domestic Product was released by the Cabinet Office as follows:
- Japanese GDP Annualised SA (QoQ) Q4 F: 0.1% (exp 0.8%; prev 0.6%).
- GDP SA (Q/Q) Q4 F: 0.0% (exp 0.2%; prev 0.2%).
- GDP Nominal SA (QoQ) Q4 F: 1.2% (exp 1.3%; prev 1.3%) .
USD/JPY is down some 15 pips following the data while the US Dollar was otherwise steady in prior trade but down from three-month highs that were reached earlier on Wednesday after Federal Reserve Chairman Jerome Powell offered no major surprises on his second day of testimony before Congress and as investors waited for jobs data on Friday.
USD/JPY rallied on Tuesday when Fed's Powell said the central bank will likely need to raise interest rates more than expected in response to strong data. He added that the Fed would be prepared to move in what has been perceived by the market as a 50bp hike if the data suggested tougher measures were needed to control inflation. Consequently, Fed funds futures traders now see a 70% probability of a 50 basis-point hike at the Fed’s March 21-22 meeting, up from around 22% before Powell spoke on Tuesday. The rate is now expected to peak at 5.69% in September.
All eyes on US data
In the latest jobs data, the ADP National Employment report on Wednesday showed that private employment increased by 242,000 jobs last month and that US job openings fell less than expected in January. Data for the prior month was revised higher. This comes before February Nonfarm Payrolls data due on Friday whereby traders will be looking for the confirmation of continued strong jobs growth. The last data showed that employers added 517,000 jobs in January. Markets expect 203,000 new jobs in February with an unchanged unemployment rate of 3.4% and unchanged average hourly earnings at +0,3%. Consumer price inflation data on Tuesday will also be key to whether the Fed shifts gears with the rate increases. It is expected to show that prices rose by 0.4% in February.
- USD/CAD struggles to extend three-day uptrend near five-month-old horizontal resistance.
- Overbought RSI (14) questions the Loonie pair’s further upside targeting 2022 peak.
- Bears have a bumpy road ahead, 1.3700 restricts immediate declines.
USD/CAD makes rounds to 1.3800 as bulls take a breather near the highest levels since late October 2022 during early Thursday.
The Loonie pair’s latest inaction could be linked to the overbought RSI (14) conditions, as well as the quote’s failure to cross the key horizontal resistance zone established during late September.
The pullback moves, however, remain elusive as multiple tops marked during the last December challenge the USD/CAD bears around 1.3700.
Following that, an upward-sloping support line from February 14, close to 1.3640 by the press time, will be important to watch for the pair sellers.
Should the quote remains bearish past 1.3640, the 100-dMA level surrounding 1.3500 will act as the last defense of the USD/CAD buyers.
It’s worth noting that the previous weekly low surrounding 1.3555 acts as an intermediate halt between 1.3640 and 1.3500.
Alternatively, a successful upside break of the 1.3810-30 resistance region could quickly propel the USD/CAD price towards the year 2022 peak of near 1.3980. That said, the mid-October 2022 high near 1.3890 may act as a buffer during the Loonie pair’s run-up targeting to refresh the multi-month high marked in late 2022.
Overall, USD/CAD remains on the buyer’s radar even if the pair’s further upside appears limited of late.
USD/CAD: Daily chart
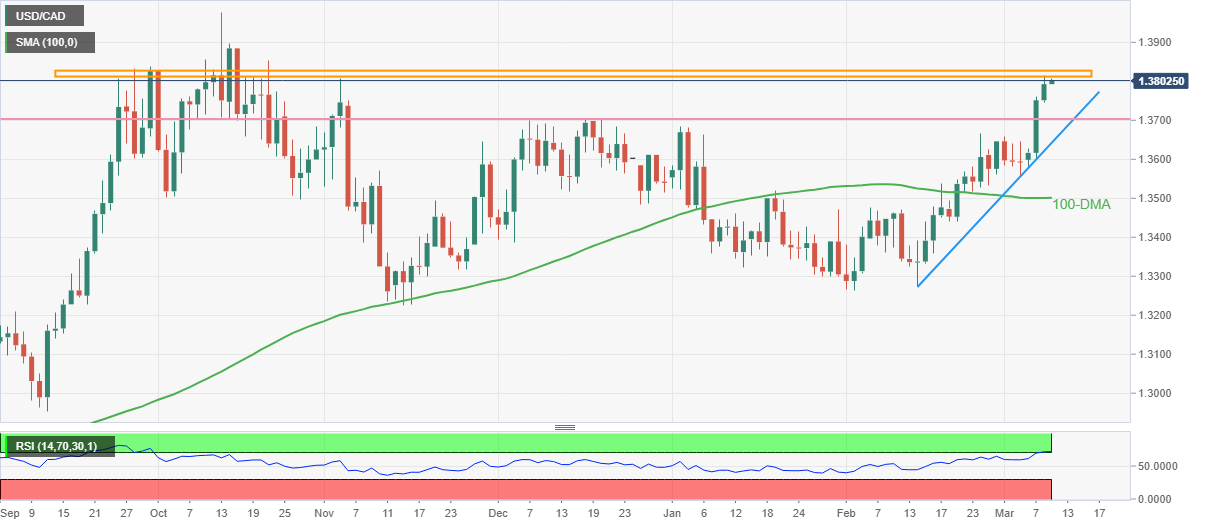
Trend: Pullback expected
| Pare | Closed | Change, % |
|---|---|---|
| AUDUSD | 0.65888 | 0.11 |
| EURJPY | 144.861 | 0.17 |
| EURUSD | 1.05443 | -0.03 |
| GBPJPY | 162.695 | 0.4 |
| GBPUSD | 1.18423 | 0.11 |
| NZDUSD | 0.61075 | 0 |
| USDCAD | 1.38023 | 0.39 |
| USDCHF | 0.94138 | 0.06 |
| USDJPY | 137.382 | 0.27 |
- EUR/GBP is built a cushion around 0.8900 amid rising odds of a steady BoE policy.
- A breakout of the Descending Triangle has already underpinned the Euro against the Pound Sterling.
- Upside momentum is still active as the RSI (14) has not surrendered the bullish range yet.
The EUR/GBP pair has gauged an intermediate cushion around 0.8900 in the Asian session. The cross has been consolidating in a 20-pip range from the past two trading sessions. The upside bias for the pair looks favored as expectations for a steady Bank of England (BoE) monetary policy are solidifying.
A forecast from the British Chambers of Commerce (BCC) that “The country's economy is on track to shrink less than expected this year and avoid two quarters of negative growth which mark a technical recession,” reported by Reuters, is bolstering the fact that the BoE could consider a halt in the policy-tightening spree.
Also, BoE policymaker Swati Dhingra warned on Wednesday “Overtightening poses a more material risk at this point.” A pause in BoE’s policy restriction might have a negative impact on the Pound Sterling.
Meanwhile, the European Central Bank (ECB) is set on its path of contracting monetary policy as expectations of a rebound in Eurozone inflation are improving.
On a four-hour scale, the cross has delivered a breakout of the Descending triangle chart pattern, which indicates an expansion in volatility after a sheer squeeze in the same. The downward-sloping trendline of the chart pattern is plotted from February 03 high at 0.8979 while the horizontal support is placed from January 30 low at 0.8766.
The 20-period Exponential Moving Average (EMA) at 0.8893 is providing a cushion to the Euro bulls.
Meanwhile, the Relative Strength Index (RSI) (14) has not surrendered the bullish range of 60.00-80.00 yet, which indicates that the upside momentum is still active.
Should the cross breaks above February 17 high at 0.8929, Euro bulls will drive the asset towards February 3 high at 0.8979 followed by the psychological support at 0.9000.
On the flip side, a breakdown below February 14 low at 0.8804 will expose the asset to January 29 low at 0.8763 and January 19 low at 0.8722.
EUR/GBP four-hour chart
-638139175774188369.png)


© 2000-2026. All rights reserved.
This site is managed by Teletrade D.J. LLC 2351 LLC 2022 (Euro House, Richmond Hill Road, Kingstown, VC0100, St. Vincent and the Grenadines).
The information on this website is for informational purposes only and does not constitute any investment advice.
The company does not serve or provide services to customers who are residents of the US, Canada, Iran, The Democratic People's Republic of Korea, Yemen and FATF blacklisted countries.
Making transactions on financial markets with marginal financial instruments opens up wide possibilities and allows investors who are willing to take risks to earn high profits, carrying a potentially high risk of losses at the same time. Therefore you should responsibly approach the issue of choosing the appropriate investment strategy, taking the available resources into account, before starting trading.
Use of the information: full or partial use of materials from this website must always be referenced to TeleTrade as the source of information. Use of the materials on the Internet must be accompanied by a hyperlink to teletrade.org. Automatic import of materials and information from this website is prohibited.
Please contact our PR department if you have any questions or need assistance at pr@teletrade.global.
transfers