- Analytics
- News and Tools
- Market News
CFD Markets News and Forecasts — 06-03-2023
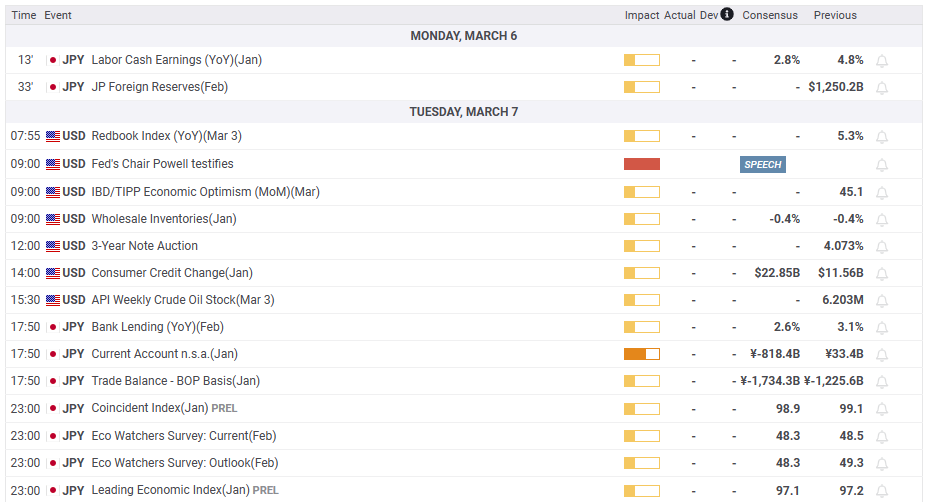
- NZD/USD is on the verge of recapturing the 0.6200 resistance as the risk-off mood has eased.
- The Fed is expected to analyze February’s economic data before endorsing more rates.
- Chinese Trade Balance data is expected to improve amid firmer reopening measures.
The NZD/USD pair is aiming to recapture the round-level resistance of 0.6200 in the early Tokyo session. The Kiwi asset has been strengthened as the risk-off market mood is ameliorating ahead of Federal Reserve (Fed) chair Jerome Powell’s testimony.
S&P500 ended Monday’s session with nominal gains as anxiety among the market participants is accelerating ahead of Fed Powell’s testimony. The US Dollar Index (DXY) is prone to more downside amid a decline in safe-haven’s appeal. The return on the US government bonds will remain in action ahead of the release of the United States Employment data. The 10-year US Treasury yields are looking to recapture 4.0%.
MUFG said “It doesn’t expect Fed Chair Jerome Powell to endorse that scale of further tightening” when the Fed chief takes to Capitol Hill to deliver his semi-annual testimony before Congress.
Analysts further added that Fed Powell is more likely to “wait to assess further data in the coming months to see if the strength in activity and inflation is sustained before strongly committing to more rate hikes.”
On Wednesday, the release of the US Automatic Data Processing (ADP) Employment data will be keenly watched. February’s retail demand remained resilient, therefore, the demand for talent could be on the upside. According to the estimates, the economic data is 195K, higher than the prior release of 105K. Strong demand for labor could propel the fears of more rates from the Fed.
The Kiwi Dollar might display a decent action toward the release of China’s Trade Balance (US) (Feb) data. The economic data is expected to improve to $81.8B from the former release of $78B. Chinese economy looks energized on the track of economic recovery after the reopening of the economy. It is worth noting that New Zealand is one of the leading trading partners of China and trading activity in the Chinese economy will support the New Zealand Dollar.
- US Dollar Index holds lower grounds after declining in the last two consecutive days.
- Upbeat data, corrective bounce in yields failed to impress DXY bulls amid mixed Fed talks, quiet markets.
- Fed Chair’s Testimony eyed to confirm the ‘higher for longer’ rates.
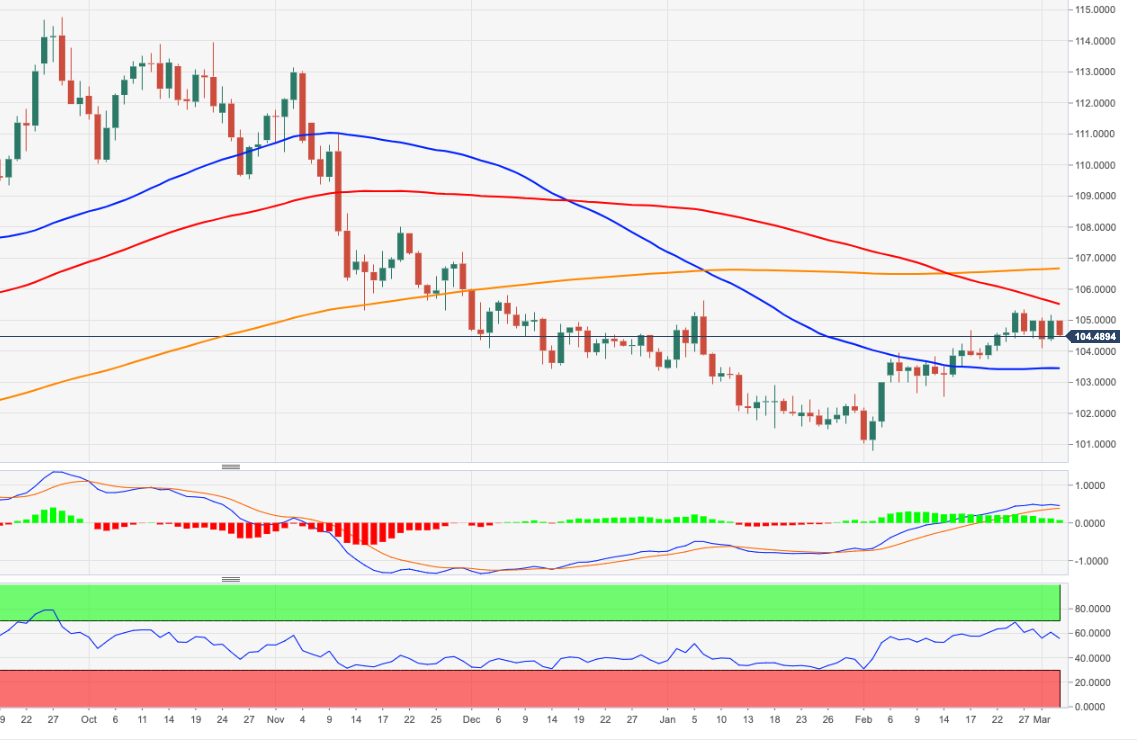
US Dollar Index (DXY) remains on the back foot for the third consecutive day as it slides towards 104.00 during early Tuesday, pressured near 104.25 by the press time. In doing so, the greenback’s gauge versus the six major currencies traces the US Treasury bond yields amid a sluggish session ahead of the key Testimony from Federal Reserve (Fed) Chairman Jerome Powell.
On Monday, US 10-year Treasury bond yields initially dropped to a one-week low of 3.897% before ending the day with mild gains near 3.96%, staying around the same level by the press time. On the same line, the two-year counterpart ended Monday’s North American trading session with 0.60% intraday gains at 4.88%, mostly unchanged at the latest.
It should be noted that the improvement in the US Factor Orders for January, to -1.6% MoM versus -1.8% expected and -1.7% prior, could be considered as a catalyst behind the previous rebound in the US Treasury bond yields. That said, the cautious mood ahead of this week’s key event might have allowed the bond coupons to remain depressed.
On a different page, mixed headlines from China’s annual session of the National People's Congress (NPC) and fears of more Sino-American tension, amid the likely meeting of the US and Taiwanese Officials, seem to weigh on the sentiment amid sluggish trading hours.
It’s worth mentioning that softer prints of the second-tier US data, including ISM PMIs, Consumer Confidence and Durable Goods Orders joined comments from Atlanta Fed President Raphael Bostic to renew concerns about the policy pivot and weighed on the DXY in the last week.
Amid these plays, Wall Street closed mixed and the S&P 500 Futures also struggle for clear directions.
Looking ahead, China’s monthly trade numbers and headlines from the NPC can entertain DXY traders ahead of the semi-annual Testimony of Federal Reserve (Fed) Chairman Jerome Powell. Fed’s Powell appears before the Senate Banking Committee on Tuesday and should defend the US central bank’s hawkish bias to recall the US Dollar bulls.
Technical analysis
A convergence of the 21-day and 50-day Exponential Moving Averages (EMAs), around 104.00, appears a tough nut to crack for the DXY bears. That said, impending bear cross on the MACD joins the previous week’s downside break of an upward-sloping trend line from early February, around 105.75 by the press time, to keep sellers hopeful.
- USD/CHF bulls eye 0.9350 near a 78.6% Fibonacci.
- Bears seek a move lower after the breaks of structure.
USD/CHF dropped on Monday and penetrated the daily bullish trendline that has exposed 0.93 the figure. The following illustrates the risks of a bullish correction in the meanwhile but leans overall with a bearish bias given the break in market structures.
USD/CHF daily chart
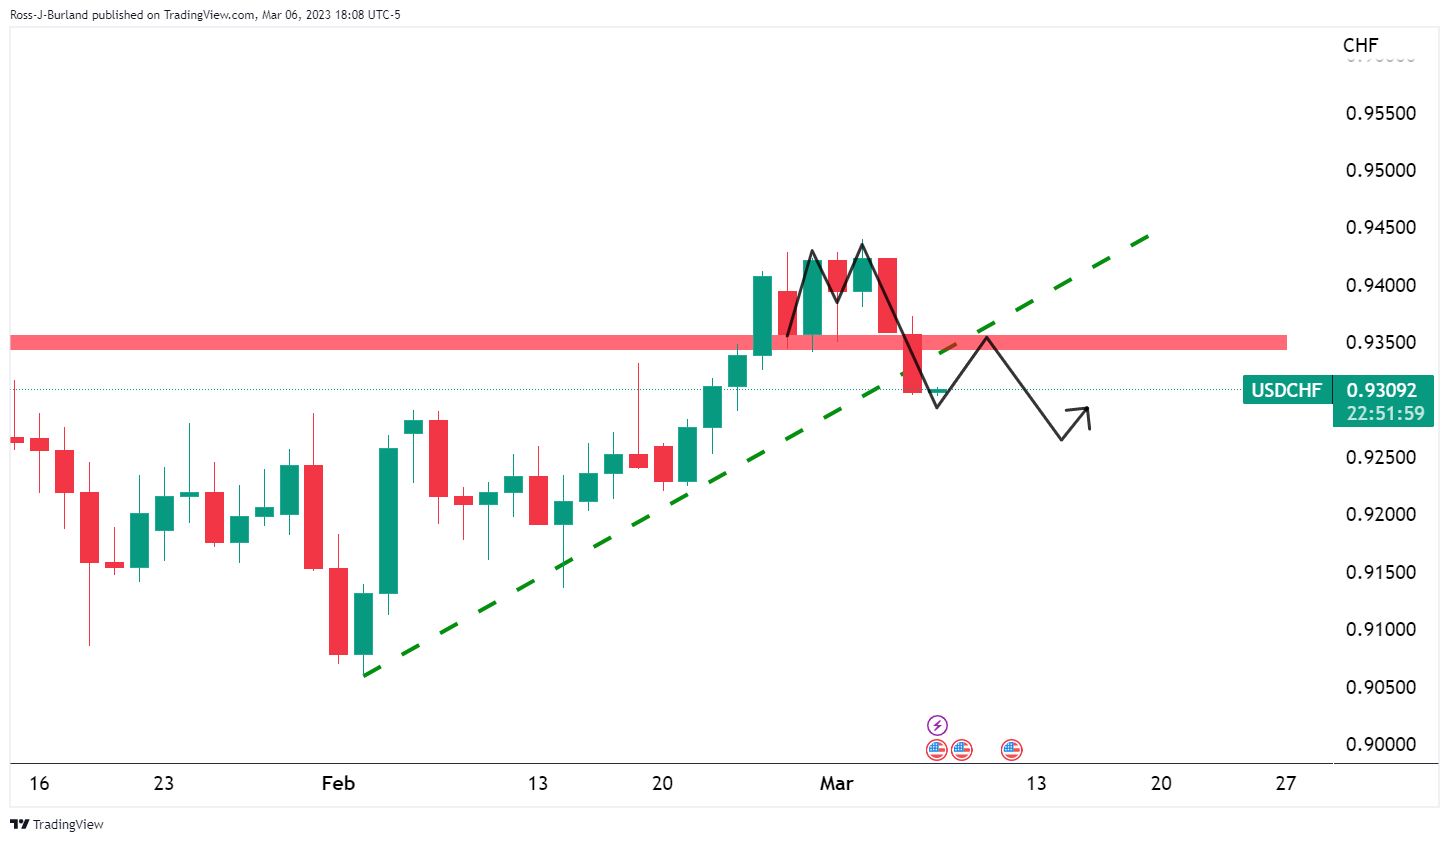
The M-formation is a reversion pattern and the price would be expected to retrace to restest the prior support near 0.9350.
USD/CHF H4 charts
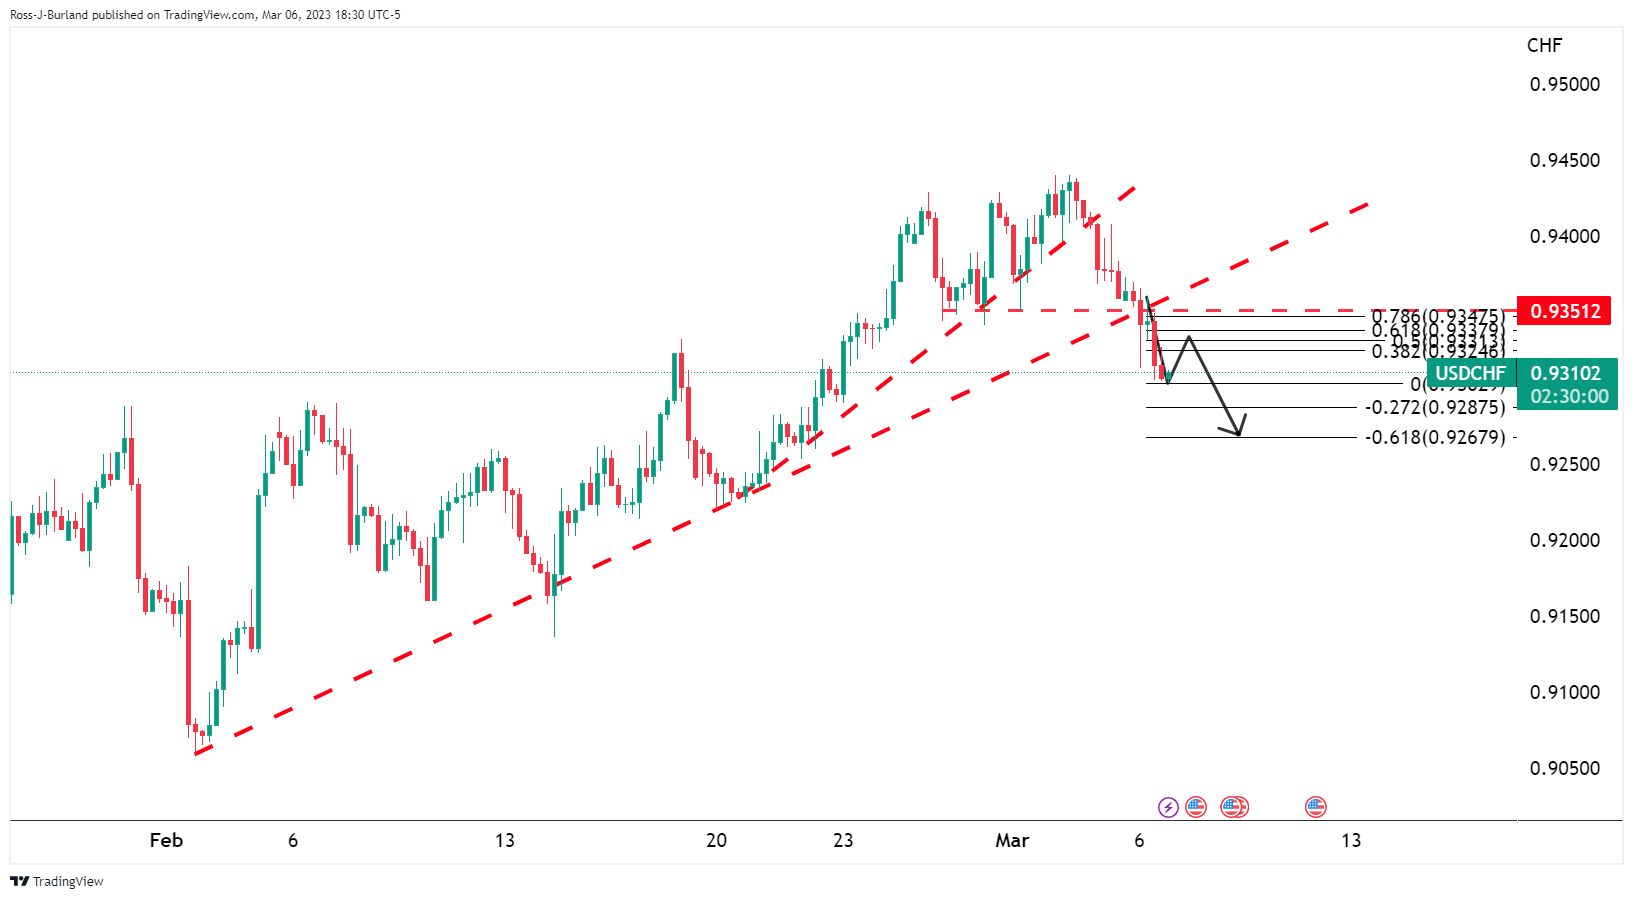
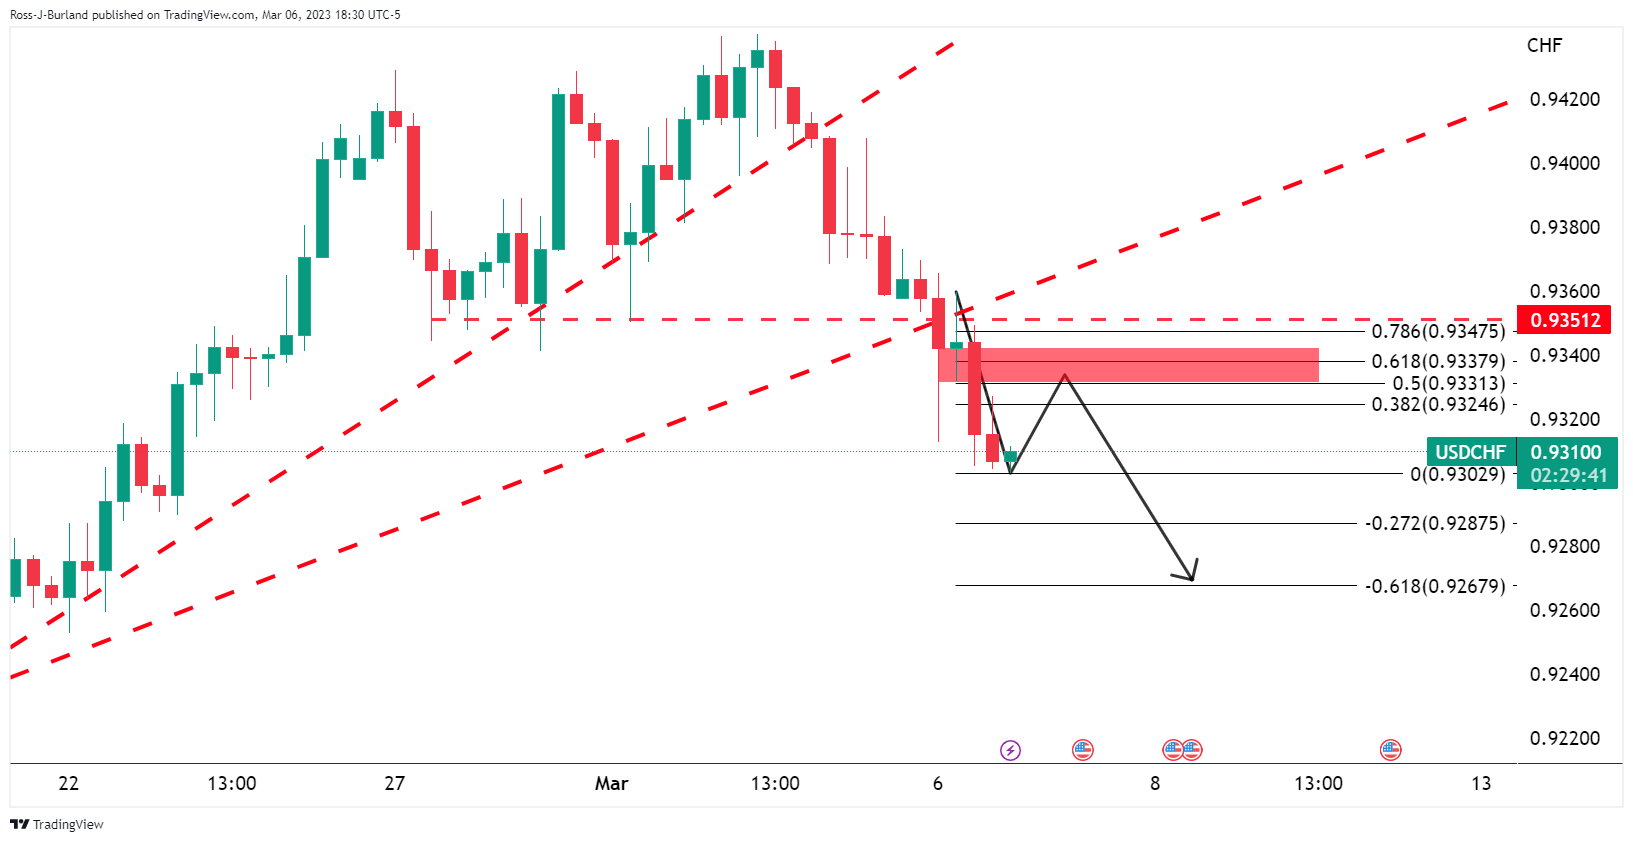
Zooming in, we can see that 0.9350 could be a touch higher than where the bulls might be able to get to. We have the 78.6% Fibonacci just below it and prior support that could be resistance near the 61.8%.
- AUD/NZD remains pressured within the key DMA envelope, defends the previous day’s pullback from one-week high.
- Convergence of six-week-old ascending trend line, previous resistance line from February 21 appears a tough nut to crack for bears.
- Downbeat MACD, RSI join repeated failure to cross 50-DMA to keep bears hopeful.
AUD/NZD holds lower grounds near 1.0860 as traders await the key Reserve Bank of Australia (RBA) Interest Rate Decision during early Tuesday. In doing so, the exotic pair remains between the 100-DMA and the 50-DMA.
Also read: Reserve Bank of Australia Preview: AUD/USD set to suffer on a dovish outlook
Not only the key DMAs but contrasting trading signals by the breakout of a two-week-old resistance line, now support, as well as sustained trading below the 50-DMA and bearish MACD signals, also challenge the AUD/NZD pair traders ahead of the key event.
As a result, the pair needs to overcome the 1.0890-50 trading range for clear directions.
That said, a downside break of the 100-DMA, around 1.0850 isn’t an open invitation to the AUD/NZD bears as a convergence of the previous resistance line from February 21 and a six-week-old ascending support line, around 1.0810, appears a tough nut to crack for the bears.
Following that, a slump toward the January 19 swing low of 1.0737 can’t be ruled out.
Meanwhile, the AUD/NZD pair’s recovery beyond the 50-DMA hurdle of 1.0890 needs validation from the 1.0900 threshold to convince the bulls.
In that case, highs marked during early January and February, around 1.0935 and 1.1030 respectively, could challenge the upside momentum before highlighting the previous monthly peak of 1.1087.
AUD/NZD: Daily chart
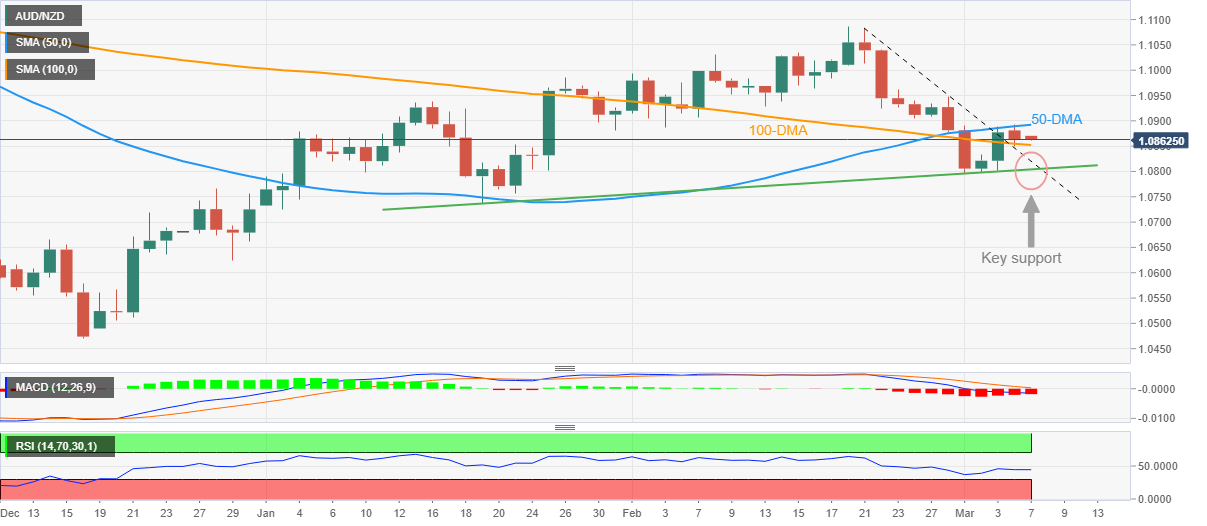
Trend: Limited downside expected
- AUD/JPY has shifted its business below 91.50 despite soaring hawkish RBA bets.
- The RBA is expected to announce a fifth consecutive 25 bps rate hike move in its battle against stubborn inflation.
- This week, the Japanese Yen will focus on the GDP (Q4) numbers.
The AUD/JPY pair has shifted its auction below 91.50 in the early Asian session. The risk barometer is facing offers while attempting recovery and is expected to continue its downside journey to near 91.30. The cross is not showing signs of recovery despite rising chances of a hawkish monetary policy from the Reserve Bank of Australia (RBA).
The interest rate decision from RBA Governor Philip Lowe could be more rates announcement despite signs of inflation softening. January’s monthly Consumer Price Index (CPI) revealed a sheer deceleration but is insufficient to force the RBA to consider a pause in the policy-tightening spell.
Apart from the Australian inflation data, quarterly Gross Domestic Product (GDP) (Q4) were also softened as higher rates by the RBA have forced firms to postpone their expansion plans. The Q4 GDP was expanded by 0.5%, lower than the consensus of 0.8% and the former release of 0.7%.
Analysts at SocGen believe “Recent signs in the macroeconomic data, such as the decline in inflation, the rebound in the Unemployment Rate, relatively lukewarm wages growth and the confirmation of consumption slowdown all support a 25 bps hike in March. They also support our base scenario of a terminal policy rate at 3.85%, despite the financial market’s more hawkish expectation on US Fed policy.”
This week, the Japanese Yen will focus on the Gross Domestic Product (GDP) (Q4) data, which is scheduled for Thursday. As per the consensus, the annualized GDP data shows that the Japanese economy has expanded by 0.8% higher than the prior expansion of 0.6%. While the quarterly data is expected to deliver a steady growth of 0.2%.
- USD/JPY is trading almost flat following Monday’s session.
- US Federal Reserve Chairman Jerome Powell is expected to reiterate the Fed’s commitment to inflation.
- A weaker US Dollar and rising UST bond yields capped the USD/JPY movement.
The USD/JPY registers minuscule gains as the Asian Pacific session opens after Monday’s session, printed a doji. A light US economic calendar and Federal Reserve’s (Fed) Chair Jerome Powell testifying before the US Congress will likely keep the pair within familiar levels. At the time of writing, the USD/JPY is exchanging hands at 135.91 after hitting on Monday a weekly low of 135.36.
USD/JPY stays below 136.00 due to USD weakness
Wall Street finished mixed, with the Dow Jones and the S&P 500 gaining between 0.07% and 0.12%. The Nasdaq printed losses of 0.11%. The greenback registered losses, of 0.22%, at 104.292. Contrary to UST bond yields. The 10-year benchmark note rate finished almost unchanged but in positive territory at 3.966%.
On March 7th and 8th, the Chair of the US Federal Reserve, Jerome Powell, is scheduled to testify before the US Congress. Market participants anticipate that he will give a speech reaffirming the Fed’s dedication to controlling inflation and keeping interest rates elevated for a certain period. However, analysts predict that if asked about the Federal Funds Rate (FFR) peak, Chair Powell may not provide a specific answer.
On the Japanese front, the upcoming policy meeting of the Bank of Japan (BoJ), scheduled for March 10th, would be Governor Kuroda’s final meeting. The markets believe he will use this opportunity to initiate policy normalization by adjusting the Yield Curve Control (YCC). Rabobank analysts commented that the BoJ would take a cautious approach to loosen conditions of the YCC, and it would be the first step towards monetary policy normalizations.
USD/JPY Technical levels
- USD/CAD fails to defend the first daily gain in three, prints minor loss of late.
- Oil price initially cheered softer US Dollar, China demand hopes before the shift in mood probed the commodity buyers.
- Downbeat Canada PMI, improvement in US Factory Orders allowed Loonie bulls to sneak in before the latest retreat.
- Fed Chair Powell’s Semi-Annual Testimony, China trade data can offer immediate directions but Canada, US job reports are the key.
USD/CAD retreats to 1.3610, after an upbeat start to the week, as the Loonie pair cheers a pause in the Oil price while the US Dollar pares recent losses during early Tuesday.
That said, the Oil price rose in the last consecutive five days to the highest levels in three weeks. However, black gold recently had mild losses of around $80.55 by the press time. The reason could be linked to the market’s cautious mood ahead of the key data/events, as well as a rebound in the US Dollar.
US Dollar Index (DXY) began the week on a back foot around 104.60 before closing in the red for the second consecutive day. The US Dollar’s weakness allowed commodities and Antipodeans to remain firmer. However, the firmer US Treasury bond yields and fears emanating from China, as well as the recently firmer US data, allowed the greenback to pare some of its previous losses.
US 10-year Treasury bond yields initially dropped to a one-week low of 3.897% before ending the day with mild gains near 3.96%. On the same line, the two-year counterpart ended Monday’s North American trading session with 0.60% intraday gains at 4.88%.
Elsewhere, China eyed the modest 5.0% economic growth in its annual session of the National People's Congress (NPC), versus 6.0% market forecasts, which in turn raised doubts on the health of the world’s biggest commodity user and put a floor under the US Dollar price, as well as the USD/CAD.
On the same line, were comments from outgoing China Premier Li Keqiang as he said, “China should promote the peaceful development of cross-Strait relations and advance the process of China's ‘peaceful reunification’, but also take resolute steps to oppose Taiwan independence.”
Talking about the data, US Factory Orders for January improved to -1.6% MoM versus -1.8% expected and -1.7% prior. Previously, softer prints of the US ISM Services PMI for February, as well as the Durable Goods Orders for January and the Conference Board’s (CB) Consumer Confidence for February, questioned the Federal Reserve’s (Fed) ‘higher for longer’ plan.
Amid these plays, Wall Street closed mixed and the S&P 500 Futures print
Looking ahead, China’s monthly trade numbers and headlines from the NPC can entertain USD/CAD traders ahead of the semi-annual Testimony of Federal Reserve (Fed) Chairman Jerome Powell. Fed’s Powell appears before the Senate Banking Committee on Tuesday and should defend the US central bank’s hawkish bias to keep the USD/CAD bulls on the table.
Technical analysis
Although the 100-DMA puts a floor under the USD/CAD price near the 1.3500 threshold, the quote’s upside appears limited by a one-month-old ascending resistance line, close to 1.3710 by the press time.
- EUR/JPY holds in bullish territory as markets await the BoJ.
- The Fed chair is the first major risk or the cross.
EUR/JPY is flat in the Asan session so far sticking to a narrow 145.04 and 145.20 range. The pair has been drifting higher over the course of the year so far driven by the US Dollar fundamentals for the most part but the Yen has also played a role domestically.
Firstly, the Euro and US Dollar battle has been dominated by Federal Reserve policy. This week's testimony by Jerome Powell, who is the chairman of the Fed, will be watched for any new signals on whether the U.S. central bank could reaccelerate the pace of rate hikes in response to the recent data. After delivering a series of 50bp hikes last year, the Fed has raised interest rates by 25 basis points each at its last couple of meetings. Around these meetings, however, data has come in hot and Fed funds futures traders are pricing in a 76% probability the Fed will raise rates by 25 basis points at its March 21-22 meeting, and a 24% likelihood of a 50 basis points increase.
However, the EUR has had its own fundamental backdrop to traverse in recent months. ''A build-up of EUR long positions late last year and into January reflected the softening in European gas prices and a strengthening in the view that Germany could avoid recession this year,'' analysts a Rabobank said. ''Germany may still suffer a technical recession in Q4 2022/Q1 2023, but at least more recent data are indicating resilience in the economy. However, ‘resilient’ is not ‘strong’ and the market is facing these data releases with longer EUR positions than at the end of last year. This suggests that the hawkish rhetoric of the ECB may struggle to coax the EUR significantly higher particularly given the recent buoyancy of the greenback,'' the analysts added.
Meanwhile, the next BoJ policy meeting is due on March 10 and it will be Kuroda’s last where markets suspect that he will trigger the commencement of policy normalization with an adjustment of YCC. ''However, this is unlikely without the results of the spring wage talks,'' the analysts at Rabobank argued. ''It is our view that the BoJ will take a slow and cautious approach to policy and that a loosening of YCC will be the initial element of any reduction in policy loosening this year. We see scope for USD/.JPY to move to 125 on a 12-month view.''
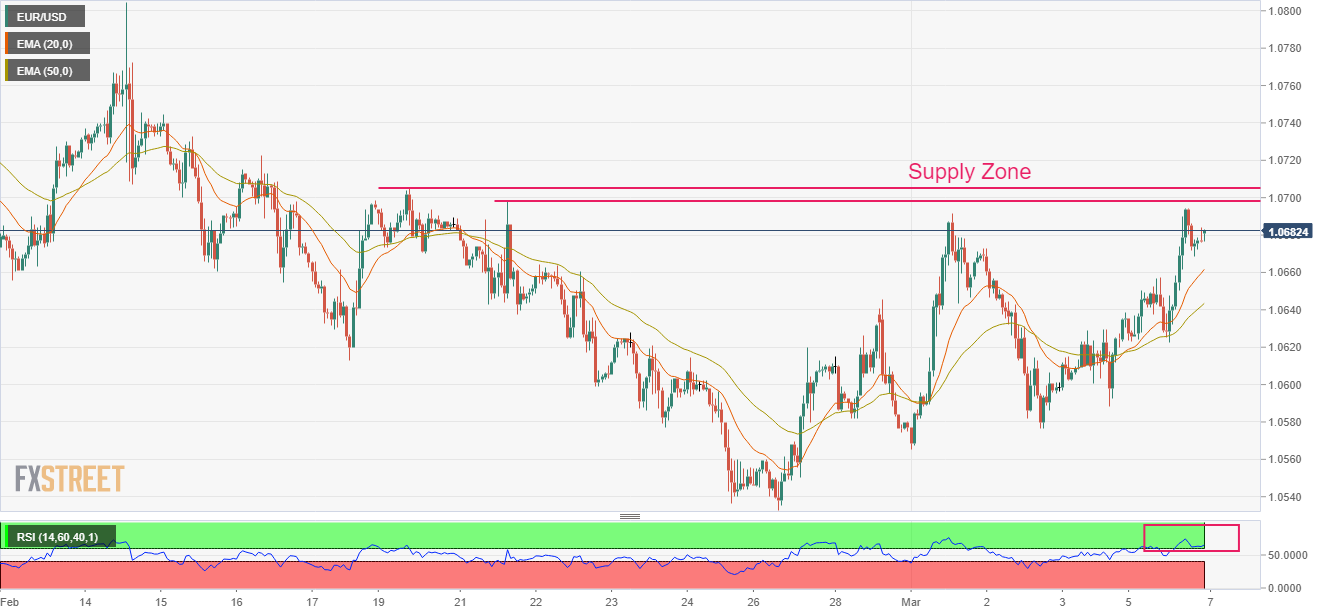
- EUR/USD is aiming to recapture the 1.0700 resistance amid an improvement in the risk-aversion theme.
- Weak retail demand is music to the ears of the ECB, which is putting efforts into achieving price stability.
- Upward-sloping 20-and 50-period EMAs at 1.0644 and 1.0662 respectively, add to the upside filters.
The EUR/USD pair is gathering strength to reclaim the round-level resistance of 1.0700 in the early Asian session. The Euro is getting significant bids amid improved risk appetite for the risk-perceived assets. The US Dollar is struggling for firm feet ahead of the Federal Reserve (Fed) chair Jerome Powell's testimony. Fed Powell might consider a ‘wait and watch’ approach before endorsing more rates as the street believes that February’s resilient consumer spending could be a ’one-time show’.
S&P500 settled Monday’s trading session with marginal gains, portraying mild optimism among the market participants.
On the economic front, Eurozone Retail Sales continued their annual contraction, landing at -2.3% while the street was expected an expansion by 1.9%. Monthly Retail Sales increased by 0.3% but remained well below the consensus of 1.0%. Weak retail demand is music to the ears of the European Central Bank (ECB), which is putting efforts into achieving price stability.
EUR/USD is approaching the supply zone placed in a range of 1.0698-1.0705 on an hourly scale. The major currency pair is expected to recapture the same considering the strength in the upside momentum.
Upward-sloping 20-and 50-period Exponential Moving Averages (EMAs) at 1.0644 and 1.0662 respectively, add to the upside filters.
Meanwhile, the Relative Strength Index (RSI) (14) is oscillating in the bullish range of 60.00-80.00, indicating a continuation of upside momentum.
A fresh upside will be witnessed if the shared currency pair will deliver a break above the supply zone placed in a range of 1.0698-1.0705, which will drive the asset toward February 07 high at 1.0766 followed by February 14 high at 1.0805.
On the flip side, a downside break below March 03 low at 1.0612 will drag the asset toward March 1 low at 1.0577. A slippage below the latter will expose the major to more downside toward February 27 low at 1.0533.
EUR/USD hourly chart
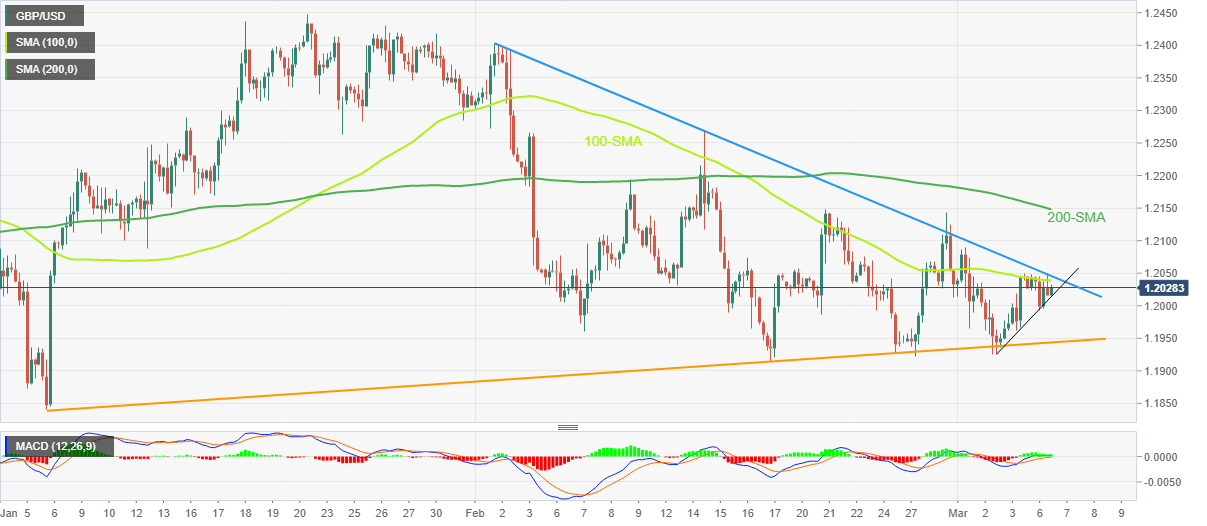
- GBP/USD picks up bids to reverse the week-start pullback.
- Ascending trend line from the last Thursday restricts immediate downside, 100-SMA guards further advances.
- A clear break of two-month-old support line becomes necessary for the Cable bears to retake control.
- MACD conditions, repeated bounces off short-term support line keep buyers hopeful.
GBP/USD prints mild gains around 1.2030 as it pares the week-start losses during early Tuesday’s trading.
In doing so, the Cable pair marks another bounce off the ascending support line from the last Thursday. Additionally luring the buyers are the bullish MACD signals.
However, the 100-SMA level surrounding 1.2040 caps the GBP/USD pair’s immediate upside.
Following that, a downward-sloping resistance line from early February, near 1.2050, appears the key for the pair buyers to cross if they wish to keep the reins and aim for the 200-SMA hurdle surrounding 1.2150.
It should be noted that the mid-February highs near 1.2270 could lure the GBP/USD bulls past 1.2150.
On the flip side, a clear break of the immediate support line, near 1.2010 by the press time, needs validation from the 1.2000 psychological magnet to convince the Cable bears.
Even so, an upward-sloping support line from early January, close to 1.1940 by the press time, becomes crucial for the GBP/USD bears to conquer to retake control.
Should the quote successfully breaks the 1.1940 support, the odds of witnessing a slump to the yearly low of 1.1841 can’t be ruled out.
GBP/USD: Four-hour chart
Trend: Further upside expected
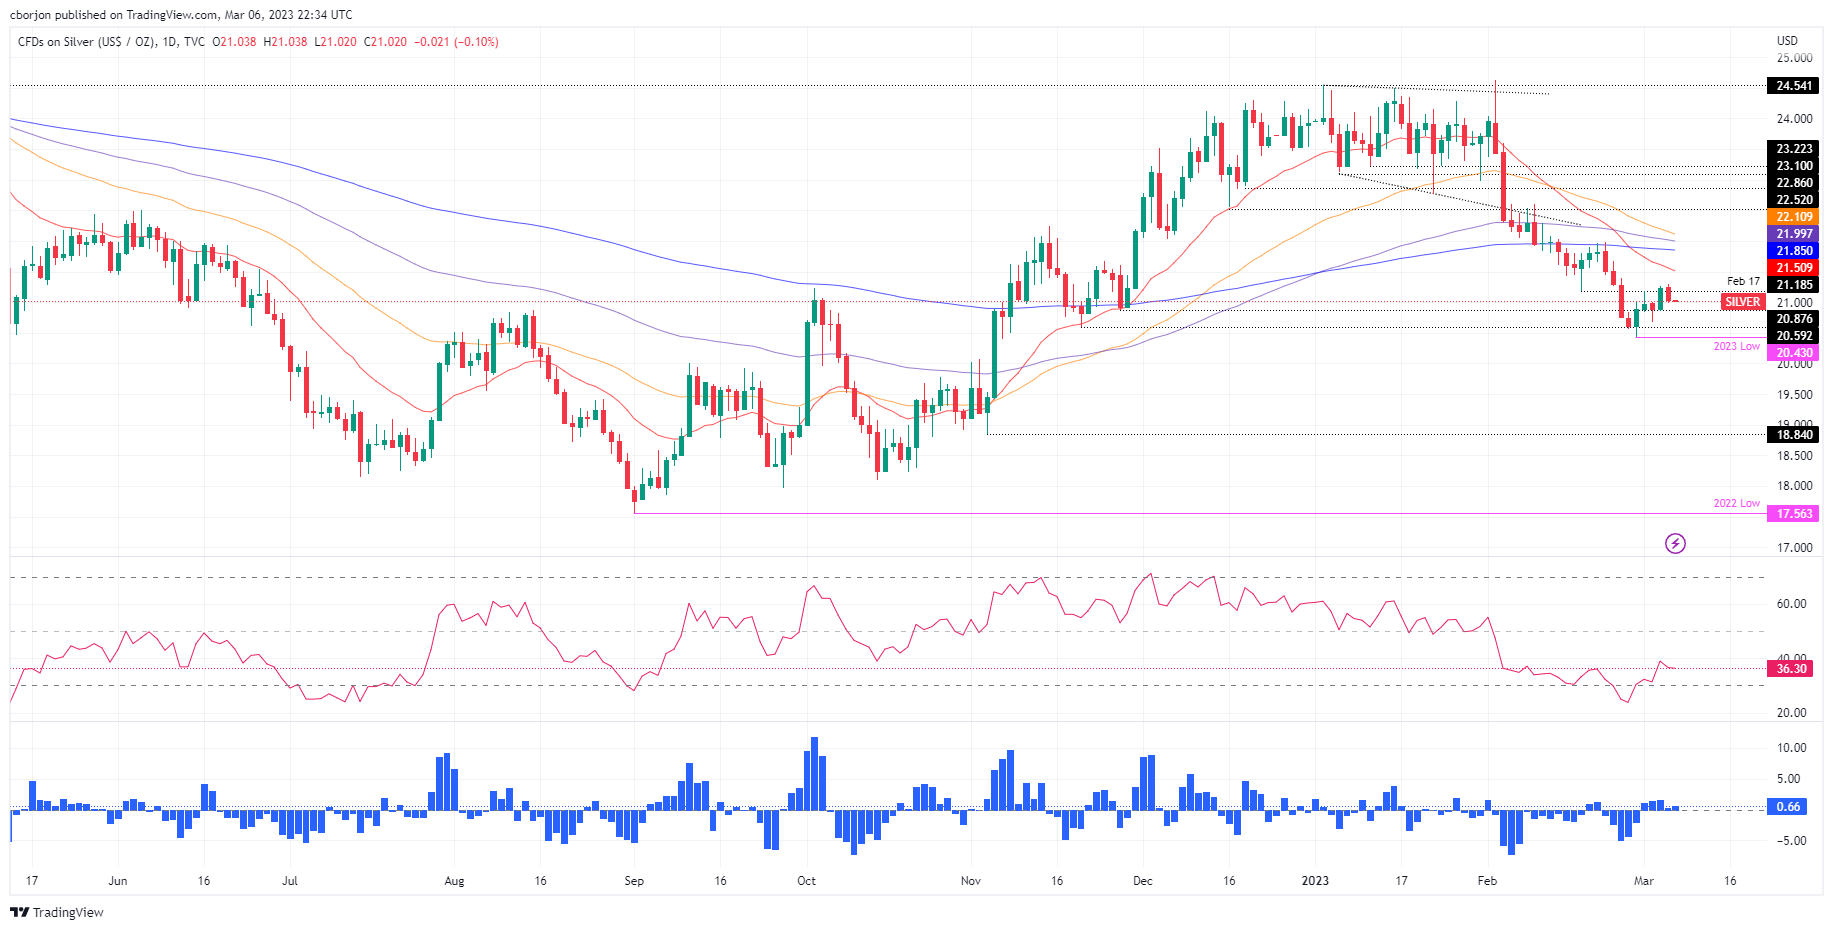
- Silver is retreating from last week’s highs at $21.30.
- Failure to decisively break above the February 17 low of $21.18 exacerbated a fall toward $21.00.
- Silver Price Analysis: Dark cloud cover forms eyeing a break below $21.00.
XAG/USD fails to extend last Friday’s rally, retreats from weekly highs of around $21.30, and drops 0.92% or 0.20 cents in Monday’s session. At the time of writing, the XAG/USD is trading at $21.02, below its opening price.
XAG/USD Price action
Silver is downward biased, as shown by the daily chart. After testing the February 17 daily low, which turned resistance at $21.18, the XAG/USD spot price dropped, as bears eye $20.00. However, on its way south, the XAG/USD needs to clear the $21.00 barrier. Once removed, the XAG/USD next support would be the March 3 low of $20.84, followed by the March 1 low of $20.68. A breach of the latter would expose the YTD low of $20.43.
After exiting oversold conditions, the Relative Strength Index (RSI) turned the corner and its aiming down. That suggests that sellers are gathering momentum, further reinforced by the Rate of Change (RoC), as buying pressure is losing momentum.
As an alternate scenario, the XAG/USD first resistance would be the March 6 high at $21.30. Once buyers reclaim that level, Silver could rally toward the 20-day Exponential Moving Average (EMA) At $21.50 before reaching the 200-day EMA at $21.85.
XAG/USD Daily chart
XAG/USD Technical levels
- Gold price remains pressured after reversing from three-week high.
- Cautious mood, rebound in United States Treasury bond yields allowed XAU/USD bears to sneak in.
- Federal Reserve Chairman Jerome Powell is up for Testimony before Senate Banking Committee, hawkish comments can weigh on Gold price.
- Second-tier China data, geopolitical headlines can also entertain XAU/USD traders.
Gold price (XAU/USD) holds lower ground near $1,847 after reversing from the highest levels in three weeks. The yellow metal’s latest pullback could be linked to the market’s cautious mood ahead of the key data/events, as well as a rebound in the United States Treasury bond yields. It’s worth noting, however, that the US Dollar’s failure to regain upside momentum ahead of the Federal Reserve (Fed) Chairman Jerome Powell’s Testimony, as well as the recent weakness in the US data and mixed Fed talks, keeps the XAU/USD buyers hopeful.
Gold bears sneak in as United States Treasury bond yields rebound
Although the Gold price began the week on a firmer footing, mainly due to the US Dollar weakness and risk-on mood, the recovery in the United States Treasury bond yields seem to have exerted downside pressure on the metal afterward. That said, the benchmark 10-year Treasury bond yields initially dropped to a one-week low of 3.897% before ending the day with mild gains near 3.96%. On the same line, the two-year counterpart ended Monday’s North American trading session with 0.60% intraday gains at 4.88%.
Mixed headlines from China, Fed talks weigh on XAU/USD price
While tracing the Monday’s mostly quiet market moves, even if the traders reversed directions later in the day, headlines from China and surrounding the Federal Reserve (Fed) could be termed as the key catalysts.
That said, China eyed the modest 5.0% economic growth in its annual session of the National People's Congress (NPC), versus 6.0% market forecasts, which in turn raised doubts on the health of the world’s biggest commodity user and weighed on Gold price. On the same line, were comments from outgoing China Premier Li Keqiang as he said, “China should promote the peaceful development of cross-Strait relations and advance the process of China's ‘peaceful reunification’, but also take resolute steps to oppose Taiwan independence.”
Elsewhere, San Francisco Federal Reserve Bank President Mary Daly highlighted the importance of incoming data to determine how high the rates can go. Previously, Atlanta Fed President Raphael Bostic renewed concerns about the policy pivot and renewed the Gold price buying. However, the US Federal Reserve published a semi-annual Monetary Policy Report on Friday wherein it clearly said, “Ongoing increases in the Fed funds rate target are necessary.” The report also stated that the Fed is strongly committed to getting inflation back to 2%.
Mixed United States data keeps Gold buyers hopeful
Given the recently softer prints of the United States ISM Services PMI for February, as well as the Durable Goods Orders for January and the Conference Board’s (CB) Consumer Confidence for February, the Federal Reserve’s (Fed) ‘higher for longer’ plan appears in question. The same helped the Gold price in the last week, as well as during early Monday. However, Monday’s US Factory Orders for January improved to -1.6% MoM versus -1.8% expected and -1.7% prior and hence questioned the XAU/USD bulls afterward.
Federal Reserve Chairman Powell eyed
Although China’s monthly trade numbers and headlines from the NPC can entertain Gold traders, semi-annual Testimony of Federal Reserve (Fed) Chairman Jerome Powell will be the key for XAU/USD traders, especially after recently mixed data and policy pivot talks. Fed’s Powell appears before the Senate Banking Committee on Tuesday and should defend his hawkish bias to keep the Gold bears on the table.
Also read: Gold Price Forecast: Bulls hold the grip, but for now, stay in the side-lines
Gold price technical analysis
Gold price confirmed a one-week-old rising wedge bearish chart formation on early Monday and has been depressed afterward.
In addition to the bearish chart pattern’s confirmation, bearish signals from the Moving Average Convergence and Divergence (MACD) indicator joins the absence of the extreme Relative Strength Index (RSI) line, placed at 14, to also favor downside bias.
With this, the XAU/USD bears appear well-set to test the 200-Hour Moving Avearge (HMA) support of around $1,830 before dropping towards the theoretical target of the rising wedge confirmation, near the $1,800 threshold.
Meanwhile, the Gold price recovery remains elusive unless crossing the stated wedge’s top line, close to $1,860 at the latest.
Following that, tops marked during February 14 and 09, respectively near $1,870 and $1,890 in that order, could lure the XAU/USD bulls.
Overall, Gold lures bears as one of this week’s key event looms.
Gold price: Hourly chart
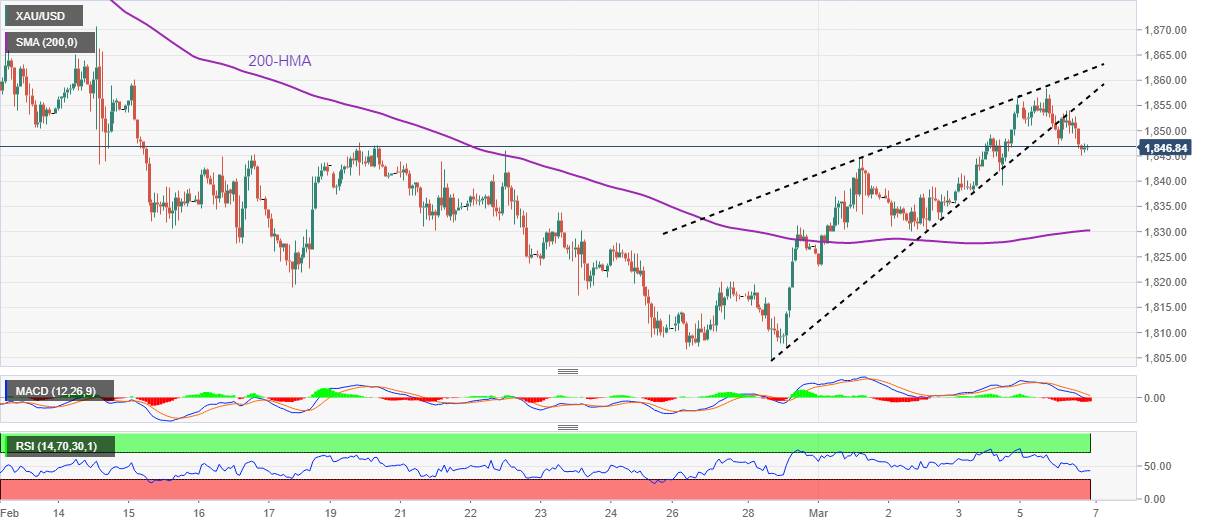
Trend: Limited downside expected
- AUD/USD has scaled above 0.6730 after a recovery move ahead of the RBA policy.
- A fifth consecutive 25 bps rate hike to 3.60% is expected from the RBA.
- US Labor market data could be resilient as consumer spending was extremely solid in February.
The AUD/USD pair has stretched its recovery above 0.6730 in the early Asian session. The Aussie asset is looking to add gains further as the Reserve Bank of Australia (RBA) will announce the interest rate decision. The RBA is expected to continue its policy tightening spell further to sharpen its monetary tools in the battle against soaring inflation.
Last week, the Australian monthly Consumer Price Index (CPI) softened significantly to 7.4% for January from the multi-decade high of 8.4%. Australian inflation has remained highly sticky and has not reacted as expected to the higher rates by the RBA. Therefore, RBA Governor Philip Lowe is expected to restrict monetary policy further in achieving price stability.
Analysts at Standard Chartered are of the view that “A 25 bps hike to 3.60%. We recently revised the terminal rate to 4.10% from 3.50% previously. Specifically, the central bank is to hike by 25 bps each in March, April, and May. Trimmed mean CPI inflation eased to 1.7% QoQ in Q4-2022 from 1.9% QoQ in Q3 – still far too high. Inflation pressures are also very broad – we estimate that 84% of items in the CPI basket are rising by more than 3% YoY. These factors raise risks of a 50 bps hike in March.”
The US Dollar Index (DXY) has sensed barricades around 104.40 and is continuing its downside move toward the critical support of 104.10. S&P500 futures have added some gains in the early Asian session after a choppy Monday, portraying an improvement in the risk appetite of the market participants. The 10-year US Treasury yields look set to reclaim the 4% figure ahead.
Going forward, the US Dollar will dance to the tunes of the United States Automatic Data Processing (ADP) Employment Change (Feb) data, which will release on Wednesday. The economic data is expected to improve to 195K, lower than the former released of 105K. US Labor market data could be resilient as consumer spending has remained solid in February, which could propel the demand for more talent to address fresh demand for goods and services.
- USD/MXN reclaims 18.0000 post US factory data, ahead of Fed’s Powell speech.
- The US Dollar remained offered, though it was no excuse for the USD/MXN to register gains.
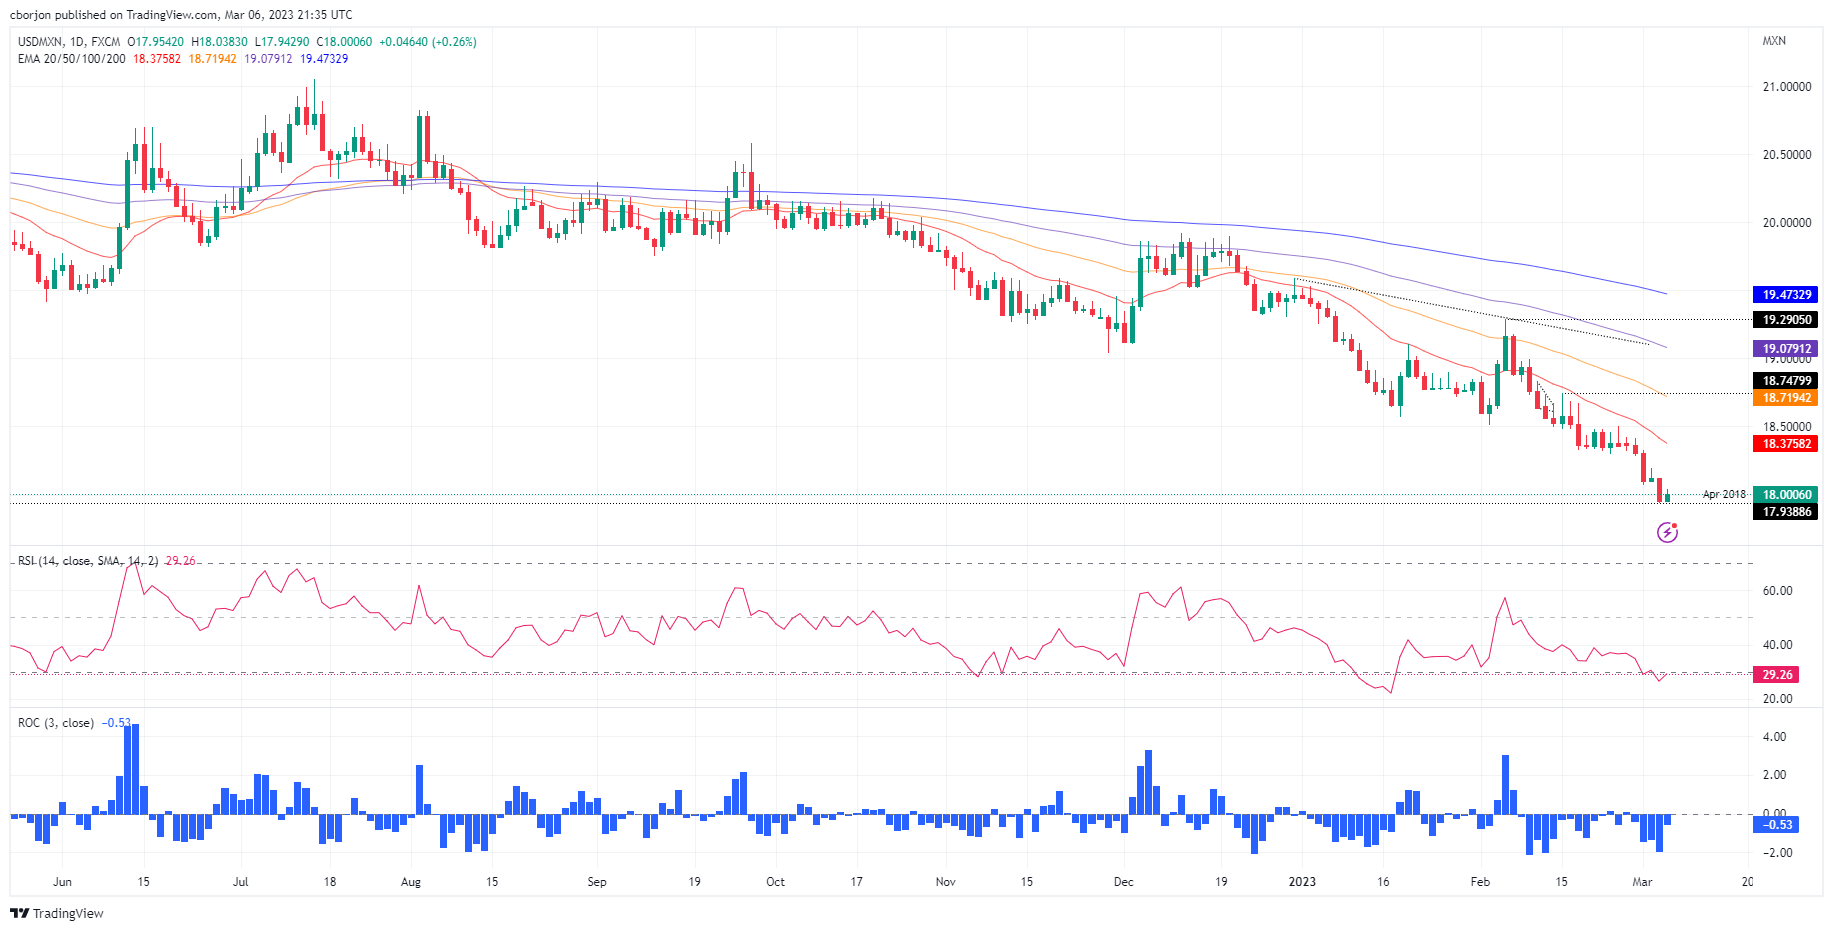
- USD/MXN Price Analysis: Downward biased, but it would need a daily close below $18.00 to expose 6-year lows.
The USD/MXN is recovering some ground on Monday after falling to 5-year lows below $18.00, at 17.9409, and climbing above the 18.0000 figure amidst overall US Dollar (USD) weakness. The USD/MXN is exchanging hands at 18.0022 and gains 0.27%.
USD/MXN reclaims $18.00 as the pair consolidates
Wall Street is set to finish Monday’s session with gains. The US Federal Reserve Chair Jerome Powell will take the stand in the United States (US) Congress on March 7 and 8. He’s expected to deliver a speech reiterating the Fed’s commitment to taking inflation and holding higher rates for a certain time. Nevertheless, analysts expect Chair Powell to be vague if asked where the Federal Funds Rate (FFR) would peak.
In the meantime, data revealed during the day showed that US Factory Orders plunged less than estimates of -1.8%; it came at -1.6%. The US Commerce Department report indicated an increase in the shipment and production of goods, which ended a two-month consecutive decline trend.
The US Dollar Index (DXY) a gauge for the buck’s value vs. a basket of six currencies, continued its downtrend last week by -0.19%, at 104.325, capping the USD/MXN gains during the day.
On the Mexican front, data from the National Statistics Agency, known as INEGI, showed that automotive production and exports climbed more than expected a year ago. Additionally, Tesla’s 10 billion US dollars investment in Mexico keeps the Mexican Peso (MXN) afloat.
USD/MXN Technical Analysis
The USD/MXN daily chart portrays the MXN would continue to strengthen vs. the US Dollar. Nevertheless, it could consolidate as traders assess the USD/MXN current exchange rate. An extension below $17.94 could witness the USD/MXN reaching the July 2017 low of 17.4498. A break below will expose the April 2016 low of 17.0509. Conversely, if the USD/MXN reclaims 18.1208, that would open the door to testing the 20-day EMA at 18.3757.
What to watch?
- NZD/USD bulls eye horizontal resistance and a test of 0.6270 that guards 0.6300.
- The right-hand side of the inverse head and shoulders is underway.
NZD/USD is in the throes of completing the right-hand side of the inverse head and shoulders pattern as the following charts illustrate:
NZD/USD weekly chart
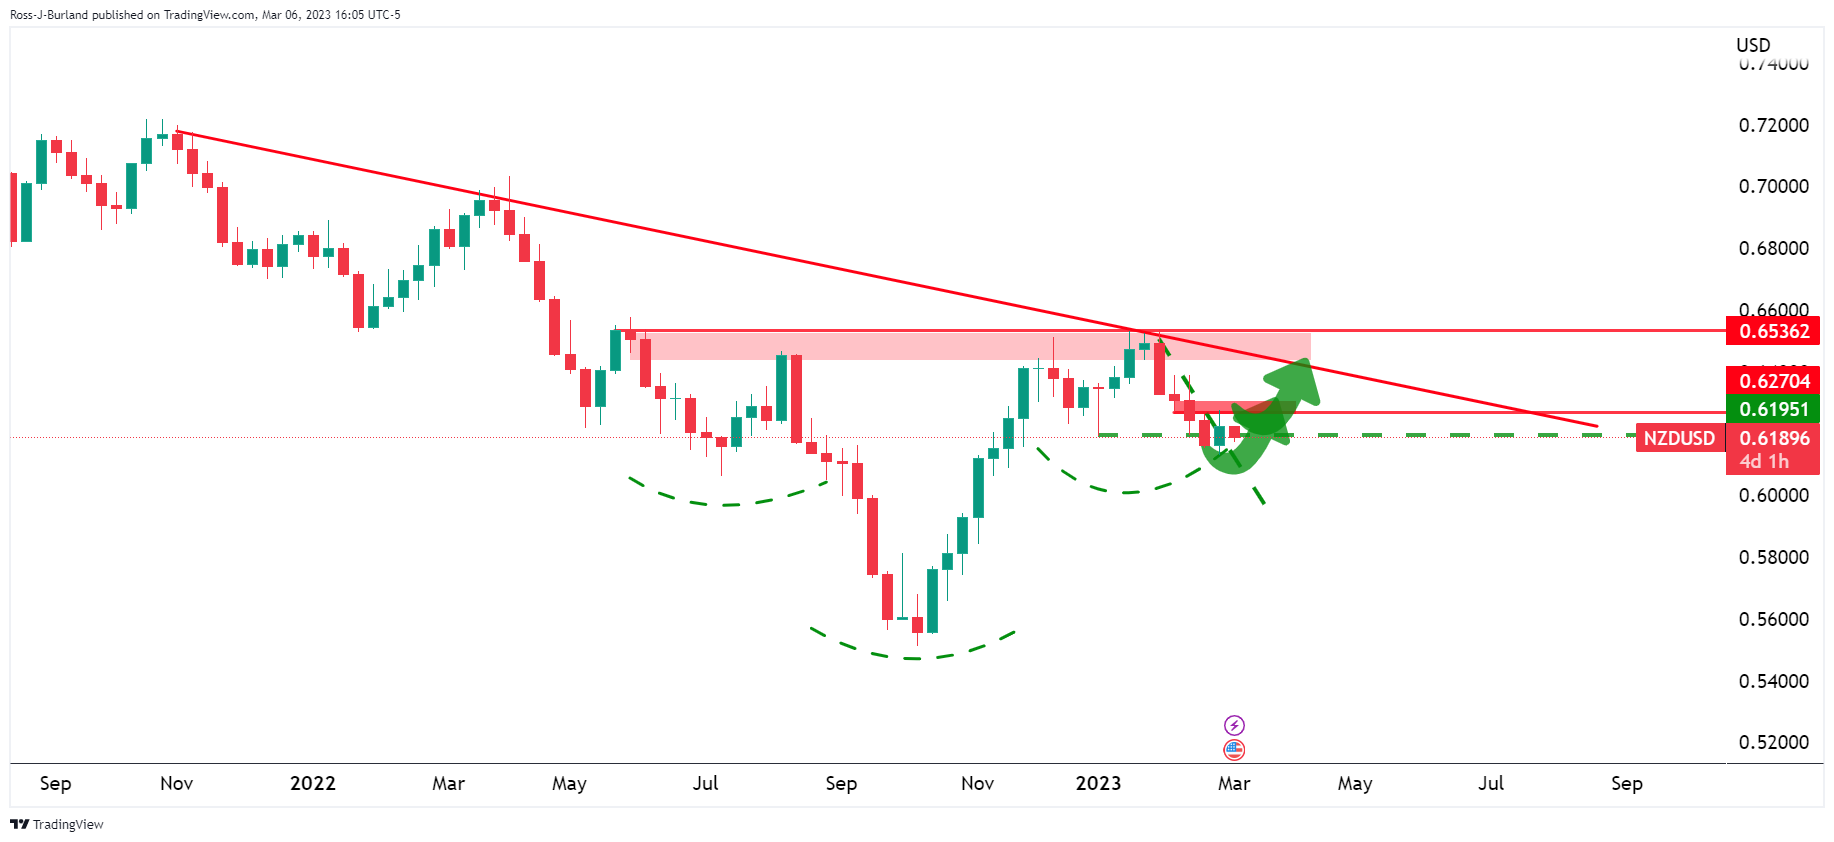
The price has been buried below trendline resistance and the neckline of the head and shoulders as per the weekly chart above.
NZD/USD daily charts
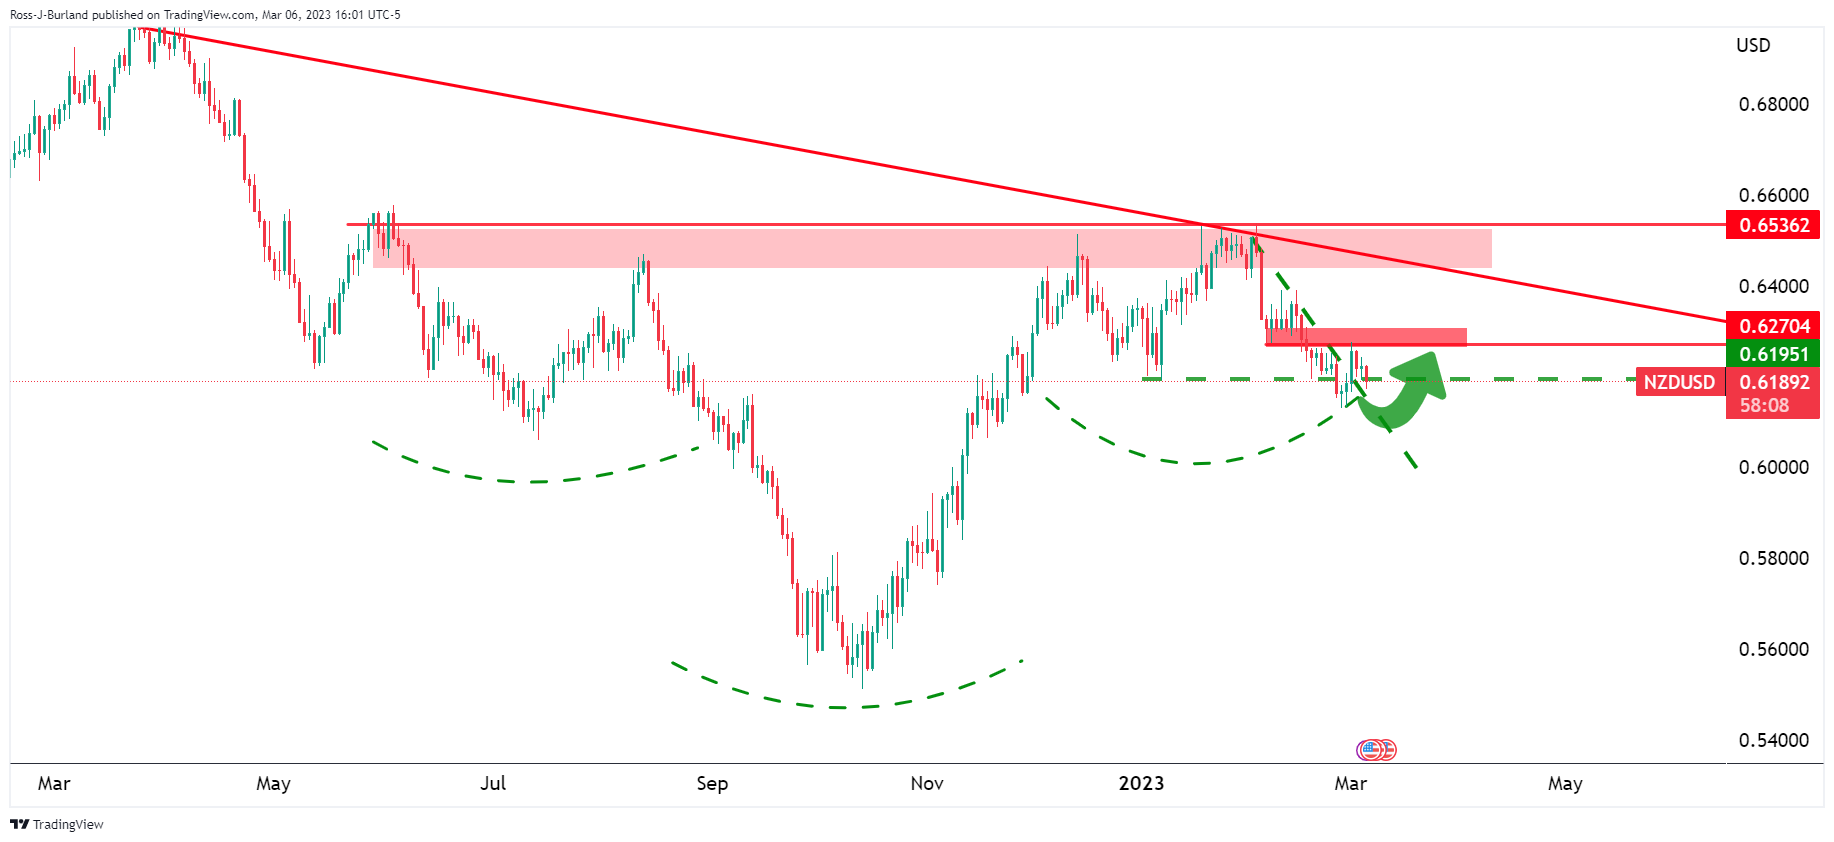
The right-hand shoulder is being carved:
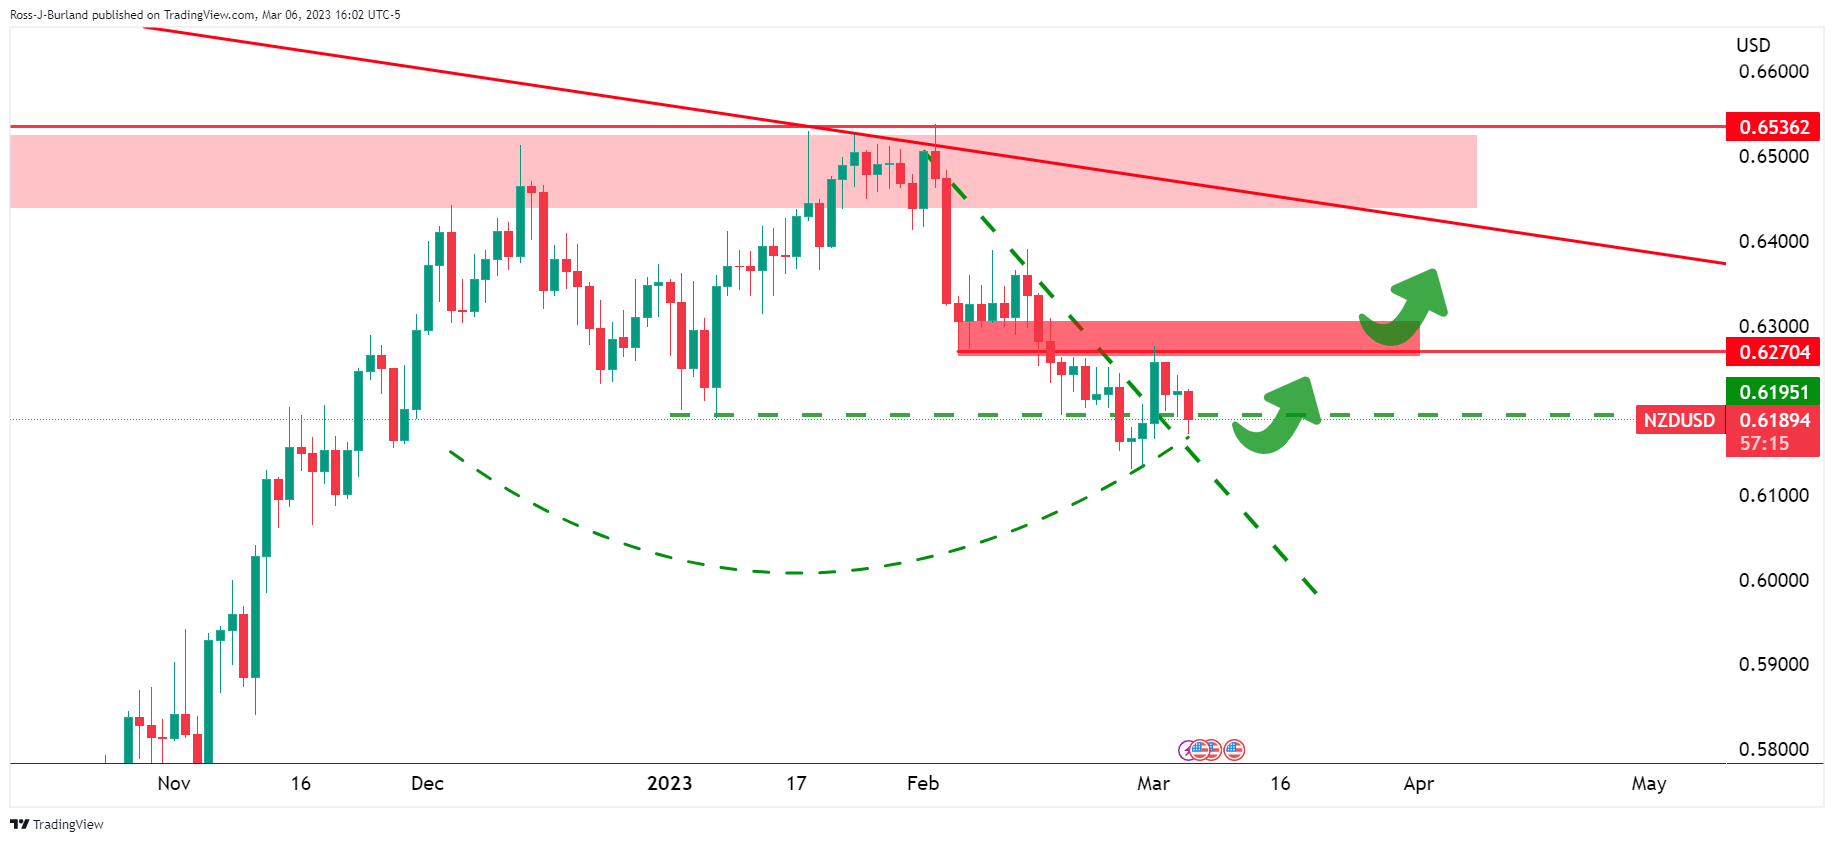
Breakout shorts were triggered into the market on a break of 0.6200 which leaves prospects of a short squeeze and completion of the lows in the right-hand shoulder. This leaves prospects of a move towards horizontal resistance and a test of 0.6270 that guards 0.6300.
Here is what you need to know on Tuesday, March 7:
A quiet beginning for a busy week. Wall Street trimmed gains late on Monday to post a mixed close. The US Dollar also finished with mixed results, as market participants await new guidance from Fed Chair Jerome Powell that will testify before the US Congress on Tuesday and Wednesday. Also, US job numbers are on the radar (ADP on Wednesday, Jobless Claims on Thursday and NFP on Friday). The DXY lost 0.15%, falling below 104.50.
The Euro was among the top performers supported by higher Eurozone bond yields following hawkish comments from European Central Bank (ECB) officials. EUR/USD hit weekly highs near 1.0700 and trimmed gains. EUR/GBP rose back above 0.8800. GBP/USD fell modestly after being unable to break 1.2050. The CHF rose across the board after higher-than-expected inflation data from Switzerland.
Government bond yields rose and weighed on the Yen. The US 10-year yield rose from 3.83% and peaked at 3.90%. USD/JPY is hovering around 136.00. The Bank of Japan will announce its decision on monetary policy on Thursday.
The Kiwi and the Aussie were the worst performers in the G10 space. AUD/USD dropped toward 0.6700, holding into a familiar range. NZD/USD hit the lowest in almost a week near 0.6170. The Reserve Bank of Australia will announce its decision on Tuesday. A 25 bps rate hike is expected. Chinese data is also due on Tuesday.
The USD/CAD remained in a range around 1.3600 ahead of Wednesday’s Bank of Canada meeting and Friday’s Canadian employment report.
Gold hit weekly highs above $1,850/oz but then pulled back, hit by higher yields and with investors moving to the sidelines waiting for Powell. Silver fell to $21.00. Crude oil prices rose more than 1%. Cryptocurrencies finished mostly flat.
Like this article? Help us with some feedback by answering this survey:
- GBP/USD losing ground as a comeback in the greenback kicks in.
- Eyes turn to the Fed's chairman Powell and US NFP.
GBP/USD is down some 0.2% on the day as we head toward the Wall Street close with the price traveling between 1.1992 and 1.2048. Despite a soft US Dollar at the start of the day as investors awaited testimony by Federal Reserve Chair Jerome Powell and Nonfarm Payrolls, GBP stayed pressured as central bank divergences play out.
The Federal Reserve may keep raising interest rates into June while the Bank of England could soon pause policy tightening while the BOE may only have 25bp more of tightening left to do. Key survey data suggest tightness in the UK labour market is abating and the Gross Domestic Product is up next for review.
Analysts at TD Securities argued that it is set to bounce back sharply as many of the special factors that weighed on the December data will reverse. ''A downtick in strike action, a jump in hospital visits, the resumption of the Premier League after the end of the World Cup, and a bounce-back in school attendance likely drove a 0.7% m/m increase in services output. Underlying growth dynamics likely remained weak though,'' the analysts argued.
Meanwhile, Federal Reserve chairman Jerome Powell’s testimony before Congress on Tuesday and Wednesday will be a driver for the US Dollar as will the jobs report. The analysts at Danske Bank are expecting growth to moderate to 220k after the effects of warm weather and heavy seasonal adjustments in January faded. ''Overall, leading indicators suggest that labor market conditions have remained tight amid a recovering growth outlook. The FOMC blackout period will begin on Saturday 11th of March, so Fed still has the option to guide the markets after the Jobs Report.''
Meanwhile, Fed funds futures traders are pricing in a 76% probability the Fed will raise rates by 25 basis points at its March 21-22 meeting, and a 24% likelihood of a 50 basis points increase.
- WTI bulls are moving back in for a test in the $80s.
- The focus will be back on the US economy this week.
West Texas Intermediate (WTI) erased earlier declines and is up for the fifth straight day, moving in on the $80s. It has made the highest closing price in the futures markets in three weeks. Despite the sentiment for a slightly-less-robust rebound in China's economy, the black gold is back into the hands of the bulls late in the day on Wall Street.
At the National People's Congress, China settled for a growth target of 5% in 2023. It was at the low end of expectations and suggests that China will not deliver major stimulus this year, but has an eye on long-term sustainability of growth.
Meanwhile, CTAs are set to remain buyers of WTI crude so long as prices can hold above the $73.00 mark, which has served as the bottom of the recent technical range, analysts at TD Securities said recently, adding:
''Looking forward, while outsized refinery maintenance is likely contributing to the oil inventory increases, they are also keeping product markets seasonally tight, offering a level of support to the market. Furthermore, the G7 oil price cap is starting to add additional steps to the buying process and could weigh on purchases from India, who have been a major buyer of Russian barrels thus far,'' the analysts explained. ''In this sense, if Russian supply starts to tighten, at a time when the market is more optimistic on the prospect of Chinese reopening demand, oil markets could be set up for a sizable short-covering regime on the horizon.''
Meanwhile, the key data for the week will be with the US jobs market on Friday in the form of US Nonfarm Payrolls. The analysts at Danske Bank are expecting growth to moderate to 220k after the effects of warm weather and heavy seasonal adjustments in January fade. ''Overall, leading indicators suggest that labor market conditions have remained tight amid a recovering growth outlook.''
This data will follow the Fed Chair Powell's testimony where he might articulate a hawkish sentiment and a step back from the more cautious policy framework for raising interest rates. ''Recent strength in non-farm payrolls and retail sales argue that policy is not restrictive and the Fed may have been wrong-footed by a soft patch in the data in Q4,'' analysts at ANZ Bank said.
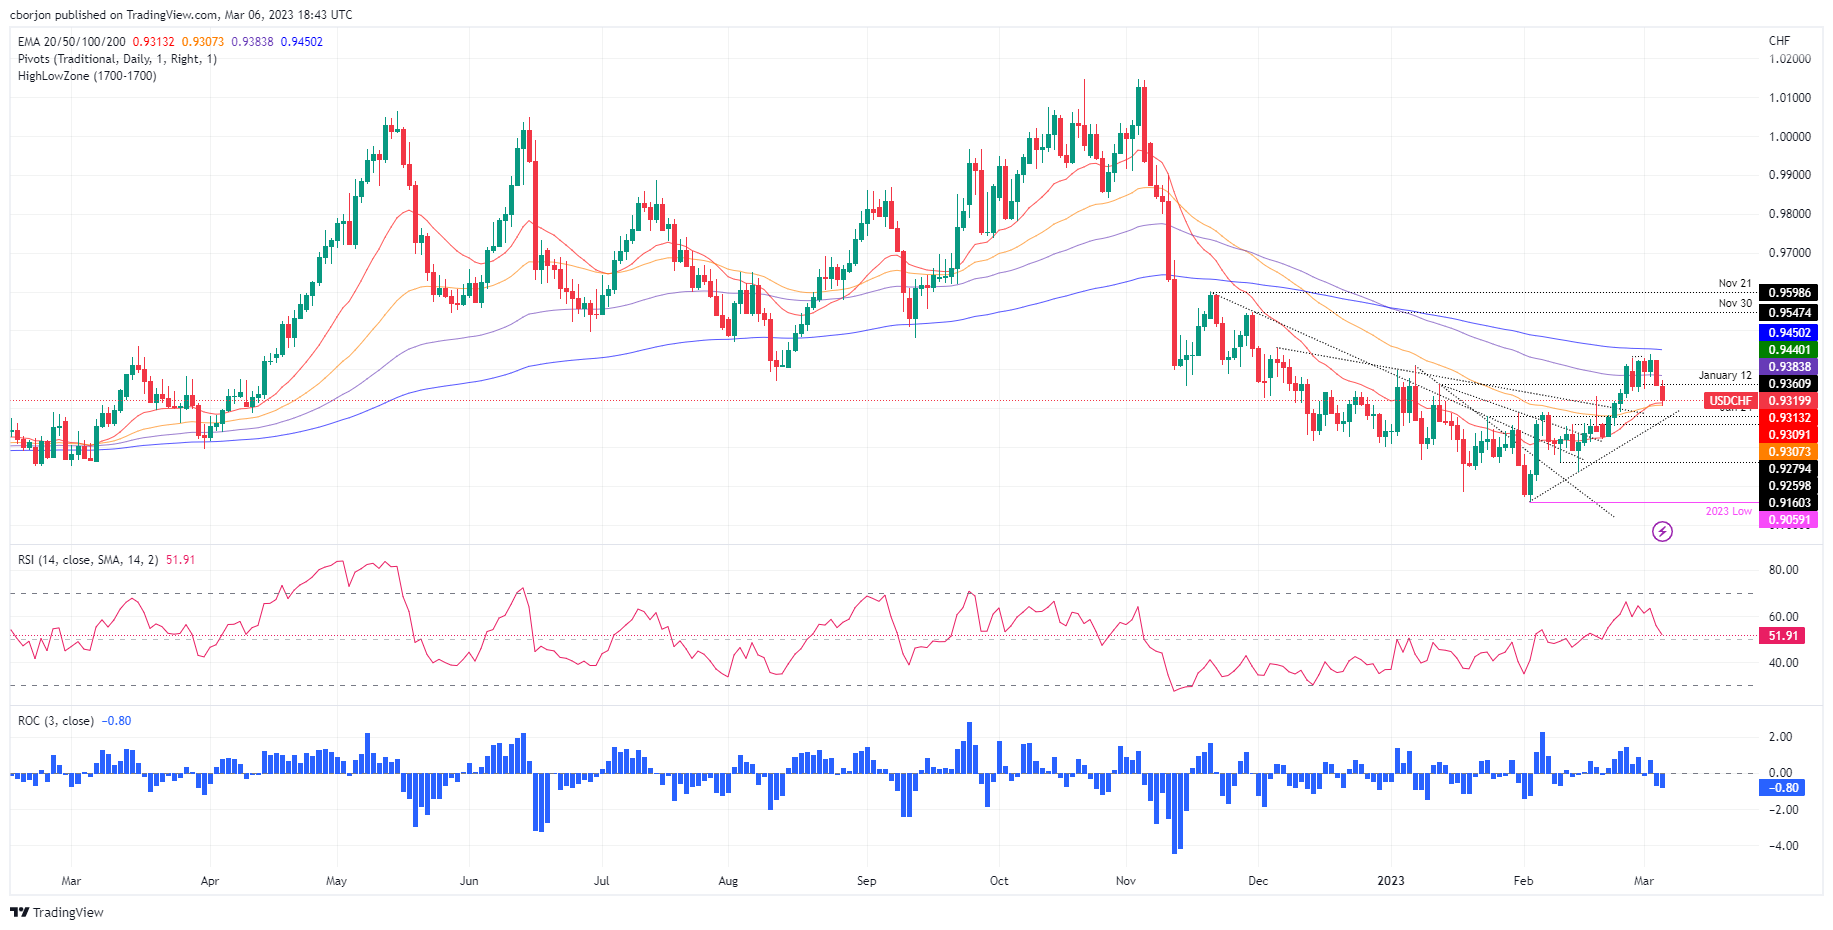
- USD/CHF stumbled below the 100-day EMA, eyeing a break below the 20/50-day EMAs.
- The Relative Strength Index edges down but at the brisk of turning bearish.
- USD/CHF Price Analysis: Failure to crack the 200-day EMA opened the door for further downside.
The USD/CHF dropped after failing to test the 200-day Exponential Moving Average (EMA), which extended its losses past the 100-day EMA at 0.9383. the USD/CHF, Monday’s high, was 0.9373 before retracing toward the low of 0.9310s. At the time of writing, the USD/CHF is trading at 0.9317, down 0.44% or 40 pips.
USD/CHF Price action
At the beginning of the first full week in March, the USD/CHF keeps a bearish tone but faces solid support at the confluence of moving averages. The 20 and 50-day EMA rest at 0.9313 and 0.9307, respectively, areas that are the first lines of defense for USD/CHF’s bulls. Break below would expose the 0.9300 psychological price level, ahead of a one-month-old upslope support trendline at 0.9270.
Even though the USD/CHF’s bias is bearish, the Relative Strength Index (RSI) remains bullish but aims lower. If the RSI turns bearish, that will exacerbate an acceleration of the downtrend and put into play the YTD low at 0.9059.
As an alternate scenario, the USD/CHF first resistance would be the 100-day EMA at 0.9383. Break above will expose 0.9400, ahead of the important 200-day EMA At 0.9450, ahead of reaching the psychological 0.9500 mark.
USD/CHF Daily chart
USD/CHF Technical levels
- USD/CAD will depend on a number of key events this week.
- Bank of Canada, Nonfarm Payrolls and Federal Reserve's chair Jerome Powell in the spotlight.
USD/CAD is up 0.11% and has traveled between a low of 1.3581 and a high of 1.3628 on the day so far. It is going to be a big week ahead while a) investors wait on testimony by Federal Reserve Chair Jerome Powell and Nonfarm Payrolls due on Friday and b) the Bank of Canada Rate Decision will be the major release for CAD for the week.
''We expect the BoC to hold the overnight rate at 4.50% on Wednesday, and maintaining that hold for all of 2023,'' analysts at TD Securities said in a note. '' A flat print on Q4 GDP has removed some of the uncertainty from this meeting; while we expect the statement to acknowledge robust job growth, it should also note that inflation continues to subside with the outlook evolving as expected, which is crucial for the Bank's conditional pause,'' the analysts added.
Key events for the US Dollar
As for the US Dollar, financial market observers are waiting to be able to gauge how much more the Federal Reserve will raise interest rates with the information that could come of Fed Chair Powell's testimony and the jobs data. The US Dollar index, DXY, which measures the performance of the US currency against six others, was last down 0.2% on the day at 104.30, having lifted off a session low of 104.16 but well below the 104.69 highs following last week's weekly loss that was made for the first time since January, last week. This was despite a belief among investors that the central bank might have to switch back to half-point rises. However, the futures imply a 76% chance the Fed will raise interest rates by 25 basis points at its meeting on March 22, with a 24% chance of a 50 bps increase.
In this regard, what Powell says and what the jobs report shows will hold the key for the US Dollar. Powell will have the chance to signal the direction of Fed rates policy for the year. ''We expect he'll indicate more tightening is needed but to remain rather vague regarding the terminal rate. A concern about recent data strength likely will also be flagged but the Fed wants to see confirmation in Feb data before acting,'' analysts at TD Securities said.
As for Nonfarn Payrolls, the analysts at Danske Bank are expecting growth to moderate to 220k after the effects of warm weather and heavy seasonal adjustments in January fade. ''Overall, leading indicators suggest that labor market conditions have remained tight amid a recovering growth outlook. The FOMC blackout period will begin on Saturday 11th of March, so Fed still has the option to guide the markets after the Jobs Report.''
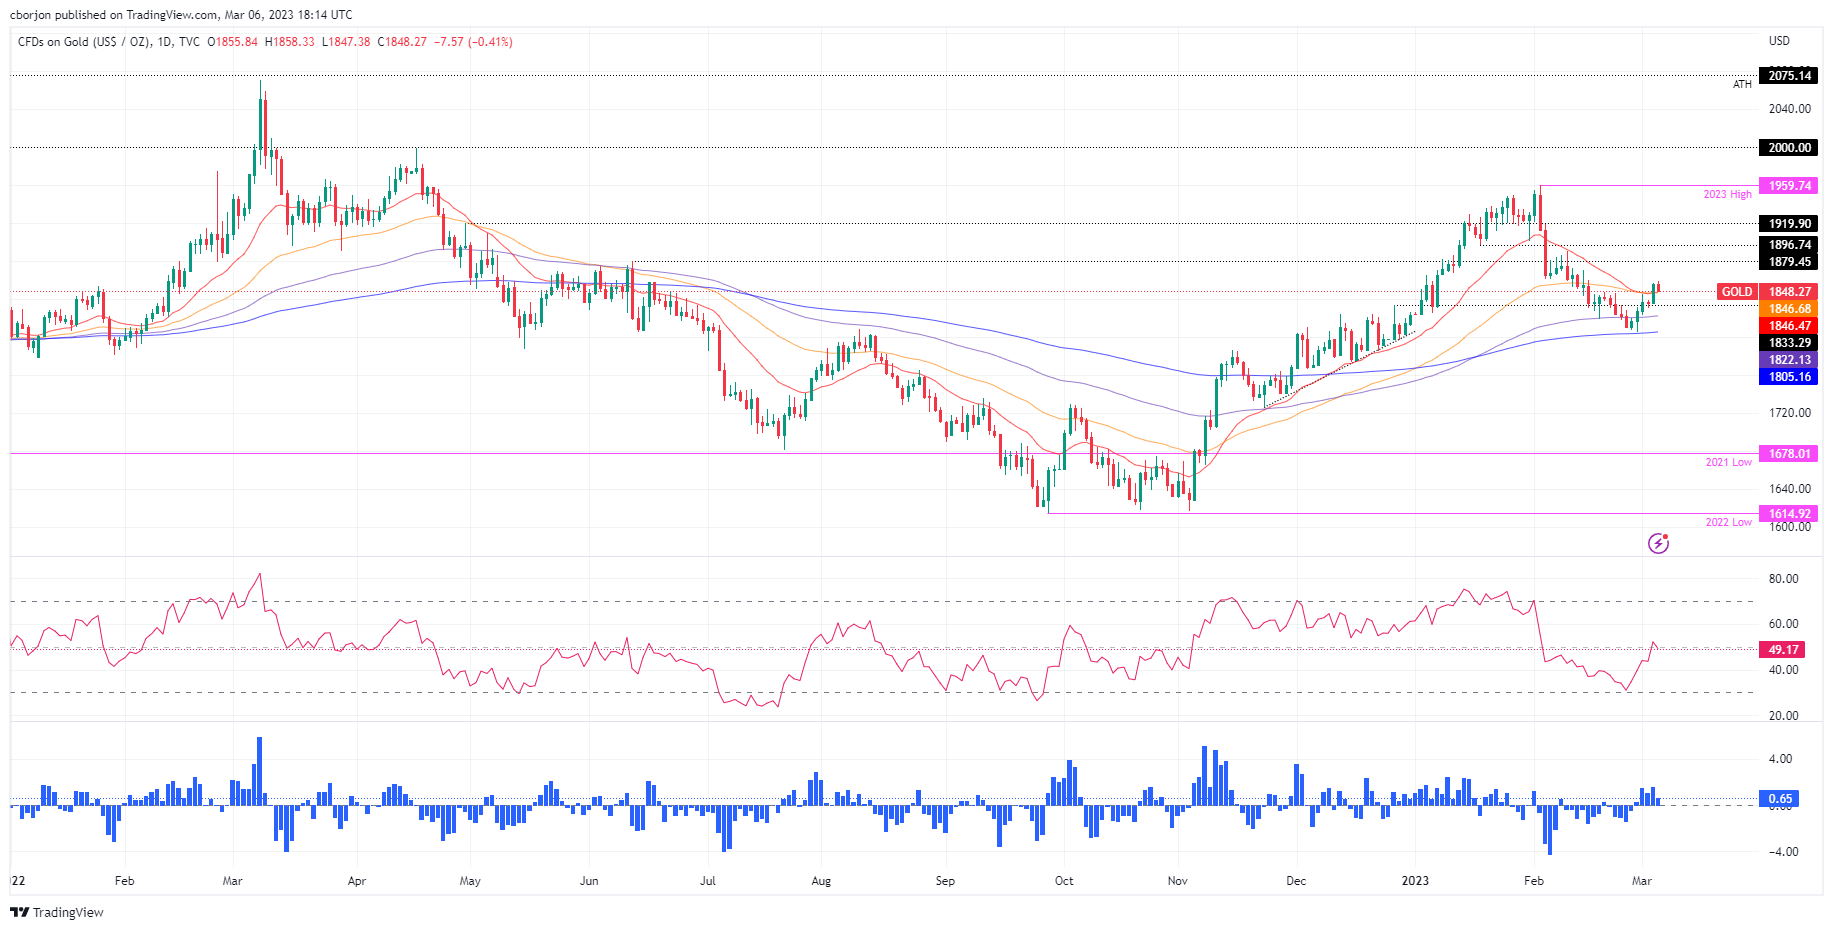
- Gold price stumbles 0.37% on Monday courtesy of higher US Treasury bond yields.
- US Factory Orders dropped less than estimates though market players ignored it.
- Traders are eyeing the appearance of the US Federal Reserve Chair Jerome Powell at the US Congress.
- Gold Price Analysis: Downward biased in the near term.
Gold price slides 0.26% or $3.00 a troy ounce in the North American session as UST bond yields recover some ground turning positive a headwind for the non-yielding metal. The US economic calendar ahead of next week’s Tuesday inflation figures would be busy, led by Fed speakers and employment data. At the time of typing, the XAU/USD exchanges hands at $1850.57 after hitting a daily high of $1858.33.
Gold falls as US T-bond yields climbed
US equities reflect a risk-on impulse in the financial markets. A tranche of data from the United States (US), namely Factory Orders for January, dropped less than the -1.8% MoM estimated, at a -1.6% fall. The report from the US Commerce Department showed improved shipments and manufactured goods, snapping two straight months of declines.
In the meantime, the US Dollar (USD) failed to gain traction following the report, as shown by the US Dollar Index (DXY) falling 0.28%, at 104.232. Contrarily, US Treasury bond yields, mainly the 10-year, is up one bps at 3.967%, a headwind for Gold prices.
XAU/USD’s price would likely remain volatile as market participants prepared for the US Federal Reserve (Fed) Chairman Jerome Powell’s speech at the US Congress on March 7 and 8. Market participants estimate a hawkish stance, echoing some of the messages spread by his colleagues. Investors expect that Powell would reiterate the Fed’s commitment to curb inflation and emphasize the need to go higher for longer.
In addition to Jerome Powell’s appearance at the congress, XAU/USD traders are eyeing US employment data. The prior month’s US Nonfarm Payrolls report crushed estimates of 200K, creating more than 500K jobs in the economy. For February, market analysts expect an increase of just 200K compared to last month’s data. Upbeat data would send XAU/USD extending its losses, as further labor market tightening would warrant higher rates in the US economy, so it could be slowed down to curb inflation.
In the meantime, traders anticipate that the US Federal Reserve will hike 25 bps at the upcoming March meeting. However, recent Federal Reserve’s hawkish commentary, and US data, had put a 50 bps increase in the table, as two officials expressed a more hawkish stance than expected.
XAU/USD Technical analysis
From a daily chart perspective, XAU/USD is neutral to upward biased once it conquered the 20 and 50-day Exponential Moving Averages (EMAs). Nevertheless, as UST bond yields aim north, Gold is taking its toll, retreating below the $1850 area. Furthermore, the Relative Strength Index (RSI) exceeded the 50-midline before turning bearish. Therefore, in the short term, the XAU/USD path of least resistance is downwards.
Gold’s first support would be the confluence of the 20/50-day EMAs at $1846.00. Once cleared, XAU/USD would get towards the March 3 daily low of $1835.51, followed by the 100-day EMA at $1822.15 and the 200-day EMA at $1805.16.
What to watch?
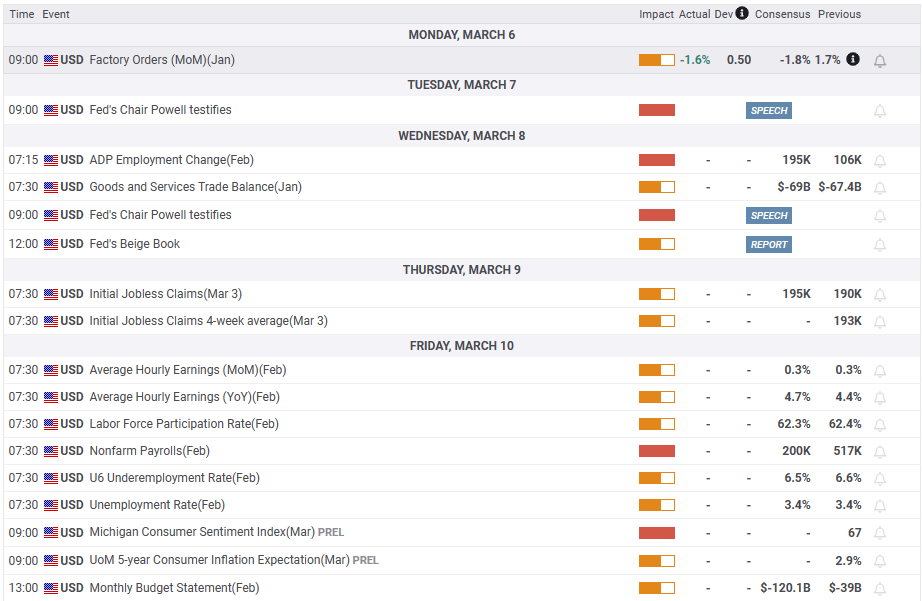
EUR/GBP Price Analysis: Clears the 20/50-DMA with bulls eyeing 0.8900
- The EUR/GBP path of least resistance is upward biased after clearing important technical levels.
- The pair is testing a minor resistance trendline, which, once broken, would send the EUR/GBP toward 0.8900.
- EUR/GBP Price Analysis: Upward biased and could test 0.8900.
The EUR/GBP climbs and cracks the 50 and 20-day Exponential Moving Averages (EMAs) on Monday as the Pound Sterling (GBP) weakens. Additionally, the EUR/GBP bulls are eyeing to break March’s monthly high of 0.8896 to test the 0.8900 figure. At the time of writing, the EUR/GBP is exchanging hands at 0.8880 after hitting a low of 0.8820.
EUR/GBP Price action
On Monday, the EUR/GBP 50 pip gain dragged the pair towards a one-month-old resistance trendline that passes around the 0.8860/80 range, which, if broken, would exacerbate a test of the 0.8900 mark. Nevertheless, March’s 1 high of 0.8896 would be the first resistance to be tested before claiming the former.
If the EUR/GBP breaks 0.8900, the next resistance would be the February 20 high of 0.8928. A breach of the latter and the 0.8950 would be next, followed by the YTD high of 0.8978.
The path of least resistance is upwards, as the Relative Strength Index (RSI) confirmed, with the RSI at bullish territory, aiming toward higher readings. Although near the neutral area, the Rate of Change (RoC) suggests that buyers are still in control.
As an alternate scenario, if the EUR/GBP drops below the 220-day EMA at 0.8840, that would pave the way to the 50-day EMA at 0.8816, ahead of 0.8800.
EUR/GBP Daily chart
EUR/GBP Technical levels
- Euro outperformers its G10 rivals on Monday, EUR/GBP near weekly highs.
- US Dollar losses momentum DXY drops to five-day lows.
- EUR/USD looking again at the 1.0700 area.
The EUR/USD is up on Monday, moving toward last week's high and with 1.0700 again on the radar. A stronger Euro across the board has been supportive of the pair, while at the same time, the US Dollar weakened. EUR/GBP is back above 0.8800.
Stocks up, Treasury yields down
The Euro is outperforming on Monday among the G10 space despite lower-than-expected economic data. The Eurozone (EZ) Sentiment Investor Confidence index dropped in March to -11.1, against expectations of a slide to -8.6. EZ Retail Sales rose 0.3% in February, below the 1% increase expected of market consensus; on the positive, January’s -2.7% was revised to -1.6%.
In the US, Factory Orders in January fell by 1.6%, less than the decline expected of 1.8%. The Greenback rose marginally immediately after the report and then retreated.
Equity prices are up on Wall Street, with the Dow Jones gaining 0.42% and the Nasdaq 0.98%. At the same time, US yields are flat for the day. The improvement in market sentiment weighs on the US Dollar.
Market participants await key events ahead for the week that includes comments from Fer Chair Jerome Powell on Tuesday, and the NFP report on Friday.
A test of last week high looms
The EUR/USD is trading at daily highs above 1.0880, moving closer to 1.0690 (last week’s high) and also to the 1.0700/05 area. Technical indicators favor the upside but the Euro needs to break and consolidate above 1.0705 to open the doors to more gains.
The immediate support might be seen at 1.0640 (20-hour Simple Moving Average) followed by 1.0615 and an uptrend line at 1.0605 that should limit the downside on Monday.
Technical levels
Economists at TD Securities discuss the Reserve Bank of Australia (RBA) interest rate decision and its implications for the AUD/USD pair.
Hawkish +25 bps (35% prob)
“If the Bank retains the same language as the Feb Statement: ‘The Board expects that further increases in interest rates will be needed over the months ahead…’, the market is likely to imply this as locking in 25 bps rate hikes in April AND May. AUD/USD 0.6800.”
Base Case: Neutral +25 bps (40% prob)
“If the Bank reverts to wording from the Dec'22 Statement that ‘The Board expects to increase interest rates further over the period ahead, but it is not on a pre-set course’, the market is likely to read this as the Bank being more uncertain and giving itself optionality on the policy rates outlook. In this instance, the next 25 bps hike could be April and/or May. AUD/USD 0.6730.”
Dovish +25 bps (25% prob)
“Text as in the ‘neutral’ scenario AND reintroducing ‘lag’ in monetary policy. The market is likely to read this as the RBA delivering one more hike and then pausing especially if the Bank acknowledges softer domestic data outcomes. AUD/USD 0.6690.”
See – RBA Preview: Forecasts from 9 major banks, hiking for the fifth time by 25 bps
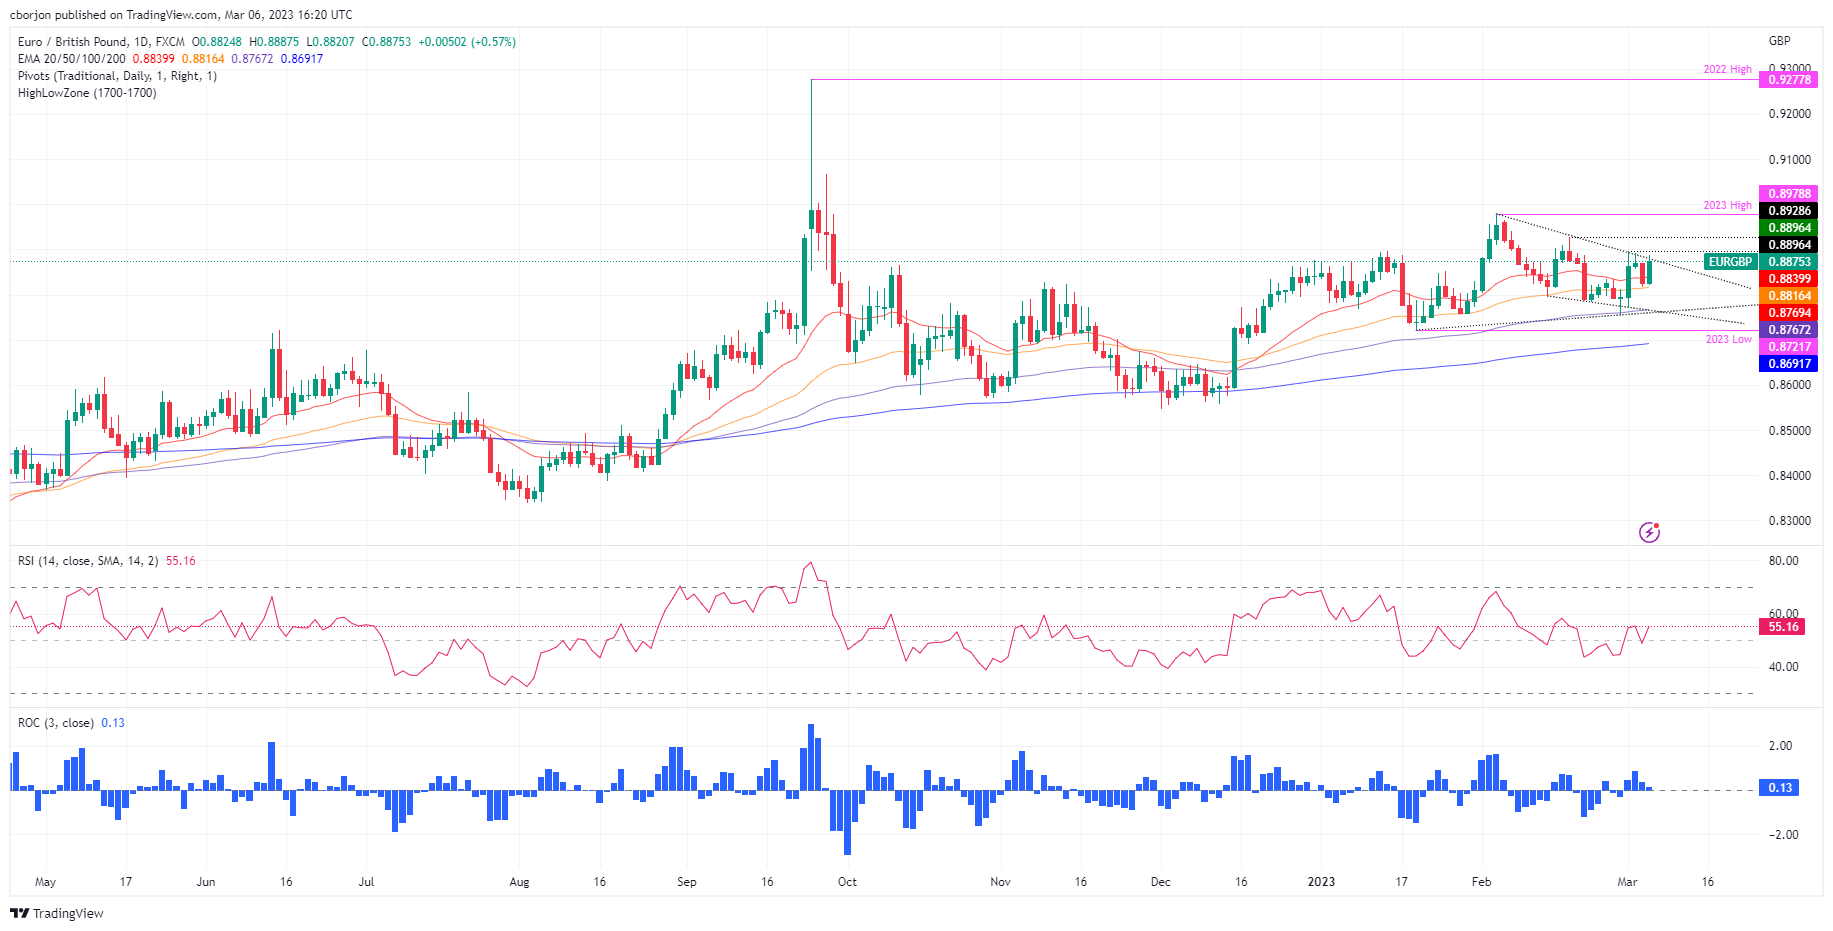
- GBP/USD tests the 100-day Exponential Moving Average at 1.2033.
- Traders are focused on growth figures from the UK, Fed Chair Powell’s speech at Congress, and US NFP figures.
- GBP/USD Price Analysis: Consolidated, waiting for a fresh catalyst to get direction.
GBP/USD trims some of last Friday’s gains despite an upbeat sentiment led by Wall Street, opening in the green. A light calendar in the United Kingdom (UK) would keep traders focused on the busiest docket in the United States (US). At the time of writing, the GBP/USD is trading at 1.2019.
The GBP/USD at the mercy of US economic data
As abovementioned, risk sentiment is a mixed bag. The UK economic calendar will reveal the Gross Domestic Product (GDP) on Friday, ahead of the Bank of England’s (BoE) March 23 meeting. The US economic docket will feature Factory Orders for January, foreseen to fall to -1.8%, below the prior’s month reading of 1.8%.
The greenback (USD) is printing losses, capping the GBP/USD’s fall below the 1.2000 figure. The US Dollar Index (DXY), a gauge of the buck’s value vs. a basket of six currencies, extended its losses, by 0.14%, at 104.380. Meanwhile, US Treasury bond yields, which underpinned the USD last week’s price action, are down, with the 10-year benchmark note rate below 4%, at 3.950%.
The week could be volatile due to US Federal Reserve (Fed) Chairman Jerome Powell’s appearance at the US Congress on March 7 and 8. Analysts expect Powell to maintain a hawkish stance, echoing some of his colleague’s tone. He’s expected to reiterate that interest rates must go higher for longer if the US economy continues to print solid data.
Following astonishing January data, the US Nonfarm Payrolls figures are awaited on Friday. Market participants estimate the US economy added 200K jobs to the economy. Any figures below expectations would weigh on the USD, meaning the GBP/USD could appreciate. On the flip side, stronger data would warrant further tightening by the Fed.
GBP/USD Technical levels
The GBP/USD daily chart suggests that the pair is bottoming around 1.2000. The Relative Strength Index (RSI) is in bearish territory, with a downward slope, meaning that sellers are in control. The Rate of Change (RoC) suggests the sellers are losing momentum. Therefore mixed signals within oscillators suggest the GBP/USD pair is sideways. For a bullish continuation, the GBP/USD must clear the 200-day EMA at 1.2120. On the bearish front, the GBP/USD must break below the 100-day EMA at 1.2033 and beneath 1.2000 to pave the way for further losses.
- Canada Ivey PMI fell sharply toward 50 in February.
- USD/CAD stays in positive territory slightly above 1.2600 after the data.
The Ivey Purchasing Managers Index (PMI), an economic index which measures the month-to-month variation in economic activity in Canada, dropped sharply to 51.6 (seasonally adjusted) in February from 60.1 in January. This reading missed the market expectation of 57.7 by a wide margin.
Further details of the publication revealed that the Employment Index edged lower to 59.4 from 60.5 and the Prices Index rose to 65.3 from 63.6.
Market reaction
USD/CAD largely ignored these figures and the pair was last seen trading modestly higher on the day at 1.3615.
- Factory Orders in the US declined slightly less than expected in January.
- US Dollar Index stays in negative territory below 104.50.
The data published by the US Census Bureau revealed on Monday that new orders for manufactured goods, Factory Orders, decreased $8.9 billion, or by 1.6%, in January to $542.8 billion. This print followed December's increase of 1.7% and came in slightly better than the market expectation for a decline of 1.8%.
"New orders for manufactured durable goods in January, down two of the last three months, decreased $12.8 billion, or 4.5%, to $272.4 billion, unchanged from the previously published decrease," the publication further read.
Market reaction
The US Dollar Index stays under modest bearish pressure and was last seen losing 0.25% on a daily basis at 104.27.
The Euro has pulled back from the multi-month highs seen earlier in February. Nonetheless, economists at the National Bank of Canada expect the shared currency to strengthen in the second half of 2023.
Markets think that the ECB is positioned to continue raising interest rates
“Data in the Eurozone is suggesting that inflation may be more resilient than initially anticipated while growth has not dropped off as expected. Consequentially, markets think that the ECB is positioned to continue raising interest rates. Still, that comes with a slew of risks and the potential for currency volatility.”
“Assuming growth remains positive, and the ECB can keep rates at their terminal point, it could set the stage for some Euro appreciation in the second half of the year.”
USD/MXN has extended its phase of decline after breaking the low of 2022. Economists at Société Générale note that the move is a bit stretched.
Approaching next support zone at 17.90/17.60
“USD/MXN breached the lower limit of the range during 2021/2022 resulting in an extended downtrend. It is close to potential support zone of 17.90/17.60 representing the low of 2018 and projections.
“Daily MACD is within deep negative territory denoting an overstretched move. Test of this zone can lead to a rebound; the 50-DMA at 18.85/19.00 is expected to be a short-term resistance.”
Economists at Rabobank discuss EUR and USD outlook. The EUR/USD pair is seen below the 1.06 mark by June.
Moderately softer USD into year-end
“The hawkish rhetoric of the ECB may struggle to coax the EUR significantly higher particularly given the recent buoyancy of the greenback.”
“We expect the ‘higher for longer’ rate view to keep the USD well supported.”
“We see scope for dips below the EUR/USD 1.06 level into the middle of the year.”
“We expect a moderately softer USD into year-end, though this assumes that Fed funds will have peaked by then.”
- The index trades in an inconclusive fashion near 104.50.
- US yields extend the drop to multi-session lows on Monday.
- Factory Orders, 3-month/6-month bill auctions come next.
The lack of a clear direction prevails around the greenback and motivates the USD Index (DXY) to navigate a narrow range in the mid-104.00s on Monday.
USD Index cautious ahead of data, lower yields
The index now adds to Friday’s decline and retests the 104.30 region on the back of further retracement in US yields across the curve and a mild bias towards the risk-associated universe at the beginning of the week.
In fact, the dollar kicks in the new trading week in an offered mood. This stance remains underpinned by fresh speculation that the Fed might not raise rates as high as previously estimated, which remains in stark contrast to the ongoing “aggressive” narrative from most Fed’s rate setters.
Furthermore, and according to the FedWatch Tool measured by CME Group, the probability of a 25 bps rate hike at the March 22 meeting hovers around 75%.
Later in the US docket, Factory Orders for the month of January will take centre stage followed by 3-month/6-month Bill Auctions.
What to look for around USD
The index keeps the erratic performance well in place around the 104.50 region so far.
The probable pivot/impasse in the Fed’s normalization process narrative is expected to remain in the centre of the debate along with the hawkish message from Fed speakers, all after US inflation figures for the month of January showed consumer prices are still elevated, the labour market remains tight and the economy maintains its resilience.
The loss of traction in wage inflation – as per the latest US jobs report - however, seems to lend some support to the view that the Fed’s tightening cycle have started to impact on the still robust US labour markets somewhat.
Key events in the US this week: Factory Orders (Monday) - Powell’s Semiannual Monetary Policy Report, Wholesale Inventories, Consumer Credit Change (Tuesday) – MBA Mortgage Applications, ADP Employment Change, Balance of Trade, Powell’s Semiannual Monetary Policy Report, Fed’s Beige Book (Wednesday) – Initial Jobless Claims (Thursday) – Nonfarm Payrolls, Unemployment Rate, Monthly Budget Statement (Friday).
Eminent issues on the back boiler: Rising conviction of a soft landing of the US economy. Persistent narrative for a Fed’s tighter-for-longer stance. Terminal rates near 5.5%? Fed’s pivot. Geopolitical effervescence vs. Russia and China. US-China trade conflict.
USD Index relevant levels
Now, the index is losing 0.11% at 104.41 and the breakdown of 104.09 (weekly low March 1) would open the door to 103.45 (55-day SMA) and finally 102.58 (weekly low February 14). On the flip side, the next resistance emerges at 105.35 (monthly high February 27) seconded by 105.63 (2023 high January 6) and then 106.55 (200-day SMA).
Market participants will be watching closely to see if the RBA adopts less hawkish forward guidance after the recent run of softer economic data from Australia. In that case, the Aussie could weaken, economists at MUFG Bank report.
RBA policy meeting in focus
“After signalling at their last policy meeting that they expect further “‘increases’ in interest rates will be required over the months ahead, we expect the RBA to send a less hawkish signal this week after delivering one of those planned hikes. The softer GDP report for Q4 and CPI report for January argues for more caution from the RBA over the need for further hikes.”
“We expect the Australian economy to be one of the most sensitive to higher rates amongst the advanced economies similar to the Canadian economy.”
“A less hawkish message from the RBA could weigh modestly on the Australian Dollar in the week ahead.”
See – RBA Preview: Forecasts from 9 major banks, hiking for the fifth time by 25 bps
Economists at Société Générale analyze USD/JPY’s technical outlook. The 137.70/138.10 area could be an interim hurdle.
Resistance at 137.70/138.10, key support at 134.00
“December peak of 137.70/138.10 is an interim resistance zone; this must be overcome to affirm a larger rebound. An initial pullback is not ruled out however recent pivot low at 134.00 is likely to be an important support.”
“In case the pair establishes itself above the hurdle at 137.70/138.10, the up move could extend towards 139.50, the 50% retracement from last October and 142.30/142.60.”
- EUR/USD adds to Friday’s decent advance and retests 1.0660.
- The 55-day SMA around 1.0715 still offers interim resistance.
EUR/USD advances for the second session in a row and reaches 2-day highs near 1.0660 on Monday.
If the rebound gets more serious, then the pair needs to clear the provisional hurdle at the 55-day SMA, today at 1.0715, to allow for extra gains to, initially, the weekly top at 1.0804 (February 14).
Looking at the longer run, the constructive view remains unchanged while above the 200-day SMA, today at 1.0326.
EUR/USD daily chart
Senior Economist at UOB Group Alvin Liew reviews the latest release of Retail Sales in Singapore.
Key Takeaways
“Singapore’s retail sales started the new year on a cautious note, contracting by -9.4% m/m, -0.8% y/y in Jan following Dec’s high of 7.7% y/y (versus prelim est of 1.3% m/m, 7.4%. Excluding motor vehicle sales, the sequential decrease was smaller but still notable at -8.2% m/m, and it translated to +2.1% y/y increase (from +1.0% m/m, 9.5% y/y in Dec).”
“Outlook – We continue to expect domestic retailers to enjoy domestic and external supports, complemented by the return of major events such as various sports, concerts and BTMICE (Business Travel and Meetings, Incentive Travel, Conventions and Exhibitions) activities attracting tourist arrivals, while the tight domestic labour market will likely contribute further to domestic consumption demand. One of the key downside risks to retail sales in 2023 is the still-elevated inflation pressures that may increasingly curb discretionary spending of households, in addition to the 1ppt GST hike. The low base effect is also likely to fade going into the new year, rendering less uplift.”
- DXY manages to regain some composure and tests 104.70.
- Further range bound trade looks likely for the time being.
DXY trades within a narrow range at in the mid-104.00s at the beginning of the week.
So far, the continuation of the range bound theme seems the most likely scenario in the very near term for the index. In the meantime, the dollar needs to clear the February peak at 105.35 (February 27) to allow for extra recovery and a potential challenge of the 2023 top at 105.63 (January 6).
In the longer run, while below the 200-day SMA at 106.55, the outlook for the index remains negative.
DXY daily chart
Economists at HSBC discuss the US Dollar outlook. The greenback is expected to turn back lower over the long run.
US Dollar is likely to weaken over the longer term
“We expect the US Dollar to remain choppy, with risks skewed to the downside over the near term.”
“Once uncertainties about the Federal Reserve rates, the US economic prospects, and China’s recovery subside, the broader US Dollar is likely to weaken over the longer term.”
See: Another range-bound week for the Dollar – ING
A move below the January low of 1.0480/1.0460 could see the EUR/USD pair extending its decline, economists at Société Générale report.
1.0800 must be reclaimed to denote a larger up move
“January low of 1.0480/1.0440 is a potential support zone. In case this gets violated, the ongoing decline is likely to extend towards the 200-Day Moving Average at 1.0330 and projections of 1.0220/1.0200.”
“Recent pivot high of 1.0800 is likely to cap near term upside.”
See – EUR/USD: Moderately positive medium-term, not optimistic long-term – Commerzbank
Market Strategist Quek Ser Leang at UOB Group favours the continuation of the current consolidation in USD/IDR.
Key Quotes
“Our narrative last week was ‘Further USD/IDR strength is likely but it remains to be seen if the next major resistance at 15,490 is within reach this week’. Our view did not materialize as USD/IDR rose to a high of 15,320 before ending the week at 15,295.”
“The price actions appear to be part of a consolidation phase and USD/IDR is likely to trade sideways between 15,200 and 15,350 this week.”
The CAD had another poor week. Economists at Scotiabank expect the Loonie to continue struggling to gain ground.
CAD’s soft tone set to persist
“Technical pointers suggest the USD will remain well-supported and that minor dips remain a buy from a chart perspective.”
“Bull trend dynamics are evident across the short, medium and longer-term charts.”
“Support is 1.3535/55 (I would expect that to hold early this week, at least).”
“Resistance is 1.3665, ahead of 1.3700/10 and 1.3830.”
See: USD/CAD: New year-end target revised higher to 1.32 – NFB
- EUR/JPY regains the upside and approaches the 145.00 level.
- The continuation of the rebound could see the YTD revisited.
EUR/JPY leaves behind two consecutive sessions with losses and flirts with the 145.00 zone at the beginning of the week.
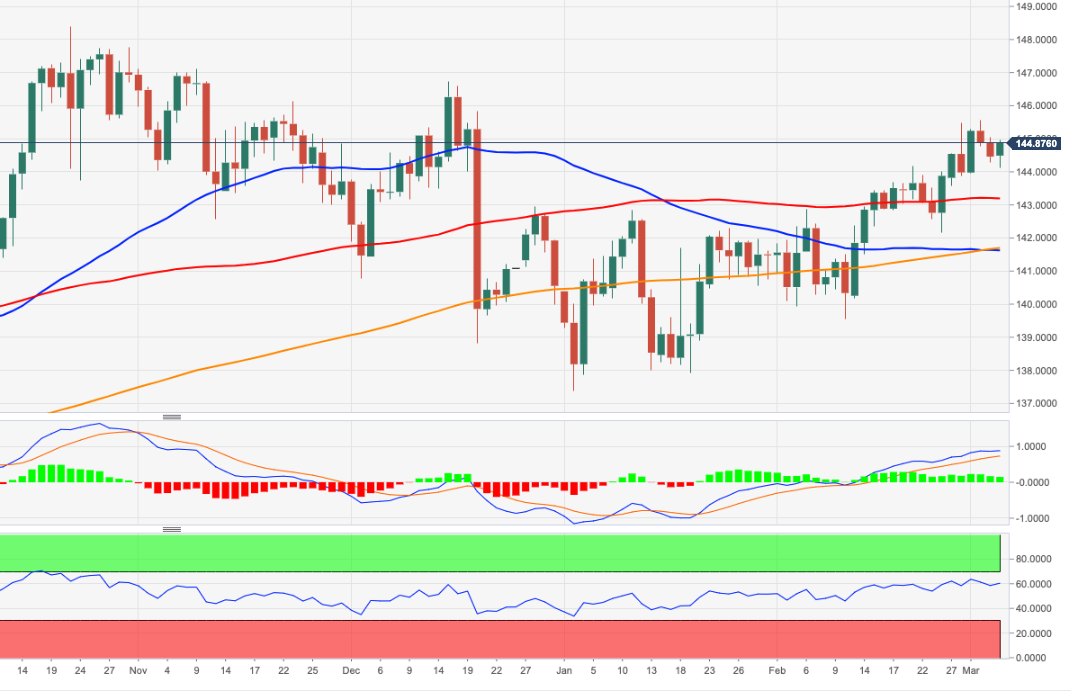
The continuation of the current upside momentum faces the next hurdle at the 2023 high at 145.56 (March 2). Once this level is cleared, the par could then confront the December 2022 top at 146.72 (December 15) ahead of the 2022 high at 148.40 (October 21 2022).
In the meantime, while above the 200-day SMA, today at 141.66, the outlook for the cross is expected to remain positive.
EUR/JPY daily chart
BoJ will meet Friday with a consensus of no change. Economists at MUFG Bank expect the USD/JPY pair to struggle to enjoy gains.
BoJ in focus at Kuroda’s last meeting
“Next Friday is not without risks of a surprise although we err on the side of bold changes to YCC being left to Ueda. The Diet is likely to confirm the nominees next Friday as well and of course, we have the NFP data from the US.”
“Assuming no surprise, USD/JPY will continue to take its lead from US yields and hence the jobs data will be key. But YCC speculation is unlikely to subside and given the dysfunctional JGB market conditions we see strong justification for an end to YCC possibly at the 16th June policy meeting.”
“In those circumstances, we see limited scope to the upside for USD/JPY, especially given the upside for US yields should also become more limited from here after the surge in yields in February.”
USD/MYR should maintain the 4.4500-4.4900 range for the time being, suggests Market Strategist Quek Ser Leang at UOB Group.
Key Quotes
“Our expectations for USD/MYR to test the major resistance at 4.5000 did not quite materialize as it rose to 4.4950 to end the week at 4.4730 (+0.90%).”
“Overbought conditions combined with waning upward momentum suggest USD/MYR is unlikely to advance further. This week, USD/MYR is likely to consolidate between 4.4500 and 4.4900”.
The Reserve Bank of Australia (RBA) will announce its next monetary policy decision on Tuesday, March 7 at 03:30 GMT and as we get closer to the release time, here are the forecasts by the economists and researchers of 9 major banks regarding the upcoming central bank's decision.
The RBA is set to deliver another 25 basis points rate hike in March, lifting the Official Cash Rate (OCR) from 3.35% to 3.60%. The focus will be on the March statement for any changes in the central bank’s language, with regard to the wage and rate hike outlook.
ING
“We expect that the upcoming RBA meeting is going to be much more interesting than has been the case recently. The RBA will want to see confirmation of a downward trend in inflation, not just a reversal of seasonal spikes to even consider pausing its current 25 bps per meeting tightening strategy. The softer-than-expected 4Q22 GDP number was encouraging but we would need to see confirmation from other data to conclude that a slowdown is underway, and of a sufficient magnitude to see inflation fall back within the RBA’s 2-3% target range.”
ANZ
“While the weak wages resultraisesthe risk the RBA may feel able to pause in its tightening cycle earlier than we currently think, we still expect another 25 bps hike. The nascent recovery in housing prices would suggest that rate hikes have not yet quelled demand enough to be confident that inflation will move back into the target band in a reasonable time frame. We’ll be watching the post-meeting statement for the RBA’s take on the wages data. The Board’s interpretation of the wages data will give us a guide on what might be ahead.”
Westpac
“We expect the Board will decide to lift the cash rate by a further 0.25% from 3.35% to 3.6%. We would be very surprised if the Board decided to pause in March. A further hike in April, which is Westpac’s view, seems the logical extension of the February statement. Any policy change to take the recent data into account should be contemplated for May.”
Standard Chartered
“We expect a 25 bps hike to 3.60%. We recently revised the terminal rate to 4.10% from 3.50% previously. Specifically, we expect the central bank to hike by 25 bps each in March, April and May. Trimmed mean CPI inflation eased to 1.7% QoQ in Q4-2022 from 1.9% QoQ in Q3 – still far too high. Inflation pressures are also still very broad – we estimate that 84% of items in the CPI basket are rising by more than 3% YoY. These factors raise risks of a 50 bps hike in March.”
TDS
“The focus will be on whether the RBA softens its language in light of recent weaker data. On the back of the widening breadth and persistence of inflation, the cash rate in Australia remaining below comparable G10 economies, and the Australian economy more likely to benefit from China's reopening, we expect the RBA to push on with hikes in Apr and May.”
Nomura
“We expect the RBA governor’s press release to: i) announce a 25 bps hike; ii) contain mixed macro comments; and iii) provide less hawkish forward guidance.”
SocGen
“We believe that recent signs in the macroeconomic data, such as the decline in inflation, the rebound in unemployment rate, relatively lukewarm wages growth and the confirmation of consumption slowdown all support a 25 bps hike in March. They also support our base scenario of a terminal policy rate at 3.85%, despite the financial market’s more hawkish expectation on US Fed policy.”
Citibank
“We expect RBA to increase the cash rate by 25 bps to 3.60%. This would be the highest since May 2012 and take monetary policy further into restrictive territory. Citi’s mid-point estimate of neutral is ~ 2.85%.”
Wells Fargo
“We expect the RBA to raise its policy rate by 25 bps to 3.60%, while we also expect a final 25 bps rate hike to 3.85% in April. There could also be interest in this meeting as to whether the RBA hints at any possibility that rate hikes might continue beyond April as well.”
Economists at ING expect Sterling to trade quietly this week.
Steady sterling this week
“This week it is hard to find a UK catalyst for Sterling to break out of recent ranges. We doubt any further progress on the Windsor Framework deal is worth much more to Sterling. And having heard from Bank of England big hitters (Andrew Bailey and Huw Pill) last week, we doubt that this week's BoE speakers make much of a dent in market pricing of the BoE cycle.”
“In all, EUR/GBP should trade well within a 0.8800-0.8900 range, while GBP/USD will be bounced around on this week's big inputs from the US events calendar.”
The sceptre of inflation is back. How inflation concerns are affecting EUR/USD this time round? Ulrich Leuchtmann, Head of FX and Commodity Research at Commerzbank, expects the shared currency to struggle in the long-term.
Moderately positive regarding EUR/USD medium-term
“Whereas core inflation is slowly, but more or less steadily falling in the US, it remains on a firmly rising trend in the Eurozone. That means the ECB has to act in a restrictive manner, or has less scope to ease its monetary policy in the foreseeable future. As a result, I remain moderately positive regarding EUR/USD medium-term.”
“Medium to long-term things are looking differently. The USD seems more resilient against the risks of recession than the EUR because the particular structural problems might emerge during times of a recession in Europe. If it became clear that more rapid QT was required in the fight against inflation the ECB might struggle more with these measures than the Fed. These arguments are the reason why medium to long-term I am not optimistic for EUR/USD.”
GBP/USD consolidated last week. Economists at OCBC note that a move below the 1.1920 area could confirm a descending triangle, opening up next support levels at 1.1840 and 1.1720.
Descending triangle?
“Daily momentum and RSI indicators are not showing a clear bias. But on the weekly chart, bullish momentum is fading.”
“On price action, a potential descending triangle could be forming with support at 1.1920 levels (200-DMA, triangle support). A decisive break to the downside could fuel more downward pressure. Next support at 1.1840, 1.1720 levels.”
“Resistance at 1.2040 (21-DMA), 1.2140 (50-DMA).”
According to Market Strategist Quek Ser Leang at UOB Group, a sustained drop below 34.30 in USD/THB seems unlikely for the time being.
Key Quotes
“We highlighted last Monday (27 Feb, spot at 35.13) that ‘further USD/THB strength appears likely’. We added, ‘in view of the overbought conditions, USD/THB may find the major resistance at 35.57 difficult to break’. While USD/THB subsequently rose to 35.39 on Tuesday, the surprisingly sharp pullback from the high took out a few strong support levels.”
“The pullback amid the still overbought conditions suggests that 35.39 could be a short-term top. The pullback has scope to extend but any decline is viewed as a lower trading range of 34.30/34.90. In other words, a sustained decline below 34.30 is unlikely.”
- Eurozone Retail Sales came in at 0.3% MoM in February vs. 1.0% expected.
- Retail Sales in the bloc arrived at -2.3% YoY in February vs. 1.9% expected.
Eurozone’s Retail Sales rose by 0.3% MoM in February versus 1.0% expected and -1.6% last, the official figures released by Eurostat showed on Monday.
On an annualized basis, the bloc’s Retail Sales came in at -2.3% in February versus -2.8% seen in January and the 1.9% consensus forecast.
FX implications
The Euro remains on the defensive on the awful Eurozone data. At the time of writing, the major is trading at 1.0626, down 0.04% on the day.
About Eurozone Retail Sales
The Retail Sales released by Eurostat are a measure of changes in sales of the Eurozone retail sector. It shows the performance of the retail sector in the short term. Percent changes reflect the rate of changes of such sales. The changes are widely followed as an indicator of consumer spending. Usually, positive economic growth anticipates "Bullishness" for the EUR, while a low reading is seen as negative, or bearish, for the EUR.
NZD/USD ended the week little changed. Economists at ANZ Bank expect volatility into US data this week.
Rebound in broad risk appetite looks like a short squeeze
“The rebound in broad risk appetite (and drop in US bond yields) looks like a short squeeze, and how long the cheerful buzz lasts remains to be seen. It certainly looks out of step with hawkish Fedspeak and recent strong US data.”
“We remain attuned to the possibility of ongoing NZD volatility as markets weigh the pros and cons of post-flood rebuilding/sticky inflation/higher rates against the prospect of exports being disrupted and the USD benefitting from higher rates there.”
“Support 0.5750/0.5900/0.6090 Resistance 0.6540/0.6675”
The Eurozone Sentix Investor Confidence index worsens to -11.1 in March from -8.0 in February vs. -8.6 expected.
The Current Situation in the Eurozone rose to -9.3 from -10.0. Meanwhile, the Expectations Index tumbled to -13.0 from -6.0 in February.
Key takeaways
"This stagnation phase could soon turn into renewed recession worries if the negative economic expectations materialize.”
"Money supply growth remains weak and, together with the rise in interest rates, is likely to prove a serious burden on the economy in the further course of the year.”
EUR/USD reaction
The shared currency is unfazed by the downbeat Eurozone Sentix data. EUR/USD is trading at 1.0633, modestly flat on the day.
- EUR/USD adds to Friday’s rebound and tests 1.0660.
- The dollar struggles to regain traction amidst declining US yields.
- EMU Sentix Index surprised to the downside in March.
EUR/USD advances modestly at the beginning of the week and manages to revisit the 1.0660 region.
EUR/USD up on dollar weakness
EUR/USD looks to extend Friday’s marked advance north of 1.0600 the figure on Monday amidst some indecision surrounding the greenback and the generalized downside pressure in US and German yields.
Indeed, renewed speculation around a potential pivot in the Fed’s tightening cycle appears to have removed some strength from the dollar in the last couple of sessions, morphing in turn to fresh oxygen for the risk complex.
In the domestic calendar, the Construction PMI in Germany improved to 48.6 in February, while the Investor Confidence in the broader Euroland measured by the Sentix Index unexpectedly worsened to -11.1 for the current month.
Later in the NA session, Factory Orders will be the only release of note seconded by short-term bill auctions.
What to look for around EUR
EUR/USD extends the ongoing recovery past the 1.0600 mark amidst the continuation of the selling mood around the dollar.
In the meantime, price action around the European currency should continue to closely follow dollar dynamics, as well as the potential next moves from the ECB after the bank has already anticipated another 50 bps rate raise at the March event.
Back to the euro area, recession concerns now appear to have dwindled, which at the same time remain an important driver sustaining the ongoing recovery in the single currency as well as the hawkish narrative from the ECB.
Key events in the euro area this week: Germany Construction PMI, EMU Sentix Index, Retail Sales (Monday) – Germany Retail Sales, EMU Advanced Q4 GDP Growth Rate, ECB Lagarde (Wednesday) – Germany Final Inflation Rate, ECB Lagarde (Friday).
Eminent issues on the back boiler: Continuation of the ECB hiking cycle amidst dwindling bets for a recession in the region and still elevated inflation. Impact of the Russia-Ukraine war on the growth prospects and inflation outlook in the region. Risks of inflation becoming entrenched.
EUR/USD levels to watch
So far, the pair is advancing 0.05% at 1.0638 and the breakout of 1.0715 (55-day SMA) would target 1.0804 (weekly high February 14) en route to 1.1032 (2023 high February 2). On the other hand, there is an immediate support at 1.0532 (monthly low February 27) seconded by 1.0481 (2023 low January 6) and finally 1.0326 (200-day SMA).
- Gold price is struggling to regain upside traction despite falling Treasury bond yields.
- US Dollar drops amid repositioning ahead of Federal Reserve Powell’s testimony.
- Upbeat mood also weighs negatively on the safe-haven United States Dollar.
- Gold price turns south toward the 21-Daily Moving Average after facing rejection near $1,860.
Gold price is retreating from over two-week highs of $1,858 in the early European session. Gold price has stalled its upbeat momentum even as the United States Dollar (USD) resumes its decline amid a positive risk tone. The focus this week remains the US Federal Reserve (Fed) Chairman Jerome Powell’s testimony and the all-important US Nonfarm Payrolls data.
It's all about Federal Reserve expectations
Powell is due to testify on the semi-annual monetary policy report released on Friday and markets are anticipating some hints on the policy outlook. Therefore, they are resorting to repositioning, gearing up for a significant market reaction to the Fed Chief’s testimony. The sustained pullback in the US Treasury bond yields is also unable to revive the Gold buyers.
Meanwhile, markets are pricing roughly a 30% probability of a 50 basis points (bps) rate hike in the March meeting. Friday’s US ISM Services PMI eased slightly to 55.1 in February, The critical US ISM Services Price Paid Index bettered expectations, coming in at 65.6 vs. 64.5 expected. Upbeat figures indicated elevated inflationary pressure, supporting the case for bigger Federal Reserve rate hikes.
Despite the hawkish expectations, the US Dollar failed to capitalize on Friday, as the end-of-the-week flows came into play and weighed heavily on the greenback. As a result, Gold price rallied hard to hit the highest level in two weeks above $1,850.
Ahead of the key event risks later in the week, Gold traders now await the United States Factory Orders data due later in the North American session for fresh trading impetus. In absence of top-tier US economic data, Gold price will take cues from the broad market sentiment and the dynamics of the US Dollar alongside the Treasury bond yields.
Gold price technical analysis: Daily chart
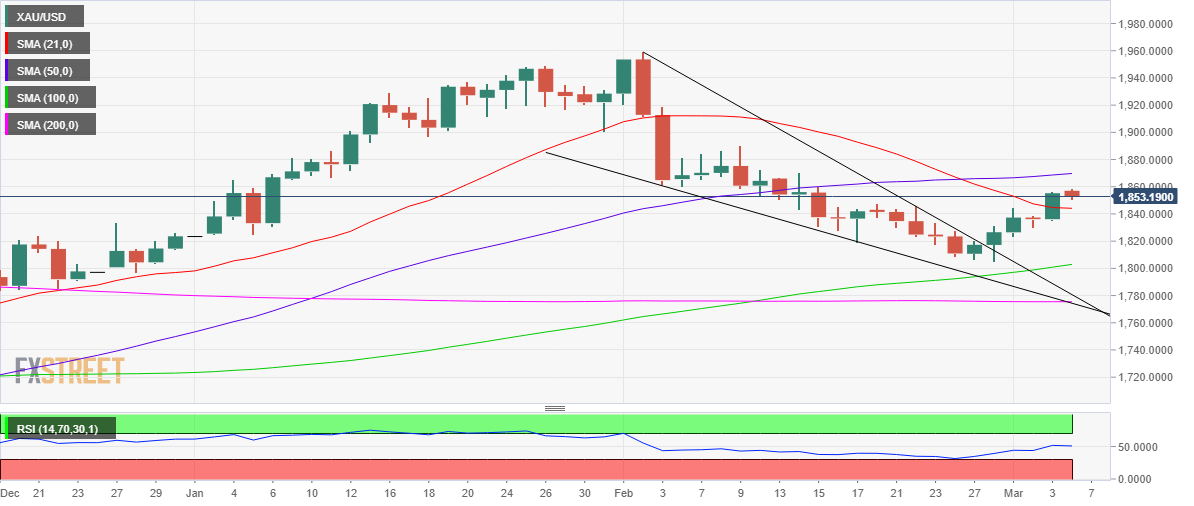
On Friday, Gold price yielded a daily closing above the bearish 21-Daily Moving Average (DMA) at $1,844. Therefore, Gold bulls flexed their muscles early Monday before changing course, following the downtick in the 14-day Relative Strength Index (RSI). The momentum indicators is now threatening the 50.00 level again, which could potentially help extend the corrective decline in Gold price. If that materializes, Gold price could retreat further to test the 21 DMA resistance-turned-support. A clear downside break of the latter will call for a test of Friday’s low at $1,835.
Altenatively, if buyers manage to fight back control, Gold price rally could resume, prodding the mildly bullish 50 DMA resistance at $1,870. Ahead of that level, the $1,858-$1,860 supply zone could be a tough nut to crack for Gold optimists.
FX markets have opened the week on a steady footing, buoyed by a strong end to last week from equities and appearing to shake off a slightly lower-than-expected growth target from China. Economists at ING expect the Dollar to remain range-bound.
DXY set to trade within a 104.00-105.50 range
“In today's session, the Dollar has not found too much support from a slightly lower-than-expected Chinese growth target for 2023 at 5.0% (5.5-6.0% had been expected). Equally, equities continue to hold up quite well despite last week's big rise in bond yields and are providing a little support to pro-cyclical currencies.”
“We suspect it is another range-bound week for the Dollar, where DXY continues to trade in a 104.00-105.50 range and local stories can win out.”
In the view of UOB Group’s Economist Lee Sue Ann and Markets Strategist Quek Ser Leang, USD/CNH is expected to keep the 6.8500-6.9600 trading range unchanged for the time being.
Key Quotes
24-hour view: “Last Friday, we indicated that ‘the price actions are likely part of a broad consolidation range” and we expected USD to ‘trade between 6.8800 and 6.9300’. While our view for USD to consolidate was not wrong, it traded within a narrower range than expected (6.8910/9.229). Momentum indicators are mostly flat and further consolidation appears likely. Expected range for today, 6.8900/6.9250.”
Next 1-3 weeks: “After USD plunged sharply to 6.8642, we held the view that ‘there is room for USD to weaken further but any decline is likely to face solid support at 6.8400’. USD has not been able to make any further headway on the downside and in our update from last Friday (03 Feb, spot at 6.9050), we indicated that ‘the chance of a decline to 6.8400 has diminished’. USD subsequently traded in a quiet manner. The price actions appear to be part of an on-going consolidation phase and USD is likely to trade in a broad range of 6.8500/6.9600 for now.”
Considering advanced prints from CME Group, open interest in natural gas futures markets went up by nearly 7K contracts last Friday, leaving behind the previous daily drop. In the same line, volume rose by around 127.3K contracts and kept the choppy activity well in place for yet another session.
Natural Gas: Next on the upside comes $3.20
Prices of the natural gas closed just above the key $3.00 marl for the first time since late January on Friday. The marked bounce was also amidst increasing open interest and volume and is indicative that further gains lie ahead in the very near term. That said, the next up barrier aligns at the Fibo retracement near the $3.20 level per MMBtu.
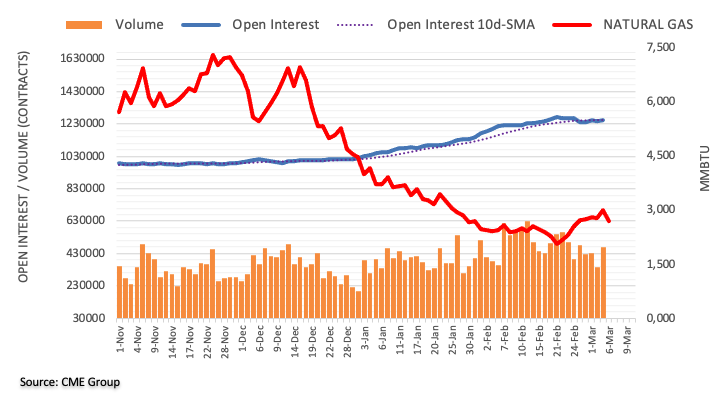
EUR/USD traded a touch firmer last week. Economists at OCBC Bank analyze the world’s most popular currency pair technical outlook.
RSI shows sign of rising
“Bearish momentum on daily chart intact but RSI shows sign of rising. Potential bullish divergence on MACD is not ruled out.”
“Resistance at 1.0660/80 (23.6% fibo, 21-Day Moving Average (DMA), 1.0730 (50-DMA) and 1.0780 levels.”
“Support at 1.0580, 1.0520 and 1.0460 (38.2% fibo retracement of Sep low to Feb high).”
See: EUR/USD probably ends March in the 1.07/1.08 area – ING
The upward bias in USD/JPY looks mitigated and is now expected to trade within the 134.50-137.10 range for the time being, suggest UOB Group’s Economist Lee Sue Ann and Markets Strategist Quek Ser Leang.
Key Quotes
24-hour view: “We expected to edge higher last Friday. Our view was incorrect as USD edged to a low of 135.73. Downward momentum has improved, albeit not much. Today, USD could edge lower but a sustained decline below 135.50 is unlikely. On the upside, a breach of 136.45 would suggest the current mild downward pressure has eased.”
Next 1-3 weeks: “Last Friday (03 Mar, spot at 136.65), we indicated that while the outlook for USD is still positive, the major resistance at 137.90 could be out of reach this time around. We highlighted, a break of 135.50 would indicate that USD is not strengthening further. USD dropped to a low of 135.73 in NY trade. While our ‘strong support’ at 135.50 is not breached, upward momentum has faded. In other words, the USD strength from the middle of last month has ended. USD appears to have moved into a consolidation phase and it is likely to trade within a range of 134.50/137.10 for now.”
CME Group’s flash data for crude oil futures markets noted traders added nearly 5K contracts to their open interest positions at the end of last week, keeping the erratic performance unchanged for the time being. Volume, in the same direction, resumed the uptrend and rose by around 241.7K contracts.
WTI keeps targeting $80.00 and above
Prices of the WTI extended the weekly rebound on Friday. The move was in tandem with rising open interest and volume and suggests that further gains look likely in the very near term. The surpass of the key $80.00 mark per barrel should pave the way for a test of the February high at $80.57 (February 13) ahead of the so far 2023 peak at $82.60 (January 23).
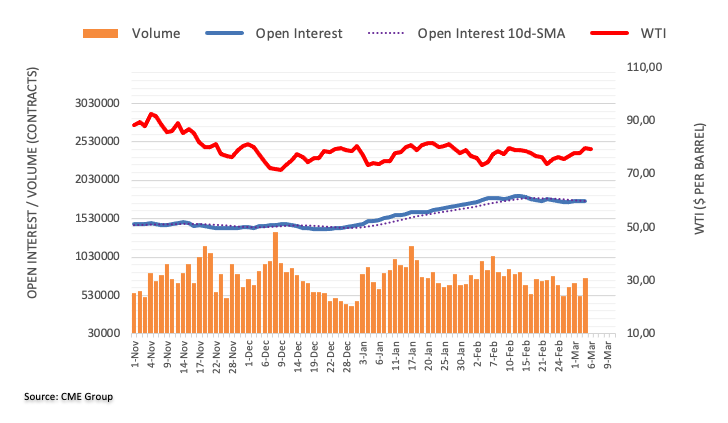
EUR/USD managed to register small gains last week on the back of Friday's rebound. Economists at ING expect the pair to end the month in the 1.07/08 zone.
EUR/USD inside a 1.0600-1.0700 range today
“European Central Bank speakers continue to point to a 50 bps hike at the 16 March meeting as being a done deal. The tough ECB talk has kept the EUR:USD interest rate differential supported at the short end of the market and firmed up the 1.05 support zone for EUR/USD this month. We think EUR/USD probably ends March in the 1.07/1.08 area.”
“EUR/USD probably trades well inside a 1.0600-1.0700 range today.”
The Reserve Bank of Australia (RBA) will announce its policy decisions on Tuesday. Economists at OCBC Bank explain how the central bank could impact the AUD.
RBA in focus
“We opine that an absence of a dial-down in hawkish rhetoric, accompanied with a 25 bps hike to 3.6% could lend strength to AUD. The downside risk for AUD is a dial-down of the hawkish rhetoric.
“Resistance at 0.6790/ 0.68 (38.2% fibo, 200 DMA), 0.6860/70 (21 DMA, 38.2% fibo) and 0.6930 (50% fibo retracement of Feb high to Mar low).”
“Support at 0.6720, 0.6680/90 levels.”
- AUD/USD fills a modest gap down opening on Monday, though lacks follow-through.
- A downtick in the US bond yields weighs on the USD and lends support to the major.
- Recession fears act as a headwind for the pair ahead of this week’s key event/data risks.
The AUD/USD pair struggles to capitalize on its modest intraday bounce and remains on the defensive, just above mid-0.6700s through the early European session on Monday.
Chinese government officials over the weekend set a lower-than-expected target of 5% GDP growth for the current year and undermined expectations of a strong recovery in the world's second-largest economy. This leads to a modest gap-down opening for the China-proxy Australian Dollar, though a softer tone surrounding the US Dollar assists the AUD/USD pair to attract some buying around the 0.6740 region. A modest downtick in the US Treasury bond yields is seen as a key factor that keeps the USD bulls on the defensive on Monday.
That said, the prospects for a further policy tightening by the Federal Reserve act as a tailwind for the US bond yields and the Greenback, which, in turn, seems to cap the upside for the AUD/USD pair. The markets seem convinced that the US central bank will stick to its hawkish stance and continue raising rates for longer to tame stubbornly high inflation. In fact, the incoming US macro data indicated that inflation isn't coming down quite as fast as hoped and pointed to an economy that remains resilient despite rising borrowing costs.
Furthermore, a slew of FOMC policymakers recently backed the case for higher rate hikes and opened the door for a 50 bps lift-off at the March policy meeting. Apart from this, looming recession risks favour the USD bulls and suggest that the path of least resistance for the AUD/USD pair is to the downside. Traders, however, seem reluctant to place aggressive bets ahead of this week's key central bank event risks - the Reserve Bank of Australia (RBA) meeting and Fed Chair Jerome Powell's two-day semi-annual congressional testimony.
Investors this week will also confront the release of the closely-watched US monthly employment details, popularly known as the NFP report on Friday. This will play a key role in influencing the near-term USD price dynamics and provide a fresh directional impetus to the AUD/USD pair. Heading into the key event/data risks, spot prices seem more likely to prolong the recent range-bound price action witnessed over the past week or so and remain below a technically significant 200-day Simple Moving Average (SMA).
Technical levels to watch
Economists at Commerzbank expect the USD/INR pair to continue trading within the 80-83.50 range for the time being.
Robust services sector
“The S&P Global services PMI for February rose strongly to 59.4 from 57.2 in January. It continues to point to resilient and robust domestic demand in India.”
“RBI will welcome the good news. However, RBI may still need to hike further to keep a lid on inflation expectations. We still look for another 25-50 bps in rate hikes this year. This should provide some support for INR.”
“USD/INR has held within the 80-83.50 range for the past five months or so and we look for continued consolidation within this range near term.”
Over the last month, only the MXN has outperformed the SEK versus both the USD and EUR. Economists at CIBC Capital Markets expect the Krona to continue strengthening over the coming months.
Riksbank to tighten by a further 50 bps in April
“In the context of elevated core prices, we would expect the Riksbank to tighten by a further 50 bps at their 26 April meeting.”
“We note that the hawkish central bank is now intent on encouraging a stronger SEK as an offset to policy adjustment; remember the SEK was the worst-performing major through 2022.”
“The combination of a hawkish central bank intent on boosting the currency looks set to extend a more constructive SEK bias through upcoming quarters.”
“Q2 2023: 10.75 | Q3 2023: 10.60 (EUR/SEK)”
Here is what you need to know on Monday, March 6:
Financial markets stay relatively calm early Monday as investors refrain from taking large positions ahead of this week's key events. February Retail Sales data will be featured in the European economic docket and January Factory Orders from the US will be looked upon for fresh impetus later. FOMC Chairman Jerome Powell will testify on policy before the Senate Banking Committee on Tuesday and before the House Financial Services Committee on Wednesday.
The positive shift witnessed in risk sentiment late Friday made it difficult for the US Dollar to find demand and the US Dollar Index (DXY) closed the last day of the week in negative territory. In the European morning, the DXY moves sideways at around 104.50 and the benchmark 10-year US Treasury bond yield stays below 4%. US stock index futures trade modestly higher on the day, reflecting a cautious atmosphere.
EUR/USD managed to register small gains last week on the back of Friday's rebound. The pair fluctuates in a tight range at around 1.0650 early Monday. Although European Central Bank President Christine Lagarde reiterated in her latest public appearance that a 50 basis points in March is highly likely, ECB policymaker Centeno said on Monday that the decision on the size of the next rate increase must be based on data. "Interest rates have risen too fast," Centeno added and argued that the ECB should not rush to conclusions very fast.
Following last week's choppy action, GBP/USD seems to have stabilized above 1.2000 early Monday. Investors keep a close eye on Brexit-related headlines.
AUD/USD is having a difficult time making a decisive move in either direction on Monday. In the Asian session on Tuesday, the Reserve Bank of Australia (RBA) will announce its policy decisions. Reuters' estimate suggests that the RBA is expected to lift its key rate to 3.6% from 3.25%.
USD/JPY declined below 136.00 late Friday and closed the previous week virtually unchanged. The pair moves sideways near 135.50 early Monday.
Gold price capitalized on retreating US Treasury bond yields late last week and ended up snapping a four-week losing streak. XAU/USD holds steady above $1,850 on Monday.
Following Friday's sharp decline, Bitcoin spent the weekend in a very tight channel. BTC/USD remains quiet on Monday and was last seen trading flat on the day at around $22,400. Ethereum struggled to stage a rebound over the weekend and lost nearly 5% last week. Ethereum moves sideways near $1,550 in the European morning.
- USD/JPY drifts lower for the second successive day on Monday, albeit lacks follow-through.
- Retreating US bond yields keeps the USD bulls on the defensive and exerts some pressure.
- The divergent Fed-BoJ policy outlook limits losses ahead of this week’s key event/data risks.
The USD/JPY pair remains under some selling pressure for the second successive day on Monday and moves further away from the YTD peak, around the 137.10 region touched last week. The pair, however, recovers a few pips from the daily low and trades just above mid-135.00s during the early European session, down around 0.20% for the day.
The US Dollar kicks off the new week on a subdued note amid a modest downtick in the US Treasury bond yields and turns out to be a key factor weighing on the USD/JPY pair lower. Apart from this, looming recession risks seem to benefit the safe-haven Japanese Yen (JPY) and contribute to the offered tone surrounding the major. Worries about a deeper global economic downturn resurfaced after China set a lower-than-expected target for economic growth and forecast that the economy would expand by 5% in 2023.
The downside for the USD/JPY pair, meanwhile, seems cushioned amid the divergent Bank of Japan-Federal Reserve monetary policy outlook. In fact, the incoming BoJ Governor Kazuo Ueda stressed the need to maintain the ultra-loose policy to support the fragile economy and said last week that the central bank isn't seeking a quick move away from a decade of massive easing. In contrast, the US central bank is universally expected to stick to its hawkish stance and keep rates higher for longer to tame high inflation.
The incoming US macro data indicated that inflation isn't coming down quite as fast as hoped and pointed to an economy that remains resilient despite rising borrowing costs. Adding to this, a slew of FOMC members backed the case for higher rate hikes and opened the door for a 50 bps lift-off at the March policy meeting. This should act as a tailwind for the US bond yields and favours the USD bulls, which supports prospects for the emergence of dip-buying around the USD/JPY and warrants caution for bears.
Traders might also prefer to move to the sidelines ahead of this week's key event/data risks, starting with Fed Chair Jerome Powell's semi-annual congressional testimony on Tuesday and Wednesday. Investors will look for fresh clues about the Fed's future rate-hike path, which will play a key role in influencing the near-term USD price dynamics. This will be followed by the BoJ monetary policy meeting on Friday and the release of the closely-watched US monthly employment details, popularly known as NFP.
Technical levels to watch
In the opinion of UOB Group’s Economist Lee Sue Ann and Markets Strategist Quek Ser Leang, AUD/USD has now likely moved into a consolidative range.
Key Quotes
24-hour view: “Last Friday, we expected AUD to trade sideways between 0.6700 and 0.6760. While AUD rose to 0.6775, there is no marked improvement in upward momentum. Today, AUD is unlikely to advance much further. Instead, AUD is more likely to trade between 0.6735 and 0.6780.”
Next 1-3 weeks: “We have a negative AUD view since the middle of last month. In our latest narrative from last Thursday (02 Mar, spot at 0.6755), we indicated that ‘downward momentum is waning rapidly and the odds for AUD to weaken further have diminished considerably’. In NY trade, AUD rose to a high of 0.6775. While our ‘strong resistance’ level at 0.6800 is not breached, downward momentum has more or less fizzed out. In other words, the weak phase in AUD has ended. The current price actions are likely the early stages of a consolidation phase and AUD is likely to trade between 0.6695 and 0.6820 for the time being.”
FX option expiries for Mar 6 NY cut at 10:00 Eastern Time, via DTCC, can be found below.
- EUR/USD: EUR amounts
- 1.0450 550m
- 1.0650 864m
- GBP/USD: GBP amounts
- 1.2060 2.7b
- 1.2150 300m
- USD/JPY: USD amounts
- 135.00 547m
- 135.75 615m
- 137.00 1.5b
- AUD/USD: AUD amounts
- 0.6735 582m
- 0.6760 644m
- 0.6775 1.2b
- USD/CAD: USD amounts
- 1.3325 1b
- 1.3600 562m
- NZD/USD: NZD amounts
- 0.6180 1b
Gold price is seen consolidating its recent gains to a nearly three-week high touched on Friday. FXStreet’s Haresh Menghani analyzes XAU/USD’s technical outlook.
The $1,842-$1,841 region seems to protect the immediate downside
“Any subsequent move up is more likely to confront resistance near the $1,865-$1,870 confluence. A sustained strength beyond could prompt technical buying and lift XAU/USD to 50% Fibo. level, which coincides with the $1,885-$1,886 horizontal barrier. This is followed by 61.8% Fibo. level, around the $1,900 round figure, which, if cleared decisively, might shift the near-term bias in favour of bullish traders and pave the way for some meaningful upside.”
“The 23.6% Fibo. level, around the $1,842-$1,841 region, now seems to protect the immediate downside ahead of the $1,821-$1,820 horizontal support. Failure to defend the said support levels could drag the Gold price back to the $1,805-$1,804 area. Some follow-through selling below the $1,800 mark, or the 100-day SMA, will be seen as a fresh trigger for bearish traders and make the XAU/USD vulnerable to accelerate the fall.”
- GBP/JPY picks up bids to pare intraday losses, mildly offered after three-week uptrend.
- 50-EMA, one-month-old ascending trend line restricts immediate downside.
- Sluggish oscillators channel buyers on their way to refresh 2023 top.
GBP/JPY marks a consecutive fourth bounce off a one-month-old ascending trend line, as well as the 50-bar Exponential Moving Average (EMA), as it consolidates the daily loss around 163.35 during the early hours of Monday’s trading in London.
It’s worth observing that the sluggish prints of the MACD signals, mostly bearish, join the steady RSI (14) line to challenge the cross-currency pair’s immediate moves.
Also acting as an immediate upside hurdle is the 23.6% Fibonacci retracement of February’s upside, near 163.80.
Following that, 164.50 and 164.80 can act as extra filters to the north before directing the GBP/JPY bulls towards the previous monthly high, also the highest level of 2023, surrounding the 166.00 round figure.
Should the quote remains firmer past 166.00, the last December’s peak of 169.30 and the 170.00 psychological magnet might lure the GBP/JPY buyers ahead of highlighting the previous yearly top of 172.13 as the next target.
On the flip side, a clear downside break of the 163.00 support confluence could quickly fetch the GBP/JPY price towards the mid-February peak of near 162.20.
If the cross-currency pair remains weak past 162.20, the 50% and 61.8% Fibonacci retracement levels, around 161.35 and 160.30 in that order, can lure the bears.
GBP/JPY: Four-hour chart
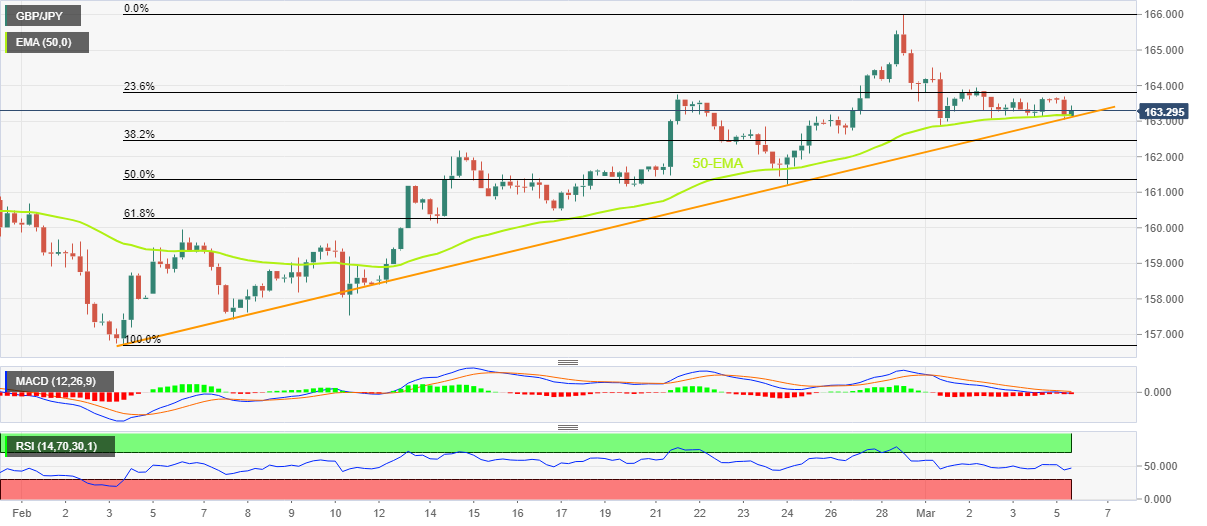
Trend: Further upside expected
- USD/CAD struggles to gain any meaningful traction and oscillates in a range on Monday.
- Retreating US bond yields keeps the USD bulls on the defensive and acts as a headwind.
- A modest downtick in Oil prices undermines the Loonie and lends support to the major.
The USD/CAD pair kicks off the new week on a subdued note and seesaws between tepid gains/minor losses, around the 1.3600 mark heading into the European session. The pair, meanwhile, remains within Friday's broader trading range and is influenced by a combination of diverging forces.
A softer tone surrounding the US Treasury bond yields keeps the US Dollar bulls on the defensive, which, in turn, acts as a headwind for the USD/CAD pair. That said, a modest pullback in Crude Oil prices - amid worries that a deeper global economic downturn will dent fuel demand - undermines the commodity-linked Loonie and lends some support to the major. The fears resurfaced after China set a lower-than-expected target for economic growth and forecast that the economy would expand by 5% in 2023.
Apart from this, growing acceptance that the Federal Reserve will stick to its hawkish stance favour the USD bulls and support prospects for the emergence of some dip-buying around the USD/CAD pair. The incoming US macro data indicated that inflation isn't coming down quite as fast as hoped and pointed to an economy that remains resilient despite rising borrowing costs. Adding to this, a slew of FOMC members backed the case for higher rate hikes and opened the door for a 50 bps lift-off at the March policy meeting.
Hence, the market focus will remain glued to Fed Chair Jerome Powell's semi-annual congressional testimony on Tuesday and Wednesday. Powell's comments will be closely scrutinized for clues about the Fed's future rate-hike path, which will play a key role in influencing the near-term trajectory of the USD. Investors this week will also confront the release of the closely-watched US monthly jobs report, popularly known as NFP on Friday, to determine the next leg of a directional move for the USD/CAD pair and before placing aggressive bets.
Heading into the key event/data risks, the US bond yields and the broader market risk sentiment will continue to drive the USD demand and provide some impetus to the USD/CAD pair. Apart from this, Oil price dynamics should allow traders to grab short-term opportunities in the absence of any relevant market-moving economic releases on Monday, either from the US or Canada. Nevertheless, the aforementioned fundamental backdrop favours bullish traders and suggests that the path of least resistance for the major is to the upside.
Technical levels to watch
- The index vacillates around the 104.50 region on Monday.
- US yields lack traction following Friday’s marked pullback.
- Factory Orders, short-term bill auctions next on tap.
The greenback, when gauged by the USD Index (DXY), alternates gains with losses in the mid-104.00s at the beginning of the week.
USD Index focuses on data releases, risk trends
The index starts the week in an inconclusive mood around the 104.50 zone, as investors seem to have digested Friday’s marked retracement against the backdrop of the absence of traction in US yields and some tepid improvement in the risk complex.
So far, the dollar appears side-lined above the 104.00 yardstick amidst renewed speculation that the Federal Reserve might not raise rates as high as previously thought despite the persistent hawkish narrative from Fed speakers.
According to CME Group’s FedWatch Tool, the probability of a 25 bps rate hike at the March 22 meeting remains the most likely outcome at 75%.
In the US data space, Factory Orders for the month of January will take centre stage followed by 3-month/6-month Bill Auctions.
What to look for around USD
The index keeps the erratic performance well in place around the 104.50 region so far.
The probable pivot/impasse in the Fed’s normalization process narrative is expected to remain in the centre of the debate along with the hawkish message from Fed speakers, all after US inflation figures for the month of January showed consumer prices are still elevated, the labour market remains tight and the economy maintains its resilience.
The loss of traction in wage inflation – as per the latest US jobs report - however, seems to lend some support to the view that the Fed’s tightening cycle have started to impact on the still robust US labour markets somewhat.
Key events in the US this week: Factory Orders (Monday) - Powell’s Semiannual Monetary Policy Report, Wholesale Inventories, Consumer Credit Change (Tuesday) – MBA Mortgage Applications, ADP Employment Change, Balance of Trade, Powell’s Semiannual Monetary Policy Report, Fed’s Beige Book (Wednesday) – Initial Jobless Claims (Thursday) – Nonfarm Payrolls, Unemployment Rate, Monthly Budget Statement (Friday).
Eminent issues on the back boiler: Rising conviction of a soft landing of the US economy. Persistent narrative for a Fed’s tighter-for-longer stance. Terminal rates near 5.5%? Fed’s pivot. Geopolitical effervescence vs. Russia and China. US-China trade conflict.
USD Index relevant levels
Now, the index is losing 0.01% at 104.52 and the breakdown of 104.09 (weekly low March 1) would open the door to 103.45 (55-day SMA) and finally 102.58 (weekly low February 14). On the flip side, the next resistance emerges at 105.35 (monthly high February 27) seconded by 105.63 (2023 high January 6) and then 106.55 (200-day SMA).
When asked about a possible 50 basis points (bps) rate hike in March, European Central Bank (ECB) policymaker Centeno said that “the decision must be based on data.” Adding that the “interest rates have risen too fast.”
Additional quotes
“ECB should not rush to conclusions very fast.”
“Should heed lower inflation forecasts in March.”
Market reaction
At the time of writing, EUR/USD is trading 0.07% on the day at 1.0638.
- USD/MXN licks its wound near the lowest levels since April 2018.
- Mexican Peso marked the biggest weekly gains in seven months amid broad US Dollar declines.
- Key data/events eyed for clear directions, Fed Chair Powell needs to defend hawkish bias to avoid further USD fall.
USD/MXN prints mild gains around 17.98 as it pares the biggest weekly loss in seven months during early Monday in Europe. In doing so, the Mexican Peso (MXN) pair tracks the market’s consolidation mode ahead of the top-tier data events.
Even so, the US Dollar’s failure to regain the upside momentum, mainly due to the downbeat Treasury bond yields, joins the fresh concerns suggesting a monetary policy divergence between the US Federal Reserve (Fed) and Banxico to probe the USD/MXN buyers.
The recently mixed concerns surrounding China and the weakness in Oil prices could be linked to the USD/MXN pair’s latest rebound. That said, the National Development and Reform Commission of the People's Republic of China (NDRC) recently said, it “Will further release the potential for consumption,” while also adding that China's economy steadily improving, per Reuters. Earlier in the day, market sentiment turned sour after China’s annual session of the National People's Congress (NPC) appeared a grim event due to its growth target and geopolitical concerns.
Elsewhere, the Fed policymakers’ indecision and mixed US data contrast with Banxico’s hawkish bias to keep the USD/MXN bears hopeful. During the weekend, San Francisco Federal Reserve Bank President Mary Daly highlighted the importance of incoming data to determine how high the rates can go. Previously, Atlanta Fed President Raphael Bostic renewed concerns about the Fed’s policy pivot while Federal Reserve published a semi-annual Monetary Policy Report on Friday wherein it clearly said, “Ongoing increases in the Fed funds rate target are necessary.” The report also stated that the Fed is strongly committed to getting inflation back to 2%.
Talking about the data, softer prints of the latest US Consumer Confidence, ISM PMI and Durable Goods Orders seem to challenge the US Dollar bulls. Alternatively, Mexico’s upbeat outcomes of the seasonally adjusted Trade Balance and Unemployment Rate for January seemed to have favored the USD/MXN bears.
Against this backdrop, US 10-year Treasury bond yields, rose to the highest levels since November 2022 in the last week before easing to 3.95% by the end of Friday, making rounds to the same level at the latest. More importantly, the US two-year bond coupons rose to the highest levels last seen in 2008 before retreating to 4.85% by the press time. That said, the S&P 500 Futures print mild gains, tracking Wall Street’s moves amid a light sluggish start to the key week.
Looking forward, Fed Chair Jerome Powell’s Testimony, China’s inflation data and Friday’s US jobs report for February, are likely to be the key catalysts to watch for clear directions. At home, Mexican Inflation data for February, up for publishing on Thursday, will be crucial for the guide.
Technical analysis
Although April 2018 low near 17.93 restricts immediate USD/MXN downside, the pair’s recovery moves remain unimpressive below the previous support line from late November 2022, close to 18.15 by the press time.
According to UOB Group’s Economist Lee Sue Ann and Markets Strategist Quek Ser Leang, GBP/USD is expected to trade between 1.1925 and 1.2120 in the short-term horizon.
Key Quotes
24-hour view: “Our expectations for GBP to weaken further were incorrect as it rebounded to a high of 1.2049. While upward momentum has not improved much with the rebound, GBP could edge higher to 1.2070. The next resistance at 1.2120 is not expected to come under threat. On the downside, a breach of 1.1985 (minor support is at 1.2005) would indicate that the current mild upward pressure has eased.”
Next 1-3 weeks: “Last Friday (03 Mar, spot at 1.1985), we indicated that while downward momentum is beginning to build, GBP has to break 1.1900 before a sustained decline is likely. We added, ‘the chance of GBP breaking 1.1900 will remain intact as long as 1.2045 is not breached within the next few days’. GBP rose to a high of 1.2049 in NY trade. The breach of our ‘strong resistance’ indicates that downward momentum has faded. To look at it another way, instead of heading lower, GBP is likely to continue to consolidate, expected to be between 1.1925 and 1.2120.”
Open interest in gold futures markets increased for the fourth consecutive session on Friday, this time by around 2.3K contracts according to preliminary readings from CME Group. Volume followed suit and went up by around 24.4K contracts after two consecutive daily pullbacks.
Gold: Next target emerges at $1890
Friday’s strong uptick in gold prices was on the back of rising open interest and volume, leaving the door open to the continuation of the monthly rebound in the very near term. That said, the next target on the upside comes at the weekly high at $1890 per ounce troy (February 9).
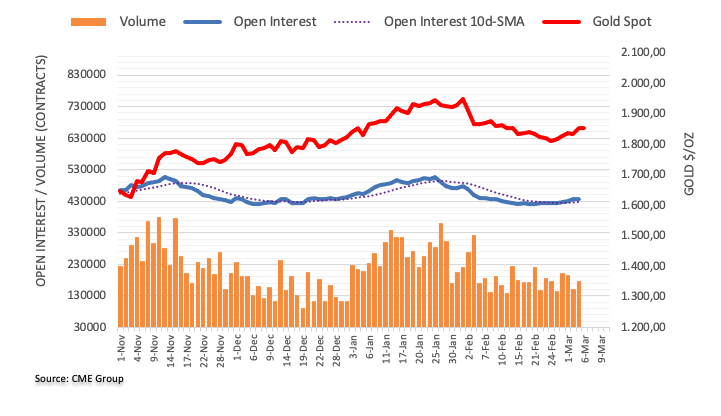
UOB Group’s Economist Lee Sue Ann and Markets Strategist Quek Ser Leang see EUR/USD navigating within the 1.0530-1.0700 range in the next few weeks.
Key Quotes
24-hour view: “We highlighted last Friday that ‘there is scope for EUR to weaken further but any decline is likely part of a lower trading range of 1.0565/1.0655’. EUR subsequently traded in a quiet manner between 1.0586 and 1.0638. The price actions appear to be part of a consolidation phase. Today, we expect EUR to trade sideways within a range of 1.0585/1.0650.”
Next 1-3 weeks: “There is not much to add to our update from last Friday (03 Mar, spot at 1.0605). As highlighted, instead of rebounding further, EUR is likely to consolidate and trade between 1.0530 and 1.0700 for now.”
- GBP/USD oscillates in a narrow trading band through the early part of trading on Monday.
- Retreating US bond yields keeps the USD bulls on the defensive and lends some support.
- Brexit anxiety, recession fears hold back bulls from placing fresh bets and cap the upside.
The GBP/USD pair struggles to capitalize on Friday's goodish rebound from a technically significant 200-day Simple Moving Average (SMA) and kicks off the new week on a subdued note. The pair, however, manages to hold comfortably above the 1.2000 psychological mark through the Asian session amid a mildly softer tone surrounding the US Dollar.
The ongoing retracement slide in the US Treasury bond yields weighs on the USD bulls on the defensive, which, in turn, lends some support to the GBP/USD pair. That said, a combination of factors acts as a tailwind for the Greenback and keeps a lid on any meaningful upside for the major, warranting caution for aggressive bullish traders. Growing acceptance that the Federal Reserve tighten its monetary policy further to tame stubbornly high inflation, along with looming recession risks, helps limit the downside for the USD.
In fact, the US macro data released recently indicated that inflation isn't coming down quite as fast as hoped and pointed to an economy that remains resilient despite rising borrowing costs. This should allow the Fed to stick to its hawkish stance for longer. Adding to this, a slew of FOMC members backed the case for higher rate hikes and opened the door for a 50 bps lift-off at the March policy meeting. This should help limit the downside for the US bond yields and supports prospects for the emergence of some USD dip-buying.
Apart from this, anxiety over the new UK-UK Brexit deal on the Northern Ireland Protocol is holding back traders from placing bullish bets around the British Pound and contributing to capping the GBP/USD pair. The Democratic Unionist Party (DUP) remains concerned over key aspects of the agreement and appears split since the Windsor Framework was announced last Monday. In fact, the DUP leader Sir Jeffrey Donaldson refused to oppose it outright
even as senior MPs strongly criticised the agreement.
The price action, meanwhile, indicates that an additional rate hike by the Bank of England (BoE) is already fully priced in the markets. Moreover, some analysts still hope that the UK central bank would pause the current tightening cycle, suggesting that the path of least resistance for the GBP/USD pair is to the downside. Hence, any meaningful upside remains elusive ahead of this week's key event/data risks - the Fed Chair Jerome Powell's semi-annual congressional testimony, the monthly UK GDP print and the US NFP report.
Technical levels to watch
- NZD/USD fades bounce off three-month low, holds lower ground of late.
- Bearish MACD signals join failure to cross the convergence of 100-SMA, one-month-old resistance line to lure sellers.
- Fortnight-long horizontal support area restricts immediate downside ahead of February’s low.
NZD/USD remains depressed around 0.6210 as it pares the previous week’s gains, the first in five, heading into Monday’s European session.
In doing so, the Kiwi pair portrays the bear’s dominance between the key trading area between the 0.6245-50 resistance confluence and 0.6200-6190 support zone.
That said, the bearish MACD signals join the pair’s failure to cross the 0.6245-50 resistance confluence, including the 100-bar Simple Moving Average (SMA) and a one-month-long descending resistance line, to keep sellers hopeful.
However, multiple levels marked since late February could challenge the NZD/USD pair’s immediate downside around 0.6200-6190.
Should the quote remains weak past 0.6190, the odds of witnessing a quick drop to the previous monthly low of 0.6131 can’t be ruled out. Though, July 2022 low of 0.6060 and the 0.6000 psychological magnet could restrict the pair’s further downside.
Alternatively, a successful break of the 0.6250 hurdle becomes necessary to direct the NZD/USD buyers toward the 200-SMA hurdle of 0.6335.
Following that, the mid-February high surrounding 0.6390 and the 0.6400 round figure could become important to watch for the bulls.
Overall, NZD/USD is likely to grind lower and advocates further volatility.
NZD/USD: Four-hour chart
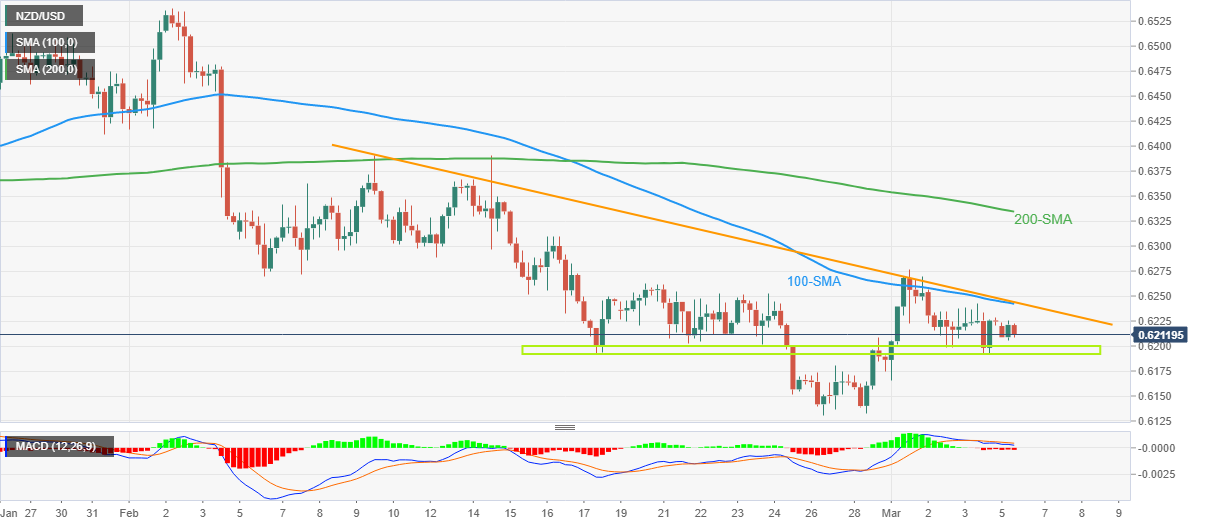
Trend: Limited downside expected
- Gold price remains sidelined as bulls take a breather amid sluggish start to the key week.
- Mixed headlines from China, cautious mood ahead of Fed Chair Powell’s testimony, US NFP probe XAU/USD bulls.
- Convergence of 200-EMA, weekly bullish channel’s lower line limits immediate downside as US Dollar bears flex muscles.
Gold price (XAU/USD) remains mostly illiquid around $1,855 as traders brace for the key data/events during early Monday in Europe. Adding filters to the XAU/USD moves could be the mixed headlines from China, as well as the US Dollar’s inaction despite a pullback in the Treasury bond yields.
Starting with China, the National Development and Reform Commission of the People's Republic of China (NDRC) recently said, it “Will further release the potential for consumption,” while also adding that China's economy steadily improving, per Reuters. Earlier in the day, market sentiment turned sour after China’s annual session of the National People's Congress (NPC) appeared a grim event due to its growth target and geopolitical concerns.
Elsewhere, San Francisco Federal Reserve Bank President Mary Daly highlighted the importance of incoming data to determine how high the rates can go. Previously, Atlanta Fed President Raphael Bostic renewed concerns about the Fed’s policy pivot while Federal Reserve published a semi-annual Monetary Policy Report on Friday wherein it clearly said, “Ongoing increases in the Fed funds rate target are necessary.” The report also stated that the Fed is strongly committed to getting inflation back to 2%.
It should be noted that the US 10-year Treasury bond yields, rose to the highest levels since November 2022 in the last week before easing to 3.95% by the end of Friday, making rounds to the same level at the latest. More importantly, the US two-year bond coupons rose to the highest levels last seen in 2008 before retreating to 4.85% by the press time. That said, the S&P 500 Futures print mild gains, tracking Wall Street’s moves amid a light sluggish start to the key week, whereas the US Dollar Index (DXY) remains depressed around 104.45, down 0.05% intraday by the press time.
Moving ahead, Gold traders may witness further inaction in the market as traders remain cautious before the key events including Fed Chair Jerome Powell’s Testimony, China’s inflation data and Friday’s US jobs report for February.
Gold price technical analysis
Although the overbought RSI (14) challenges the Gold buyers around $1,855, a convergence of the 200-bar Exponential Moving Average (EMA) and bottom-line of a one-week-long bullish channel challenge the bears around $1,850.
It’s worth noting that the XAU/USD weakness past $1,850 could quickly drag the quote toward the mid-February swing low near $1,818, before highlighting the previous monthly trough surrounding $1,805 and the $1,800 threshold for the Gold bears.
Meanwhile, recovery moves may aim for the aforementioned channel’s top line, close to $1,878, ahead of targeting the February 09 swing high of $1,890.
In a case where the Gold buyers keep the reins past $1,890, the 61.8% Fibonacci retracement of the metal’s weakness marked in February, as well as the January 31 swing low, around the $1,900 psychological magnet can act as the last defense of the XAU/USD bears.
Overall, Gold price teases bears amid an inactive day at the start of an all-important week.
Gold price: Four-hour chart
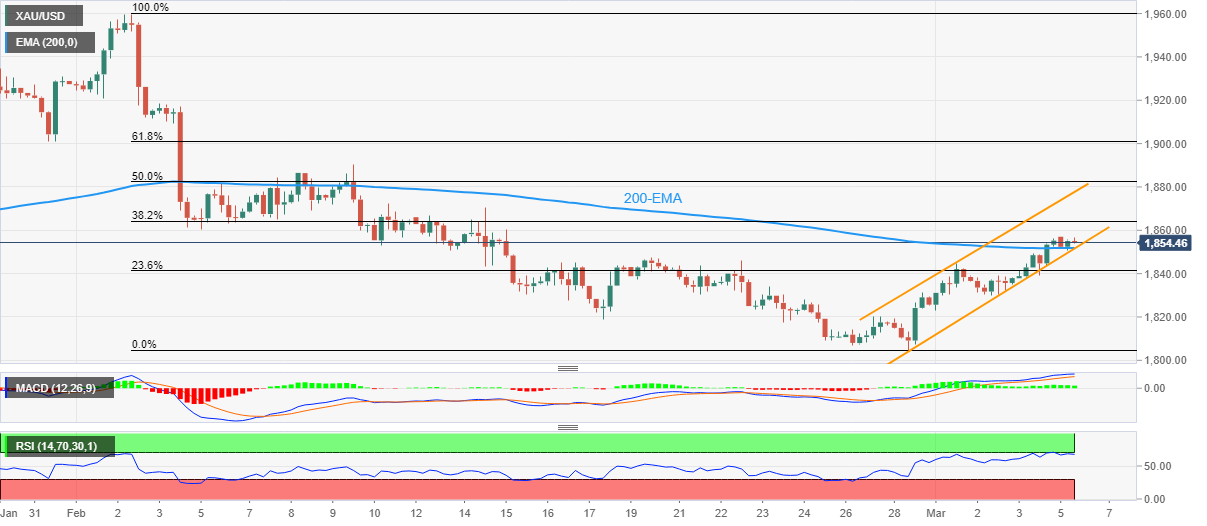
Trend: Further upside expected
- EUR/USD picks up bids to print mild gains while extending the previous weekly recovery.
- 100-SMA, one-month-old descending resistance line restrict immediate upside.
- Sluggish MACD signals join sustained trading below two-month-long horizontal hurdle, 200-SMA to keep bears hopeful.
EUR/USD rebound pokes the 100-SMA hurdle around 1.0650 heading into Monday’s European session.
The major currency pair recovered from a two-month low in the last week on broad US Dollar weakness, as well as the hawkish concerns about the European Central Bank (ECB). However, the cautious mood ahead of the top-tier catalysts from the US and Europe seems to test the momentum traders of late.
Also read: EUR/USD grinds lower towards 1.0600 ahead of Eurozone Retail Sales, focus on Fed Chair Powell, US NFP
That said, a one-month-old descending resistance line, near 1.0660 by the press time, acts as an extra filter towards the north, apart from the immediate 100-SMA hurdle of 1.0650.
It’s worth noting that the EUR/USD pair’s run-up beyond the 1.0650 hurdle isn’t an open invitation for the quote’s rally as the 200-SMA and a two-month-long horizontal resistance area could check the pair’s further upside, respectively near 1.0745 and 1.0760-65.
Should the EUR/USD pair portray another defeat from the key SMA hurdle, a one-week-old ascending support line near 1.0600 will be crucial to watch as it holds the gate for the pair’s slump toward early 2023 low near 1.0480. Adding strength to the 1.0480 support is November 2022’s top.
In a case where EUR/USD drops below 1.0480, the late November low near 1.0290 and the monthly bottom of 1.0222 will be in focus.
Overall, EUR/USD is likely to recover but the upside room remains limited.
EUR/USD: Four-hour chart
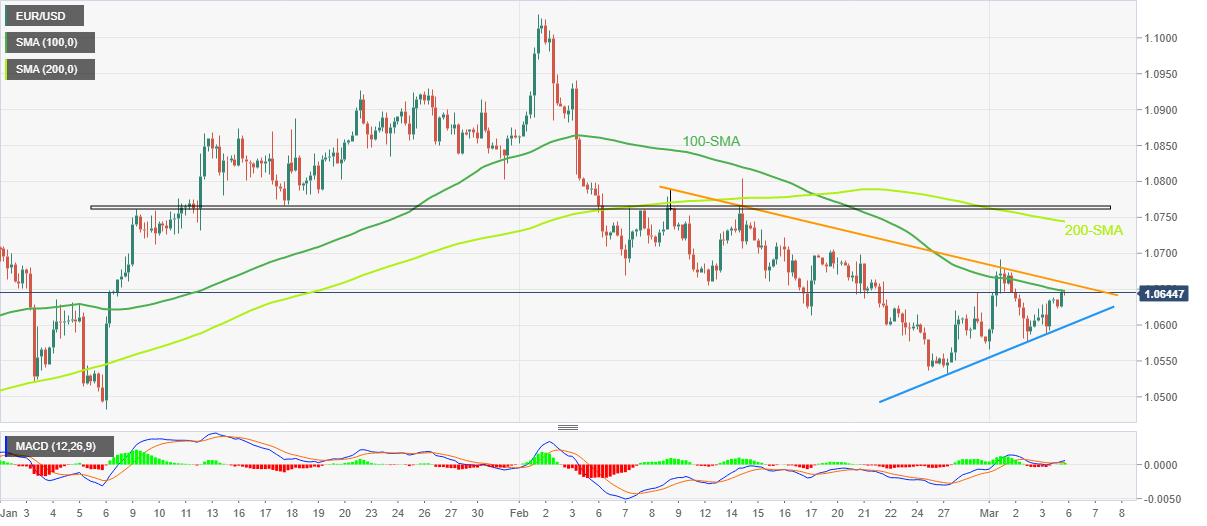
Trend: Limited upside expected
- AUD/USD picks up bids to pare intraday losses, defends bounce off two-month low.
- China NDRC tries to convince markets of economic improvement even as NPC eyes modest growth.
- Softer yields exert downside pressure on US Dollar but sluggish markets, anxiety ahead of key data/events restrict momentum.
- RBA Interest Rate Decision, Fed Chair Powell’s bi-annual Testimony and US NFP are in focus for clear directions.
AUD/USD treads water on a daily basis around 0.6760-70, despite recently picking up bids to pare the early losses heading into Monday’s European session. It’s worth noting that the Aussie pair marked the first weekly gain in three amid broad US Dollar weakness in the last week. That said, the recent positive headlines from China, after an initial disappointment, seem to help the Aussie pair of late.
After showing an initial disappointment from China’s downbeat growth forecasts, following the softer economic figures in decades, the AUD/USD pair buyers cheer the latest headlines from the National Development and Reform Commission of the People's Republic of China (NDRC). “Will further release the potential for consumption,” said NDRC while also adding that China's economy steadily improving, per Reuters.
Meanwhile, softer prints of Australia’s TD Securities Inflation for February, 6.3% YoY versus 6.4% prior, seemed to have also probed the Aussie pair buyers earlier in the day.
During the weekend, headlines from China’s annual session of the National People's Congress (NPC) appeared grim and weighed on the risk profile early Monday. The NPC expected a modest growth of 5.0%, versus market expectations of 6.0%, for the current year. Apart from the softer Gross Domestic Product (GDP) expectations, geopolitical concerns were also discussed and the same challenged AUD/USD buyers. “China should promote the peaceful development of cross-Strait relations and advance the process of China's "peaceful reunification", but also take resolute steps to oppose Taiwan independence,” said outgoing China Premier Li Keqiang.
Looking further back, softer prints of the US data and mixed Fed talks joined the US Treasury bond yields’ retreat from the multi-month high to recall the AUD/USD buyers, following a two-week losing streak.
US ISM Services PMI for February came in as 55.1 versus 54.5 market expectations and 55.2 market forecasts. Previously in that week, the US Durable Goods Orders for January eased while the Conference Board’s (CB) Consumer Confidence also flashed mostly downbeat details.
Talking about the Fed talks, Federal Reserve Bank of Atlanta President Raphael Bostic renewed concerns about the Fed’s policy pivot as the decision-maker said, “The central bank could be in a position to pause the current tightening cycle by mid to late summer.” However, San Francisco Federal Reserve Bank President Mary Daly said during the weekend that if data on inflation and the labor market continues to come in hotter than expected, interest rates will need to go higher, and stay there longer, than Fed policymakers projected in December, as reported by Reuters. On the same line, US Federal Reserve published a semi-annual Monetary Policy Report on Friday wherein it clearly said, “Ongoing increases in the Fed funds rate target are necessary.” The report also stated that the Fed is strongly committed to getting inflation back to 2%.
Amid these plays, the US 10-year Treasury bond yields, rose to the highest levels since November 2022 in the last week before easing to 3.95% by the end of Friday, making rounds to the same level at the latest. More importantly, the US two-year bond coupons rose to the highest levels last seen in 2008 before retreating to 4.85% by the press time. That said, the S&P 500 Futures print mild gains, tracking Wall Street’s moves amid a light sluggish start to the key week.
Looking ahead, the money policy meeting of the Reserve Bank of Australia (RBA), China’s inflation data and Fed Chair Jerome Powell’s Testimony will be important to watch for the AUD/USD pair traders ahead of Friday’s US jobs report for February.
Given the RBA’s receding hawkish bias, coupled with the fresh chatters surrounding Fed’s policy pivot, the AUD/USD pair may witness further grinding amid a lack of clear directions.
Technical analysis
AUD/USD recovery needs to cross the 50-EMA hurdle near 0.6775 to convince intraday buyers.
- USD/INR bounces off multi-day low to consolidate the first weekly loss in six.
- Convergence of 100-DMA, 23.6% Fibonacci retracement guards recovery moves.
- A 4.5-month-old symmetrical triangle advocates volatility; 200-DMA appears extra filter towards the south.
USD/INR prints mild gains around 81.85 as the bears lick their wounds early Monday. In doing so, the Indian Rupee (INR) pair rebounds from the lowest levels since February 02, marked the previous day, to consolidate the biggest weekly loss since early November. It’s worth noting that the quote marked the first weekly negative closing in six by the end of Friday’s North American session.
Overall, the USD/INR pair remains inside a broad symmetrical triangle comprising multiple levels marked since October 2022, currently between 82.90 and 81.30.
That said, the bearish MACD signals and downbeat RSI (14) raise doubts about the USD/INR pair’s corrective bounce off the multi-day low.
Even if the quote remains firmer, the 100-DMA and 23.6% Fibonacci retracement level of the pair’s August-October 2022 upside, near 82.15-20, appears a tough nut to crack for the USD/INR bulls.
On the contrary, the USD/INR pair’s fresh weakness could aim for the stated triangle’s support line of around 81.30 before challenging the 200-DMA support of near the 81.00 round figure.
Should the USD/INR pair remains weak past 81.00, lows marked during January 2022 and the last November, respectively near 80.90 and 80.35, might gain the market’s attention.
USD/INR: Daily chart

Trend: Bearish
Vice Chair of China’s National Development and Reform Commission of the People's Republic of China (NDRC) said in a statement on Monday, the economy steadily improving.
Additional comments
“Will further release the potential for consumption. China's economy steadily improving.”
“Will prudently tackle risks related to real estate, finance and local government debt.”
“Confident and capable of reaching this year's CPI target.”
His comments come after the country's growth target was set at around 5.0% over the weekend, which disappointed the market’s expectations of above 5.50%.
Market reaction
At the time of writing, AUD/USD is holding steady at around 0.6766, recovering ground after falling as low as 0.6641.
- USD/JPY fades the week-start corrective bounce amid market’s inaction.
- Treasury bond yields defend previous retreat from multi-month high despite failing to extend the fall.
- BoJ’s Kuroda has the last shot to fire before leaving the Governorship in April, Fed’s Powell may defend the hawks.
- US jobs report for February, Japan GDP may act as extra catalyst to watch for fresh impulse.
USD/JPY retreats to 135.80 as it reverses the bounce off intraday low amid a sluggish start to the key week. The Yen pair trader’s cautious mood ahead of the Bank of Japan (BoJ) monetary policy meeting and Federal Reserve (Fed) Chairman Jerome Powell’s half-yearly Testimony appears the key filters for the Yen pair. Also challenging the quote’s moves could be the latest inaction of the US Treasury bond yields, as well as the mixed signals from China.
The US benchmark bond coupon, namely the 10-year Treasury bond yields, rose to the highest levels since November 2022 in the last week before easing to 3.95% by the end of Friday, making rounds to the same level at the latest. More importantly, the US two-year bond coupons rose to the highest levels last seen in 2008 before retreating to 4.85% by the press time.
It’s worth noting that the receding optimism about the Fed’s hawkish moves and mixed US data, as well as the Fed policymakers’ failure to impress USD/JPY bulls, seem to weigh on the yields of late. Furthermore, China’s expectations of modest growth for 2023 and the Sino-American tension are extra filters for traders.
During the last week, the US ISM Services PMI for February came in as 55.1 versus 54.5 market expectations and 55.2 market forecasts. Previously in that week, the US Durable Goods Orders for January eased while the Conference Board’s (CB) Consumer Confidence also flashed mostly downbeat details.
With this, Federal Reserve Bank of Atlanta President Raphael Bostic renewed concerns about the Fed’s policy pivot as the decision-maker said, “The central bank could be in a position to pause the current tightening cycle by mid to late summer.”
However, San Francisco Federal Reserve Bank President Mary Daly said during the weekend that if data on inflation and the labor market continues to come in hotter than expected, interest rates will need to go higher, and stay there longer, than Fed policymakers projected in December, as reported by Reuters. On the same line, US Federal Reserve published a semi-annual Monetary Policy Report on Friday wherein it clearly said, “Ongoing increases in the Fed funds rate target are necessary.” The report also stated that the Fed is strongly committed to getting inflation back to 2%.
It’s worth noting that the BoJ officials, as well as incoming board members, have recently defended the Japanese central bank’s ultra-easy monetary policy, which in turn puts a floor under the USD/JPY prices. Further, expectations that BoJ Governor Haruhiko Kuroda may play its last ball with all strength also keep the yen pair buyers hopeful despite the latest weakness in the quote.
On the other hand, Fed’s Powell may have a tough time convincing markets amid pivot talks and mixed data. Even if he does, the US Nonfarm Payrolls (NFP) will be watched closely for clear directions.
Technical analysis
The latest U-turn from the 100-DMA, as well as the downside break of the one-month-old previous support line, keeps USD/JPY sellers hopeful. Also challenging the Yen pair buyers is the 200-DMA hurdle surrounding 137.40.
- USD/CHF picks up bids to pare the biggest daily loss in a month.
- Bearish MACD signals, 50-SMA challenge recovery moves after snapping two-week uptrend.
- One-month-old ascending support line, 100-SMA lures sellers during fresh declines.
USD/CHF struggles to defend the corrective bounce from 0.9360 as it jostles with the 50-SMA resistance during early Monday. In doing so, the Swiss currency pair portrays the cautious mood ahead of February’s Consumer Price Index (CPI) data from Switzerland, expected 2.9% YoY versus 3.3% previous readings.
Apart from the pre-data caution, the bearish MACD signals and a one-week-old horizontal resistance near 0.9430 also challenge the USD/CHF buyers.
Following that, the monthly high surrounding 0.9440 can act as a validation point for the rally targeting a late November 2022 swing high of near the 0.9600 threshold.
On the flip side, the 23.6% Fibonacci retracement of the pair’s February month upside, near 0.9350 restricts the immediate downside of the USD/CHF pair.
Even if the quote remains weak past 0.9350, an upward-sloping support line from early February and the 100-DMA, respectively near 0.9340 and 0.9300, may act as the last defense of the USD/CHF buyers.
Should the pair trade southwards past 0.9300, lows marked during February 2023, around 0.9135 and 0.9060, will be in focus.
Overall, USD/CHF is likely to remain on the bear’s radar unless the quote remains successfully above 0.9430.
USD/CHF: Four-hour chart
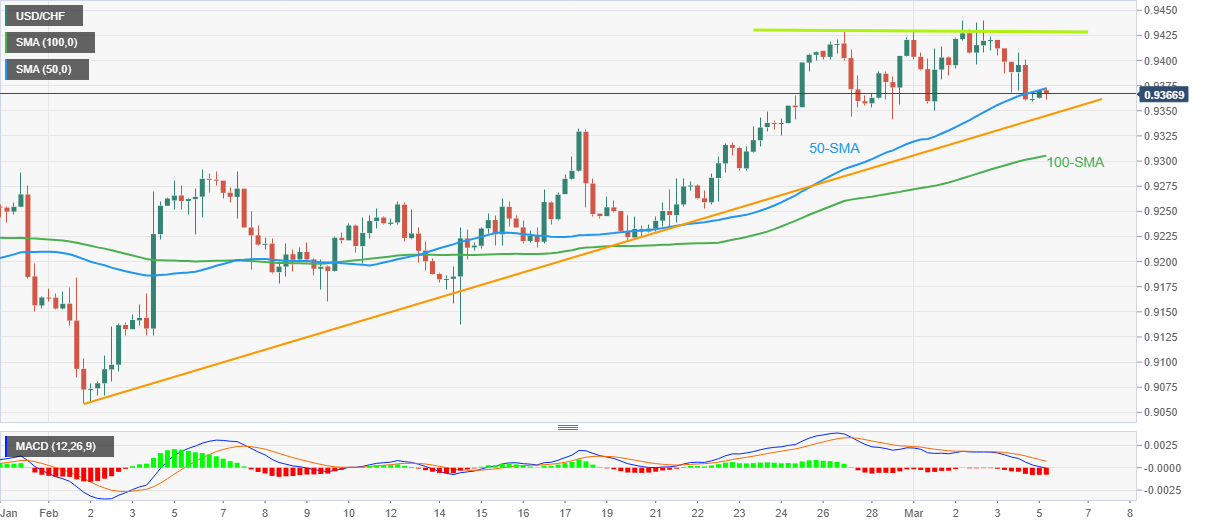
Trend: Further downside expected
| Raw materials | Closed | Change, % |
|---|---|---|
| Silver | 21.234 | 1.59 |
| Gold | 1854.81 | 1.01 |
| Palladium | 1456.47 | 1.14 |
- GBP/USD holds lower ground near intraday bottom after snapping two-week downtrend.
- Doubts about Brexit deal’s passage and its practice challenge UK PM Sunak’s accord with EU.
- Mixed US data, chatters over Fed policy pivot tease buyers ahead of top-tier data/events from Washington.
- UK data-dump for January could direct Cable traders amid likely disappointment from British politics.
GBP/USD prints mild losses around 1.2030-35 during early Monday, consolidating the first weekly gains in three amid the market’s cautious mood ahead of the key catalysts, as well as fading Brexit optimism. Adding filters to the latest market moves could be the downbeat US Treasury yields, extending the previous week’s pullback from a multi-month high, as well as the minor losses of the US stock futures.
That said, the Democratic Unionist Party (DUP) has urged the Government to stop “overselling” its new post-Brexit deal on Northern Ireland and focus on providing clarity on its detail. The same shows the DUP’s dislike for the initial details of the EU-UK deal on the Northern Ireland Protocol (NIP) and raises challenges for the smooth passage of the key Brexit developments in the UK Parliament. To avoid any hardships, the British government is bracing to provide more details on how Northern Irish lawmakers can potentially veto new European Union laws.
"Just to make sure that we get this exactly right, in the next few days, we're going to codify this," UK’s EU Minister Chris Heaton-Harris told BBC Radio Ulster, referring to the Stormont brake, per Reuters.
Elsewhere, mixed headlines from China and a cautious mood ahead of this week’s Federal Reserve (Fed) Chairman Jerome Powell’s half-yearly Testimony, as well as the US employment report for February, seem to weigh on the GBP/USD price amid a sluggish start. Furthermore, the mixed performance of the US Treasury bond yield and the US stock futures also challenge the momentum traders even as the prices print mild losses.
While portraying the mood, the US 10-year Treasury bond yields rose to the highest levels since November 2022 before easing to 3.95% at the latest. That said, Wall Street closed with gains but S&P 500 Futures remain indecisive, reversing the early-day losses, by the press time.
Moving on, headlines surrounding Brexit and the second-tier UK data may entertain GBP/USD traders but major attention will be given to how Fed’s Powell could push back the policy pivot concerns. Also important will be to watch Friday’s monthly UK data dump for January and the US Nonfarm Payrolls for February. Given the recently downbeat US statistics, any more weakness in the headline figures could put a floor under the Cable price.
Technical analysis
A clear downside break of the one-month-old previous resistance line, now support around 1.2020, becomes necessary for the intraday sellers. Even so, the 1.2000 psychological magnet and the 200-DMA support of around 1.1900 could challenge the GBP/USD pair’s further downside.
Alternatively, a daily closing beyond the 50-DMA hurdle surrounding 1.2140 could propel the Cable pair toward the mid-February swing high surrounding 1.2270.
- Gold is under pressure as the US Dollar firms in the open.
- Eyes are on Fed's chair Jerome Powell and NFP this week.
Gold price is slightly offered at the start of the week as markets hold their breath ahead of an update on the US rate outlook from the Federal Reserve's chairman, Jerome Powell. At the end of the week, US labor market data will be also critical. At the time of writing, the Gold price is down 0.15%, sliding from a high of $1,855.43 and reaching a low of $1,851.47 so far.
The US Dollar index, DXY, which measures the greenback's value against six major currencies, fell 0.4% to end Friday at 104.527. The index made a low of 104.485, losing ground from a high of 105.36 at the start of the week, its strongest level since Jan. 6. However, it has picked up a slight bid in the open as there apes to be some disappointment that Beijing chose to lowball its growth outlook with a target of 5%, rather than the 5.5%-plus favored:
-
China announced its annual growth target to be 5%
Looking at yields on 10-year US Treasuries, they stood at 3.970%, after last week's spike to 4.09%. Meanwhile, all eyes are on the Federal Reserve speakers and especially the chairman Jerome Powell who will testify on Wednesday on monetary policy to the House Financial Services Committee.
San Francisco Fed President Mary Daly on Saturday said rates would have to go up but set a high bar for moving to half-point increases. Meanwhile, futures imply a 72% chance the Fed will go by 25 basis points at its meeting on March 22 and this is where Powell's comments will be important when he is quizzed on whether larger hikes are needed.
Thereafter, we will have the February Nonfarm Payrolls report whereby a more modest increase of 200,000 following January's barnstorming 517,000 jump is expected and that will be followed by the February CPI report on March 14.
However, analysts at ANZ Bank have argued that recent jobs and inflation data do not support the thesis that interest rates are restrictive and they said ''it will be important to scrutinize the next round of hard data, starting with non-farm payrolls this Friday.''
''The early consensus looks for nonfarm jobs to have risen 200k, a lower pace than the 517k in January. That would be the lowest monthly increase since the pandemic, imply January was an outlier and put payrolls back on their decelerating trend evident from August last year,'' the analysts added. ''For what it’s worth, we think initial claims, the employment component of the ISM Services subindex, and seasonal factors are pointing to a stronger-than-forecast outturn. The range of economists’ estimates is 100-325k.''
Gold technical analysis
The 4-hour chart shows that the Gold price is riding dynamic support:
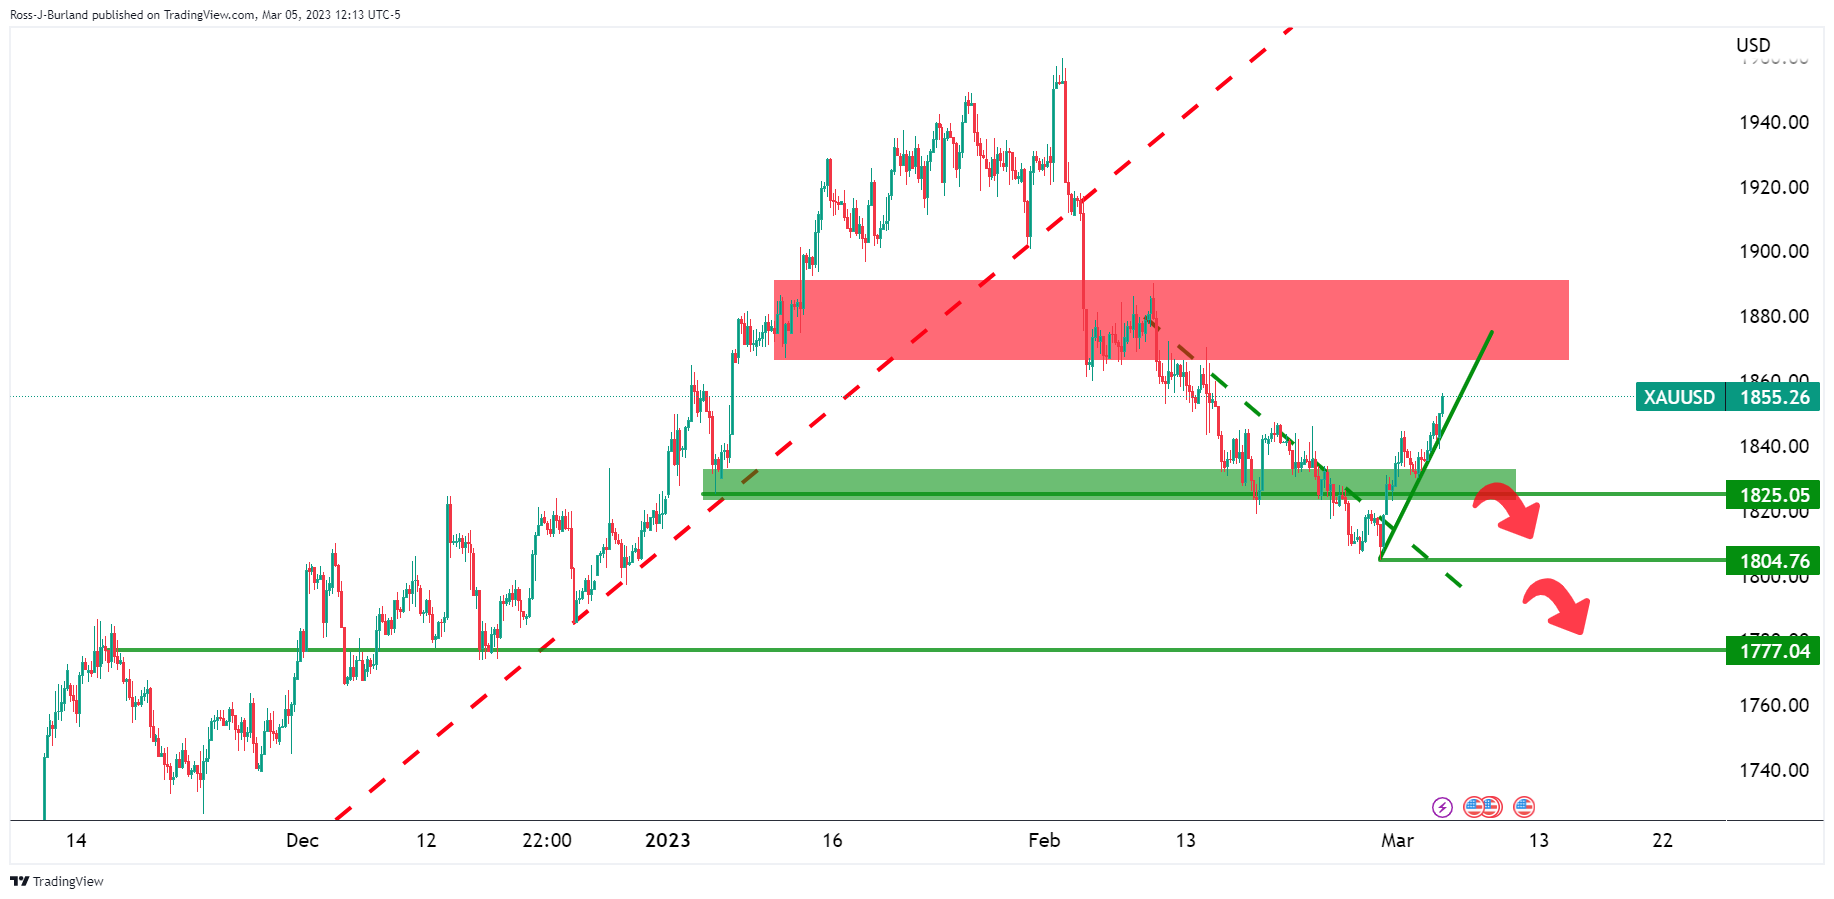
Below it, the key $1,825 support structure is what the bears will aim for while a break there will most probably see a flurry of orders triggered and a fast subsequent move lower.
- WTI takes offers to refresh intraday low, snaps four-day uptrend.
- RSI’s retreat from overbought territory, sluggish MACD favor latest declines.
- Five-week-old previous resistance, 200-SMA restrict short-term downside moves.
- Oil bulls have a bumpy road to travel in case of fresh recovery.
WTI crude oil returns to the bear’s radar, after a four-day winning streak, as the energy benchmark takes a U-turn from a three-week high to print 0.70% intraday losses around $79.30 during early Monday.
In doing so, the black gold traces the RSI (14) as it reverses from the overbought territory. However, the sluggish MACD signals hint at the lack of momentum and hence challenge the Oil bears.
Additionally testing the commodity’s latest weakness could be a downward-sloping support line from January 27, previous resistance around $78.45.
Even if the WTI bears manage to conquer resistance-turned-support of near $78.45, the 200-SMA and an ascending support line from late February, respectively near $78.10 and $77.70, could restrict the quote’s further downside before convincing the sellers.
Meanwhile, recovery moves may initially aim for the $80.00 psychological magnet before targeting the five-week-long horizontal resistance area surrounding $80.65-70.
Following that, a horizontal resistance zone comprising tops marked since January 18, close to $82.65-70, could challenge the WTI bulls before giving them control.
Overall, WTI crude oil is likely to witness further downside but the bears need to remain cautious unless witnessing a clear break of the $77.70.
WTI: Four-hour chart
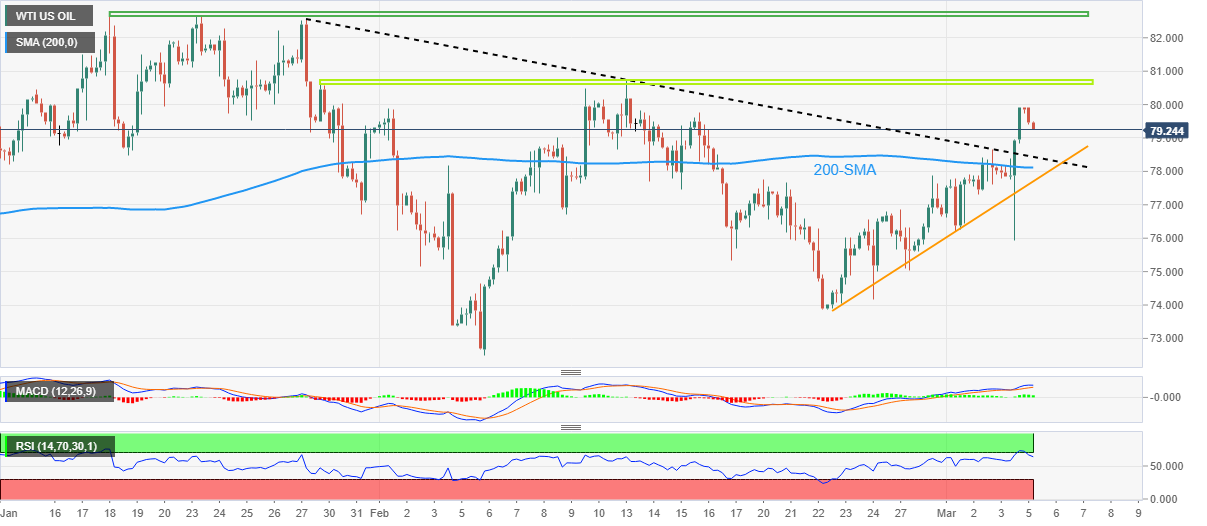
Trend: Limited downside expected
In recent trade today, the People’s Bank of China (PBOC) set the yuan at 6.8951 from the previous fix of 6.9117 and the prior close of 6.9015.
About the fix
China maintains strict control of the yuan’s rate on the mainland.
The onshore yuan (CNY) differs from the offshore one (CNH) in trading restrictions, this last one is not as tightly controlled.
Each morning, the People’s Bank of China (PBOC) sets a so-called daily midpoint fix, based on the yuan’s previous day's closing level and quotations taken from the inter-bank dealer.
- EUR/USD struggles to defend the biggest weekly gains in two months, steadies of late.
- Strong EU data backs hawkish ECB talks and favor Euro buyers amid a light calendar at home.
- Chatters surrounding Fed policy pivot, softer US statistics underpin bullish bias for the major currency pair.
- Fed Chair Powell’s bi-annual testimony, US jobs report for February will be crucial for near-term directions.
EUR/USD retreats to 1.0630, printing mild losses after a notable weekly positive closing, as sour sentiment joins mixed concerns about the European Central Bank (ECB) and the Federal Reserve’s (Fed) next move. It’s worth noting that a light calendar in Asia also tests the pair traders amid a sluggish start to the key week.
That said, hawkish ECB commentary gains support from the strong Eurozone inflation numbers. However, the US data fails to match its European counterpart and challenges the hawkish Federal Reserve (Fed) concerns.
European Central Bank (ECB) Governing Council member Boštjan Vasle said in on Friday, “My personal expectation is that the increase we intend for our March meeting – that is 0.5 percentage points – will not be the last one.” On the same line, ECB Governing Council member Madis Muller said on Friday, “it is probably not the final hike in March.” However, ECB Vice President Luis de Guindos said, “Interest rate path after March will be data-dependent.”
On the other hand, Federal Reserve Bank of Atlanta President Raphael Bostic renewed concerns about the Fed’s policy pivot as the decision-maker said, “The central bank could be in a position to pause the current tightening cycle by mid to late summer.”
On the contrary, San Francisco Federal Reserve Bank President Mary Daly said during the weekend that if data on inflation and the labor market continues to come in hotter than expected, interest rates will need to go higher, and stay there longer, than Fed policymakers projected in December, as reported by Reuters.
Furthermore, US Federal Reserve published a semi-annual Monetary Policy Report on Friday wherein it clearly said, “Ongoing increases in the Fed funds rate target are necessary.” The report also stated that the Fed is strongly committed to getting inflation back to 2%.
Talking about the data, Eurozone inflation numbers, namely the Producer Price Index and the Harmonized Index of Consumer Prices (HICP) printed strong figures for February and hence authenticated the ECB policymakers’ hawkish tone, which in turn allows the EUR/USD to remain firmer. The US data, however, fails to impress US Dollar despite the first US Treasury bond yields, which in turn weigh on the Euro pair. That said, the US ISM Services PMI for February came in as 55.1 versus 54.5 market expectations and 55.2 market forecasts. Previously in that week, the US Durable Goods Orders for January eased while the Conference Board’s (CB) Consumer Confidence also flashed mostly downbeat details.
Apart from the EU-US catalysts, headlines from China’s annual session of the National People's Congress (NPC) appear important and recently weigh on the risk profile, as well as the EUR/USD price. As per the latest update, the dragon nation eyes a modest growth of 5.0%, versus market expectations of 6.0%, for the current year. Furthermore, fears from China and Russia also probe the sentiment and weigh on the EUR/USD prices.
Above all, the cautious mood ahead of Federal Reserve (Fed) Chairman Jerome Powell’s half-yearly Testimony and the US employment report for February, as well as today’s Eurozone Retail Sales for February, restrict immediate moves of the EUR/USD pair. Should the bloc’s data match upbeat expectations of 1.9% YoY, versus -2.8% prior, the quote may reverse the latest losses.
Technical analysis
Despite a sustained bounce off the 200-day Exponential Moving Average (EMA), currently around 1.0535, the EUR/USD rebound needs validation from the 1.0655-60 resistance confluence comprising 50-EMA and three-week-old resistance line to convince buyers.
China announced its annual growth target to be 5% – a relatively modest target that has left some disappointment in the market that Beijing chose to lowball its growth outlook with a target of 5%, rather than the 5.5%-plus favored. This is being widely taken as a signal that large-scale stimulus is unlikely.
''A challenging export environment and an ongoing correction in the property market are key headwinds this year,'' analysts at ANZ Bank said. Meanwhile, the Government Work Report is also likely to try to push measures to encourage foreign investment into the country and trade. There are also likely to be details of key changes to top-line officials. The session is lso set to hand President Xi Jinping a third term in office and implement the biggest government shake-up in a decade.
“Global inflation remains high, global economic and trade growth is losing steam, and external attempts to suppress and contain China is escalating,” outgoing Premier Li Keqiang said during his speech to open the parliament, which will run through March 13.
- AUD/USD pares the first weekly gain in three around the lowest levels in two months.
- Convergence of 100-EMA, one-month-old descending resistance line adds to the upside filters.
- Bullish MACD signals, RSI’s upward grind keeps pair buyers hopeful.
- Downside break of ascending support line from Wednesday appears crucial for bear’s return.
AUD/USD prints mild losses around the mid-0.6700s as bulls take a breather following the first weekly gain in three during early Monday. In doing so, the Aussie pair portrays the failure to cross the 50-bar Exponential Moving Average (EMA).
Even so, the bullish MACD signals and the RSI (14) rebound keeps the AUD/USD buyers hopeful unless the quote breaks a three-day-old support line, around 0.6720.
Following that, the monthly low near the 0.6700 round figure and the January 2023 low of 0.6687 can act as extra checks for the Aussie pair sellers before giving them control.
Should the AUD/USD bears keep the reins past 0.6687, the last December’s bottom surrounding 0.6630 may gain the market’s attention.
On the contrary, recovery moves need to cross the 50-EMA hurdle near 0.6775 to convince intraday buyers of the AUD/UDS pair.
However, a convergence of the 100-EMA and a downward-sloping resistance line from early February, around 0.6820-25 by the press time, appears a tough nut to crack for the pair buyers.
In a case where the AUD/USD bulls manage to keep the driver’s seat past 0.6825, the odds of witnessing a run-up toward the mid-February high of near 0.7030 can’t be ruled out. It should be noted that the 0.7000 round figure may act as a buffer between 0.6825 and 0.7030.
AUD/USD: Daily chart
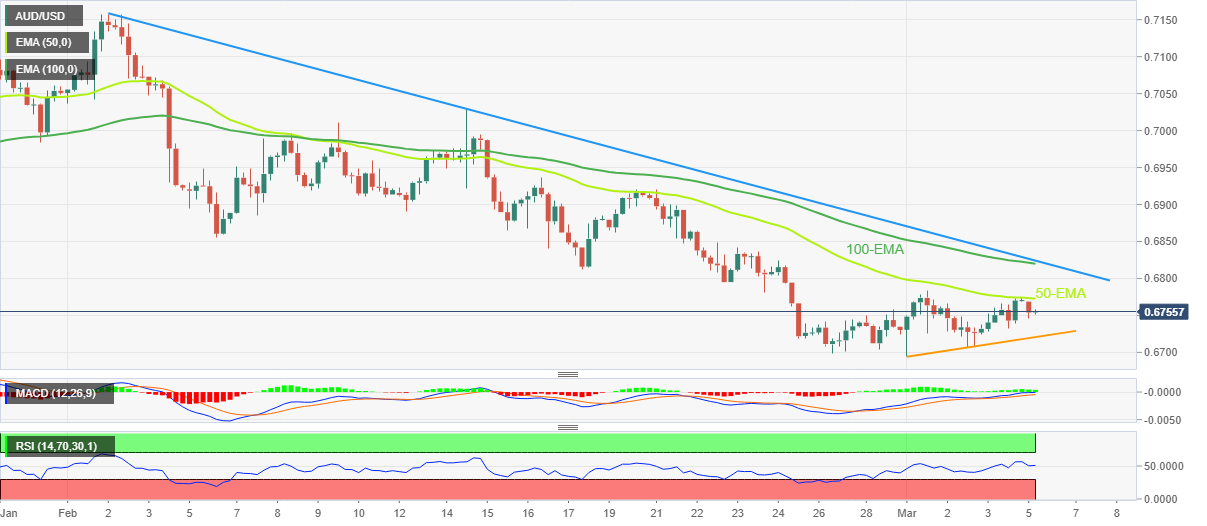
Trend: Limited downside expected
- USD/JPY is starting the week off with a downside bias while below 136.50.
- Bears eye a continuation of the breakout below trend.
USD/JPY bears are in play and there is a bias to the downsidse following a series of bearish features taking shape on the follwing techncial analysis:
USD/JPY daily chart

The M-formation is a topping pattern and given the break of the trendline, the bias is to the downside while below the neckline of the attern near 136.50.
USD/JPY H4 chart
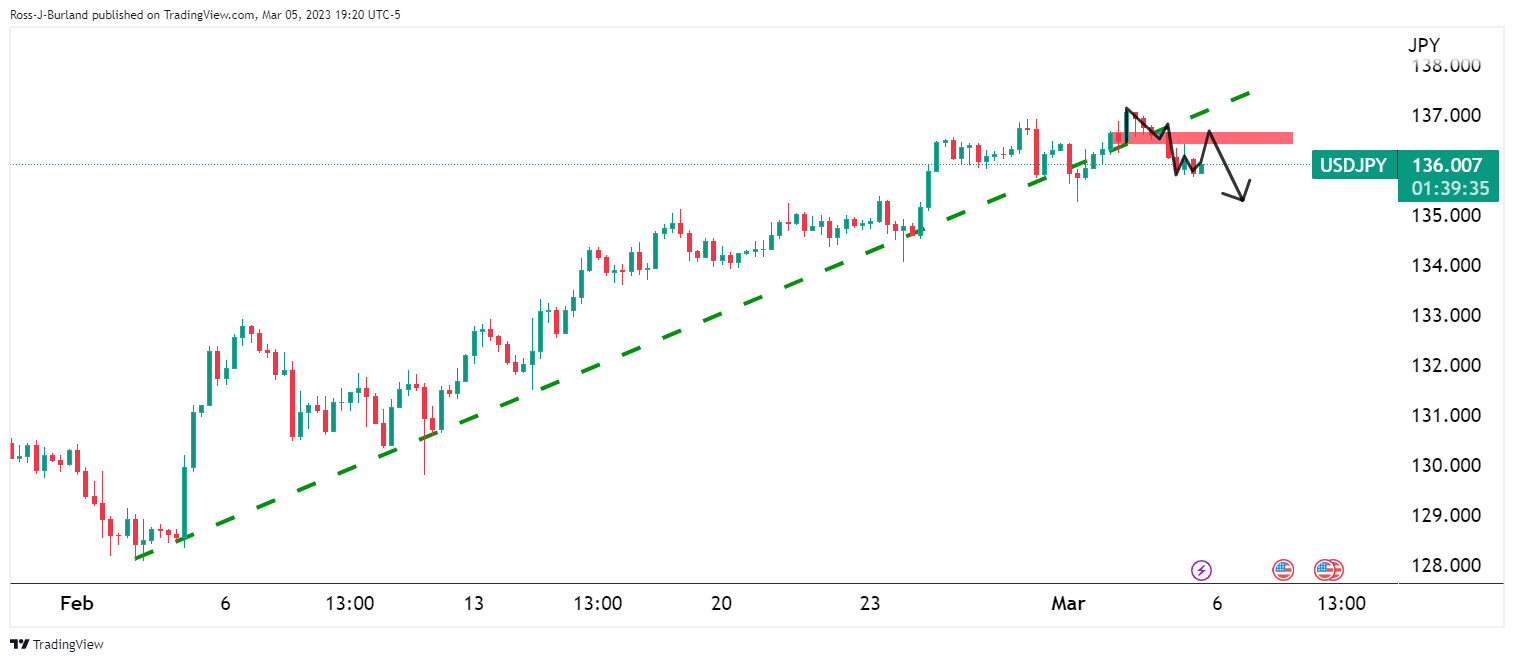
We have an M-formation on the 4-hour chart as well, and while the bias is for a test higher, the breakout of the grouping of the price could go either way. However, again, the bias is lower while below 136.50.
USD/JPY H1 chart
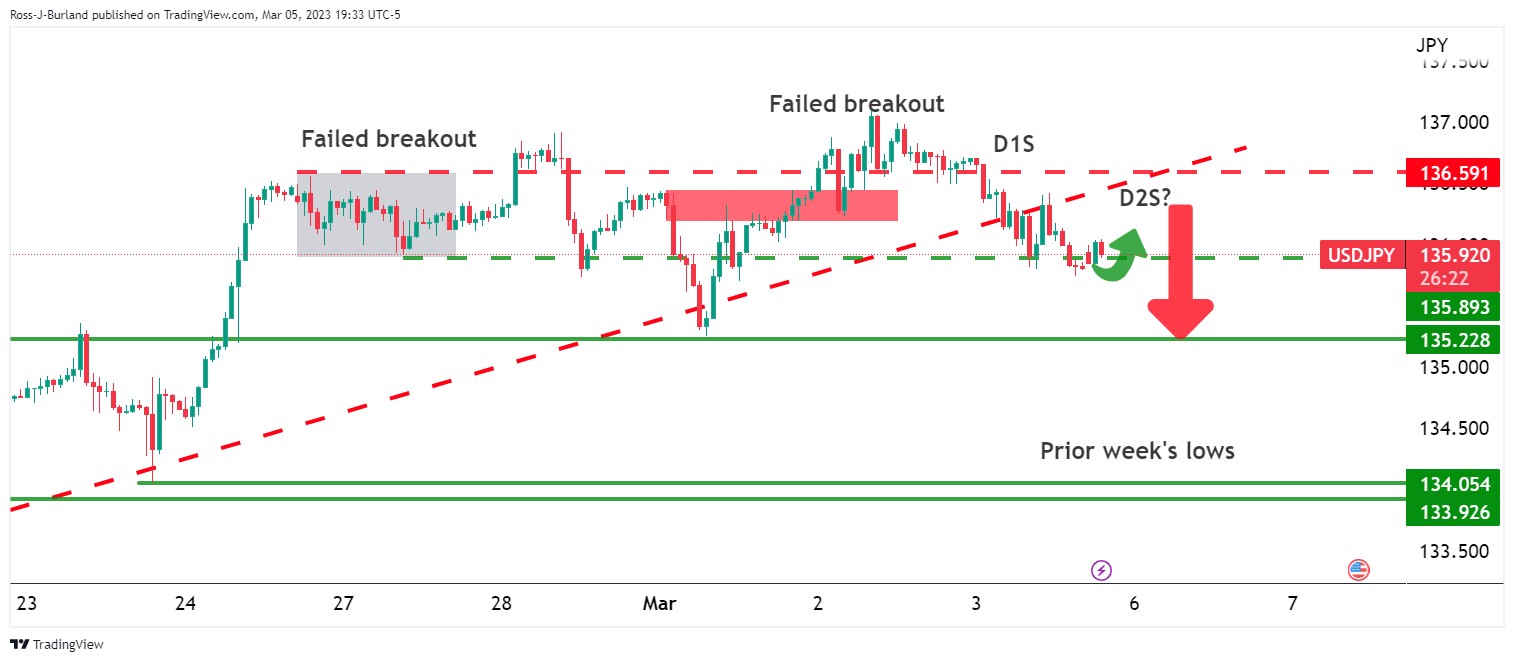
As for the hourly chart, the support below the break of the trendline is being tested while the 135.20s stay intact, so far. We have had two failed breakouts above and we are potentially on the second day of shorts in the market which again, leads to a downside bias while below 136.50.
| Index | Change, points | Closed | Change, % |
|---|---|---|---|
| NIKKEI 225 | 428.6 | 27927.47 | 1.56 |
| Hang Seng | 138.08 | 20567.54 | 0.68 |
| KOSPI | 4.22 | 2432.07 | 0.17 |
| ASX 200 | 28.2 | 7283.6 | 0.39 |
| FTSE 100 | 3.1 | 7947.1 | 0.04 |
| DAX | 250.75 | 15578.39 | 1.64 |
| CAC 40 | 63.9 | 7348.12 | 0.88 |
| Dow Jones | 387.4 | 33390.97 | 1.17 |
| S&P 500 | 64.29 | 4045.64 | 1.61 |
| NASDAQ Composite | 226.03 | 11689.01 | 1.97 |
- US Dollar Index prints mild losses after snapping four-week downtrend.
- Doubts over Fed’s further rate hikes, policy pivot discussions weigh on DXY.
- US Treasury bond yields seesaw after refreshing multi-day high, stock futures print mild losses amid cautious mood.
- Anxiety ahead of the key catalysts joins China-linked headlines to weigh on sentiment and probe US Dollar bears.
US Dollar Index (DXY) consolidates the biggest weekly loss in seven around 104.55-60 at the start of the key week comprising Federal Reserve (Fed) Chairman Jerome Powell’s half-yearly Testimony and the US employment report for February. In doing so, the greenback’s gauge versus the six major currencies cheers mild risk-off mood amid a sluggish Asian session.
That said, headlines from China’s annual session of the National People's Congress (NPC) appear to recently weigh on the risk profile as the dragon nation eyes a modest growth of 5.0%, versus market expectations of 6.0%, for the current year. Apart from the softer Gross Domestic Product (GDP) expectations, after reporting the slowest yearly GDP growth of 3.0% in decades, geopolitical concerns were also discussed and weighed on the sentiment, as well as the NZD/USD prices. “China should promote the peaceful development of cross-Strait relations and advance the process of China's "peaceful reunification", but also take resolute steps to oppose Taiwan independence,” said outgoing China Premier Li Keqiang.
It’s worth noting that softer prints of US data and mixed Fed talks weighed on the DXY the previous week.
US ISM Services PMI for February came in as 55.1 versus 54.5 market expectations and 55.2 market forecasts. The inflation component of the PMI survey, the Price Paid sub-index, edged lower to 65.6 in February from 67.8 but surpassed analysts' estimate of 64.5. The New Orders sub-index rose to 62.6 from 60.4 and the Employment Index advanced to 54 from 50 in the same period. Previously in that week, the US Durable Goods Orders for January eased while the Conference Board’s (CB) Consumer Confidence also flashed mostly downbeat details.
Furthermore, Federal Reserve Bank of Atlanta President Raphael Bostic renewed concerns about the Fed’s policy pivot as the decision-maker said, “The central bank could be in a position to pause the current tightening cycle by mid to late summer.” On the contrary, San Francisco Federal Reserve Bank President Mary Daly said during the weekend that if data on inflation and the labor market continues to come in hotter than expected, interest rates will need to go higher, and stay there longer, than Fed policymakers projected in December, as reported by Reuters. It should be observed that US Federal Reserve published a semi-annual Monetary Policy Report on Friday wherein it clearly said, “Ongoing increases in the Fed funds rate target are necessary.” The report also stated that the Fed is strongly committed to getting inflation back to 2%.
Against this backdrop, the US 10-year Treasury bond yields rose to the highest levels since November 2022 before easing to 3.95% at the latest. That said, Wall Street closed with gains but S&P 500 Futures printed mild losses by the press time.
Moving on, Fed Chair Powell’s testimony and China inflation data, as well as updates from China NPC, can offer short-term directions to the US Dollar Index. Following that, the US jobs report for February will be crucial for DXY traders. Should the latest losing streak of the US data continue, backed by Powell’s cautious remarks, the US Dollar may print more losses.
Technical analysis
A convergence of the 21-day and 50-day Exponential Moving Average (EMA), around 104.15-10, appears a tough nut to crack for the US Dollar Index (DXY) bears.
| Pare | Closed | Change, % |
|---|---|---|
| AUDUSD | 0.67702 | 0.59 |
| EURJPY | 144.409 | -0.34 |
| EURUSD | 1.06329 | 0.32 |
| GBPJPY | 163.564 | 0.11 |
| GBPUSD | 1.20434 | 0.83 |
| NZDUSD | 0.62247 | 0.23 |
| USDCAD | 1.35967 | 0.02 |
| USDCHF | 0.9364 | -0.5 |
| USDJPY | 135.812 | -0.69 |


© 2000-2026. All rights reserved.
This site is managed by Teletrade D.J. LLC 2351 LLC 2022 (Euro House, Richmond Hill Road, Kingstown, VC0100, St. Vincent and the Grenadines).
The information on this website is for informational purposes only and does not constitute any investment advice.
The company does not serve or provide services to customers who are residents of the US, Canada, Iran, The Democratic People's Republic of Korea, Yemen and FATF blacklisted countries.
Making transactions on financial markets with marginal financial instruments opens up wide possibilities and allows investors who are willing to take risks to earn high profits, carrying a potentially high risk of losses at the same time. Therefore you should responsibly approach the issue of choosing the appropriate investment strategy, taking the available resources into account, before starting trading.
Use of the information: full or partial use of materials from this website must always be referenced to TeleTrade as the source of information. Use of the materials on the Internet must be accompanied by a hyperlink to teletrade.org. Automatic import of materials and information from this website is prohibited.
Please contact our PR department if you have any questions or need assistance at pr@teletrade.global.
transfers