- Analytics
- News and Tools
- Market News
CFD Markets News and Forecasts — 16-05-2022
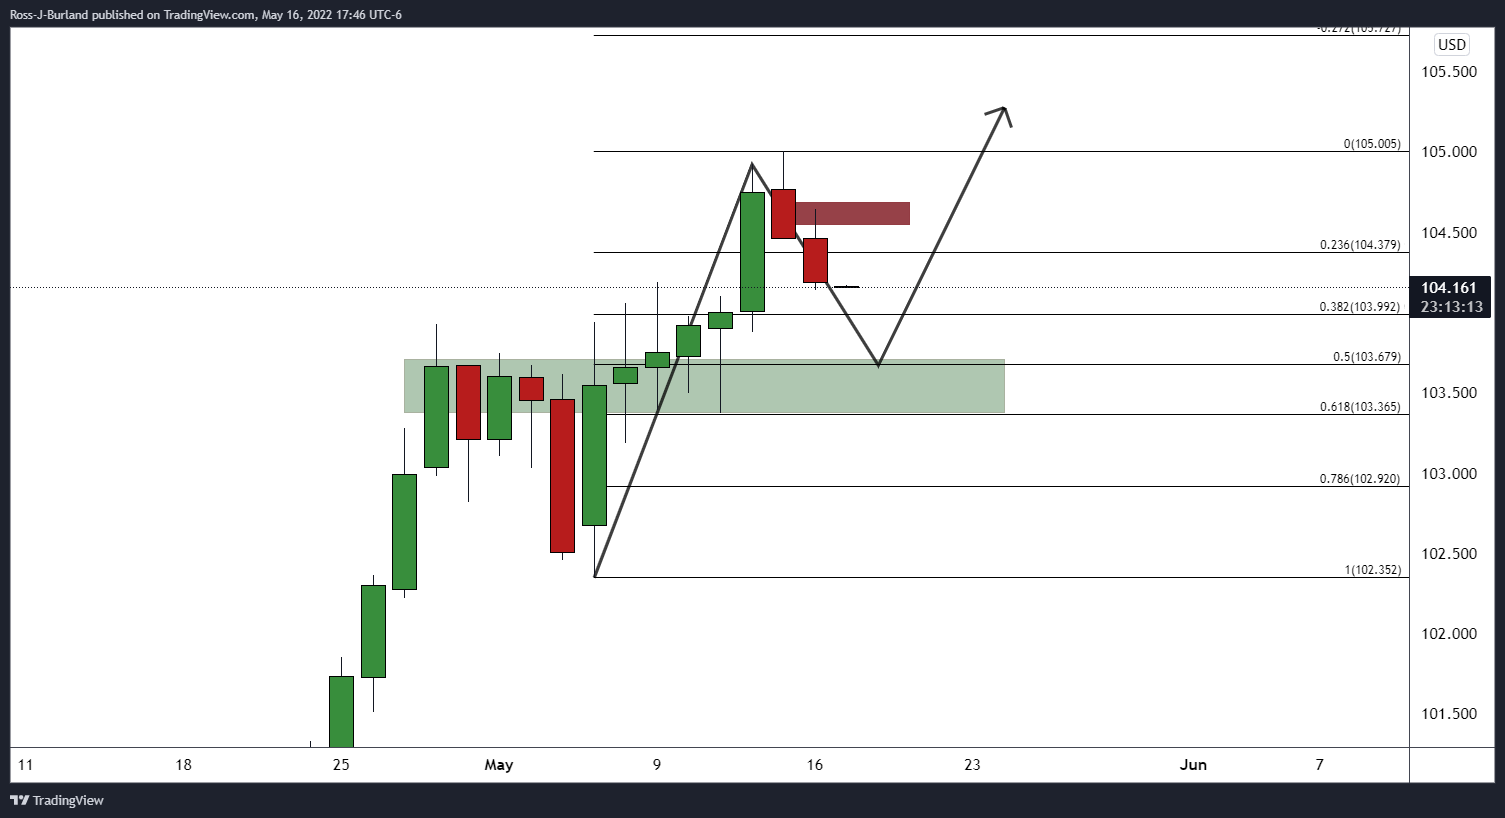
- The 50% mean-reversion target comes in near 103.70.
- Bears can aim for a deeper test towards the golden 61.8% ratio near 103.37.
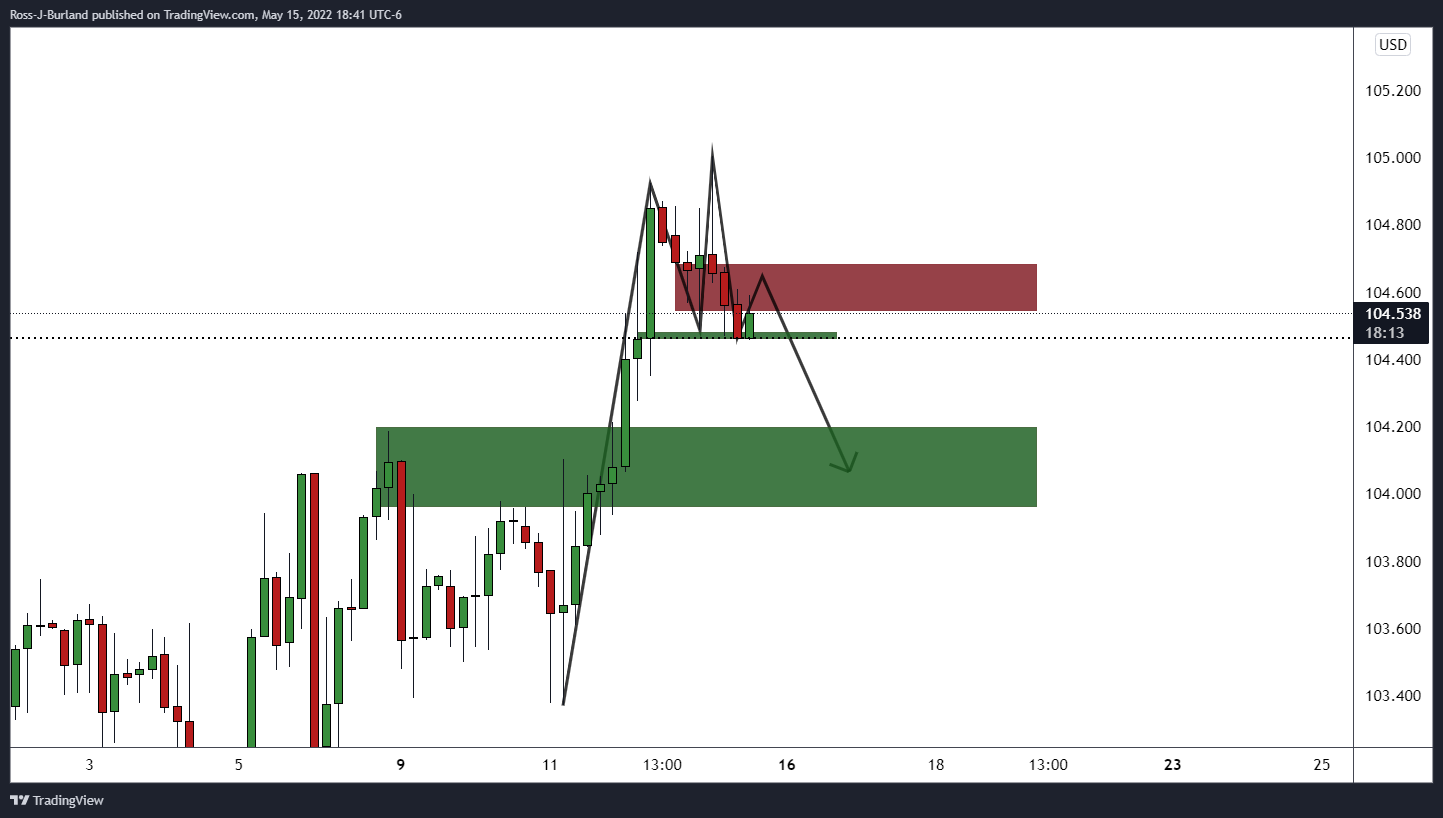
The bulls are out of town at the start of the week and the price is moving towards a 38.2% Fibonacci retracement of the daily bullish impulse after hitting a 20-year peak last week. The following illustrates the potential for lower.
DXY prior analysis
DXY live update and outlook
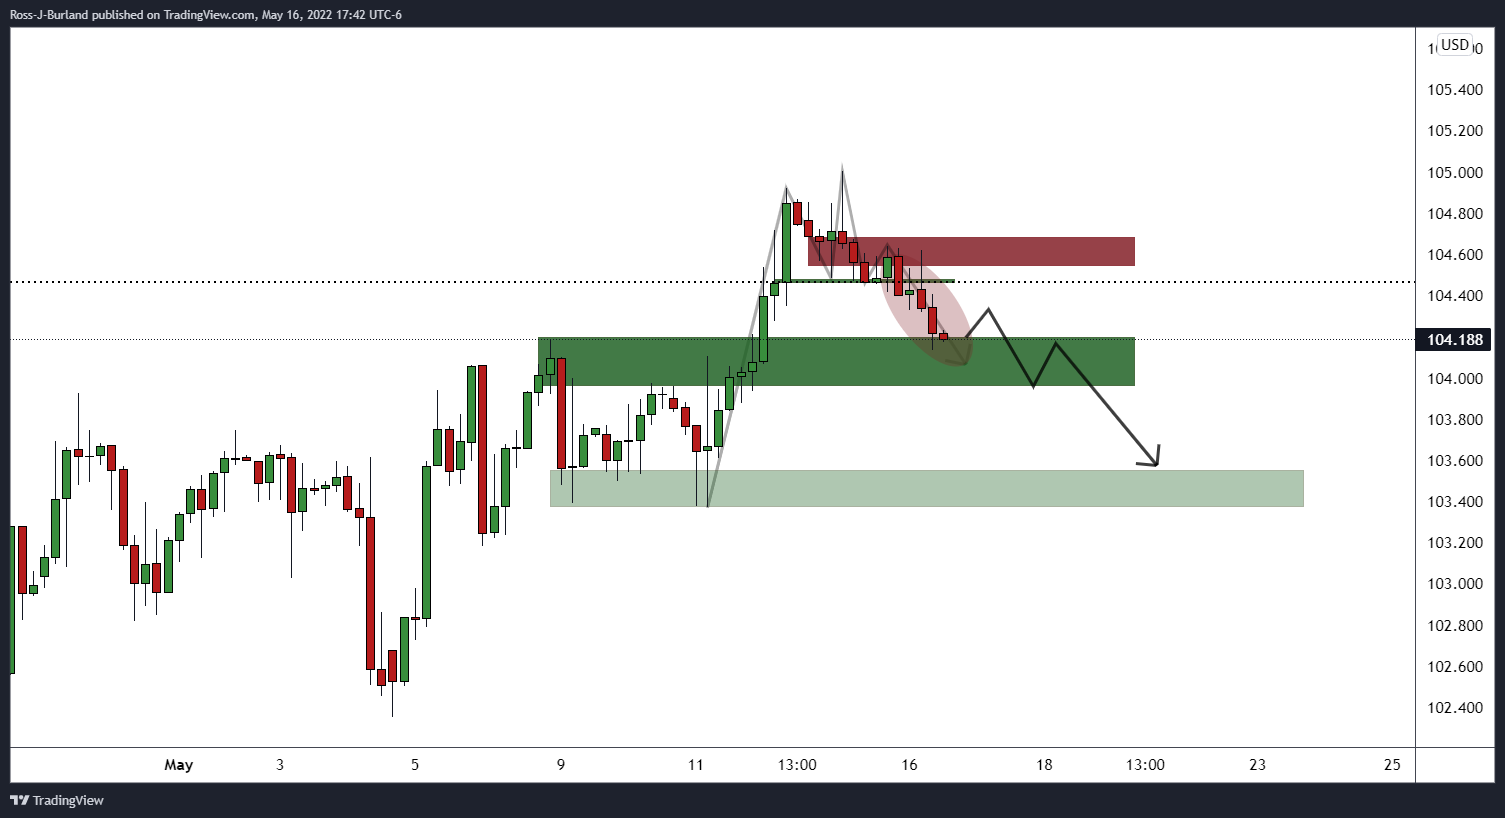
From the 4-hour perspective, the price drifted lower as forecasted into the first level of support near 104.20. With commitment from the bears, any upside correction will be met by supply and potentially lead to a deeper correction on the daily chart as follows:
The 50% mean-reversion target comes in near 103.70 while the golden 61.8% ratio is located at the bottom of the wicks around 103.37.
- AUD/USD dribbles inside 20-pip range, pausing a two-day rebound from mid-2020 lows.
- Yields, stock futures dwindle amid an absence of major macros.
- Softer US data, Fedspeak enabled buyers to ignore downbeat signals from China.
- RBA Meeting Minutes will be observed for rate hike clues, US Retail Sales for April, covid updates important too.
AUD/USD remains sidelined as buyers await the key catalysts after a two-day rebound from multi-month lows. That said, the Aussie pair seesaws between 0.6965 and 0.6985 during the initial Asian session as traders brace for the Reserve Bank of Australia’s (RBA) Monetary Policy Meeting Minutes, as well as the US Retail Sales for April.
After a dull start to the week, the AUD/USD pair managed to cheer the US dollar weakness by extending the previous week’s corrective pullback near a two-year low.
Recently weighing on the quote could be Australia’s weekly ANZ Roy Morgan Consumer Confidence dropped to 89.3 from 90.5.
Also challenging the pair’s upside momentum are covid woes and downbeat data from the biggest customer China. On Monday, China reported downbeat figures for April month’s Retail Sales and Industrial Production, backed by conveying fresh fears over the coronavirus resurgence. That said, Shanghai City Official’s comments and weekend updates from Beijing were the major catalysts to renewing COVID-19 fears. While Shanghai City Official initially mentioned that the city's epidemic is under control, he also stated, “However the risks of rebound remain and we need to continue to stick to controls,” which in turn drowned the market’s risk appetite.
On the flip side, the US Dollar’s pullback could be linked to a fall in the NY Empire State Manufacturing Index for May, expected +15.5 versus -11.6 actual, as well as comments from New York Fed President John Williams. Fed’s Williams backed Chairman Jerome Powell’s 50 basis points (bps) rate hike idea by highlighting inflation as the main issue. It should be noted that the news suggesting the US extend covid public health emergency beyond July also allowed the US dollar to pare some gains. That said, the US Dollar Index (DXY) eased further from its 20-year top, printed a two-day downtrend as sellers approach 104.00 by the end of Monday’s North American session.
Against this backdrop, Wall Street benchmarks closed mixed and the US 10-year Treasury yields dropped to 2.88%, down 3.6 bps. Further, the S&P 500 Futures remain directionless by the press time.
Moving on, the Minutes of the RBA’s latest meeting will be crucial amid indecision over the size of the next rate hike by the Aussie central bank. Following that, the US Retail Sales for April, expected at 0.7% versus 0.5% prior, will also be important to watch for fresh impulses. Additionally, headlines concerning China’s covid conditions and the Russia-Ukraine crisis are also useful for determining short-term AUD/USD moves.
Technical analysis
AUD/USD bulls attack January 2022 bottom surrounding 0.6965-70 to dominate further. However, lows marked during late 2021 and earlier in the month, respectively around 0.6995 and 0.7030, will challenge the additional upside.
Alternatively, a downward sloping trend line from August 2020, near 0.6820, challenges the pair’s downside moves.
- WTI oil prices remain firmer around seven-week high, extending four-day uptrend.
- Softer USD, fears of EU oil embargo on Russia keep buyers hopeful.
- Headlines from the Middle East, covid fears in China challenge upside momentum.
- US Retail Sales for April, Weekly API inventory figures will be important for near-term directions.
WTI grinds higher around $112.00, after poking the late March tops during the four-day uptrend. That said, the black gold recently takes rounds to $111.80-90 as traders await more clues, which in turn highlights today’s US Retail Sales and API Weekly Crude Oil Stock.
The energy benchmark rose the most in four days the previous day, by refreshing the multi-day high, as the US Dollar Index (DXY) eased further from its 20-year top. That said, the greenback gauge printed a two-day downtrend as sellers approach 104.00 of late.
A fall in the NY Empire State Manufacturing Index for May, expected +15.5 versus -11.6 actual, joined comments from New York Fed President John Williams to weigh on the US dollar. Fed’s Williams backed Chairman Jerome Powell’s 50 basis points (bps) rate hike idea by highlighting inflation as the main issue. It should be noted that the news suggesting the US extend covid public health emergency beyond July also allowed the US dollar to pare some gains.
On the other hand, Saudi Arabia and Iran showed concerns over the latest economic scenario that restricts them to pump more oil into the markets. Also, China’s downbeat Retail Sales and Industrial Production for April joined fears of more days to overcome the covid resurgence to weigh on the commodity prices.
Alternatively, the European Union (EU) remains on the way to announcing major sanctions on Russian oil imports, which in turn could favor the WTI bulls. However, Hungary, the Czech Republic and Slovakia try to pull back the verdict but are likely to fail.
Moving on, the US Retail Sales for April, expected at 0.7% versus 0.5% prior, will precede the private oil inventory data from the American Petroleum Institute (API), prior 1.618M, to direct short-term WTI. Should the scheduled data suggests more draw and further weakness into the USD, the oil prices may have further upside room to track.
Technical analysis
A daily closing beyond an upward sloping trend line from late March, around $111.00 by the press time, enables WTI bulls to aim for the March 24 swing high surrounding $115.85-90.
- Gold price has moved above $1,820 as DXY weakens on fewer economic events.
- The Fed is expected to feature two more jumbo rate hikes in CY2022.
- A bullish range shift in the RSI (14) has strengthened the gold bulls.
Gold price (XAU/USD) is establishing itself above $1,820.00 after finding an intense responsive buying action below the psychological support of $1,800.00 on Friday. It looks like the firmer rebound in the precious metal has turned the table in the favor of bulls. The bright metal is eyeing an initiative buying interest for a further upside move amid weakness in the US dollar index (DXY).
The DXY has witnessed a steep fall after failing to sustain at fresh 19-year highs of 105.00 last week. A follow-up correction in the DXY after a juggernaut rally has improved the demand for the yellow metal. The recent fall in the DXY could be the result of fully discounted two more jumbo interest rate hikes by the Federal Reserve (Fed) this year. The Fed announced a rate hike by 50 basis points (bps) in May’s first week and the interview of Fed chair Jerome Powell with the Marketplace national radio program has bolstered the odds of two more jumbo rate hikes consecutively.
US Retail Sales
In today’s session, the release of the US Retail Sales will hog the limelight. A preliminary estimate for the monthly US Retail Sales is 0.7% against the prior print of 0.5%. Higher Retail Sales will indicate the confidence of consumers in the economy and eventually, it will strengthen the DXY and weaken the gold prices.
Gold technical analysis
On an hourly scale, a firmer responsive buying action in the gold prices below the psychological support of $1,800.00 has strengthened the asset. The precious metal is trading near the trendline placed from May’s high at $1,909.83. A bullish range shift has been witnessed from the momentum oscillator, Relative Strength Index (RSI) (14). The oscillator has shifted into the 60.00-80.00 range, which signals a firmer upside move ahead. The RSI (14) faced multiple failures while overstepping 60.00. Also, the gold prices have established above the 20-period Exponential Moving Average (EMA) at $1,816.50, which adds to the upside filters.
Gold hourly chart
-637883406244797847.png)
US inflation expectations, as per the 10-year breakeven inflation rate per the St. Louis Federal Reserve (FRED) data, probe the US Dollar bulls as the figure drops back towards the lowest level in 11 weeks, flashed on Thursday.
That said, the latest print of the US inflation expectations appears 2.68% by the end of Monday’s North American session.
Amid the sustained fall in US Treasury yields, in contrast to the market’s inflation fears, the US dollar also fails to extend the north-run in the last few days. That said, the US Dollar Index (DXY) eased for the second consecutive day by the end of Monday’s trading, stepping back from the 20-year high marked on Thursday.
This makes today’s US Retail Sales for April, expected at 0.7% versus 0.5% prior, important to watch for near-term trade directions.
Read: Further pressure on central banks
- The Australian dollar rose vs. the yen, despite a risk-aversion environment.
- On Tuesday, Asian equity futures point to a higher open, boosting the prospects of risk-sensitive currencies.
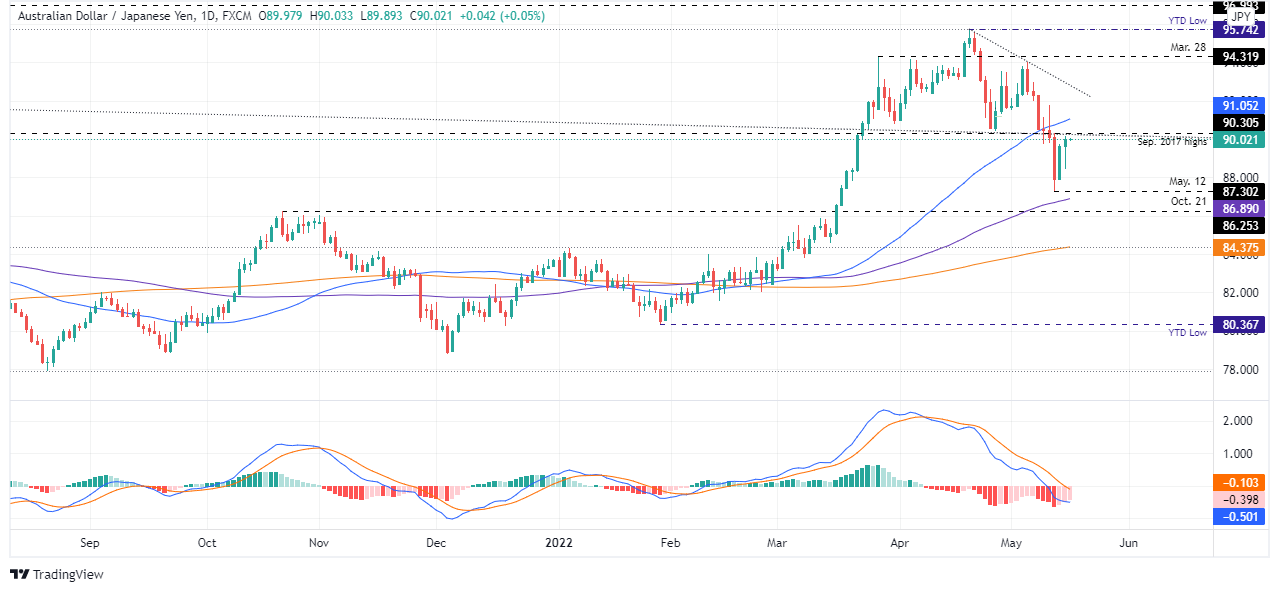
- AUD/JPY Price Forecast: Monday’s candlestick left a large bottom wick, meaning that bulls lifted prices but remain downward pressured unless a daily close above 91.00 is achieved.
The AUD/JPY marches firmly for the second consecutive day but remained below the April 27 swing low of 90.43, amidst a downbeat market mood that faltered to push AUD/JPY prices lower, despite JPY strength. At 90.02, the AUD/JPY is above the 90.00 mark, and the pair is trapped between the 50 and 100-day moving averages (DMAs) at 91.05 and 86.89, respectively.
Sentiment-wise, Asian equity futures point to a higher open, contrarily to New York’s mood, despite investors’ concerns about the Federal Reserve’s pace of tightening monetary policy and China’s economic slowdown, as Industrial Production and Retail Sales shrank, reflecting the impact of covid-19 zero-tolerance restrictions.
During the overnight session, the AUD/JPY opened at around 89.50, daily highs, followed by a dip towards 88.50, as risk-aversion took its toll on risk-sensitive currencies like the AUD, the NZD, and the CAD. However, late in the overlap of the European/North American session, sentiment improved, and boosted the prospects of the Australian dollar, as the Japanese yen, finished as the laggard in the FX space.
AUD/JPY Price Forecast: Technical outlook
The AUD/JPY is neutral-upward biased once the cross-currency pair broke below the 50-DMA to the downside. Now that the pair sits nearby the 100-DMA, that could open the door for further upside price action, as witnessed by Monday’s candlestick, with a large bottom-wick, meaning that AUD/JPY bulls leaned ahead of the 100-DMA around 88.29 and pushed prices higher.
That said, the AUD/JPY’s first resistance would be the 90.00 barrier. Once cleared, the following resistance would be September 2017 daily high at 90.30, followed by the 50-DMA at 91.05. On the flip side, the AUD/JPY first support would be 89.00. Break below would expose the 88.00 mark, followed by the May 12 daily low at 87.30.
Key Technical Levels
- GBP/JPY pauses two-day recovery moves inside one-month-old bearish channel.
- Bearish MACD signals join recent pullback to suggest further grind to the south.
- 160.30-35 appears a tough nut to crack for bulls, sellers have multiple hurdle to visit.
GBP/JPY fades from a two-day rebound near 159.00 as traders await UK data during Tuesday’s Asian session.
In doing so, the cross-currency pair remains inside a one-month-old descending trend channel formation, recently firmer around the 50% Fibonacci retracement (Fibo.) of December 2021 to April 2022 upside.
It’s worth noting that the GBP/JPY breakout of 50% Fibo enables the quote to aim for further upside. However, bearish MACD signals and a strong resistance to the north comprising the 50-day EMA and upper line of the stated channel, near 160.35-30, could challenge the buyers.
Meanwhile, a clear upside break of the 160.35 won’t hesitate to aim for the monthly high surrounding 163.90.
Alternatively, pullback moves may aim for the 50% and 61.8% Fibonacci retracement levels, respectively near 158.65 and 156.35.
Even so, the 200-day EMA and an upward sloping support line from late 2021, close to 156.00 and 152.70 in that order, will act as the last defenses for buyers.
GBP/JPY: Daily chart
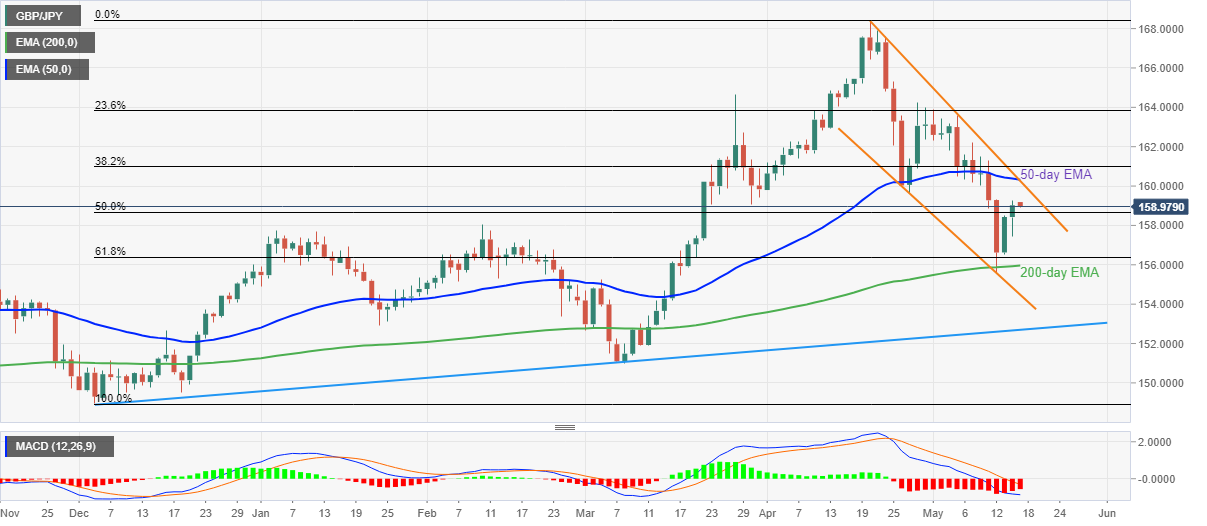
Trend: Further weakness expected
- EUR/USD is facing barricades around 1.0440 as investors need a fresh trigger for a decisive move.
- Eurozone GDP numbers are seen stabled while the US Retail Sales could outperform.
- Investors should brace for two more 50 bps rate hikes by the Fed this year.
The EUR/USD pair is displaying back and forth moves in a tight range of 1.0428-1.0443 after a modest upside move from a low of 1.0354 last week. A minor improvement in the risk appetite of the market participants has supported the shared currency bulls. The risk-sensitive assets have rebounded gradually amid the value buying structure in the FX domain. Risky assets were beaten hard by investors on souring market mood for a tad higher time period.
Some signs of profit-booking in the US dollar index (DXY) amid fewer economic events this week have pushed the DXY to near 104.00. The DXY printed a fresh 19-year high of 105.00 last week o rising expectations of more than two jumbo rate hikes by the Federal Reserve (Fed) this year. Fed chair Jerome Powell in his interview with the Marketplace national radio program on Friday investors should brace for two more jumbo rate hikes consecutively in the next two policy meetings. Also, he emphasized bringing price stability as it is hurting the paychecks of the households.
In today’s session, investors will focus on the release of the US Retail Sales. The economic data is seen at 0.7% against the prior print of 0.5% on monthly basis. While the euro docket will report the Gross Domestic Product (GDP) numbers. The yearly and quarterly figures are expected to remain unchanged at 5% and 0.2% respectively.
- GBP/USD holds onto two-day rebound from multi-month low amid US dollar pullback, mild risk-on.
- UK PM Johnson is set for announcing plans to override parts of Northern Ireland protocol despite EU’s warning.
- BOE’s Bailey raised concerns about inflation, Fed’s Williams backs 50 bps rate hike.
- UK Jobs report, Brexit news eyed for immediate directions, US Retail Sales will be important afterward.
GBP/USD grinds higher past 1.2300, keeping the two-day recovery moves from the lowest levels since mid-2020, as cable traders await the UK’s jobs report, as well as key Brexit updates, for fresh impulse. That said, the quote stays firmer around 1.2330 by the press time of early Tuesday morning in Asia.
The Sterling had all it needed to begin the week’s trading on a negative side, which it did before printing a daily positive. However, a softer USD and broad risk-on mood played it all to help the pair consolidate the latest losses ahead of the key UK data and upbeat surrounding the Northern Ireland Protocol (NIP).
Starting with Brexit, UK PM Boris Johnson is all set to alter part of the NIP by citing it as an “insurance” in case of the European Union’s (EU) failure to respect other terms. Johnson’s move is in contrast to the bloc’s warning of cutting trade and will be observed closely. “Foreign Secretary Liz Truss will give a major statement on Tuesday - after the PM said in Northern Ireland: 'To have the insurance, we need to proceed with a legislative solution,’” said UK Mirror.
On the other hand, Bank of England (BOE) Governor Andrew Bailey testified before the House of Commons Treasury Committee amid allegations that the “Old Lady” stayed soft on inflation. During his speech, BOE’s Bailey revealed his “unhappiness” with inflation and warned of more suffering.
Elsewhere, a fall in the NY Empire State Manufacturing Index for May, expected +15.5 versus -11.6 actual, joined comments from New York Fed President John Williams to weigh on the US dollar. Fed’s Williams backed Chairman Jerome Powell’s 50 basis points (bps) rate hike idea by highlighting inflation as the main issue. It should be noted that the news suggesting the US extend covid public health emergency beyond July also allowed the US dollar to pare some gains.
Amid these plays, Wall Street benchmarks closed mixed and the US 10-year Treasury yields dropped to 2.88%, down 3.6 bps.
Looking forward, the UK’s Claimant Count for April is expected to improve from -46.9K to -38.8K whereas the ILO Unemployment Rate for three months to March may remain unchanged at 3.8%. The Average Earnings, however, could improve while excluding the bonus. Hence, the overall data is likely to help the GBP/USD prices to keep the latest rebound even as the qualitative catalysts are against the same.
Read: UK Jobs Preview: Why GBP/USD may offer an early selling opportunity, and when
Following the UK data, the US Retail Sales for April, expected at 0.7% versus 0.5% prior, will be important to watch amid ongoing concerns over inflation and consumer behavior.
Additionally, central bank speakers, Brexit updates and covid headlines are some other catalysts that can direct short-term GBP/UDS moves.
Technical analysis
GBP/USD recently confirmed a falling wedge bullish chart pattern with a clear break above 1.2300, suggesting further advances towards the monthly high surrounding 1.2640. The recovery moves also gain support from the MACD line’s impending bull cross and nearly oversold RSI.
Alternatively, a downside break of 1.2280 will negate the bullish breakout and can drag the quote back to the latest lows surrounding 1.2155.
- USD/CHF has slipped below 1.0020 ahead of the US Retail Sales.
- A light economic calendar has brought some exhaustion to the DXY’s rally.
- The quarterly Swiss Industrial Production will be the major trigger for the Swiss franc.
The USD/CHF pair has witnessed a minor correction after printing a fresh two-year high of 1.0064 on Monday. A rebound in the risk-on impulse has supported the risk-perceived currencies, which has underpinned the Swiss franc against the greenback.
The US dollar index (DXY) has remained firmer over the past few trading weeks amid expectations of two more 50 basis points (bps) rate hikes by the Federal Reserve (Fed) in its next monetary policy meetings. Now, the unavailability of any major trigger in the US economic calendar has brought some profit-booking to the counter.
The DXY is facing some signs of exhaustion after hitting a 19-year high of 105.00 last week. In today’s session, investors will keep an eye on US Retail Sales. The monthly Retail Sales figure is seen at 0.7% against the prior print of 0.5%. A higher-than-expected figure may support the DXY and renewal of a multi-year high could be seen.
On the Swiss franc front, a prolonged prudent monetary policy by the Swiss National Bank (SNB) to support the aggregate demand will continue to keep the Swiss franc on the sidelines. Inflation levels are rock-bottom, which may not compel SNB policymakers to adopt a hawkish tone. Going forward, the Swiss Statistics will report the quarterly Industrial production data on Friday. Previously, the Swiss agency reported the quarterly Industrial Production at 7.3%.
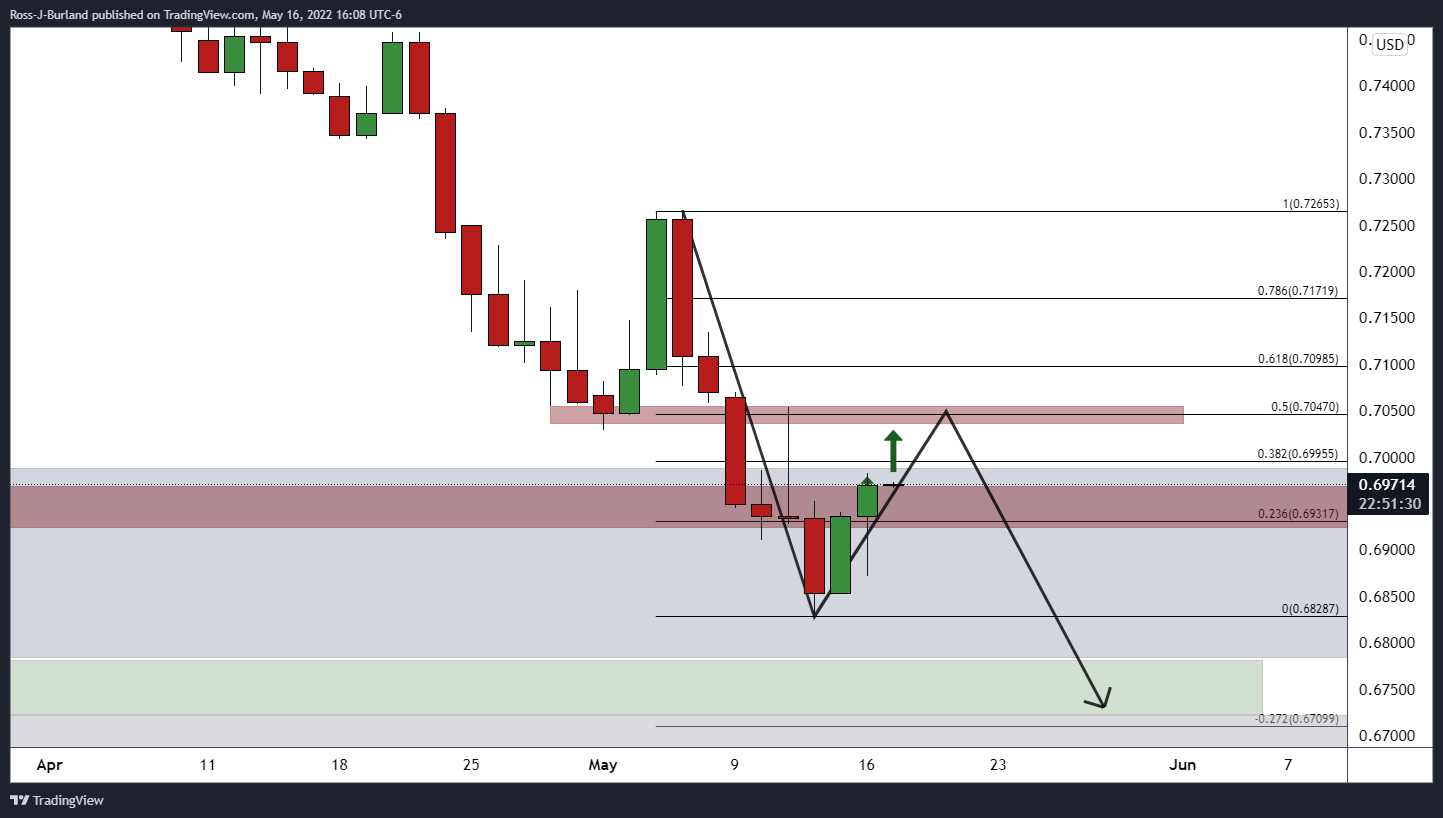
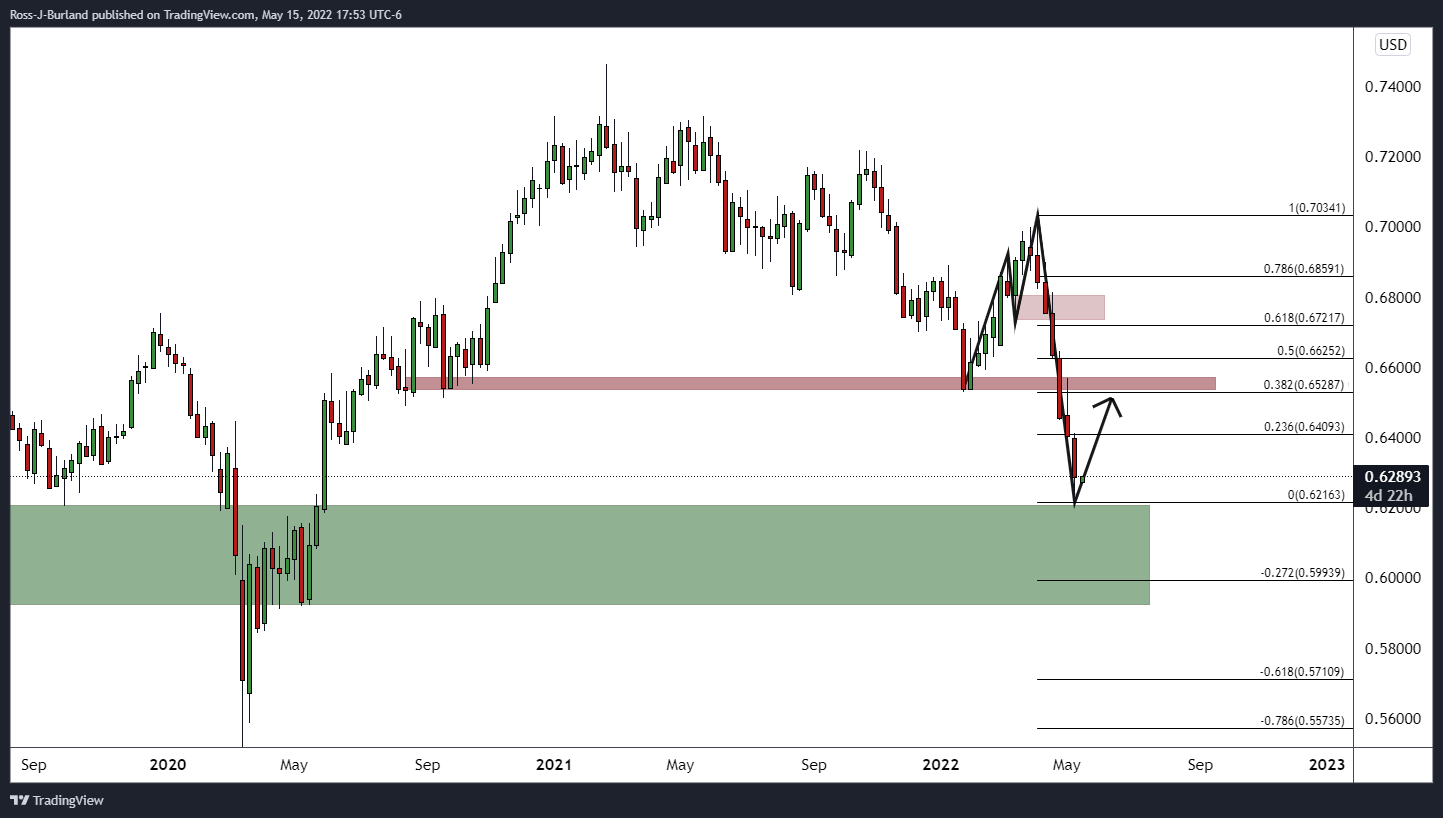
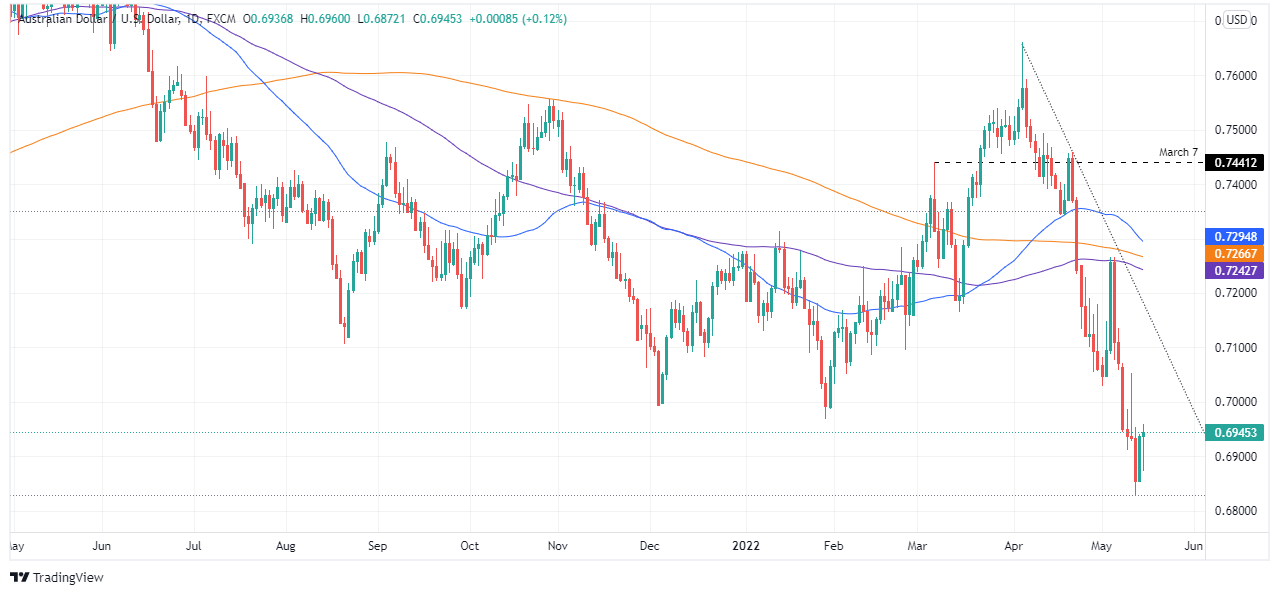
- AUD/USD bulls are moving in on critical daily resistance.
- The bears are lurking for a discount and lower lows ahead in the bearish cycle.
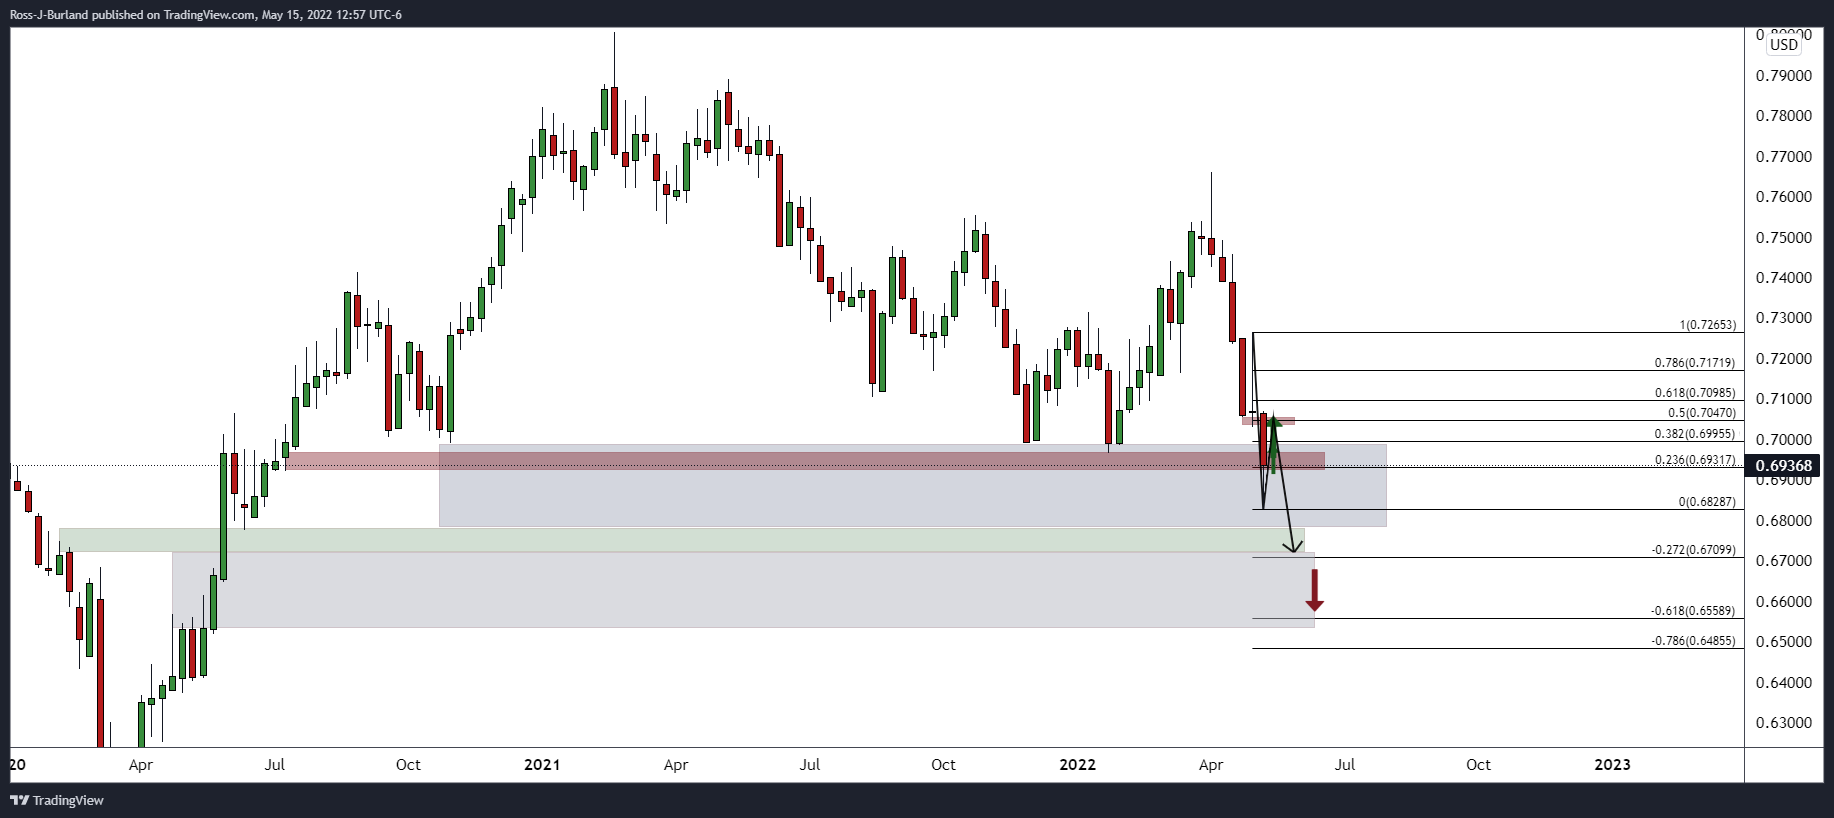
As per the start of the week's pre-open analysis, AUD/USD Price Analysis: Pre-open glance on daily chart eyes prospects for a downside continuation, the price is moving in the direction of the 0.7050 target as follows:
AUD/USD daily charts, prior analysis
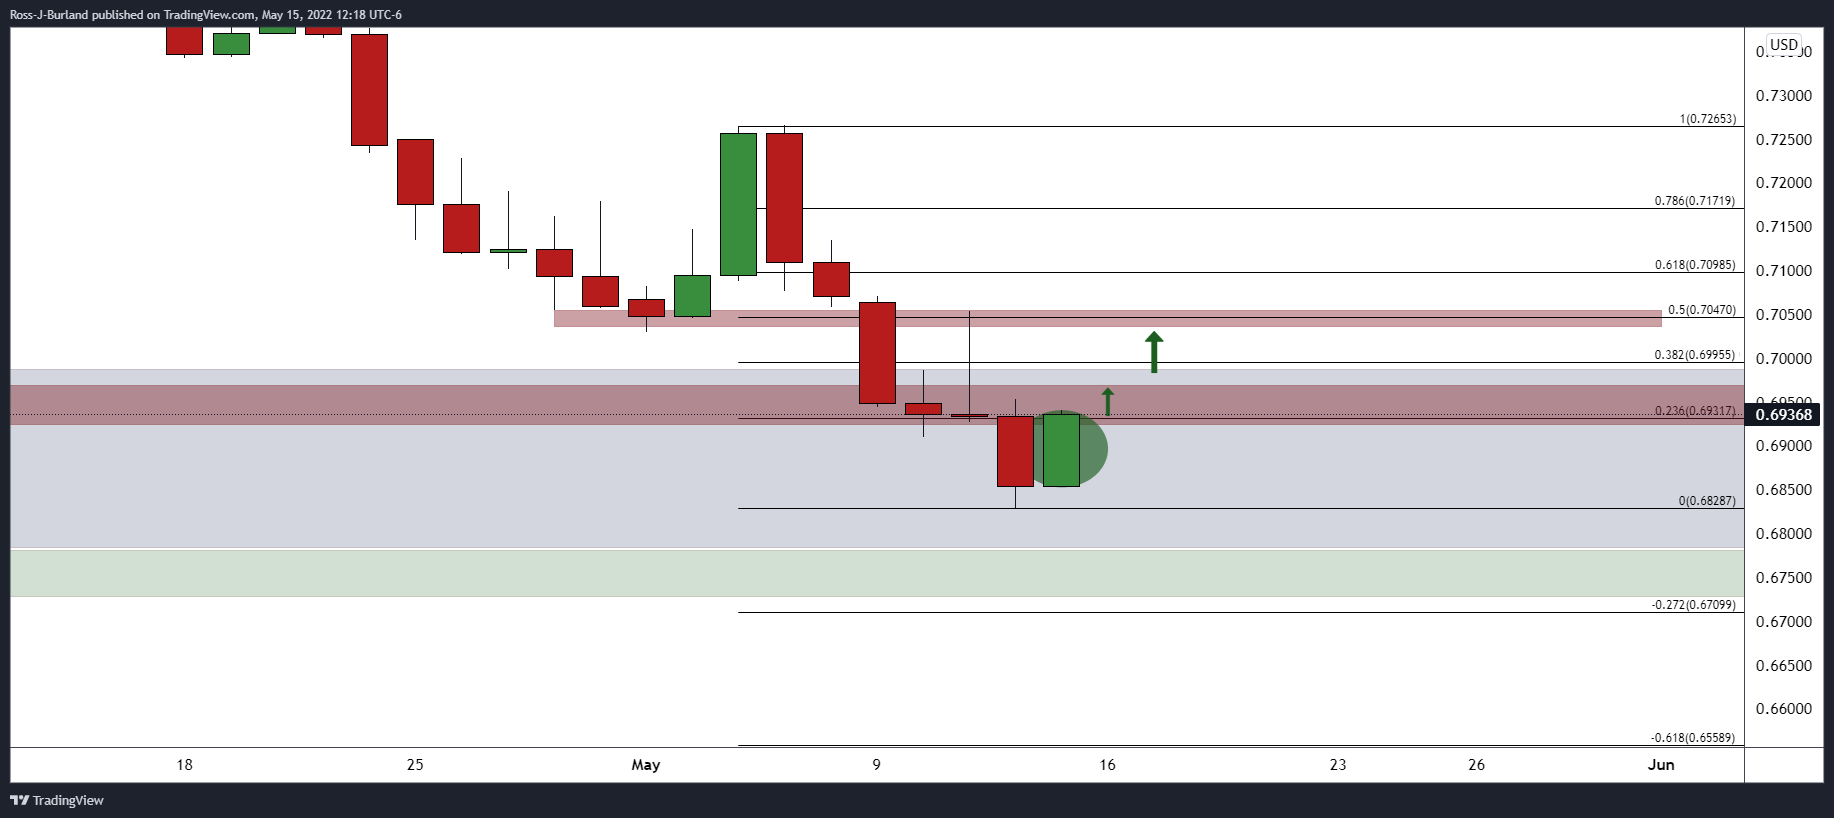
AUD/USD, live update
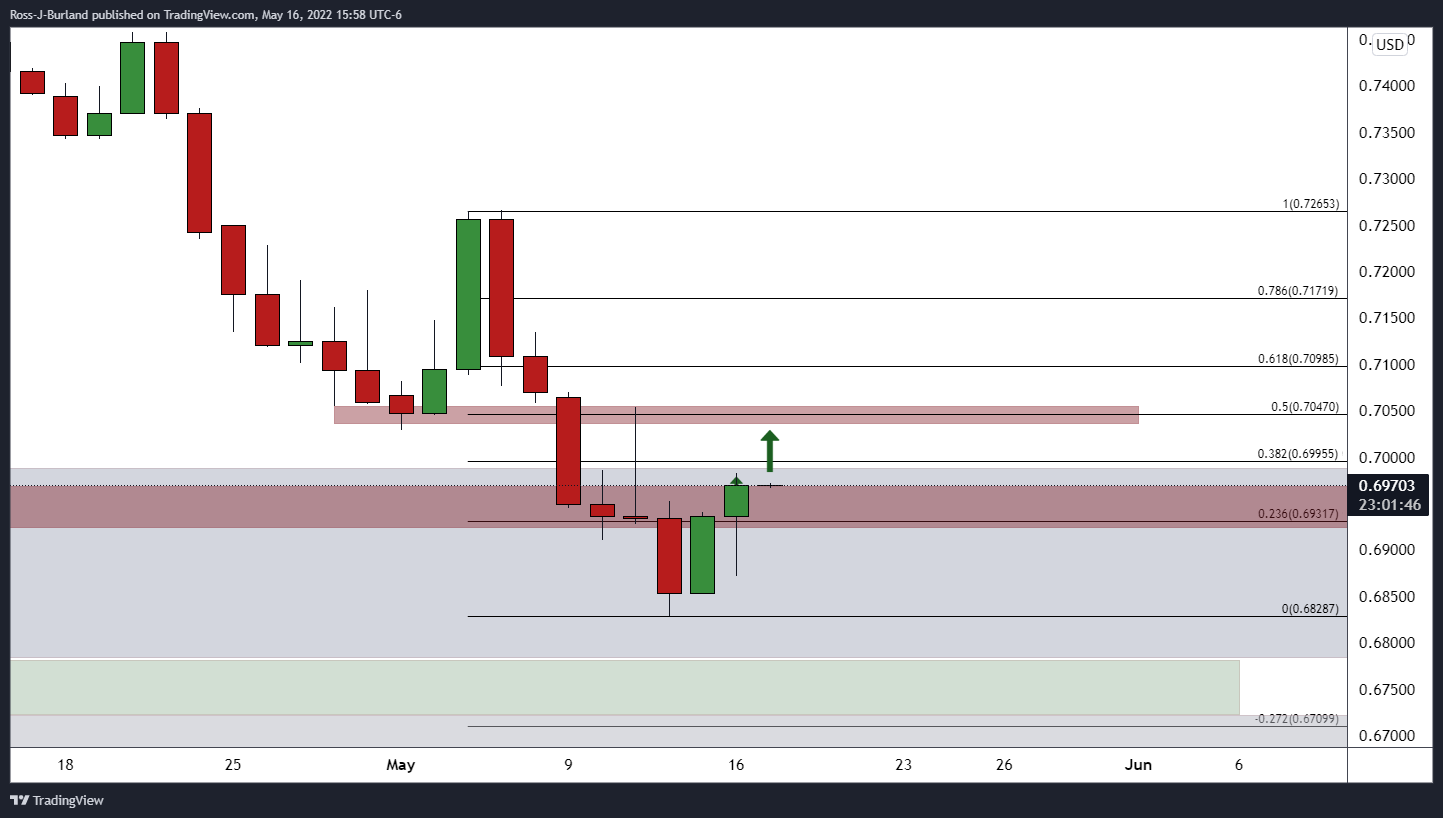
The first objective and the test of 0.6967 28 Jan lows as per the structure illustrated above is underway.
Thereafter, the 0.7050s will still be eyed. If bulls commit at either of these levels, it could be all downhill from thereon:
- The greenback remains trading on the backfoot vs. the Japanese yen amid falling US Treasury yields.
- Risk-aversion, a headwind for the USD/JPY, as US equities finished with losses in the New York session.
- USD/JPY Price Forecast: Remains upward biased, though a dip towards 126.94 first and then 125.10 is on the cards.
The USD/JPY is losing some ground as the Asian Pacific session begins, down some 0.10%, as US Treasury yields could not recover from earlier losses, led by the 10-year benchmark note, down some three basis points, amid a risk-off market mood. At the time of writing, the USD/JPY is trading at 129.02.
US equities fell at the close of NY, and US Treasury yields rebound
Late in the New York session, market sentiment fluctuated, finishing downbeat, as market participants assessed the Federal Reserve monetary policy pace and China’s economic slowdown, courtesy of restrictions re-imposed on the last Covid-19 outbreak. US Treasury yields pare some losses in the long-end of the curve, but in the short and mid-end, dropped.
In the meantime, the US Dollar Index, a gauge of the greenback’s value against a basket of peers, suffered decent losses of 0.25% for the second straight session and sat at 104.206, retreating from multi-month highs around 105.00.
Meanwhile, Fed speaking dominated the headlines in the US docket. John Williams, NY Fed President, said that the US central bank is focused on one issue, named inflation, and added that it is running far too high and stubbornly persistent. He said that 50-bps rate hikes make sense at upcoming meetings and added to the list of central bankers, expressing worries about China’s economic deceleration.
Elsewhere, China’s Industrial Production and Retail Sales contracted, meaning that the zero-tolerance Covid-19 restrictions are already showing on the economic indicators, despite efforts made by the People’s Bank of China (PBoC), which is stimulating the economy but failing to provide the results foreseen by Beijing.
Data-wise, the US economic docket featured the New York Fed Empire State Index, which disappointed expectations of +17.0, and came at -11.6. Ahead in the week, April’s Retail Sales, Industrial Production, Building Permits, and Initial Jobless Claims would offer some fresh impetus to USD/JPY traders regarding the economic conditions of the US.
On the Japanese front, the GDP on its Preliminary reading is expected to grow by 1.1% in Q1, while annualized is foreseen at 5.4%, both readings to be released on Wednesday.
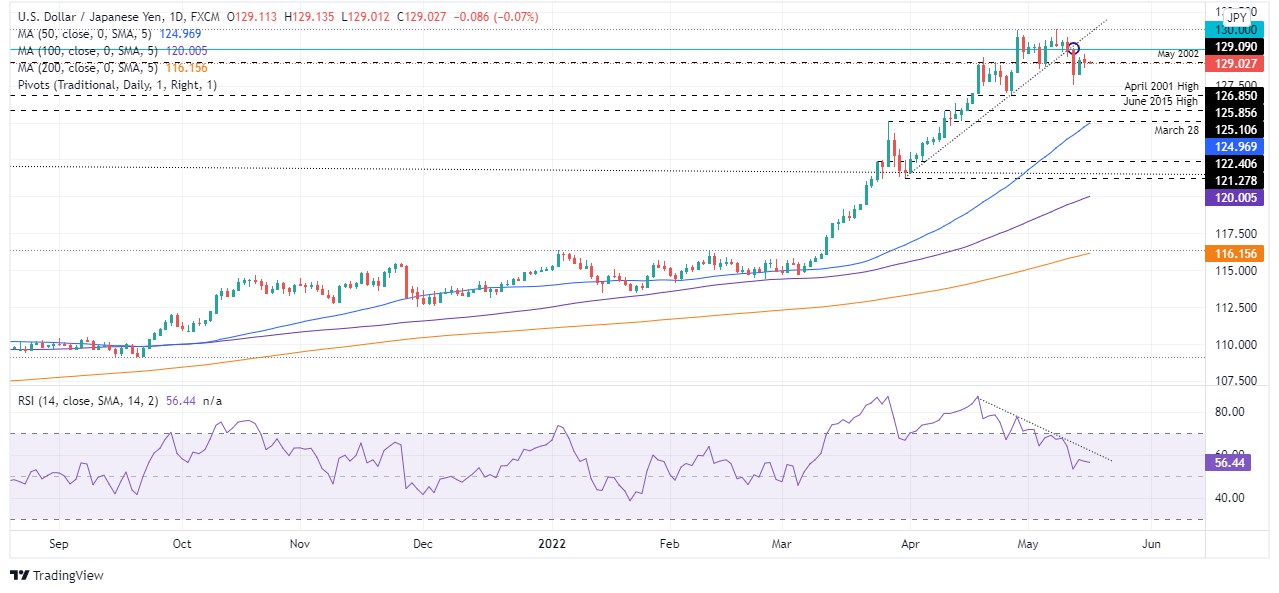
USD/JPY Price Forecast: Technical outlook
Since last Thursday, May 12, the USD/JPY broke below a one-and-a-half month-old upslope trendline, right at the 130.00 mark. As the major was printing higher highs, the Relative Strength Index was printing lower highs, usually called a negative divergence between the price action/oscillator. Nevertheless, the USD/JPY remains upward biased, but a break below 126.94 would expose the March 28 daily high-turned-support at 125.10.
The USD/JPY first support would be the 129.00 mark. Once cleared, the next support would be May 12 daily low at 127.51, followed by April’s 27 daily low at 126.94. On the flip side, and on the path of least resistance of the major, the first resistance would be 130.00, followed by the upslope trendline, passing nearby the 130.70-90 area, and then the YTD high at 131.34.
- USD/CAD is hovering around 1.2850 as investors await US Retail Sales.
- Canada’s CPI is seen unmoved at 6.7% on yearly basis.
- Oil prices have gained sharply on multi-year lowest US SPR.
The USD/CAD pair is oscillating below 1.2850 after a sheer downside fall from a high of 1.3076 published last week. The asset has been shifted into a negative trajectory after the US dollar index (DXY) saw signs of exhaustion on elevated levels.
The DXY entered into a correction phase after hitting a high of 105.00 last week. The asset has eased around 0.75% from its recent high and is expected to remain subdued this week amid a light economic calendar. Although the major event for the DXY will be the release of the US Retail Sales, which are due in the New York session. The monthly Retail Sales are seen at 0.7%, higher than the prior print of 0.5%.
On the oil front, galloping oil prices have underpinned the loonie bulls against the greenback. A four-day winning streak with fresh monthly highs has supported the Canadian dollar. Oil prices have gained sharply as supply worries have been renewed on the falling US Strategic Petroleum Reserves (SPR) and OPEC’s inability to produce the required oil. The US SPR has fallen to 538 million barrels, the lowest since 1987, as per Reuters. Earlier, US President Joe Biden announced the highest release of oil from its US SPR to support the demand catalyst.
Going forward, the loonie bulls will react to the release of Canada’s Consumer Price Index (CPI) on Wednesday. The yearly figure is expected to remain stable at 6.7% while the monthly figure could fall vigorously to 0.7% from the previous print of 1.4%.
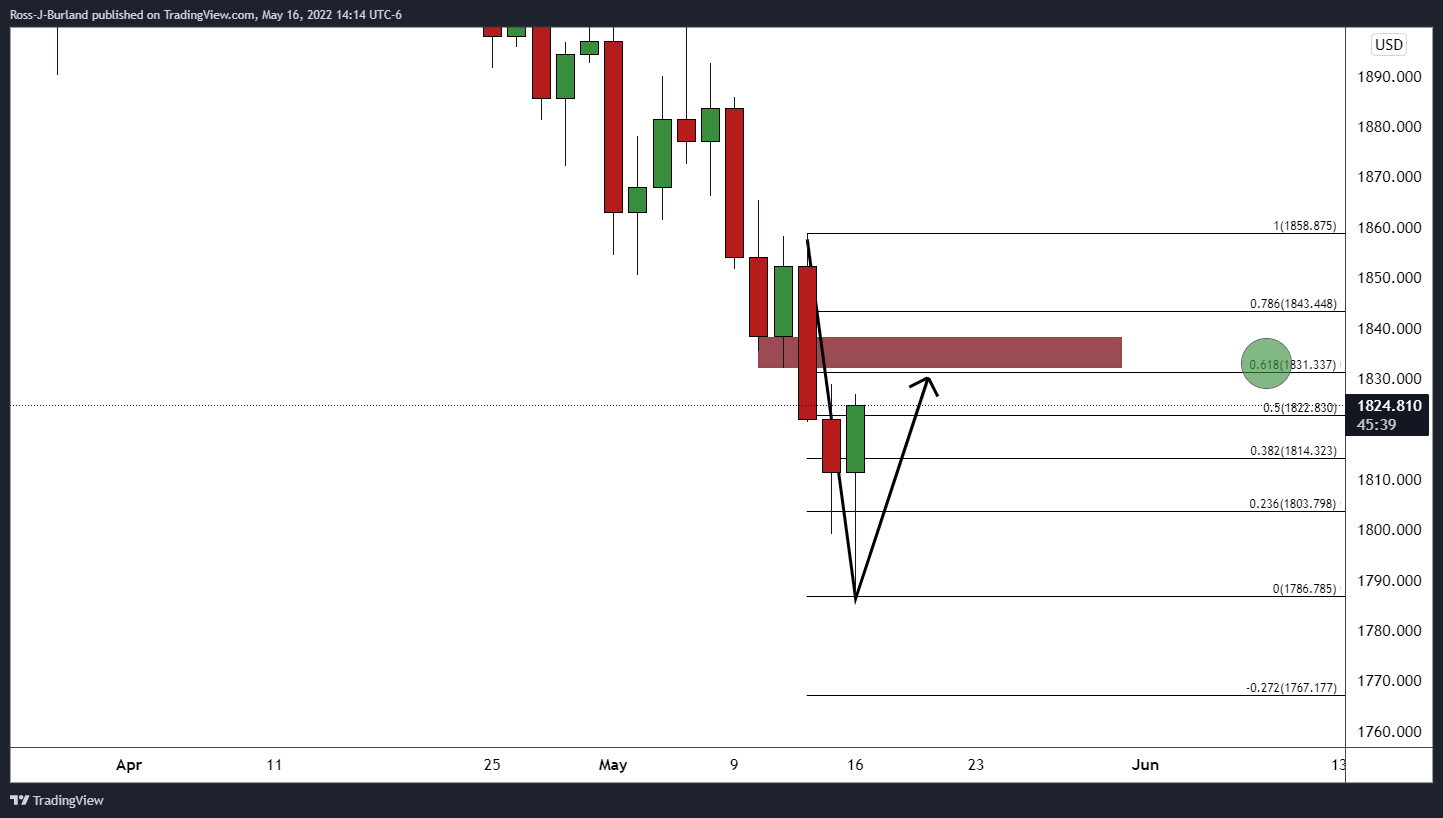
- Gold is correcting firmly on Monday with a softer US dollar as investors take profits.
- The bulls are aiming for a 61.8% golden ratio that aligns with prior support near $1,832.
At $1,825, the gold price is 0.8% higher, climbing from a low of $1,786.78 and reaching a high of $1,826.40. The gold price has been recovering in the face of a softer US dollar after closing out a week that saw its biggest weekly drop in close to a year. Risk assets are desperately seeking some stabilisation after seven consecutive weeks of losses across global shares and exacerbating market concerns over the combination of a global economic slowdown, higher inflation and monetary tightening.
However, the greenback has been consolidating after its recent strength and trading in the dollar may be muted partly as investors move to the sidelines while waiting for key events such as the US Retail Sales and the Federal Reserve Chair Jerome Powell both scheduled for Tuesday. ''With the Fed telegraphing their every move, Fedspeak this week will be increasingly important, particularly as gold positioning is continuously squeezed with bearish sentiment building,'' analysts at TD Securities explained.
Meanwhile, defensive dollar positions have seen Speculators’ net long USD index positions edging up to the highest levels since mid-February. "Haven demand for USDs combined with expectations for progressive Fed rate hikes this year suggests the USD has the potential to remain well supported for some time," analysts at Rabobank argued. Recent data has all but endorsed the prospect of more aggressive tightening by the Fed, and this week's Retail Sales, Industrial Production and housing figures should b are anticipated to show that the US economy remains in a good place.
"We look for retail sales to advance firmly in April (1.5%), continuing with the monthly gains registered so far this year,'' analysts at TD Securities said. ''Spending was likely aided by a strong rebound in auto purchases and an increase in control group sales. We also look for a 1%+ MoM gain in the eating/drinking segment (i.e. bars & restaurants) as consumers continue to transition away from goods spending.''
With regards to gold, the analysts say precious metals sentiment becoming increasingly bearish. ''Even with recent liquidations accounted for, positioning analytics still argue for the potential of additional pain for gold bugs. While position sizing has reverted to more normal levels, the number of traders long the yellow metal remains elevated, while the breadth of traders short has just started to rise from near-record lows.''
''Importantly, CTA trend followers have also joined into the liquidation party, and with prices now below the bull-market-defining uptrend as we expected, a significant liquidation event may now be unfolding as these funds target a large net short position.''
Gold technical analysis
As per the pre-open analysis, Gold, Chart of the Week: Bulls are moving in, but weekly levels are eyed, the bulls have moved in but they are staying in control, exceeding piercing the first level of 4-hour resistance and taking on the next cohort of potential offers:
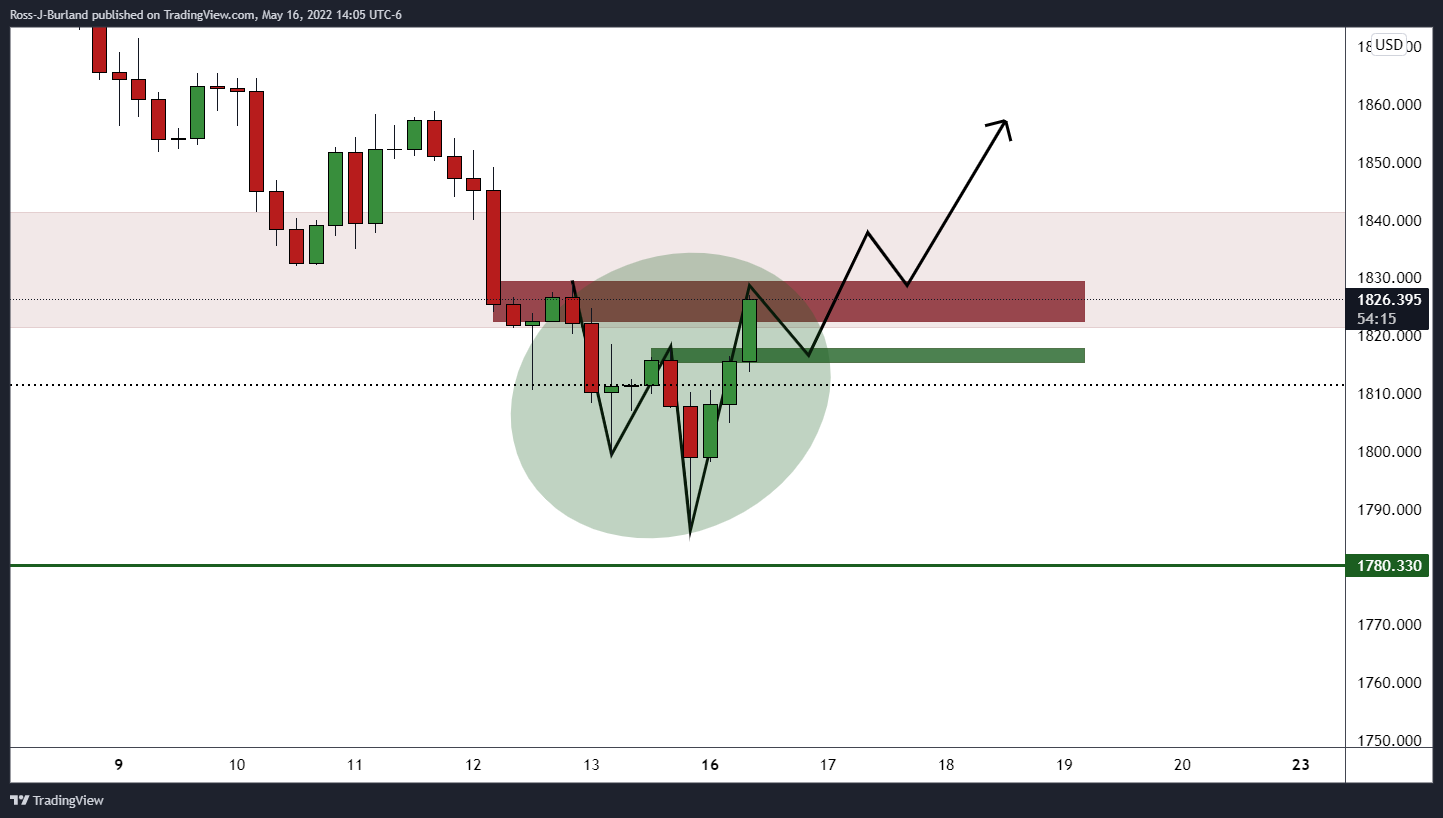
However, despite the move higher, the W-formation is a reversion pattern, so there could be a revisit to the neckline before a follow through to the upside for the sessions ahead if the support structure holds. In doing so, this will lead to a firm correction of the daily bearish impulse as follows:
The bulls are aiming for a 61.8% golden ratio that aligns with prior support near $1,832.
- NZD/USD bulls are taking control and pushing against a key area of resistance.
- A break of 0.6350 opens risk to a 61.8% ratio that meets the prior support near 0.6430.
At 0.6310, NZD/USD is up some 0.36% towards the close of North American markets after rallying from a low of 0.6228 and reaching a high of 0.6320 on the day. The greenback was lower on Monday after hitting a 20-year peak last week, despite weak economic data from China highlighting worries about the prospects for a global slowdown.
Nevertheless, risk markets remain vulnerable to the broader concerns over deteriorating global growth prospects. The data from China was highly disappointing that initially sent the antipodeans sharply lower. However, a plunge in the US Empire State manufacturing index raised anxiety that economic activity in the US may also be suffering from an abrupt loss in momentum as supply-chain disruption intensifies.
''The profile of the data suggests that supply issues related to the zero-COVID policy in China are the key factor,'' analysts at ANZ Bank argued.
''The Kiwi is higher this morning amid a broad softening of the US dollar. The move seems slightly odd compared to the prevailing mood of recent days, especially given renewed China/global growth concerns, which have been enough to cap bond yields. But commodity prices are up again overnight (led by grains and oil),'' analysts at ANZ bank explained.
''Newswire reports that a local forecaster is calling for three more 50bp OCR hikes have also seemingly helped the NZD along this morning,'' the analysts added. ''While the bounce does align with our medium-term forecasts, it does seem too early to call time on the recent bout of extreme volatility and risk aversion, and we think it pays to be cautious. Indeed, cross-asset correlations remain high, indicating that markets are being driven by risk sentiment, not their own fundamentals.''
NZD/USD technical analysis
The weekly bearish impulse is likely in need of a correction. This could correct as far as the prior support and beyond 0.64 the figure. The build-up of daily resistance is being broken which supports the bullish outlook:
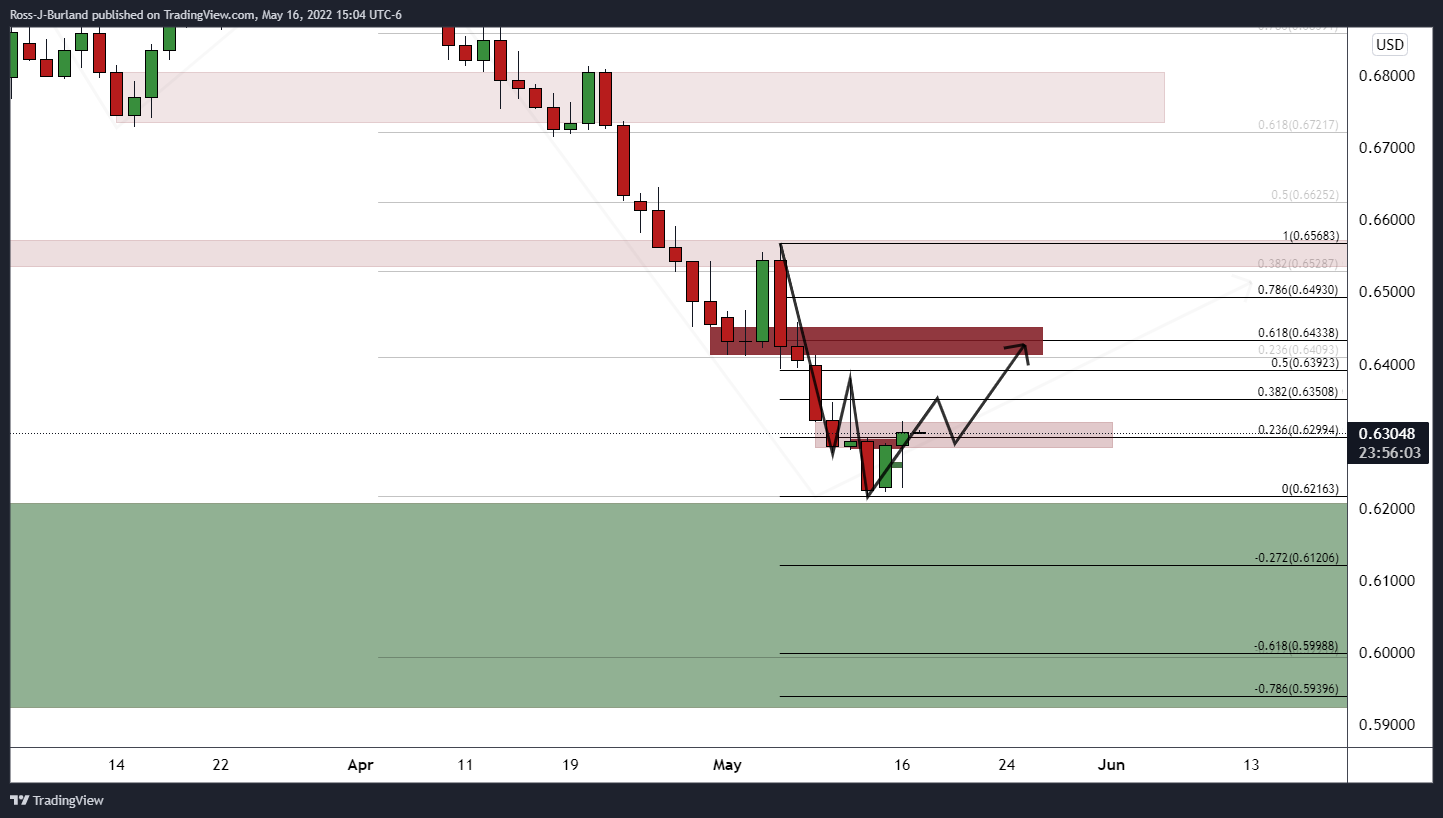
The price is trying to break through the resistance where eyes will be on the 38.2% ratio at 0.6350 that guards a 61.8% ratio where prior support near 0.6430 is eyed.
What you need to take care of on Tuesday, May 17:
The American dollar appreciated at the beginning of the week but ended the day with modest losses against most rivals as stocks markets changed curse. European indexes closed mixed, but Wall Street managed to post gains.
The EUR/USD pair ended the day at around 1.0430, with the bullish potential limited amid persistent tensions with Russia. Ministers from the Union were unable to agree on a Russian oil import embargo, with Hungary, the Czech Republic and Slovakia being the main opponents. Also, the European Commission reviewed its economic growth projections to the downside amid the war in Ukraine, while they now see inflation rising at a faster pace this year and holding above the European Central Bank target through 2023.
GBP/USD is changing hands at around 1.2310. Brexit-related headlines are once again in the spotlight after UK PM Boris Johnson's spokesman noted they want to make significant changes to the Northern Ireland protocol, although clarifying they believe that it is possible within the protocol framework.
Additionally, Bank of England Governor Andrew Bailey testified before the House of Commons Treasury Committee. He said he is not at all happy about the inflation outlook and that it is a bad situation to be in, but added that over 80% of the UK's inflation overshoot is due to energy and tradeable goods. BOE’s member Saunders noted that Brexit might worsen UK inflation.
AUD/USD trades around 0.6960, helped by gold, as the latter trades above $1,820 a troy ounce. The USD/CAD pair plunged to 1.2646 as crude oil prices soared, with WTI now trading at $111.30 a barrel.
Safe-haven currencies posted modest gains against the greenback.
This week, the UK, the EU and Canada will publish inflation data.
Top 3 Price Prediction Bitcoin, Ethereum, XRP: Cryptos to consolidate after weekend rally
Like this article? Help us with some feedback by answering this survey:
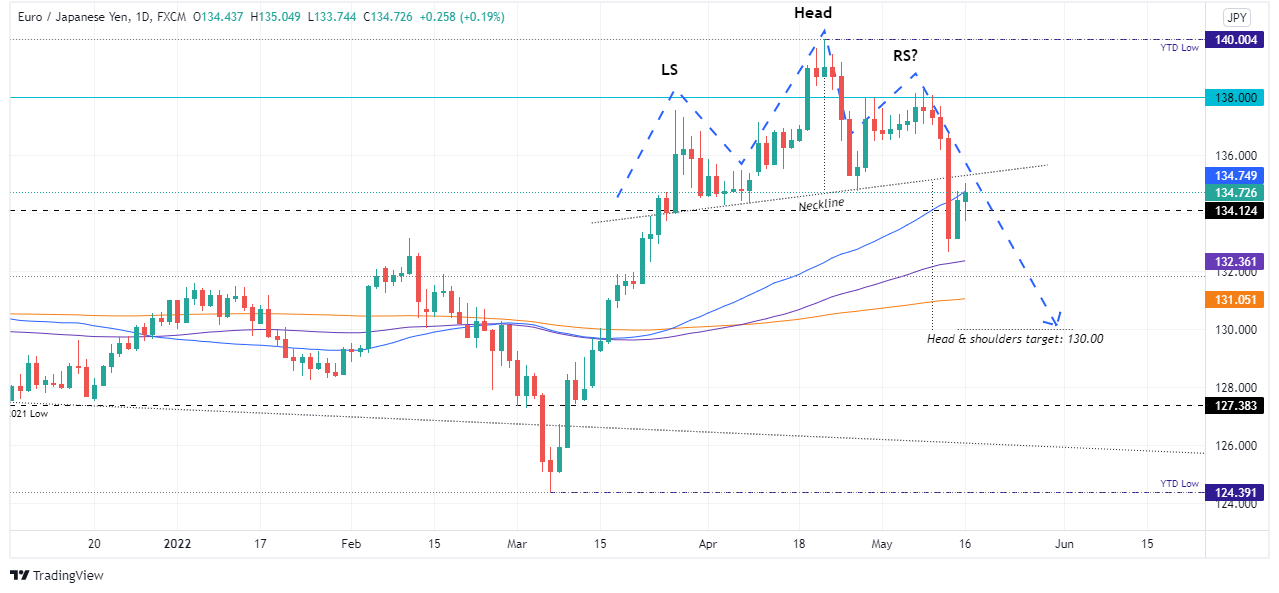
- The euro marches decisively towards the neckline of the head-and-shoulders, though it is facing solid resistance around 134.77.
- A positive market mood in the FX space decreased appetite for safe-haven peers.
- EUR/JPY Price Forecast: The head-and-shoulders pattern remains intact, as the exchange rate remains below 135.25.
The shared currency stays defensive vs. the Japanese yen amidst a raft of negative market moods, courtesy of market players’ worries about the Fed tightening monetary policy aggressively, which threatens to slow down the economic recovery in the US. Alongside the aforementioned, China’s coronavirus crisis and the Ukraine war weighed on sentiment, increasing the appetite for safe-haven peers. At 134.72, the EUR/JPY recovered some ground but remained downward pressured, below the head-and-shoulders neckline, a zone that could see some selling pressure, re-entering the market.
Market sentiment in the New York session has improved, as shown by US equities trading in the green. In the FX space, the safe-haven currencies remain downward pressured, a relief for the battered euro, underpinned recently by ECB policymakers expressing that the central bank would hike rates and get to 0% around the summer.
The EUR/JPY opened around the 134.50 area during the overnight session and dipped below the daily pivot point around 133.70s, recording a daily low. Nevertheless, the cross-currency pair bounced off those levels and settled between the central daily pivot and the R1, around 134.70s.
EUR/JPY Price Forecast: Technical outlook
The EUR/JPY remains downward pressured and is testing the 50-day moving average (DMA) at 134.79. It’s worth noting that around the 135.00-25 area passes the neckline of a head-and-shoulders pattern targeting 130.00. However, the head-and-shoulders pattern remains intact unless EUR/JPY bulls reclaim the abovementioned area.
If the EUR/JPY is about to test the abovementioned level, the first resistance would be April’s 27 daily low at 134.77. Break above would expose 135.00, followed by the necklines, which pass nearby 135.25.
On the flip side, the EUR/JPY’s first support would be May 12 daily low at 132.65, followed by the 100-DMA at 132.36 and the 200-DMA at 131.05.
Key Technical Levels
- EUR/USD bulls take control and target the M-formation's neckline.
- A 50% mean reversion is on the cards for the sessions ahead.
The US dollar is down slightly on Monday after hitting a 20-year peak last week, which is giving the euro bulls some relief and the price moves higher in a correction of the latest bearish impulse. The following illustrates the price action and market structure from a daily and H4 perspective as the bulls take over control and target key levels to the upside.
EUR/USD daily chart
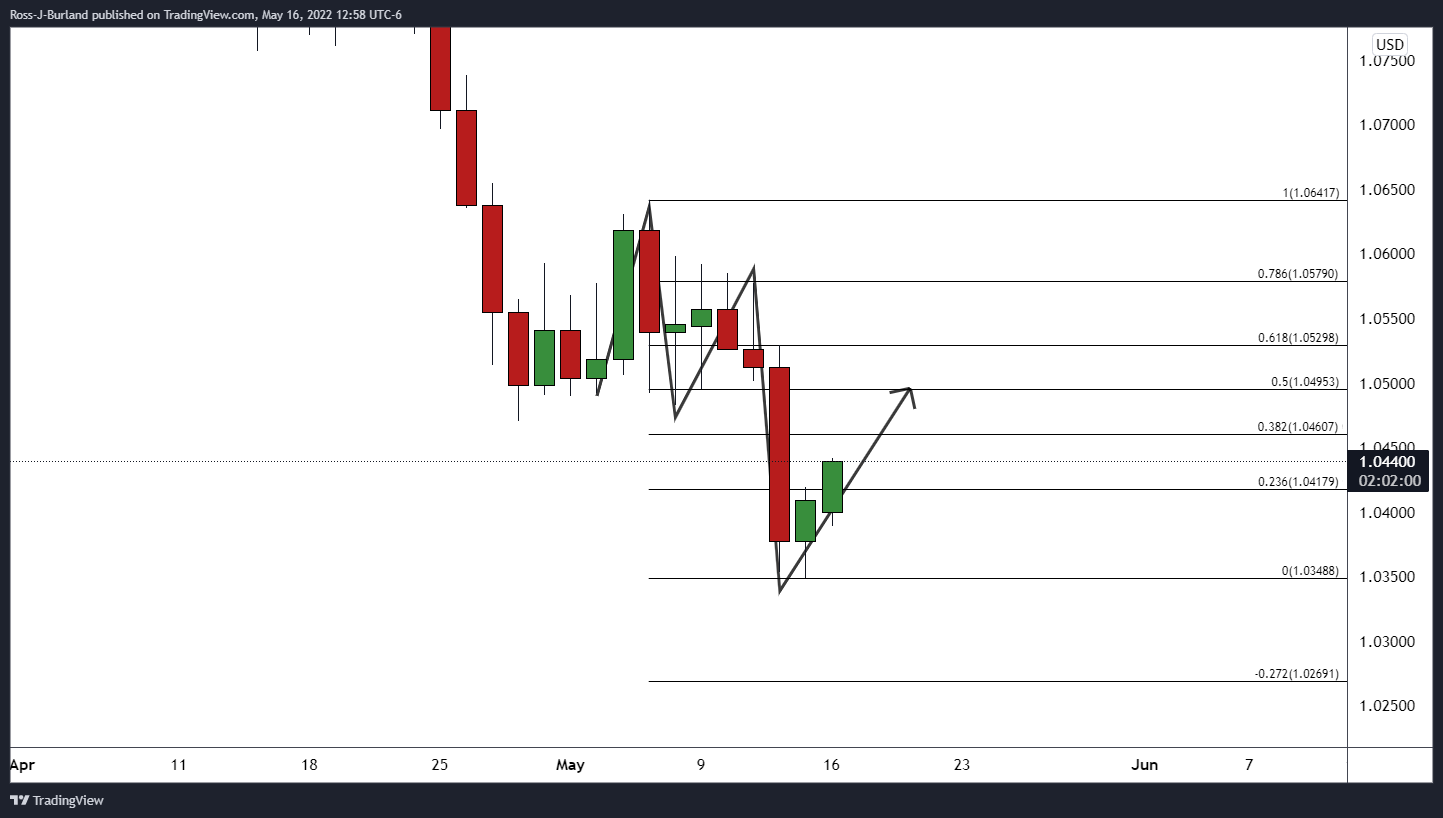
The price is recovering on the daily chart as illustrated above from the cycle lows and the bulls are moving in on the 38.2% Fibonacci level through 1.0460. A break of there will open risk to the 50% mean reversion target near 1.05 the figure and then the golden ratio, the 61.8% Fibo near 1.0530. The M-formation is a bullish reversion pattern and the neckline meets the targetted area as an additional confluence.
EUR/USD H4 chart

On the 4-hour time frame, the price is ascending in a bullish channel and has been supported by last week's close and prior resistance near 1.0390 and 1.0413.
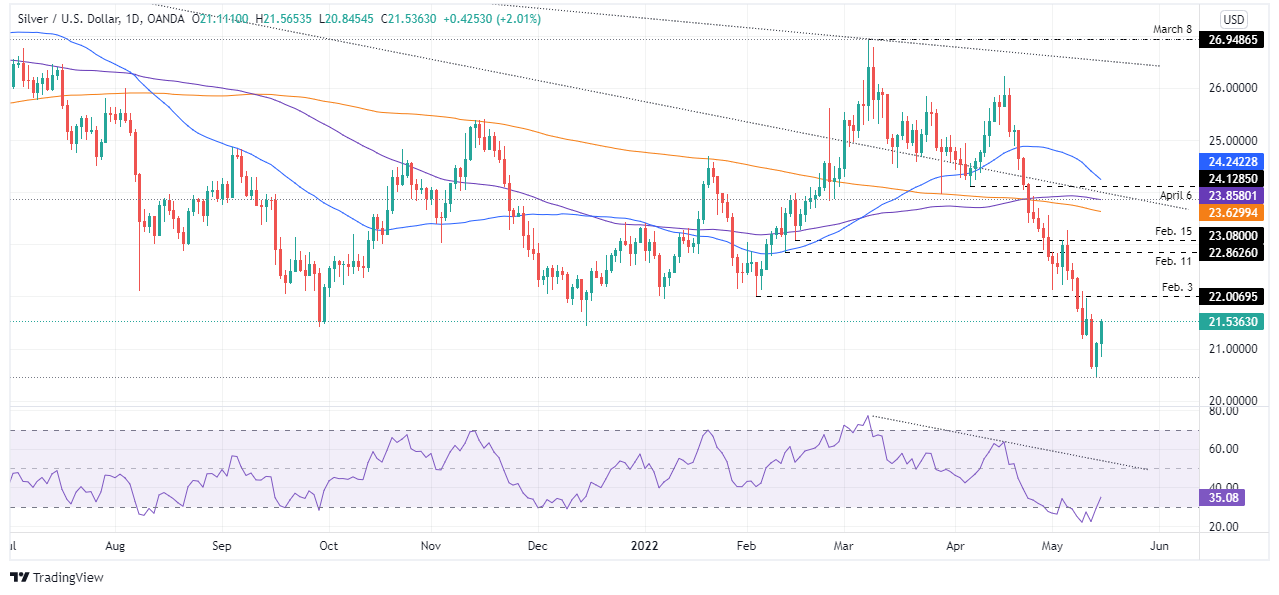
- The white metal is rallying more than 2% in the day amidst falling US Treasury yields.
- Sentiment has improved in the session, a headwind for the greenback.
- Silver Price Forecast (XAG/USD): Bears take a breather and gather around $22.00, expecting to defend that resistance level.
Silver spot (XAG/USD) held its ground for the last two trading days and advances firmly in the North American session, almost 2% up, and is closing at around the $21.50 mark, boosted by falling US Treasury yields. At the time of writing, XAG/USD is surging sharply and is trading at $21.53.
Silver is soaring as US Treasury yields fall; Fed Chair Powell to speak on Tuesday
Meanwhile, US Treasury yields remain pressured, led by the 10-year benchmark note sitting at 2.879%, dropping four-and-half basis points, a headwind for the greenback. The US Dollar Index, a gauge of the buck’s value vs. a basket of peers, declines sharply from around daily highs and is at 104.367, down 0.19%.
Late in the New York session, market sentiment shifted positive, despite European stocks finishing with losses. Despite investors’ growing concerns that an aggressive Federal Reserve could cause a recession, US stocks are recording gains during the day. The aforementioned, alongside China’s struggling with Covid-19 lockdowns, threatens to derail the global economic recovery.
Earlier in the New York session, the New York Fed President John Williams expressed that the number one issue for the Fed is inflation, and it is running far too high and stubbornly persistent. Williams stated that 50-bps rate hikes make sense at upcoming meetings
The US economic docket would feature additional Fed speaking led by Fed Chair Jerome Powell on Tuesday. Regarding macroeconomic data, April’s Retail Sales, Industrial Production, Building Permits, and Initial Jobless Claims would shed some light regarding the actual economic status of the United States.
Silver Price Forecast (XAG/USD): Technical outlook
XAG/USD remains downward biased, despite rallying in the last couple of days. The daily moving averages (DMAs) are still above the spot price, meaning that bears are in control unless silver bulls conquer February’s 3 pivot low at around $22.00, which would mean that the trend would shift from bearish to neutral-bearish.
However, the jump from the oversold territory of the Relative Strength Index (RSI) at 35.04 could add some support to the bounce at the YTD lows around $20.45, but unless it breaks the RSI’s trendline drawn at around the 50-midline, XAG/USD remains downward pressured.
That said, XAG/USD’s first support would be $21.00. Break below would expose the YTD low at $20.45. Once cleared, the next support would be July 17, 2020, at a daily low at $18.93.
- A busy schedule ahead and Brexit risks leave the pound in focus.
- Bulls eye the M-formation and the 1.24 figure that guards the 50% mean reversion mark at 1.2450.
At 1.2280, GBP/USD is 0.17% higher in midday New York trade, pulling away from the consolidation between 1.2150 and 1.2250 after travelling from a low of 1.2216 to a high of 1.2296 so far on the day.
The US dollar and global growth have been the main focus at the start of the week with China releasing downbeat April activity data. The disappointments fuelled a bid in the greenback after the Chinese yuan came under pressure and weighed on risk-related currencies, including the pound. However, the greenback has been mixed vs. its G10 rivals in the main.
The US dollar index (DXY) was last down 0.08%, after having briefly crossed the 105 level on Friday, a 20-year peak. Weekly positioning data showed investors built their long dollar bets. Speculators’ net long USD index positions edged up to the highest levels since mid-February. "Haven demand for USDs combined with expectations for progressive Fed rate hikes this year suggests the USD has the potential to remain well supported for some time," analysts at Rabobank explained.
Meanwhile, there will be more key data events for the week that will include April readings for US Retail Sales and Industrial Production on Tuesday, Home Construction on Wednesday and Existing Home Sales on Thursday.
"We look for Retail Sales to advance firmly in April (1.5%), continuing with the monthly gains registered so far this year," analysts at TD Securities argued. "Spending was likely aided by a strong rebound in auto purchases and an increase in control group sales. We also look for a 1%+ MoM gain in the eating/drinking segment (i.e. bars & restaurants) as consumers continue to transition away from goods spending."
Fed speakers are also a theme for this week and markets are looking for more reassurance that the Fed will move cautiously in its fight against inflation rather than act with large rate increases of 75 basis points.
Domestically, the focus will be on Headline Inflation readings and this is set to surge on the increase in the energy price cap and VAT changes in April. "We look for the headline rate to soar to 9.2% YoY and core inflation to come in at 6.4%. The labour market likely remained tight, with the unemployment rate staying put at 3.8% and ex-bonus and headline wage growth coming in at 4.1% and 5.3% 3m/y respectively," analysts at TDS said.
As for positioning, net short GBP positions increased for a tenth consecutive week as concerns about the cost-of-living crisis rise in the UK. The BoE has hiked rates to 1.00% and is signalling that more is to come. However, despite the inflationary risks, MPC members are increasingly concerned about the UK growth outlook. This suggests the potential for a relatively short window for interest rate hikes. The Bank of England's next meeting is scheduled for June 16, when another rate increase of 25 basis points is expected.
Brexit risks
Brexit-related developments may end up generating more downside pressure on the British currency. Boris Johnson is flying to Belfast to try to sort out the consequences of a Brexit deal he signed. The UK is saying it will have to take unilateral action to override part of the Northern Ireland Brexit protocol unless the EU shows the “requisite flexibility”. The EU has said it believes a deal can be done but only through negotiation, so all ears are to the ground as to the progress, or there-lack-of, for the days ahead.
GBP/USD technical analysis
The bears have been in control since breaking 1.3670 back in November 2021. The price is making its way into meeting a prior low of 1.2251 which guards a run to mitigate the imbalance of price between there and the 1.2075 May 18 2020 low:
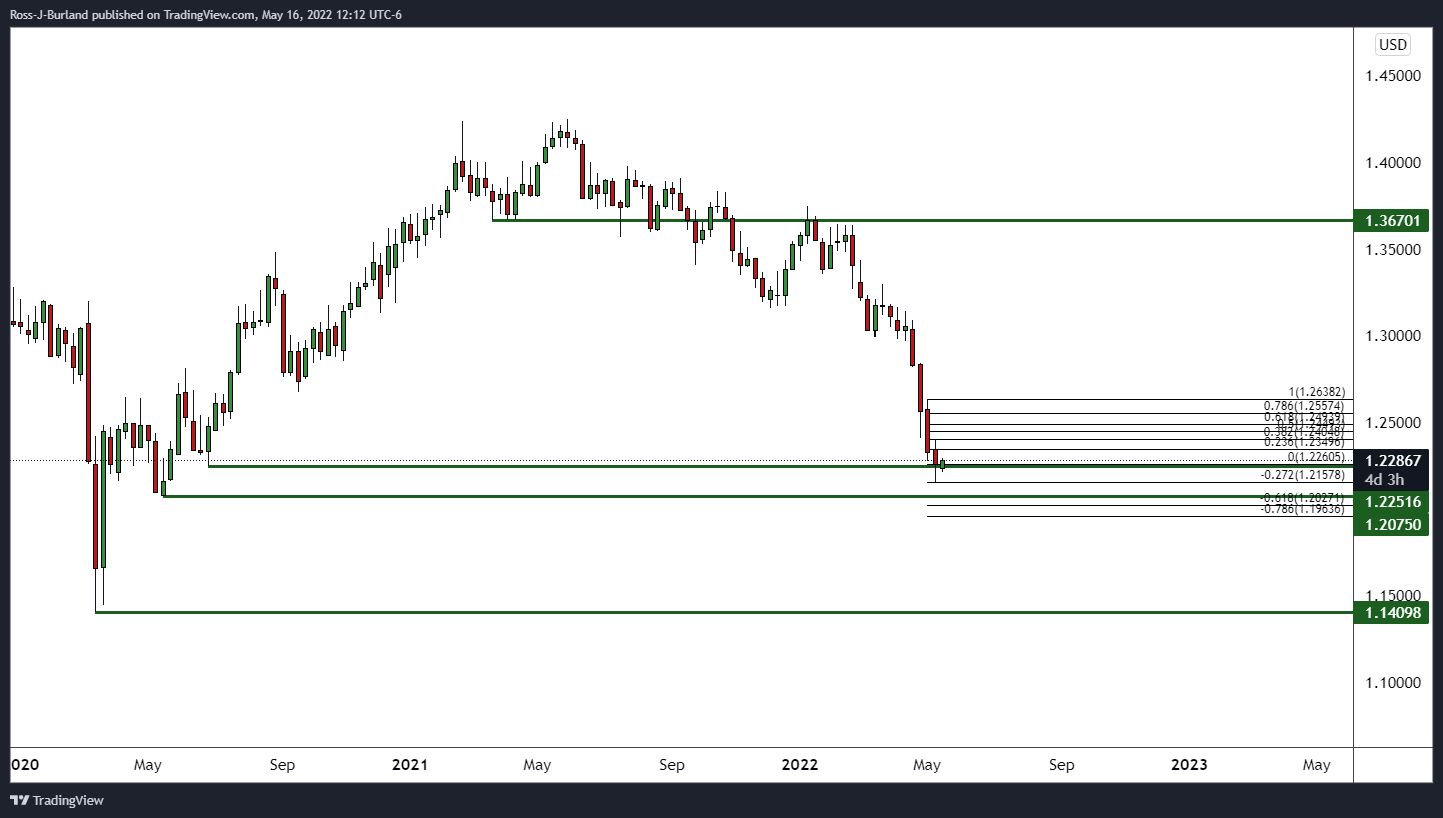
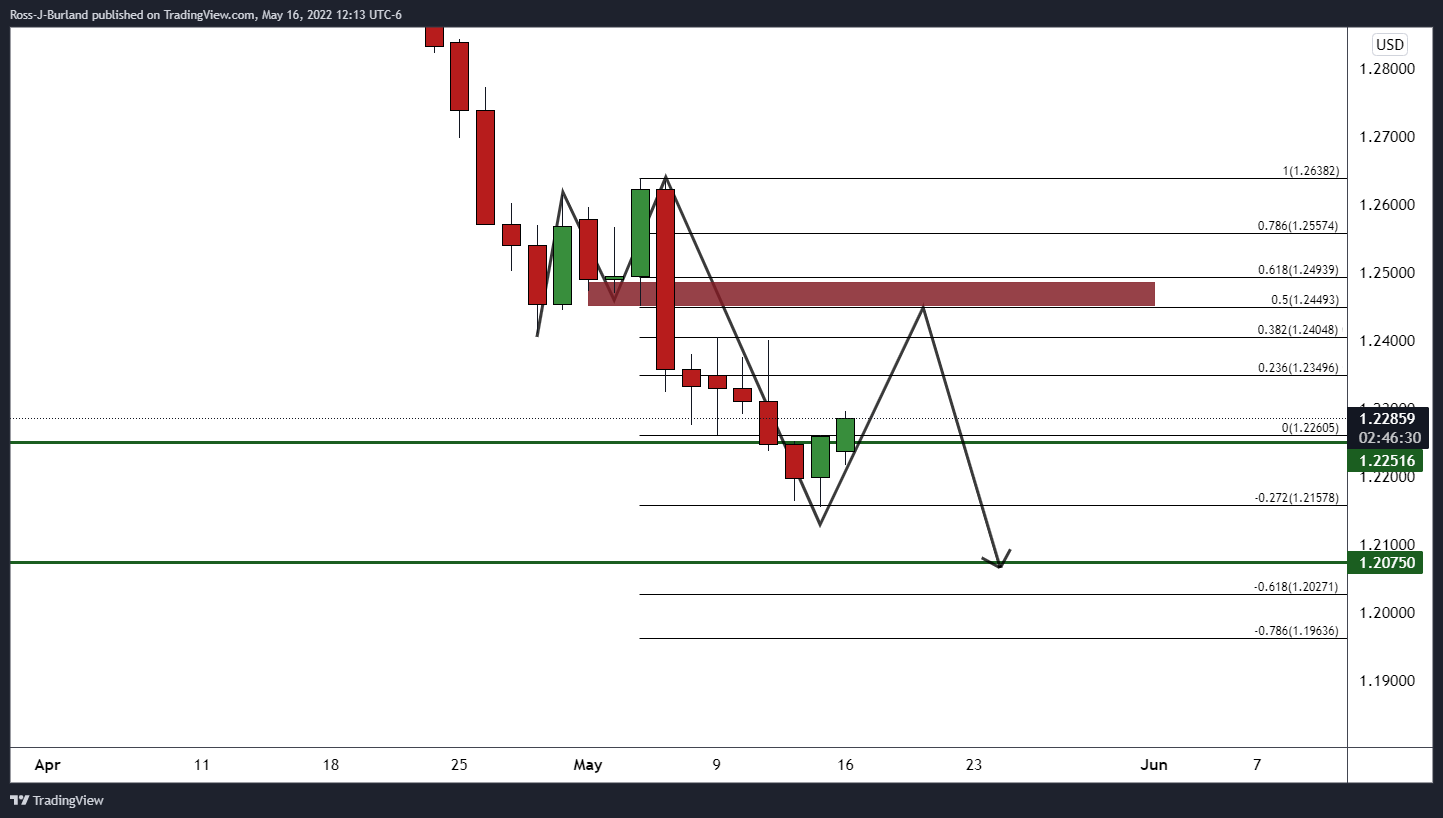
From a daily perspective, the price is reverting in the M-formation and the 1.24 figure could come under pressure that guards the 50% mean reversion mark at 1.2450 that meets the neckline of the formation.
- Bad China’s economic data paints a gloomy environment for Australia’s largest trading partner, a headwind for the AUD.
- A risk-off mood boosts the prospects of the US dollar.
- AUD/USD Price Forecast: The major could be subject to a mean-reversion move towards 0.7029 before resuming its downtrend.
The Australian dollar records from decent gains, despite weaker than expected Chinese economic data, ahead of the release of the Reserve Bank of Australia’s (RBA) last meeting minutes. In the North American session, the AUD/USD is trading at 0.6945 at the time of writing.
The market sentiment keeps weighing on riskier assets, as witnessed by European and US equities trading mixed. Also, a reflection of China’s Covid-19 zero-tolerance policy is China’s worst than expected economic data, with Industrial Production contracting 2.9% y/y and Retail Sales plummeting 11.1% y/y, paints a cloudy economic outlook for the second-largest economy in the world. That its a headwind for the Aussie dollar, which has its largest trading partner in China.
ING: RBA minutes to hint the size and timing of monetary policy
Regarding the RBA minutes, ING analysts wrote in a note that “the minutes from the Reserve Bank of Australia’s May meeting will be scanned closely for hints about the timing and size of additional monetary tightening. On Wednesday, the long-awaited wage data for 1Q will be released. On Thursday, the employment figures for April will be published, with a chance the jobless rate will fall below 4.0%.”
They added that “some recovery in global equities is surely needed at this point for AUD/USD to climb back above 0.7000, while another risk-off wave could send the pair to the 0.6600-0.6700 area in the near-term.”
Before Wall Street opened, the New York Fed President John Williams said that the number one issue to resolve is inflation, and it is running far too high and stubbornly persistent. He added that 50-bps rate hikes make sense at upcoming meetings.
The US docket would feature additional Fed speaking in the week ahead, led by Chief Jerome Powell on Tuesday. Data-wise, April’s Retail Sales, Industrial Production, Building Permits, and Initial Jobless Claims would shed some light regarding the actual economic status of the United States.
On the Australian side, the AUD/USD traders would take cues from the RBA’s Minutes, alongside Employment data and the Australian Federal Elections.
AUD/USD Price Forecast: Technical outlook
The AUD/USD remains defensive, below the daily moving averages (DMAs). A downslope trendline drawn from April 2022’s highs could give AUD/USD bears a line in the sand to lean on, but the speed of the drop from 0.7600 to 0.6820s suggests that a mean reversion move lies ahead, having May’s 2 daily low at around 0.7029 as a target, before extending its losses.
If that scenario plays out, the AUD/USD first resistance would be 0.7000, followed by May 2 daily low at 0.7029. A break above would expose the downslope trendline around the 0.7100 area.
Failure at the abovementioned would exert downward pressure on the AUD/USD. The first support would be 0.6900. A breach of the latter would expose the YTD low at 0.6828, followed by the 0.6800 mark.
Analysts at Rabobank see the EUR/SEK pair moving back to 10.30 on a three-month view. They warn the forecast is dependent on developments around Russia and the response to Sweden's membership bid to join NATO.
Key Quotes:
“The 25 bps rate hike from the Riksbank at the end of last month had little lasting impact on the value of the SEK vs. the EUR. Having failed to hold below the 200 day sma, EUR/SEK bounced higher into early May, with the SEK only claiming back some ground in recent sessions on the back of stronger than expected Swedish CPI inflation data.”
“Given the risk that the window of opportunity for the ECB to hike rates may prove to be narrow due to recessionary fears in the Eurozone, we see scope for EUR/SEK to adjust moderately lower on a 3 to 6 month below. This view, however, is dependent on whether investor confidence is impacted by developments in the relationship between Russia and Sweden given the latter’s decision to move away from its neutral position.”
“The market will be looking for more clarity from the Riksbank about the outlook for its balance sheet.”
“The Riksbank concluded its bond buying programme last year but is currently still reinvesting proceeds. The next policy meeting is scheduled for June 30. We see EUR/SEK moving back to 10.30 on a 3 month view.”
- The Mexican peso rises for the fifth consecutive day on Monday versus the US dollar.
- USD/MXN’s momentum favors the downside as it approaches the 20.00 area.
- The 20.25 area turns now to resistance.
The USD/MXN continued its decline on Monday and dropped to 20.04, reaching the lowest level since April 5. Bearish signs increased after the pair decreased below the 20-day Simple Moving Average and as Momentum turned further to the downside, under 100. Another negative sign for the pair is the decline under a short-term bearish trendline.
If the decline continues, USD/MXN will likely challenge the 20.00 area. The May low at 19.99 is a strong support and a break lower could clear the way to 19.90, the next support.
Any rebound, while under 20.25, should be seen as corrective. While a recovery above 20.30 would negate the current negative bias. Above the critical resistance await at 20.45. A daily close above would be a positive development for the greenback, exposing 20.70.
USD/MXN daily chart
-637883132745916994.png)
- Gold bull’s lifted the yellow-metal shy of the YTD low at around $1780.
- A wobble sentiment boosts gold prices in tandem with the greenback.
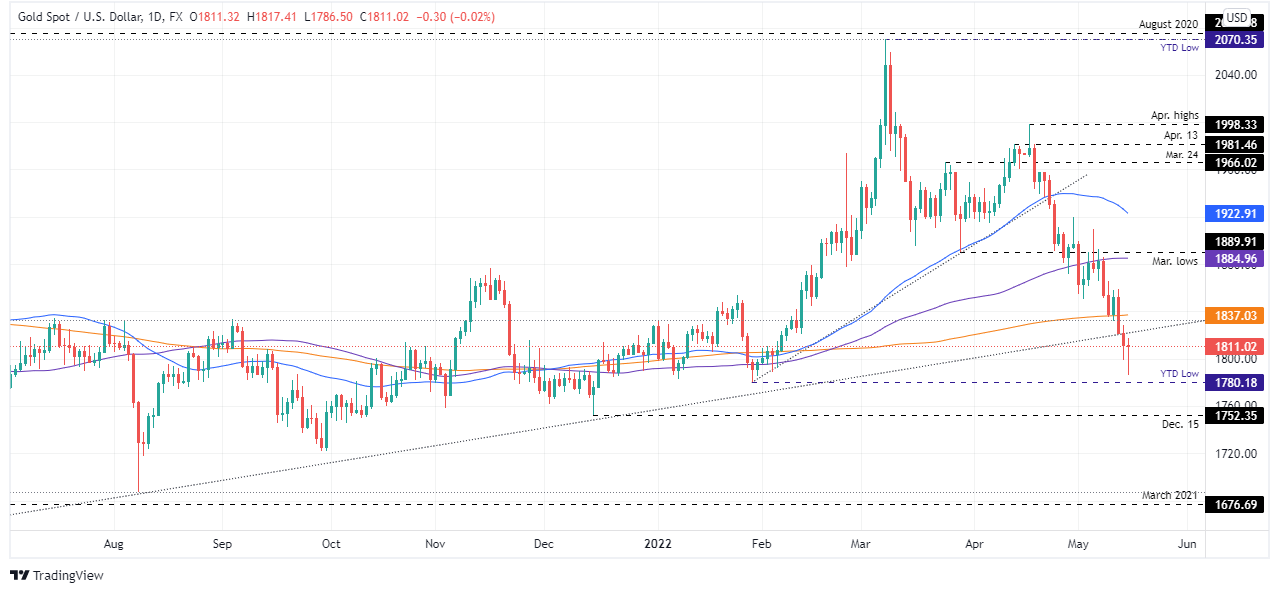
- Gold Price Forecast (XAU/USD): Will remain bearish, below a two-year-old upslope trendline, unless bulls reclaim the previously-mentioned.
Gold spot (XAU/USD) recovers some ground after slipìng below the $1800 mark on Friday, on higher US Treasury yields, which during the session are sliding, thus lifting the prospects of the non-yielding metal. XAU/USD is trading almost flat, around $1811.02 a troy ounce at the time of writing.
Sentiment-wise, the rhetoric of the last couple of weeks remains, with European and US equity bourses split between gainers and losers. The Federal Reserve’s aggressive tightening expectations, China’s Covid-19 lockdowns, and high inflationary pressures spurred by the ongoing war in Ukraine remain on investors’ radar.
Meanwhile, the yellow metal has benefited from lower US Treasury yields, with the 10-year benchmark note down five basis points, sitting at 2.88%, a headwind for the greenback. The US Dollar Index, a measurement of the buck’s value, is gaining 1.26%, sitting at 104.517, but without weighing on gold.
In the mid-North American session, money market futures have priced in a 100% chance of a 50-bps increase by the Fed in the June meeting. Earlier in the day, the New York Fed President John Williams said that the number one issue is inflation, and it is running far too high and stubbornly persistent. Williams stated that 50-bps rate hikes make sense at upcoming meetings and added to the rhetoric of central bank policymakers that China’s struggling with the coronavirus and Ukraine’s war are the significant drivers of market volatility.
Elsewhere, China continues struggling with Covid-19 as its Industrial Production shrank by 2.9, lower than the 0.4 growth expected, its lowest reading since March 2020. Despite the previously-mentioned, a ray of hope shows in the window, as Shanghais is about to gradually begin reopening businesess, including shopping malls and the manufacturing hub. Contrarily Beijing will extend work from home guidance in several districts.
In the week ahead, the US docket would feature Fed Chief Jerome Powell, St. Louis President James Bullard, and Chicago’s Fed President Charles Evans. Data-wise, April’s Retail Sales, Industrial Production, Building Permits, and Initial Jobless Claims would shed some light regarding the actual economic status of the United States.
Gold Price Forecast (XAU/USD): Technical outlook
Interestingly, the Gold Price jumped near the YTD low at around $1786 and is forming a “gravestone doji,” which is perceived as a signal of “indecision.” Also, it’s worth noting that an almost-two-year-old upslope trendline, previous support, has been broken. Unless gold bulls reclaim the aforementioned, XAU/USD is vulnerable to further downward pressure.
If XAU/USD’s bulls reclaim the upslope trendline, they will find resistance levels around the 200-DMA at $1837, followed by May 3 cycle low at $1850, and then the $1890 barrier.
On the flip side, XAU/USD’s first support would be $1800. Break below would expose May 16 daily low at $1786, followed by the YTD low at $1780 and then December’s 15 cycle low at $1752.35.
- NZD/USD flat on Monday, holds onto Friday’s gains.
- US stocks slide, stay away from recent lows.
- US data: unexpected contraction in the Empire Manufacturing.
The NZD/USD climbed to 0.6295 during the American session reaching the highest level since Thursday. The pair is rising as dollar’s strength takes a pause and amid lower US yields.
The Dow Jones is falling 0.27% but still holds to most of Friday’s rally. Volatility eased and commodity prices are rising at the beginning of the week. The US Dollar Index is flat for the day hovering around 104.50. The context offers support to the NZD/USD, however is not enough for pushing it above 0.6300.
Economic data released on Monday showed an unexpected decline in the US Empire Manufacturing Index. The numbers weigh modestly on the US Dollar. The key economic report of the week, the April’s Retail Sales is due on Tuesday.
Downtrend intact, consolidating in the very short-term
Last week, the NZD/USD bottomed at 0.6205, the lowest level in almost two years and then started a recovery that weakened near 0.6300. In the short-term, the pair is seen consolidating in a range between 0.6260 and 0.6295; and below 0.6260/0.6225 range.
The bearish trend remains intact. To open the doors to further losses the dollar needs to break under 0.6200. On the upside, a confirmed recovery above 0.6300 should point to more gains.
Technical levels
BoE Governor Andrew Bailey on Monday said that food prices are a major worry for the UK and developing world, reported Reuters.
Speaking alongside Bailey at a House of Commons Treasury Committee, BoE's Michael Saunders said that inflation would still be well above the bank's target this year even if the BoE had tightened policy sooner, a sentiment with which BoE Deputy Governor Ramsden agreed.
Bailey earlier said that he is not at all happy about the inflation outlook and that it is a bad situation to be in.
- EUR/USD has fallen back to near 1.0400 after comments from ECB’s Villeroy gave it a boost earlier in the day.
- Risks remain tilted to the downside amid Fed/ECB monetary policy divergence, as well as a diverging Eurozone/US economic outlook.
The euro got a short-lived boost from comments from the head of the French central bank head Francois Villeroy de Galhau during early European trade, with Villeroy noting the bank will be carefully monitoring developments in the FX rate, which has been a significant driver of imported inflation. A euro that is too weak would go against the ECB’s objective of price stability, Villeroy added, in comments that suggest the recent euro downside is increasing concern at the ECB.
But a broadly downbeat tone to risk appetite and weakness in the yuan in wake of the latest downbeat Chinese Industrial Production and Retail Sales data for April which kept global growth concerns in focus have capped any rally. EUR/USD nearly hit 1.0440 but has since fallen back to around 1.0410, where it is back to trading flat on the day as FX markets turn their attention to upcoming risk events later in the week.
US Retail Sales data will be released on Tuesday prior to the US open and then Fed Chair Jerome Powell will be speaking later on in the day. He is expected to reiterate his recently espoused stance, and the stance also being unanimously espoused by other Fed policymakers including NY Fed President John Williams on Monday, that inflation is unacceptably high and, as a result, interest rates need to be lifted “expeditiously” towards neutral.
Even as the ECB turns more hawkish (Villeroy said June’s meeting would be “decisive”, teeing up hikes for July), traders remain reluctant to buy into EUR/USD rallies with the Fed still substantially more hawkish by comparison. Divergence in economic outlook between the Eurozone and US is another factor weighing on the pair’s long-term prospects, with the impact of the yet to be agreed upon EU ban on Russian oil imports on the bloc’s economy still not known. Many strategists are still calling for EUR/USD to hit parity in the weeks/months ahead.
Bank of England Governor Andrew Bailey said in a testimony before the House of Commons Treasury Committee said he is not at all happy about the inflation outlook and that it is a bad situation to be in, reported Reuters. However, Bailey added, over 80% of the UK's inflation overshoot is due to energy and tradeable goods.
It is accepted practice to accommodate supply shocks when they are transient and focus on second-round effects, Bailey added, adding that he does not reasonably think that they could have done anything differently on monetary policy. Bailey highlighted the weakness in the latest Chinese activity data when discussing shocks to the global economy.
It is not out of place to describe the impact on demand patterns in the UK as "transient", unlike in the US. Bailey noted that the scale and persistence of the fall in the UK labour force is very unusual.
- EUR/USD adds to Friday’s gains beyond 1.0400.
- Bulls could push the pair to the 1.0640 area.
EUR/USD’s rebound gathers further traction north of the 1.0400 mark on Monday.
Considering the pair’s ongoing price action and oversold condition (as per the daily RSI), it seems to be extra room for the continuation of the rebound in the very near term at least. Against that, the next hurdle emerges at the weekly high at 1.0641 (May 5). In light of the underlying bearish view of the pair, further upside should be deemed as selling opportunities.
Below the 3-month line around 1.0900, the pair is expected to remain under pressure and vulnerable to extra losses.
EUR/USD daily chart
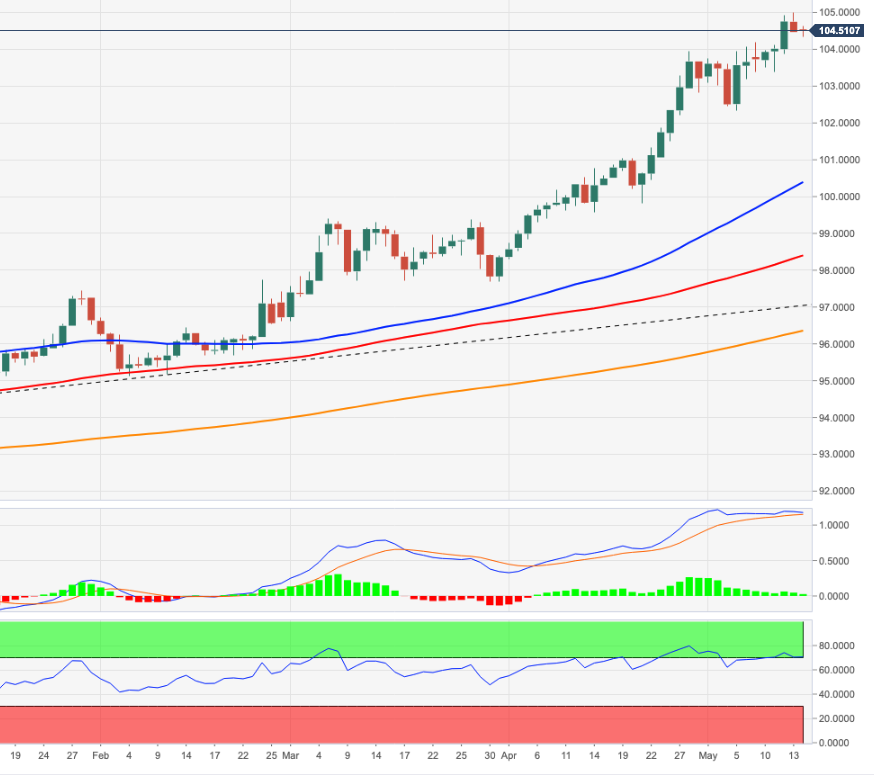
- DXY comes under further selling pressure and revisits 104.30.
- Next on the downside comes the post-FOMC low around 102.30.
DXY extends the corrective decline, as the dollar exits the overbought territory at the beginning of the week.
Against that, further retracements remain well on the cards and initially target the minor support at 103.37 (low May 11). The breach of this area could force the index to drop further and visit 102.35 (May 5 low), where decent contention is expected to emerge.
The current bullish stance in the index remains supported by the 8-month line around 97.15, while the longer-term outlook for the dollar is seen constructive while above the 200-day SMA at 96.34.
DXY daily chart
- Oil is supported at the start of the week near multi-week highs with the EU’s Russia oil embargo expected soon.
- WTI has been trading in the $110 region, but unable to breakout towards late-March highs in the $116s.
- Worries about a weakening Chinese economy in wake of soft economic data seem to be holding things back for now.
Oil prices have seen a choppy start to the week though remain reasonably well supported. Front-month WTI futures prices hit their highest levels since late March in the upper $111s, but have since eased back to around the $110 mark, where they trade broadly flat on the day. The Foreign Ministers from both Germany and Austria were on the wires on Monday saying they expect the EU to agree on a deal on the proposed embargo of Russian oil imports later this week, despite ongoing Hungarian resistance.
This seems to have negated the negative impact on prices from weaker than expected April Chinese Industrial Production and Retail Sales data released over the weekend. The data highlights a drastic, ongoing slowdown in the economy there as a result of strict lockdowns to contain Covid-19, which analysts said now impact 46 cities and as much as 40% of China’s GDP.
The lockdowns have had a chilling impact on oil demand in China. Data released by China’s National Bureau of Statistics on Monday alongside the aforementioned Industrial Production and Retail Sales figures showed that refineries in China processed crude oil at the slowest rate in two years in April. So-called refinery “throughput” fell to 12.61M barrels per day (BPD) from 13.8M BPD in March and 14.09M BPD in April 2021.
So while crude oil prices remain well supported on Monday, the focus on economic/oil demand weakness in China has likely prevented WTI from mustering a bullish breakout. However, local press in China is reporting that the situation in Shanghai is improving (though not yet in Beijing). If this narrative gets further traction this week alongside an agreed EU ban on Russian oil, a push towards late March highs in the $116s is on the cards.
- USD/CHF regained positive traction on Monday and shot to a fresh two-year high.
- A softer risk tone underpinned the safe-haven CHF and capped amid weaker USD.
- Sliding US bond yields, disappointing US macro data exerted pressure on the buck.
The USD/CHF pair retreated a few pips from a two-year peak touched during the early North American session and was last seen trading around the 1.0050 area, still up nearly 0.20% for the day.
Following Friday's brief pause, the USD/CHF pair attracted fresh buying on the first day of a new week and is now looking to build on its upward trajectory witnessed over the past one-and-half months or so. That said, a combination of factors held back bulls from placing aggressive bets and kept a lid on any meaningful upside for spot prices.
Investors remain worried that a more aggressive move by major central banks to constrain inflation could hit global economic growth amid the war in Ukraine and China's zero-COVID-19 policy. The concerns were further fueled by weaker Chinese macro data, which weighed on investors' sentiment and extended some support to the safe-haven Swiss franc.
Conversely, the US dollar was pressured by a softer tone around the US Treasury bond yields. This was seen as another factor that acted as a headwind for the USD/CHF pair. The USD remained on the defensive following the disappointing release of the Empire State Manufacturing Index, which indicated worsening conditions and unexpectedly plunged to -11.6 in May.
That said, expectations that the Fed will tighten its monetary policy at a faster pace to curb soaring inflation should help limit losses for the buck and lend support to the USD/CHF pair. The fundamental backdrop favours bullish traders, suggesting that any meaningful pullback might be seen as a buying opportunity and remain limited, at least for now.
The market focus now shifts to the release of the US Retail Sales figures on Tuesday. Investors will also scrutinize remarks by several FOMC officials, including Fed Chair Jerome Powell, for clues about the possibility of a 75 bps rate hike. This would influence the USD price dynamics and determine the next leg of a directional move for the USD/CHF pair.
Technical levels to watch
Gold has fallen briefly back below $1,800 again on Monday. Economists at TD Securities highlight that XAU/USD is set to succumb to bearish sentiment across the precious metals market.
Potential of additional pain for gold bugs
“Speculative length and ETF positions continue to be sold off in gold with precious metals sentiment becoming increasingly bearish.”
“Even with recent liquidations accounted for, positioning analytics still argue for the potential of additional pain for gold bugs.”
“With the Fed telegraphing their every move, Fedspeak this week will be increasingly important, particularly as positioning is continuously squeezed with bearish sentiment building. In turn, we continue to expect substantial selling flow to weigh on the yellow metal at a time when liquidity is scarce.”
NY Fed President and influential FOMC member John Williams said on Monday that demand in the US economy far exceeds supply and that the Fed's monetary policy can bring it back in line with supply, report Reuters.
Additional Remarks:
"We're seeing inflation in a broad set of goods."
"Without price stability, you're not going to achieve the growth and employment opportunities you would otherwise."
"We are starting to see some impact of inflation on spending behavior."
"The MBS cap of $35 bln is a 'big number'."
"I do not expect to hit the MBS cap each month."
"Right now we're not focused on the possible sale of MBS, but it is an option we could consider in the future."
"MBS sales in the future might be an option to bring the balance sheet more closely to long-run goal of mostly treasuries."
"The balance sheet reduction itself will occur over the next few years."
"The balance sheet will still be larger than it was 10 years ago."
"The best position to be is to own primarily treasuries and we're not anywhere near that."
"Buying both MBS and treasuries have had a stronger effect on overall financial conditions than buying just treasuries."
"Buying MBS has proven to be a powerful tool."
"We've indicated clearly that our primary tool is the federal funds rate."
"We'd need to understand what the effects of MBS sales would be and consider market functioning carefully."
"MBS have a lot of desirable features and there is historically strong demand for those."
"The housing market now is the product of a 'unique' set of circumstances."
"We are not seeing a lot of risk-taking by mortgage lenders."
"We're seeing high rents as well as high home prices."
"We need more housing supply to meet the demand."
"We are seeing increases in rents that we had not seen before."
"Right now we have an enormous number of job openings."
USD/CAD holds little changed on the day after negative close Friday. Economists at Scotiabank note that the pair needs to drop below 1.2890 to develop more downside momentum.
A top may be developing
“The USD closed well off the week’s high last week and the pattern on the weekly chart suggests a top may be developing (via a weekly ‘shooting star’ signal).”
“Intraday chart patterns are supportive of a top developing for the USD but spot needs to crack 1.2890 today/tomorrow to develop more downside momentum. That could put funds on track for a test of the low/mid-1.27s.”
GBP/USD is little changed on the day. Nonetheless, the pair traded positively Friday for a bullish close. Economists at Scotiabank are closely watching a push towards 1.24 which would be a more obviously bullish technical development.
Key support is 1.2155
“There’s little obviously positive for the GBP on the intraday chart, with gains struggling to break above 1.2250/75. But a step back to the daily chart shows a rather surprising bullish close (key reversal day) Friday which suggests one of the G10 weaklings may be finding a base after all.”
“It’s tentative at this point but worth monitoring for a push on towards 1.24+ which would be a more obviously bullish technical development.”
“Key support is 1.2155.”
Economists at Credit Suisse believe this first phase of JPY weakness has now come to a temporary end. Therefore, USD/JPY is expected to break support at 126.95 to mark a top for a fall to support next at 125.10.
A temporary phase of JPY strength
“With 10yr US bond yields rejecting major support at 3.21/3.26%, we look for 131.25/132.20 to cap for now for a correction/consolidation phase.”
“Support is seen at 126.95, beneath which should see a fall back to price support at 125.10. With the 23.6% retracement of the 2021/2022 rally seen not far below at 124.56 and with the strongly rising 55-day average also seen not far below here, we then look for a floor in this 125.10/124.56 zone. We would then look for a consolidation phase to develop ahead of an eventual move back to 132.20.”
USD/CAD declined sharply on Friday. Nevertheless, analysts at Credit Suisse stay bullish and expect 1.2895/92 to hold to avoid deeper weakness.
Break above 1.3076 is needed to reinforce the medium-term upside
“Whilst a weekly close above the 200-week moving average and the recent high at 1.3040/76 is needed to confirm a medium-term turn higher, we remain with our bullish stance on the back of the rising moving averages and with weekly MACD momentum turning higher.”
“Above 1.3040/76 would confirm the breakout and see next resistance at 1.3091/3100, with a move above here seeing scope to reach 1.3172, ahead of a potential challenge of the 50% retracement of the 2020/21 downtrend at 1.3334 in due course.”
“Near-term support remains at last week’s low at 1.2895/92, which ideally holds to prevent a more severe weakness.”
“Whilst a close below 1.2895/92 would likely shift the short-term risk lower again, only below the 55-day moving average and May low at 1.2716/2698 would negate our medium-term upside bias.”
Swedish PM Magdalena Andersson announced on Monday that the Swedish government has formally decided that it will apply for NATO membership, reported Reuters. Accession to full membership should not take more than a year, she noted.
Sweden's decision to formally apply for NATO membership was expected and comes after Finland also announced its intentions to join the defensive alliance. Russian President Vladimir Putin earlier on Monday warned that Russia would react to any military expansion in Sweden or Finland and said NATO expansion was a problem.
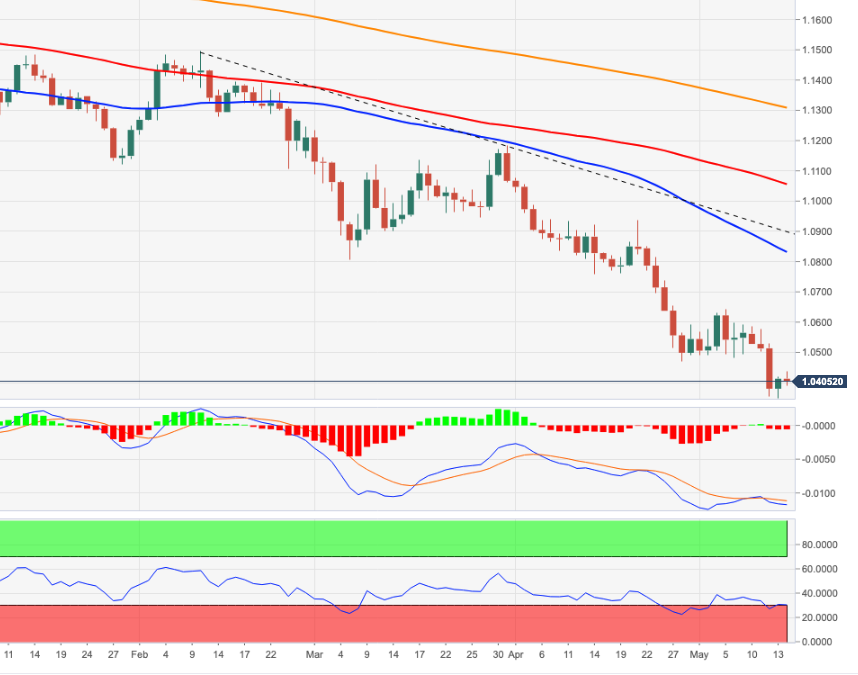
EUR/USD remains heavy just above 1.04. Economists at BBH expect the pair to break below the January 2017 low near 1.0340 and move towards parity.
ECB tightening expectations remain subdued
“The end of QE June 9 and liftoff July 21 remain fully priced in. However, the swaps market is now pricing in only 140 bp of tightening over the next 12 months followed by another 45 bp of tightening priced in over the following 12 months that would see the deposit rate peak near 1.35% vs. 1.75% at the start of last week. This repricing clearly reflects the worsening economic outlook and is likely to continue weighing on the euro.”
“We continue to target the January 2017 low near 1.0340. If that level breaks, we have to start talking about parity and below.”
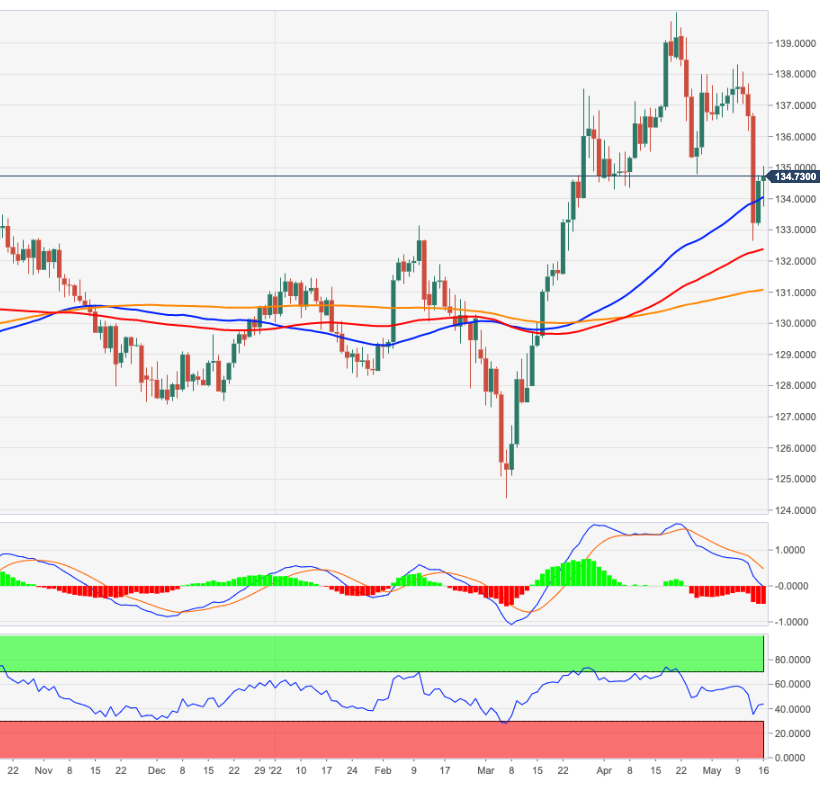
- EUR/JPY adds to Friday’s advance and retakes the 135.00 yardstick.
- Further upside needs to clear the 138.30 region in the near term.
EUR/JPY extends the recovery further and manages to revisit the area just above 135.00 the figure on Monday.
If the recovery picks up extra pace, then the cross could see the downside mitigated on a close above the May peak at 138.31 (May 9). Surpassing the latter should put a potential visit to the 2022 high at 140.00 (April 21) back on the radar.
In the meantime, while above the 200-day SMA at 131.05, the outlook for the cross is expected to remain constructive.
EUR/JPY daily chart
NY Fed President and influential FOMC member John Williams said on Monday that inflation remains the number one issue given that it is running far too high and persistently so, reported Reuters. The Fed's goal is to get the economy back into balance, he continued, adding that it's a challenging task, but that the Fed is committed to doing it.
Williams added that events in China and the war in Ukraine are major drivers of recent market volatility but noted that the Fed is not seeing signs of dysfunction in the US treasury market. Indeed, plans to reduce the size of the balance sheet are having an impact on longer-term interest rates, he added, noting that we have already seen a tightening of financial conditions akin to that seen in 1994.
Nonetheless, we need to get real interest rates back to zero, he added, before noting he expects inflation to come down quite a bit next year. Williams' remarks come ahead of commentary from Fed Chair Jerome Powell on Tuesday, which will also be closely scrutinised.
EUR/USD has seen a further sharp fall for a test of the 1.0341 low of 2017. Whilst economists at Credit Suisse look for some near-term consolidation here, the pair is set to break below this mark in due course for a move to parity.
Resistance at 1.0530 to cap on a closing basis
“We continue to look for the 1.0341 low of 2017 to hold at first for some consolidation, but big picture, our base case remains for a move below here to reinforce the bear trend even further, with support then seen next at 1.0217/09 and eventually parity/0.9900, which is also the 78.6% retracement of the 2000/2008 bull trend. Our bias would then be for this to act as a much better floor for a potentially lengthier phase of consolidation. Should weakness directly extend though, we see support next at 0.9609.”
“Near-term resistance moves to 1.0420, above which can ease the immediate downside bias for a recovery back to 1.0471, with the 13-day exponential average at 1.0530 ideally capping on a closing basis further strength.”
- USD/JPY gained some positive traction for the second successive day on Monday.
- The set-up favours bulls and supports prospects for a further appreciating move.
- Sustained weakness below the 128.00 mark is needed to negate the positive bias.
The USD/JPY pair attracted some dip-buying near the 128.70 region on Monday and turned positive for the second straight day. The intraday uptick, however, ran out of steam following the disappointing release of the NY Empire State Manufacturing Index, which tumbled to -11.6 in May.
Nevertheless, the momentum assisted spot prices to build on last week's bounce from the 127.50 region, or support marked by the 38.2% Fibonacci retracement level of the 121.28-131.35 strong move up. The subsequent strength beyond the 23.6% Fibo. and acceptance above the 129.00 mark favours bullish traders.
The positive outlook is reinforced by the emergence of some buying and the fact that oscillators on the daily chart are holding comfortably in bullish territory. That said, it will still be prudent to wait for some follow-through buying before positioning for any further appreciating move.
From current levels, the 129.75-129.80 region now seems to act as immediate resistance. This is closely followed by the 130.00 psychological mark, which if cleared decisively will be seen as a fresh trigger for bullish traders and push the USD/JPY pair back towards the 131.00 mark.
On the flip side, any meaningful pullback now seems to find decent support near the 129.00 mark ahead of the daily low, around the 128.70 region and the 128.20 horizontal zone. Failure to defend the said support levels would make the USD/JPY pair vulnerable to retesting mid-127.00s (38.2% Fibo.).
Some follow-through selling would set the stage for an extension of the recent corrective decline from a two-decade high and drag spot prices further towards the 127.00 mark. The downward trajectory could get extended to the next relevant support near the 126.45 region or the 50% Fibo. level.
USD/JPY 4-hour chart
-637883014976598443.png)
Key levels to watch
- The headline NY Fed Manufacturing Index slumped to -11.60 in May from 24.6 in April, much bigger than the expected drop.
- The subindices were mixed and the US dollar seemed to weaken a tad.
The headline General Business Conditions Index of the NY Fed's Empire State Manufacturing Survey slumped to -11.60 in May from 24.60 in April. That was much larger than the expected drop to 17.00 and marked the largest miss on expectations since April 2020, when the pandemic first struck the US.
Subindices:
- The New Orders Index fell to -8.8 in May from 25.1 in April.
- The Prices Paid Index fell to 73.7 from 86.4.
- The Employment Index rose to 14.0 from 7.3.
- The Six-Month Business Conditions Index rose to 18.0 from 15.2.
Market Reaction
The DXY saw some weakness in wake of the latest NY Fed data, though remains reasonably well supported in the mid-104.00s. The data has resulted in heightened calls that the US might be in/going into a recession.
- Gold fell briefly back below $1800 again on Monday to hit fresh multi-week lows as traders mull upcoming risk events.
- Bears continue to eye a test of annual lows around $1780 against the backdrop of a still buoyant buck.
Spot gold (XAU/USD) prices briefly fell back below the $1800 per troy ounce level on Monday to hit fresh multi-week lows, though have since entered into a consolidation pattern on either side of the big figure. At current levels just above, the precious metal is trading with losses of over 0.5% on Monday, marking a continuation of recent weakness since XAU/USD dipped below its 200-Day Moving Average (in the $1830s) last week.
Earlier in the session, XAU/USD event dipped as low as the $1780s for the first time since early February this year and the bears are eyeing a test of annual lows around the $1780 level. Weak Chinese data for April released over the weekend put fears about global growth back in the spotlight and this seemed to weigh on global risk appetite a tad, though not enough to support the safe-haven precious metal.
Key upcoming risk events this week, which include remarks from NY Fed President and influential FOMC member John Williams later on Monday ahead of the release of the April US Retail Sales report ahead of comments from Fed Chair Jerome Powell on Tuesday, are likely keeping gold traders on the defensive. Fed policymakers have signaled that they are unanimously on board with rapid policy tightening in the coming quarters as the US economy continues to suffer from sky-high inflation.
Hawkish expectations for Fed policy against a backdrop of concerns about weakening global growth have supported the US dollar as of late, with the DXY on Monday trading just below multi-decade highs in the mid-104.00s. Dollar strength has been a key factor hurting gold as of late, given a strong buck means it's more expensive for the holders of international currency to buy USD-denominated commodities.
- USD/CAD struggled to preserve its intraday gains amid modest USD weakness.
- Sliding US bond yields turned out to be a key factor that weighed on the buck.
- Softer crude oil prices undermined the loonie and offered support to the pair.
The USD/CAD pair witnessed good two-way price moves heading into the North American session and was last seen trading in neutral territory, around the 1.2925-1.2930 region.
A weaker tone surrounding the US Treasury bond yields prompted some US dollar selling on the first day of a new week, which, in turn, failed to assist the USD/CAD pair to capitalize on its intraday gains. Spot prices retreated over 50 pips from the daily swing high, around the 1.2980 region. That said, retreating crude oil prices undermined the commodity-linked loonie and acted as a tailwind for the major.
Weak Chinese macro data released this Monday underscored the damage caused by COVID-19 lockdowns in the world's second-largest economy. This added to worries about faltering global fuel demand and weighed on crude oil prices. That said, the European Union’s impending ban on Russian crude imports, along with concerns about tightening global supply, acted as a tailwind for the commodity and help limit deeper losses.
Investors also seem worried that a more aggressive move by major central banks to constrain inflation could hit global economic growth amid the war in Ukraine and China's zero-COVID-19 policy. This tempered investors' appetite for perceived riskier assets. The anti-risk flow dragged the yield on the benchmark 10-year US government bond away from the recent peak of 3.20% and exerted some pressure on the buck.
That said, firming expectations that the Fed would tighten its monetary policy at a faster pace should lend some support to the greenback and the USD/CAD pair. In fact, markets are pricing in at least a 50 bps Fed rate hike move at the next two policy meetings. Hence, investors will now scrutinize remarks by several FOMC officials, including Fed Chair Jerome Powell, for clues about the possibility of a 75 bps rate hike move.
Apart from this, traders will take cues from the release of the US Retail Sales figures on Tuesday and the Canadian CPI report on Wednesday before placing fresh directional bets around the USD/CAD pair. In the meantime, the Empire State Manufacturing Index might provide some impetus during the early North American session on Monday. This, along with oil price dynamics, would be looked upon to grab short-term trading opportunities.
Technical levels to watch
Russian President Vladimir Putin said on Monday that the expansion of NATO is a problem and it is in the interests of the USA, reported Reuters. Russia has no problems with Finland and Sweden, he continued, but Russia will react to the expansion of military infrastructure in these countries. Putin added that Russia needs to pay additional attention to NATO plans to increase its global influence.
Finland and Sweden both announced their commitment to applying for NATO membership over the weekend and most NATO nations have come out in support.
- GBP/USD has stabilised in the mid-1.2200s were it trades flat ahead of a busy week of US/UK economic events.
- Analysts think that if sentiment continues to deteriorate, the risk-sensitive pair could be pressured below 1.20000.
GBP/USD has stabilised in the mid-1.2200s on Monday against the backdrop of a nervous start to the week for global risk assets following weaker than expected Chinese Industrial Production and Retail Sales data released over the weekend. The data highlighted concerns about global growth as China, the world’s second-largest economy, continues to pursue strict lockdown policies in a bid to contain the spread of Covid-19.
These concerns, coupled with worries about central bank tightening amid still sky-high inflation have weighed heavily on GBP/USD in recent weeks. While sterling isn’t the highest beta of the major G10 currencies, it is viewed as more risk-sensitive than, say, the euro. US/UK economic and central bank policy divergence is another factor that has weighed heavily on the pair in recent week, with growth holding up better in the US and the Fed looking much more hawkish than the BoE.
Meanwhile, some traders are citing a recent uptick in Brexit newsflow, with tensions around the Northern Ireland Protocol back in the limelight, as capping GBP/USD rallies. At current levels nearly bang on 1.2250, GBP/USD is nearly 100 pips higher versus last Friday’s lows, but has by no means broken out of the recent bearish trend.
Analysts have been calling for the pair to break below 1.2000 this week if the market’s broader appetite for risk continues to deteriorate. In terms of economic events, cable traders have a lot to keep an eye on, with April US Retail Sales data out and Fed Chair Jerome Powell speaking on Tuesday and UK labour market, Consumer Price Inflation and Retail Sales data all also out this week. Traders should also keep an eye on remarks from NY Fed President and influential FOMC member John Williams later on Monday.
- USD/TRY extends further the recent breakout of 15.00.
- The lira depreciates to levels last seen in back in December 2021.
- Turkey Current Account widened to $5.55B in March.
The bearish mood around the Turkish currency remains well and sound and now lifts USD/TRY to new 2022 high past 15.60 at the beginning of the week.
USD/TRY looks to Ukraine, dollar
USD/TRY now advances uninterruptedly since May 5 and reaches fresh peaks in an area last visited back in mid-December 2021, just before the violent spike to the all-time highs beyond the 18.00 mark (December 20 2021). Immediate to the upside in the pair now seems to emerge the December 17 2021 high at 17.0446.
The lira saw its decline gather extra pace soon after inflation figures in Turkey rose to around 70% in April, as per latest CPI figures released earlier in the month. Adding to the sour sentiment around the currency, the war in Ukraine is already lasting more than initially estimated and is prolonging further the impact on energy and commodity prices in the domestic economy.
Data wise in Turkey, the Current Account deficit widened a tad to $5.55B in March and the Budget balance saw a TL50.17B during the last month.
What to look for around TRY
USD/TRY keeps the upside well and sound for yet another session and seems to have shifted its focus to the 16.00 mark for the time being. So far, price action in the Turkish currency is expected to gyrate around the performance of energy prices, the broad risk appetite trends, the Fed’s rate path and the developments from the war in Ukraine. Extra risks facing TRY also come from the domestic backyard, as inflation gives no signs of abating, real interest rates remain entrenched in negative figures and the political pressure to keep the CBRT biased towards low interest rates remain omnipresent.
Key events in Turkey this week: Current Account, Budget Balance (Monday) – Consumer Confidence (Friday).
Eminent issues on the back boiler: FX intervention by the CBRT. Progress (or lack of it) of the government’s new scheme oriented to support the lira via protected time deposits. Constant government pressure on the CBRT vs. bank’s credibility/independence. Bouts of geopolitical concerns. Structural reforms. Upcoming Presidential/Parliamentary elections.
USD/TRY key levels
So far, the pair is gaining 1.20% at 15.6342 and faces the next hurdle at 15.6349 (2022 high May 16) seconded by 18.2582 (all-time high December 20) and then 19.00 (round level). On the other hand, a drop below 14.6836 (monthly low May 4) would expose 14.5458 (monthly low April 12) and finally 14.5136 (weekly low March 29).
In a report published on Monday, Fitch Ratings noted that the global fiscal recovery in 2021 that followed the COVID-19 shock slowed sharply, affected by higher commodity prices and rising inflation, per Reuters.
The publication noted that the global fiscal recovery is expected to continue to slow in 2022 and 2023 amid increasing borrowing costs, slowing real GDP growth and the war in Ukraine. "Policy interest rates are rising, and Fitch believes this marks an end to an era of very low government borrowing costs," the report further read.
Market reaction
The market mood remains relatively risk-averse during the European session with the US stock index futures losing between 0.1% and 0.5%.
- Disappointing Chinese macro data prompted fresh selling around AUD/USD on Monday.
- A softer risk tone was seen as another factor that undermined the perceived riskier aussie.
- Sliding US bond yields kept the USD bulls on the defensive and helped limit deeper losses.
The AUD/USD pair remained on the defensive through the first half of the European session and was last seen trading with modest intraday losses, around the 0.6900 round-figure mark.
Following an early uptick to the 0.6960 area, the AUD/USD pair met with a fresh supply and touched an intraday low around the 0.6890 region in reaction to shockingly weaker Chinese macro releases. The data underscored the damage caused by COVID-19 lockdowns in the world's second-largest economy and weighed on the China-proxy Australian dollar.
Apart from China's zero-COVID-19 policy, the war in Ukraine has been fueling concerns about softening economic growth amid the prospects for a more aggressive policy tightening by the Fed. This, in turn, tempered investors' appetite for perceived riskier assets, which was evident from a softer tone around the equity markets and further undermined aussie.
The anti-risk flow dragged the yield on the benchmark 10-year US government bond further away from the recent peak of 3.20%. This, in turn, kept the US dollar bulls on the defensive and extended some support to the AUD/USD pair. Nevertheless, the fundamental backdrop supports prospects for an extension of the bearish trend witnessed over the past one month or so.
Market participants now look forward to the release of the US Empire State Manufacturing Index for a fresh impetus later during the early North American session. The data, along with the US bond yields, will influence the USD price dynamics. Traders will further take cues from the broader market risk sentiment for short-term opportunities around the AUD/USD pair.
The focus would then shift to the release of the Reserve Bank of Australia monetary policy meeting minutes on Tuesday. This will be followed by the US Retail Sales and Industrial Production figures. Apart from this, remarks by several FOMC officials, including the Fed Chair Jerome Powell, will be looked upon for clues about the possibility of a 75 bps rate hike move, which will drive the USD demand and determine the near-term trajectory for the AUD/USD pair.
Technical levels to watch
- EUR/USD climbs to 2-day highs near 1.0430 on Monday.
- German 10y Bund yields flirt with the key 1.00% mark.
- The European Commission sees a lower GDP this year.
The optimism around the risk complex remains well and sound and helps EUR/USD advance to new 2-day highs around 1.0430 on Monday.
EUR/USD bolstered by risk-on trade
EUR/USD posts gains for the second session in a row following the continuation of investors’ appetite for riskier assets at the beginning of the week.
In addition, the recovery in the German 10y bund yields to the boundaries of the psychological 1.00% mark also adds extra colour to the pair, which so far manages to leave behind the area of recent lows near 1.0340.
In the domestic calendar, the European Commission (EC) published its Spring Forecasts and now sees the region’s economy expanding 2.7% this year and 2.3% in 2023 (from 4.3% and 2.4%, respectively). Regarding inflation, the EC now expects the HICP to rise 6.1% in 2022 and 2.7% in the next year, still well above the ECB’s target.
Further data in the euro area saw the trade deficit increase to€16.4B in March. Data wise in the US, the NY Empire State Index and the TIC Flows are due along the speech by NY Fed J.Wiliiams.
What to look for around EUR
EUR/USD battles to retake the are above the 1.0400 mark on a convincing fashion amidst the recent improvement of the risk trends, while the outlook for the single currency remains well entrenched in the negative view for the time being. As usual, price action in spot should reflect dollar dynamics, geopolitical concerns and the Fed-ECB divergence. Occasional pockets of strength in the single currency, in the meantime, should appear reinforced by firmer speculation the ECB could raise rates at some point in the summer, while higher German yields, elevated inflation and a decent pace of the economic recovery in the region are also supportive of an improvement in the mood around the euro.
Key events in the euro area this week: European Commission Spring Forecasts (Monday) – EMU Flash GDP Growth Rate, ECB Lagarde (Tuesday) – EMU Final Inflation Rate (Wednesday) – ECB Monetary Policy Meeting Accounts (Thursday) – Germany Producer Prices, EMU Flash Consumer Confidence (Friday).
Eminent issues on the back boiler: Speculation of the start of the hiking cycle by the ECB as soon as this summer. Asymmetric economic recovery post-pandemic in the euro area. Impact of the war in Ukraine on the region’s growth prospects.
EUR/USD levels to watch
So far, spot is up 0.12% at 1.0421 and faces the next hurdle at 1.0641 (weekly high May 5) followed by 1.0936 (weekly high April 21) and finally 1.1000 (round level). On the other hand, the breach of 1.0348 (2022 low May 13) would target 1.0340 (2017 low January 3 2017) en route to 1.0300 (round level).
Talk of parity has been increasing in the FX market. The probability of EUR/USD touching parity has increased, in the view of economists at MUFG Bank.
Will the EUR/USD follow EUR/CHF and USD/CHF to parity?
“We still expect the Ukraine conflict and fallout will remain important in driving CHF and EUR performance.”
“A more prolonged conflict and increasing risk of greater energy supply disruption for European economies are increasing the risk of EUR/USD following EUR/CHF and USD/CHF in hitting parity this year.”
- Gold attracted fresh selling on Monday and dived to its lowest level since late January.
- Signs of stability in the financial markets undermined demand for the safe-haven metal.
- Break below the $1,800 accelerated the slide and has paved the way for further losses.
Gold weakened further below the $1,800 mark and dropped to its lowest level since late January during the first half of the European session. Spot prices
Following an early uptick to the $1,818 region, the XAUUSD came under some renewed selling pressure on Monday and prolonged its recent bearish trajectory witnessed over the past one month or so. Modest recovery in the global risk sentiment - as depicted by signs of stability in the equity markets - turned out to be a key factor that undermined the safe-haven gold.
Apart from this, the prospects for a more aggressive policy tightening by the Fed further contributed to driving flows away from the non-yielding yellow metal. The intraday downfall took along some short-term trading stops placed near the $1,800 mark. This further aggravated the bearish pressure surrounding gold, though a combination of factors helped limit losses.
Mounting global growth concern resulting from the war in Ukraine and China's zero-COVID-19 policy has spurred a rally in bonds, which saw the benchmark 10-year yields retreat from the recent peak of 3.20%. This, in turn, kept the US dollar bulls on the defensive and extended some support to the dollar-denominated commodity, allowing spot prices to rebound from the $1,787-$1,785 area.
That said, the lack of any strong follow-through buying and acceptance below the $1,800 round figure marks a bearish breakdown. Hence, a subsequent slide towards the $1,782-$1,780 area, or the 2022 low, en-route the next relevant support near the $1,753-$1,751 zone, remains a distinct possibility. Traders now look forward to the US Empire State Manufacturing Index for a fresh impetus.
Technical levels to watch
Downside pressure in USD/JPY is expected to meet the next support of note at 127.50 in the next weeks, noted FX Strategists at UOB Group Quek Ser Leang and Lee Sue Ann.
Key Quotes
24-hour view: “While we expected USD to weaken yesterday, we were of the view that ‘any weakness is expected to encounter strong support at 129.20’. The anticipated weakness exceeded our expectations by a wide margin as USD cracked 129.20 and nose-dived to 127.50 before snapping back up. The outsized decline appears to be overdone and USD is unlikely to weaken further. For today, we expect USD to trade between 128.00 and 129.50.”
Next 1-3 weeks: “On Tuesday (10 May, spot at 130.10), we highlighted that USD appears to have moved into consolidation phase and is likely to trade between 128.40 and 131.00. Yesterday (12 May), USD cracked 128.40 and plunged to 127.50 before rebounding strongly. While the price actions suggest USD could stage a deeper pullback, oversold shorter-term conditions could lead to USD trading above 127.50 for a couple of days first. Overall, only a breach of 130.10 would indicate that USD is not ready to move below 127.50. Looking ahead, support levels below 127.50 are at 127.00 and 126.00.”
The European Commission (EC) announced on Monday that it lowered the euro area economic growth forecast for 2022 to 2.7% from February's forecast of 4%. For 2023, the growth forecast got revised lower to 2.3% from 2.7% as well.
The EC sees the euro area inflation at 6.1% in 2022 vs 3.5% predicted in February but expects it to decline to 2.7% in 2023, still way above the European Central Bank's (ECB) target of 2%.
"By exerting further upward pressures on commodity prices, causing renewed supply disruptions and increasing uncertainty, the war is exacerbating pre-existing headwinds to growth, which were previously expected to subside," the EC explained in its publication.
Market reaction
The EUR/USD pair edged slightly lower from the session highs on this report and was last seen trading at 1.0420, where it was up 0.1% on a daily basis.
- USD/JPY attracted some dip-buying on Monday amid fading safe-haven demand.
- Sliding US bond yields kept the USD bulls on the defensive and capped the upside.
- The Fed-BoJ policy divergence supports prospects for additional near-term gains.
The USD/JPY pair rallied around 60-65 pips during the early European session and shot back closer to the top end of its daily trading range, around mid-129.00s in the last hour.
The pair attracted some dip-buying near the 128.70 region on Monday and turned positive for the second straight day, with bulls now looking to build on last week's goodish rebound from mid-127.00s. Signs of stability in the financial markets undermined the safe-haven Japanese yen and acted as a tailwind for the USD/JPY pair. That said, a combination of factors held back bulls from placing aggressive bets and capped spot prices.
Investors now seem worried about softening global growth amid the prospects of a more aggressive move by major central banks, the war in Ukraine and China's zero-COVID-19 policy. The fears were further fueled by shockingly weaker Chinese macro data. This, along with geopolitical tensions, extended some support to traditional safe-haven assets. This, in turn, saw the benchmark 10-year yields retreat from the recent peak of 3.20%, which kept the US dollar bulls on the defensive and kept a lid on any meaningful gains for the USD/JPY pair.
Nevertheless, the fundamental backdrop supports prospects for the resumption of the recent appreciating move amid a big divergence in the monetary policy stance adopted by the Fed and the Bank of Japan. Market participants now look forward to the US Empire Manufacturing PMI for a fresh impetus later during the early North American session. This, along with the US bond yields and the broader risk sentiment, should allow traders to grab some short-term opportunities around the USD/JPY pair.
Technical levels to watch
- GBP/USD struggled to preserve its modest intraday gains to the 1.2300 neighbourhood.
- A gloomy outlook for the UK economy, fresh Brexit jitters acted as a headwind for sterling.
- Aggressive Fed rate hike bets, the risk-off mood underpinned the USD and exerted pressure.
The GBP/USD pair remained on the defensive through the early European session and was last seen trading near the lower end of its daily range, around the 1.2225-1.2220 region.
The pair met with a fresh supply in the vicinity of the 1.2300 mark on Monday and stalled its modest recovery from a two-year low, around the 1.2155 region touched on the last day of the previous week. The incoming UK macro data validated the gloomy outlook for the UK economy and suggested that the Bank of England's current rate hike cycle could be nearing a pause. Apart from this, reports that the UK government is expected to reveal a plan to unilaterally change the Northern Ireland protocol on Tuesday acted as a headwind for the British pound.
On the other hand, the US dollar stood tall near a two-decade high and continued drawing support from expectations that the Fed would tighten its monetary policy at a faster pace to curb soaring inflation. In fact, markets are pricing in at least a 50 bps Fed rate hike move at the next two policy meetings. This, along with the prevalent risk-off environment, further underpinned the safe-haven buck. Investors now seem worried about softening global growth amid a more aggressive move by major central banks, the war in Ukraine and China's zero-COVID-19 policy.
A stronger greenback was seen as another factor that exerted some downward pressure on the GBP/USD pair. The fundamental backdrop seems tilted firmly in favour of bearish traders and supports prospects for an extension of the pair's recent downward trajectory. That said, absent relevant economic releases from the UK warrants some caution. Later during the early North American session, traders will take cues from the US Empire Manufacturing PMI. This, along with the broader risk sentiment, will influence the USD and provide a fresh impetus.
The focus would then shift to the monthly UK employment details on Tuesday, which will be followed by the US Retail Sales and Industrial Production figures. Investors will also scrutinize remarks by several FOMC officials, including Fed Chair Jerome Powell, for clues about the possibility of a 75 bps rate hike. This would drive the near-term USD demand and help determine the next leg of a directional move for the GBP/USD pair.
Technical levels to watch
- DXY trades within slight gains in the mid-104.00s.
- US yields navigate within a mixed note on Monday.
- NY Empire State Index, TIC Flows, short-term Bill Auctions next on tap.
The US Dollar Index (DXY), which gauges the greenback vs. a basket of its main competitors, trades within a tight range around the 104.50 region at the beginning of the week.
US Dollar Index looks to risk trends, Fed
The index extends the side-lined trading into the European session on Monday around the 104.50 region amidst the mixed performance of US yields along the curve and alternating risk appetite trends.
In the US money market, yields in the short end of the curve attempt a mild bounce vs. the soft start of the week seen in the belly and the long end.
No news in the more macro scenario for the dollar so far, as geopolitical tensions remain on the rise, particularly after Sweden and Finland expressed their intentions to join the NATO in the very near term.
Investors, in the meantime, remain focused on the Fed plans to tighten further its monetary conditions in the next few months and in 2023.
Later in the NA session, the NY Empire State Index is due seconded by TIC Flows and a 3-month/6-month Bill Auctions. In addition, NY Fed J.Williams (permanent voter, centrist) is also due to speak.
What to look for around USD
The dollar met an initial decent resistance in the 105.00 neighbourhood so far this month. Supporting the buck appears investors’ expectations of a tighter rate path by the Federal Reserve and its correlation to yields, the current elevated inflation narrative and the solid health of the labour market. On the negatives for the greenback turn up the incipient speculation of a “hard landing” of the US economy as a result of the Fed’s more aggressive normalization.
Key events in the US this week: NY Empire State Manufacturing Index, TIC Flows (Monday) – Retail Sales, Industrial Production, Business Inventories, NAHB Index, Fed Powell (Tuesday) – MBA Mortgage Applications, Building Permits, Housing Starts (Wednesday) – Initial Claims, Philly Fed Manufacturing Index, Existing Home Sales, CB Leading Index (Thursday).
Eminent issues on the back boiler: Speculation of a “hard landing” of the US economy. Escalating geopolitical effervescence vs. Russia and China. Fed’s more aggressive rate path this year and 2023. US-China trade conflict. Future of Biden’s Build Back Better plan.
US Dollar Index relevant levels
Now, the index is 0.10% at 104.58 and a breakout of 105.00 (2022 high May 13) would open the door to 105.63 (high December 11 2002) and finally 106.00 (round level). On the other hand, initial contention emerges at 102.35 (low May 5) seconded by 99.81 (weekly low April 21) and then 99.57 (weekly low April 14).
Commenting on the policy outlook, European Central Bank (ECB) Governing Council member Francois Villeroy de Galhau said on Monday that he expects a decisive policy meeting in June and an active summer, as reported by Reuters.
Additional takeaways
"Pace of the further steps will take into account actual activity and inflation data with some optionality and gradualism, but we should at least move towards the neutral rate."
"We will carefully monitor developments in the effective exchange rate, as a significant driver of imported inflation."
"A euro that is too weak would go against our price stability objective."
Market reaction
Despite these hawkish comments, the EUR/USD pair continues to trade in a relatively tight range near 1.0400 in the early European session.
USD/JPY trades in negative territory near 129.00. Economists at Bank of America Global Research flag a double top pattern for a move towards the 126 zone initially.
Double top confirmed
"A peak in USD/JPY has been made with a double top formation. The top is of tactical size with potential to evolve into something bigger given overbought conditions on longer-term charts are now starting to correct."
"First support area is about 126-125.21. Notable Fibonacci retracements include 123.05 (50%) and 121.10 (61.8%). The cloud lines are rising quickly, are difficult to estimate where they could be tested as support and should be watched this month."
- Gold struggled to capitalize on its modest gains recorded during the Asian session on Monday.
- Aggressive Fed rate hike bets continued underpinning the USD and acted as a headwind for gold.
- The risk-off mood, sliding US bond yields extended some support and helped limit deeper losses.
Gold seesawed between tepid gains/minor losses through the early European session and was last seen trading in neutral territory, just below the $1,810 level.
The XAUUSD, so far, has struggled to register any meaningful recovery and remained well within the striking distance of its lowest level since early February touched on Friday. Expectations that the Fed would tighten its monetary policy at a faster pace to curb soaring inflation assisted the US dollar to stand tall near a two-decade high. This, in turn, was seen as a key factor that acted as a headwind for the dollar-denominated gold.
The downside, however, remains cushioned, at least for the time being, amid the prevalent risk-off environment, which tends to benefit the safe-haven precious metal. Investors remain worried that a more aggressive move by major central banks to constrain inflation could hit global economic growth. The fears were further fueled by shockingly weaker Chinese macro data, which, along with geopolitical tensions, weighed on investors' sentiment.
The anti-risk flow dragged the benchmark 10-year US government bond yield away from the recent peak of 3.20%, which further offered some support to the non-yielding gold. Even from a technical perspective, spot prices showed some resilience below the $1,800 mark on Friday. This makes it prudent to wait for some follow-through selling and acceptance below the said handle before traders start positioning for any deeper losses for the XAUUSD.
Market participants now look forward to the release of the US Empire State Manufacturing Index for a fresh impetus later during the early North American session. This, along with the US bond yields, will influence the USD price dynamics and provide some impetus to gold prices. Traders will further take cues from the broader market risk sentiment to grab short-term opportunities around the metal.
Technical levels to watch
The US Dollar Index, which snapped a six-day winning streak and lost 0.3% on Friday, is staying relatively quiet near 104.50 early Monday. Economists at ING expect DXY to push well above 105.00 on more risk-off waves.
All about risk sentiment
“We doubt we are going to see a rapid and material unwinding of defensive dollar positions in the week ahead.”
“We might see some tentative stabilisation in risk sentiment this week, which could favour a partial recovery in high-beta currencies and put a cap on the dollar upside for now. That is, however, far from assured given the volatility we have seen in recent weeks.”
“More risk-off waves would likely push DXY well above 105.00.”
The aussie has started a week packed with market-moving events in Australia on the backfoot. Still, economists at ING remain tied to global risk sentiment. Therefore, AUD/USD needs a recovery in global equities to climb back above 0.70.
Some key data to watch before the elections
“Tomorrow, the minutes from the Reserve Bank of Australia's May meeting will be scanned closely for hints about the timing and size of additional monetary tightening. On Wednesday, the long-awaited wage data for 1Q will be released. On Thursday, the employment figures for April will be published, with a chance the jobless rate will fall below 4.0%.”
“Australia’s Federal elections will be held on 21 May. The latest opinion polls see the incumbent prime minister Scott Morrison’s Liberal-National coalition trailing about 3% behind the centre-left Labour party.”
“We think AUD will remain tied to global risk sentiment and China-related developments, and the impact of domestic factors may be rapidly offset by external factors.”
“Some recovery in global equities is surely needed at this point for AUD/USD to climb back above 0.7000, while another risk-off wave could send the pair to the 0.6600-0.6700 area in the near-term.”
The global pressure for higher yields and the global energy crunch have weighed heavy on the yen with USD/JPY reaching the highest level since 2002. However, economists at Danske Bank expect the USD/JPY pair to move downward in the medium-term as inflation eases.
Energy crunch to weigh on the yen
“In the short run, the global pressure for higher yields and the global energy crunch will keep weighing on JPY.”
“Looking further ahead, we do expect the pressure on JPY will wear off when inflation shows signs of peaking and we see Tokyo capping the upside on USD/JPY.”
“We forecast the cross at 129 in 1M, 129 in 3M, 126 in 6M and 122 in 12M.”
It will be worth keeping an eye on data this week in the UK. However, Bank of England’s (BoE) rate hike expectations are likely to remain unchanged. In the view of economists at ING, cable remains at risk of falling towards 1.20.
Data releases in focus this week
“Tomorrow, jobs figures should keep pointing to a tight labour market and potentially some marginal acceleration in wage growth. On Wednesday, the April inflation report should show a jump in the headline rate above the 9.0% mark (so a 2.5%+ month-on-month reading) while the core rate should rise above 6.0%. Still, we suspect the monetary policy implications of these readings may be quite contained given that the Bank of England’s latest forecasts already embed double-digit inflation later this year.”
“The battered pound is largely hanging onto some recovery in risk appetite to extend Friday’s marginal rebound. However, markets will also keep a close eye on Brexit-related developments, which may end up generating more downside pressure on the currency.”
“The risks of a move to 1.2000 in GBP/USD in the near-term remain very material.”
EUR/USD remains close to a key technical level, the 1.0340 multi-year low. A break under this level would pave the way for another leg lower, economists at ING report.
EUR/USD at risk of a break below the 1.0340 support
“A break below 1.0340 would likely pave the way for another leg lower and make parity quite a tangible possibility.”
“We are marginally inclined to think the euro will be able to hold above 1.0340 this week, given quite a lot of short-term negatives are now in the price, and possibly climb back to the 1.0500 gravity line. This scenario, however, heavily relies on some stabilisation in global risk sentiment.”
“Today, EU’s foreign ministers will meet to further discuss an EU-wide ban on Russian oil. The oil ban is mostly priced into the euro already and we doubt an official announcement this week would generate a dramatic drop in the currency.”
EUR/NOK has moved sharply higher over the last month. Economists at Danske Bank pencil in a further rise in EUR/NOK over the coming 3-6M on rising global recession risks but forecast a secular weakening trend amid the outlook for elevated inflation and commodity prices in the years ahead.
Still too soon to prepare for secular downswing
“We think it is too early for the more secular bullish NOK trend to commence and we generally see risks skewed to the topside post a temporary rebound.
“We forecast EUR/NOK at 10.20 in 1M (from 9.50), 10.50 in 3M (from 9.80), 10.40 in 6M (10.00) and 10.00 in 12M (9.80).”
“ A widespread global recession and a sharp sell-off in risk could send EUR/NOK substantially above our projection. On the other hand, a persistent move higher in oil and natural gas prices would send EUR/NOK lower.”
- USD/RUB fades bounce off two-year low, takes offers to renew intraday bottom of late.
- NATO’s Stoltenberg said that Russia’s war in Ukraine is not going as it planned.
- Finland, Sweden add to the geopolitical fears while bracing for NATO membership.
- US Retail Sales, Fedspeak and oil prices are the key catalysts to forecast near-term moves.
USD/RUB struggles to keep Friday’s rebound from the lowest levels since 2020 as the Russian ruble (RUB) pair drops back towards $65.15 heading into Monday’s European session.
In doing so, the quote struggles to justify the US dollar’s recent safe-haven demand, as well as softer oil prices. Also portraying the indecision of the USD/RUB traders are mixed concerns surrounding the Russia-Ukraine war and the recent chatters of Finland and Sweden opting for the North Atlantic Treaty Organization (NATO).
The US Dollar Index (DXY) dribbles around a 20-year high, fails to extend Friday’s pullback. That said, Fed Chairman Jerome Powell’s 50 bps rate hike view joins the downbeat US Consumer Sentiment Index data to challenge the greenback buyers. However, the recent risk-off mood favors the greenback’s safe-haven demand.
Elsewhere, the WTI crude oil prices, Russia’s key export, snap a three-day uptrend as sellers dominate below $110.00, down 0.62% intraday by the press time. In addition to the firmer USD, recent headlines from Saudi Arabia also weigh on oil prices. Recently Saudi Arabia signaled to boost oil production capacity by the end of 2026-early 27.
On a different page, European Union’s Foreign Minister Borrell mentioned that they can't guarantee sanctions issues will be resolved immediately. The same may have helped the RUB to regain its upside momentum.
It’s worth noting that the Nato Secretary-General, Jens Stoltenberg, said Russia’s offensive in Donbas had stalled and Ukraine could win the war, an outcome few military analysts predicted at the outset of the conflict, per The Guardian. The news also stated, “Finland on Sunday confirmed it would apply to join Nato, while Sweden’s ruling Social Democrats backed Nato membership, paving the way for an application and abandoning decades of neutrality.”
In a reaction to the same, Russian Deputy Foreign Minister Ryabkov stated that the global situation will change drastically after the Swedish decision to join NATO, per RIA news.
Amid these plays, the S&P 500 Futures drop 0.70% intraday whereas the US 10-year Treasury yields fall 4.2 basis points (bps) to 2.89% by the press time.
Moving on, USD/RUB traders should pay attention to the qualitative catalysts amid a light calendar ahead. Even so, the US Retail Sales for April will become important amid the recently mixed inflation figures.
Technical analysis
Although a two-month-old descending resistance line joins the 10-DMA to restrict short-term USD/RUB rebound to around $67.00, Friday’s Dragonfly Doji candlestick probes sellers until the quote stay beyond $62.83.
China's activity falls sharply. As such, Chinese weaker growth trajectory will add to pressure on its markets. Economists at TD Securities expect further CNY depreciation.
Slow recovery ahead
“China's April data slate was unambiguously weak, with IP and retail sales sliding. The data highlight the risks of a contraction in GDP this quarter and provide evidence that the ‘around 5.5%’ official growth target looks increasingly out of reach. Strict zero-COVID policy means that any easing in restrictions will be gradual and growth will only recover slowly.”
“China's weaker growth trajectory will add to pressure on its markets (weaker equities and weaker CNY), and fuel a further worsening in global economic prospects, weighing on risk assets.”
“While the drop in the CNY will likely slow in the weeks ahead we expect further CNY depreciation, with a test of the 76.4% Fib retracement level at 6.9625 on the cards following a likely break of the 61.8% retracement around 6.8250.”
- USD/CAD regained positive traction on Monday and reversed a part of Friday’s downfall.
- Retreating crude oil prices undermined the loonie and acted as a tailwind for spot prices.
- The USD was seen consolidating its recent gains and did little to provide a fresh impetus.
The USD/CAD pair held on to its good intraday gains through the early European session and was last seen trading around the 1.2960-1.2965 area, just a few pips below the daily high.
Having shown some resilience below the 1.2900 mark, the USD/CAD pair attracted some buying on the first day of a new week and reversed a part of Friday's slide to a one-week low. Retreating crude oil prices undermined the commodity-linked loonie and extended some support to the major, though subdued US dollar demand kept a lid on any further gains.
Crude oil prices edged lower and snapped a three-day winning streak after shockingly weak Chinese macro data, which fueled worries about faltering global demand. That said, the European Union’s impending ban on Russian crude imports continued driving fears about tightening global supply and acted as a tailwind for the black liquid, at least for now.
On the other hand, the USD was seen consolidating its recent strong gains to a two-decade high and did little to provide any meaningful impetus to the USD/CAD pair. The bias, however, remains tilted in favour of bulls amid expectations that the Fed would tighten its monetary policy at a faster pace to combat stubbornly high inflation.
In fact, markets are pricing in at least a 50 bps Fed rate hike move at the next two policy meetings. Adding to this, mounting global growth concerns resulting from the war in Ukraine and China's zero-COVID-19 policy further underpinned the greenback's reserve currency status. This, in turn, supports prospects for additional gains for the USD/CAD pair.
Market participants now look forward to the release of the US Empire State Manufacturing Index for a fresh impetus later during the early North American session. The data, along with the broader market risk sentiment, will influence the USD demand. Traders will further take cues from oil price dynamics for short-term opportunities around the USD/CAD pair.
Technical levels to watch
GBP/USD traded last week at the lowest since May 2020 near 1.2155. A break below that month’s low at 1.2075 would open up substantial losses toward the 1.1410 mark, economists at BBH report.
Bleak economic outlook to weigh on sterling
“With the economy sliding into recession and the BoE sending mixed messages, sterling should continue to weaken.”
“We continue to target May 2020 low near 1.2075. If that level breaks, then we would target the March 2020 low near 1.1410.”
Here is what you need to know on Monday, May 16:
Markets have turned risk-averse at the start of the week following the risk rally witnessed on Friday. The disappointing macroeconomic data releases from China, coronavirus-related concerns and heightened fears over a global economic slowdown allow safe-haven flows to continue to dominate the markets. The European Commission will release the Economic Growth Forecasts for the euro area and the Bank of England's Monetary Policy Hearing will take place in the UK parliament. In the second half of the day, the Federal Reserve Bank of New York's Empire State Manufacturing Survey will be looked upon for fresh catalysts.
The data from China showed earlier in the day that Retail Sales contracted by 11.1% on a yearly basis in April, missing the market expectation for a decline of 6% by a wide margin. Additionally, Industrial Production narrowed by 2.9% in the same period, compared to analysts' forecast for a growth of 0.7%. Meanwhile, the city of Shanghai announced that coronavirus controls will remain in place due to the high risk of a rebound in infections despite the fact that five out of the city's 16 districts have reported no cases. Moreover, the city of Beijing decided to extend the work-from-home orders in four districts, including Chaoyang.
The US Dollar Index, which snapped a six-day winning streak and lost 0.3% on Friday, is staying relatively quiet near 104.50 early Monday. The benchmark 10-year US Treasury bond yield is moving sideways near 2.9% and US stock index futures are down between 0.5% and 0.7%.
EUR/USD lost more than 100 pips last week and stays relatively quiet near 1.0400 early Monday. Eurostat will release the Trade Balance data for March later in the session.
GBP/USD rose toward 1.2300 during the Asian trading hours on Monday but failed to preserve its recovery momentum.
USD/JPY trades in negative territory near 129.00 in the European morning. Bank of Japan Governor Haruhiko Kuroda said earlier in the day that it was important for them to continue to support the economy with powerful monetary easing. Despite these comments, the risk-averse market environment helps the Japanese yen find demand.
Gold fluctuates in a tight channel above the key $1,800 mark early Monday. The yellow metal continues to have a difficult time capitalizing on safe-haven flows.
Following the decisive rebound witnessed over the weekend, Bitcoin came under renewed selling pressure at the start of the week and was last seen trading near $29,500, where it was down nearly 6% on the day. Ethereum turned south and started testing $2,000 after gaining nearly 6% in the previous two days.
The yuan has witnessed a sharp depreciation recently, moving from 6.36 against USD at the beginning of April to 6.79 on May 12th. The depreciation does not seem curbed by the People’s Bank of China (PBoC) yet, so it will possibly continue, analysts at Natixis report.
PBoC to allow for more exchange rate flexibility
“Down the road, we expect the PBoC to allow for more exchange rate flexibility. At the current juncture, this means more likely depreciation given the cautious outlook of the Chinese economy due to the Covid lockdowns and the general strength of the dollar.”
“In case of unexpected large fluctuations, it is possible other financial institutions could curb it before the PBoC intervenes. Stabilizing foreign exchange market, or more broadly, the financial market is still important to guarantee investor’s sentiment in the Chinese market, especially in light of capital outflows.”
Economists at Danske Bank lower their current forecast on EUR/USD to 1.00 in 12M.
EUR/USD to parity
“The large negative terms-of-trade shock to Europe vs the US, a further cyclical weakening among trading partners, the coordinated tightening of global financial conditions, broadening USD strength (currently, vs Asia) and downside risk to the euro area makes us revise our EUR/USD forecast lower.”
“We now shift the forecast from 1.05 on 12M to 1.00.”
“The key risk to shift EUR/USD towards 1.15 is seeing global inflation pressures fade and industrial production increase. However, ‘transitory’ has substantially lost credibility and European industrial production continues to be weak. This will continue in coming months. The upside risk also includes a renewed focus on easing Chinese credit policy and a global CAPEX uptick but neither appear to be materialising, at present.”
Gold has fallen in the last few days. Economists at TD Securities highlight that a significant liquidation event may currently be unfolding.
Sentiment is poor in precious metals
“Sentiment is poor in precious metals, and elevated positioning analytics still argue for potential additional pain for gold bugs.”
“CTA trend followers have also joined the liquidation party, and with prices now below the bull-market-defining uptrend, a significant liquidation event may currently be unfolding.”
XAU/USD bears have the upper hand. Break below $1,800 awaited, FXStreet’s Haresh Menghani reports.
Watching aggressive Fed rate hike bets
“Traders will further take cues from remarks by several FOMC officials, including Fed Chair Jerome Powell for clues about the possibility of a 75 bps rate hike move. This, in turn, will play a key role in influencing the near-term USD price dynamics and provide a fresh directional impetus to gold.”
“It will be prudent to wait for some follow-through selling below the $1,800 handle before positioning for any further losses. The next relevant support is pegged near the $1,782-$1,780 region, or 2022 low, below which gold could accelerate the slide towards the $1,753-$1,751 zone.”
“On the flip side, attempted recovery might now be seen as a selling opportunity near the $1,828-$1.829 region. This, in turn, might cap the metal near a technically significant moving average, around the $1,835 region. The latter, if cleared decisively, might trigger a short-covering bounce. Gold could then climb back to the $1,858-$1,860 supply zone.”
- Silver pares Friday’s recovery moves from two-year lows.
- Bears cross on MACD, one-week-old descending trend channel keep sellers hopeful.
- 100-HMA adds to the upside filters, late 2019 high lures bears on breaking $20.00 support.
Silver (XAG/USD) remains on the back foot around the intraday low surrounding $21.00, fading the previous day’s recovery moves ahead of Monday’s European session.
In doing so, the bright metal justifies a bearish crossover on the MACD, as well as a one-week-long falling channel bearish chart formation.
That said, sellers await a clear downside break of the $21.00 before progressing towards the recent multi-month low, around $20.45.
However, the lower line of the aforementioned channel, near $20.25, will precede the $20.00 psychological magnet to challenge the XAG/USD’s short-term downside.
In a case where silver bears keep reins past $20.00, a late 2019 high surrounding $19.60 will be in focus.
Alternatively, the upper line of the stated falling channel and the 100-HMA, respectively near $21.20 and $21.30, guard short-term recovery moves of the bullion.
Following that, XAG/USD bulls may approach the $22.00 and the monthly high around $23.30.
To sum up, silver prices remain pressured around a multi-month low despite the previous day’s corrective pullback.
Silver: Hourly chart
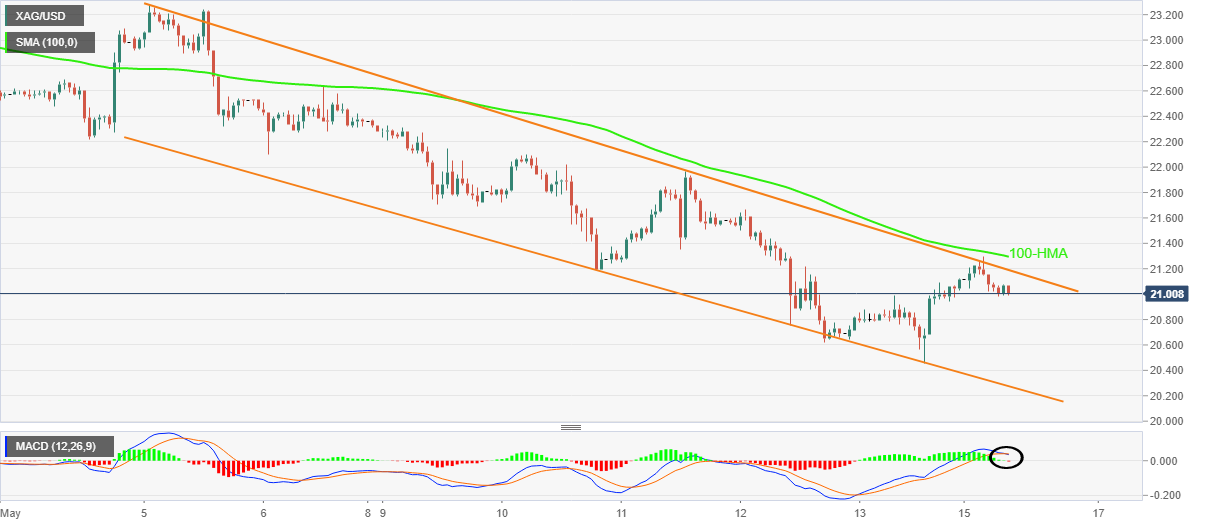
Trend: Further weakness expected
Considering preliminary readings from CME Group for natural gas futures markets, open interest went up for the second straight session on Friday, now by nearly 8K contracts. Volume, in the meantime, shrank for the fourth session in a row, this time by around 60.8K contracts.
Natural Gas appears limited by $8.00
Friday’s inconclusive price action in natural gas prices was in tandem with rising open interest, which is indicative that a potential consolidative phase could be in the offing in the very near term. On the upside, the next hurdle emerges at the $8.00 mark per MMBtu.
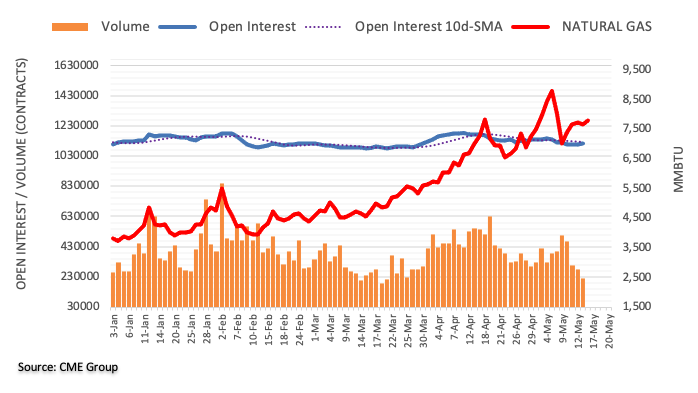
- USD/JPY is establishing below 129.00 as DXY has performed lackluster in the Asian session.
- Fed Powell’s speech will put some more light on the measures to bring price stability.
- Japan’s economy will release the National CPI figures this week.
The USD/JPY pair has displayed a more than 50-pips slippage in the Asian session amid subdued performance from the US dollar index (DXY). The light economic calendar has paused the DXY in a tight range and investors are on the sidelines ahead of the speech from Federal Reserve (Fed) chair Jerome Powell on Tuesday.
Fed’s Powell in his interview with the Marketplace national radio program on Friday unexpectedly added the option of two more jumbo rate hikes consecutively for the next policy meetings on the rate hike alternatives list. Earlier, the street was expecting only one more jumbo rate hike in addition to the 50 basis points (bps) elevation announced in the first week of May. Now, more than two jumbo rate hikes in a single year may put the greenback in a prolonged bullish trajectory.
Also, Fed’s Powell emphasized bringing price stability as mounting price pressure is weighing on the paychecks of the households.
Meanwhile, the yen bulls are awaiting the release of the National Consumer Price Index (CPI) on Friday. The yearly figure is seen at 1.5%, higher than the previous figure of 1.2%. Also, the core CPI that excludes Food and Energy is seen at -0.9%, lower than the prior print of -0.7%. The inflation figures are not highlighting any sign that could compel the Bank of Japan (BOJ) to adopt a hawkish tone for policy rates. A prudent monetary policy is expected to stay for longer.
Economists at Rabobank see risk of EUR/USD at 1.03 on a one-month and three-month view. What’s more, a clear break of the 2017 low at 1.0341 would make parity a realistic target for the currency pair.
Growth issues are depressing the medium-term outlook for the EUR
“Despite the risk that the Fed may have little option but to drive the US economy into recession in 2023 in order to reclaim its inflation fighting credibility, we now expect that the USD will continue to find solid support into the medium-term as fears over global growth underpin safe haven demand. The EUR is likely to be more sensitive to recessionary fears.”
“Risks facing the eurozone are closely tied to energy security while slowing growth in China is set to be another thorn in the side of the single currency.”
“We recently revised higher our forecast for the USD across the board and lowered our one and three-month targets for EUR/USD to 1.03.”
“A clear break of the 2017 low at 1.0341 would make parity a realistic target for the currency pair.”
- Copper prices dribble around daily lows amid mixed clues from China.
- PBOC inaction, plans to overcome lockdowns and more easing keep buyers hopeful.
- Cautious optimism, downbeat data for April join inflation and growth fears to weigh on prices.
Copper prices fail to recover from an eight-month low, flashed last week, as mixed concerns over global economic growth joins China’s downbeat data and fears over covid headlines.
That said, the red prices remain pressured at around $4.15, down 0.30% intraday, on COMEX whereas the most active three-month contract on the London Metal Exchange (LME) prints 0.40% intraday gains around $9,200 at the latest. Further, copper prices on the Shanghai Futures Exchange rise 0.90% to 71,220 yuan ($10,486.95) a tonne by the midday break, per Reuters.
That said, risk-off returns to the table, fading Friday’s recovery moves, after China reported downbeat figures for April month’s Retail Sales and Industrial Production, backed by conveying fresh fears over the coronavirus resurgence. “Shanghai set out plans on Monday for the return of more normal life from June 1 and the end of a painful COVID-19 lockdown that has lasted more than six weeks and contributed to a sharp slowdown in China's economic activity,” said Reuters.
On a different page, fears that Germany isn’t going to respect Hungary’s push for no total ban on Russia’s energy imports weigh on market sentiment and the red metal’s prices. Furthermore, news that the military actions in Donbas continue to accelerate underpins the risk-off mood, as well as favor the copper bears.
Amid these plays, the S&P 500 Futures drop 0.50% even after the Wall Street benchmarks rallied the previous day. Further, the US 10-year Treasury yields struggle to extend Friday’s recovery moves as the bond coupon declines 2.5 basis points (bps) to around 2.90% by the press time.
Looking forward, headlines from China and inflation woes will be crucial for copper prices, which in turn highlight this week’s US Retail Sales and Eurozone economic forecasts, not to forget covid updates, for fresh impulse.
Gold closed the fourth straight week in negative territory. As FXStreet’s Eren Sengezer notes, XAU/USD looks to test $1,800 with sellers retaining control.
Buyers to remain on the sidelines in the near term
“A prolonged weakening of the dollar doesn’t look likely in the current market environment. The factors that have been driving the greenback’s valuation, namely the ongoing Russia-Ukraine conflict, heightened inflation fears amid lockdowns in China and the Fed’s tightening prospects, should remain intact next week. Hence, it would be reasonable to expect that gold’s recovery attempts are likely to remain limited in the short term.”
“On the upside, the 200-day SMA forms dynamic resistance at $1,840, which could be seen as a recovery target. As long as gold fails to make a daily close above that level, however, the bearish bias should stay intact.”
“$1,800 (psychological level, May 13 low) aligns as first technical support ahead of $1,790 (the beginning point of the February-March uptrend) and $1,780 (January 28 low).”
According to FX Strategists at UOB Group Quek Ser Leang and Lee Sue Ann, further downside momentum could see AUD/USD retesting the 0.6800 region in the next weeks.
Key Quotes
24-hour view: “Our expectations for AUD to ‘trade between 0.6900 and 0.6995’ yesterday were incorrect as it cracked 0.6900 and plunged to 0.6829 before rebounding. The rapid decline appears to be overdone but AUD could retest the 0.6830 level. The next support at 0.6800 is unlikely to come under threat. Resistance is at 0.6900 followed by 0.6925.”
Next 1-3 weeks: “Yesterday (12 May, spot at 0.6930), we highlighted that AUD has close below 0.6900 within these 1 to 2 days or the chance for a sustained decline would diminish quickly. AUD subsequently plummeted to 0.6829 before rebounding to close at 0.6858 (-1.20%). The boost in downward momentum suggests AUD could weaken to 0.6800. The downward pressure is intact as long as AUD does not move above 0.6960 (‘strong resistance’ level).”
CME Group’s flash data for crude oil futures markets noted open interest increased for the fourth consecutive session on Friday, this time by more than 29K contracts. On the other hand, volume shrank for the third day in a row, now by around 183.5K contracts.
WTI: Next up barrier aligns at $116.60
WTI extended the weekly recovery past the $110.00 mark at the end of last week amidst rising open interest, which should be supportive of the continuation of this move in the very near term. Looking at the broader picture, the next hurdle of note comes at the March 24 high at $116.61.
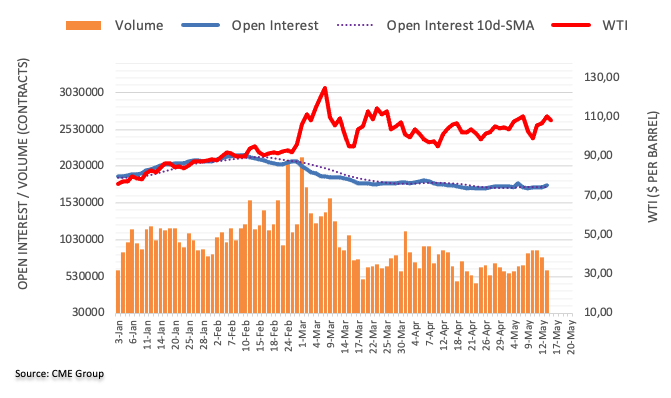
- AUD/USD prices remain pressured toward two-year low, fades bounce off intraday low.
- Weekly resistance line guards immediate recovery moves.
- Downbeat RSI, sustained trading below 100-DMA keeps sellers hopeful to retest nine-month-old support line.
AUD/USD reverses Friday’s corrective pullback from a two-year low, stays depressed around 0.6890 heading into Monday’s European session.
The Aussie pair managed to justify the last week’s rebound from a downward sloping trend line from August 2021. However, failures to cross a one-week-old descending resistance line, around 0.6925-30 by the press time, challenge the recovery moves.
The pullback moves, however, remain less challenging until staying beyond the aforementioned trend line support, around 0.6820 at the latest.
In a case where AUD/USD prices drop below 0.6820, the mid-June 2020 low near 0.6775 and May 2020 peak around 0.6685-80 will be in focus.
On the contrary, an upside break of 0.6930 will need validation from January’s low surrounding 0.6965 before eyeing the early May swing low, close to 0.7030.
Overall, AUD/USD prices are likely to remain weak but the bears have limited room on the downside.
AUD/USD: Daily chart
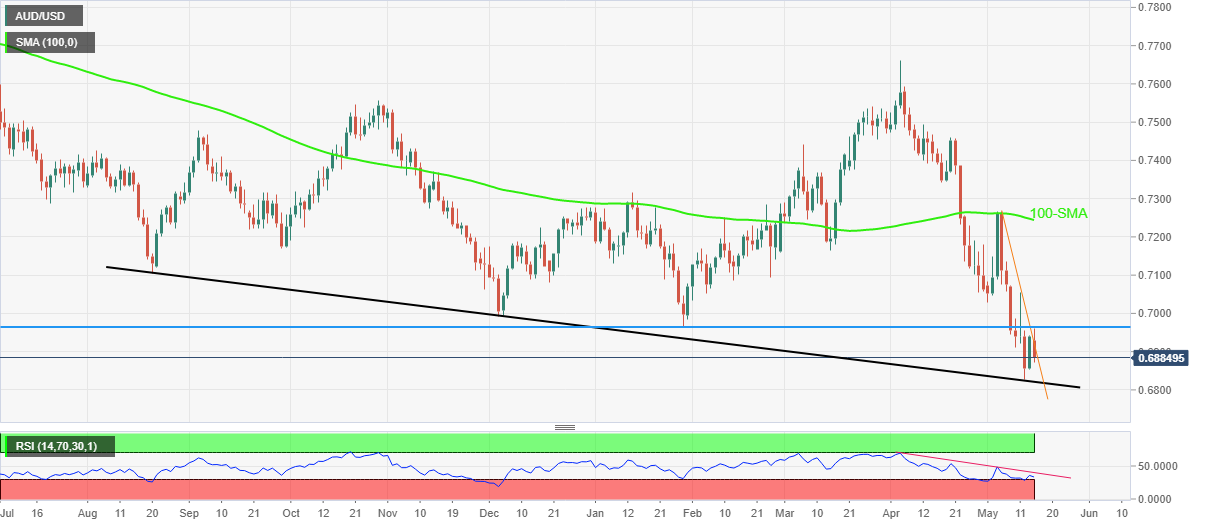
Trend: Further downside expected
Bank of Japan (BOJ) Governor Haruhiko Kuroda said on Monday that the excessive foreign exchange (FX) moves seen recently were undesirable and reiterated that they were not targeting the FX market, as reported by Reuters.
"It's important to back the economic activity with powerful monetary easing," Kuroda added. "It will take time for sustainable, stable inflation to take hold in Japan."
Market reaction
The USD/JPY pair showed no immediate reaction to these comments and was last seen trading at 128.90, where it was down 0.23% on a daily basis.
- USD/CNH sees an upside to near 6.8200 amid the underperformance of China’s economic data.
- The DXY is trading lackluster ahead of Fed Powell’s speech.
- Rising Covid-19 restrictions have impacted China’s growth forecasts.
The USD/CNH pair is juggling in a minor range of 6.8020-6.8120 after a firmer rebound in the Asian session. Downbeat Retail Sales by China’s National Bureau of Statistics (NBS) have weakened the Chinese yuan against the greenback. The yearly Retail Sales have landed at -11.1%, notably lower than the estimates of -6% and the prior figure of -3.5%. A continuous drop in China Retail Sales has raised concerns over the growth prospects in China.
It would be justified to state that tight restrictions in Shanghai and Beijing to curb the spread of Covid-19 have impacted vigorously the growth prospects in China. Apart from the Retail Sales, China’s Industrial Production has also tumbled sharply. The economic data has slipped to -2.9%, lower than the consensus of 0.7% and the previous print of 0.5%.
Meanwhile, comments from China’s NBS state that the economy is expecting a recovery in consumption. While the economy’s exports will continue to face pressures amid a global slowdown.
On the dollar front, the US dollar index (DXY) is expected to carry forward its consolidation in the European session. The DXY is struggling to surpass 104.60 amid the unavailability of any potential trigger that could provide a meaningful direction to the asset. This week, the economic calendar will be light for the greenback bulls. However, the speech from Federal Reserve (Fed) chair Jerome Powell will remain in focus. Investors are expected to find some insights into the likely monetary policy action by the Fed in its June monetary policy.
In opinion of FX Strategists at UOB Group Quek Ser Leang and Lee Sue Ann, further downside in GBP/USD should meet support around 1.2140 in the next weeks.
Key Quotes
24-hour view: “We highlighted yesterday that ‘momentum is building quickly and a break of 1.2200 would not be surprising’. We added, ‘the next support at 1.2140 is likely out of reach for now’. Our view turned out to be correct as GBP dropped to 1.2165 before rebounding. While downward pressure appears to have eased, GBP could dip below 1.2165. However, 1.2140 still appears to be out of reach for now. Resistance is at 1.2240 followed by 1.2270.”
Next 1-3 weeks: “Yesterday (12 May, spot at 1.2240), we highlighted that improved downward momentum suggests that GBP could break 1.2200. We added, ‘the next support is at 1.2140’. GBP subsequently cracked 1.2200 and dropped to 1.2165. Further weakness appears likely even though oversold shorter-term conditions could slow the pace the any further decline. The next support below 1.2140 is at 1.2100. On the upside, a breach of 1.2300 (‘strong resistance’ level was at 1.2380 yesterday) would indicate that the weakness that started late last week has run its course.”
Traders increased their open interest positions by just 242 contracts on Friday, according to advanced prints from CME Group. Volume, instead, went down sharply by around 127.6K contracts, reversing the previous daily build.
Gold: Initial support emerges at $1800
Prices of gold dropped and tested the key $1800 mark per ounce troy on Friday. The downtick was on the back of a small increase in open interest and leaves the door open to extra losses in the very near term. In the meantime, the breach of $1800 should expose a probable test of the 2022 low at $1780 (January 28).
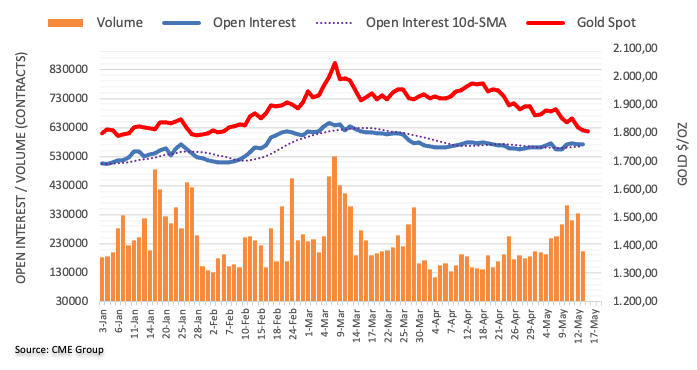
- Asia-Pacific markets trade mixed as China’s data, coronavirus updates challenge optimism.
- Fedspeak, downbeat US data previously triggered recovery moves.
- Light calendar keeps traders stuck to risk catalysts for fresh impulse.
- PBOC’s inaction, South Korean signals for big monetary policy moves gained little attention.
Markets in the Asia-Pacific region remain divided as headlines from China, as well as an absence of major positives elsewhere, test bulls during Monday’s Asian session. While portraying the mood, MSCI’s index of Asia-Pacific shares outside Japan remains lackluster, up 0.10%, whereas Japan’s Nikkei 225 rises 0.50% by the press time.
That said, risk-off returns to the table, fading Friday’s recovery moves, after China reported downbeat figures for April month’s Retail Sales and Industrial Production, backed by conveying fresh fears over the coronavirus resurgence.
That said, Shanghai City Official’s comments and weekend updates from Beijing were the major catalysts to renewing COVID-19 fears. While Shanghai City Official initially mentioned that the city's epidemic is under control, he also stated, “However the risks of rebound remain and we need to continue to stick to controls,” which in turn drowned the market’s risk appetite. On the same line was the weekend news suggesting Beijing’s guidelines to work from home for four districts, including the heavyweight Chaoyang.
It’s worth noting that the People’s Bank of China (PBOC) kept the Medium-Term Lending Facility (MLF) rate for 1-year unchanged at around 2.85%.
Amid these plays, shares in China and Hong Kong remain on the back foot at the latest. The same weighs on the prices of Australia and New Zealand shares, not to forget equities from South Korea and Indonesia, due to trade links with Beijing.
It should be noted that the comments from the Bank of Korea, suggesting a big interest rate rise ahead, exerts additional downside pressure on South Korea’s KOSPI. “The South Korean central bank chief's comment that he could consider big-step interest rate raises in coming months shook the local bond market on Monday, as Asia's fourth-largest economy also braced for fast slowing in growth,” said Reuters.
On a broader front, the S&P 500 Futures drop 0.80% even after the Wall Street benchmarks rallied the previous day. Further, the US 10-year Treasury yields struggle to extend Friday’s recovery moves as the bond coupon declines 2.5 basis points (bps) to around 2.90% by the press time. This in turn renews the US dollar’s upside momentum and exert downside pressure on the prices of commodities, as well as equities of late.
FX Strategists at UOB Group Quek Ser Leang and Lee Sue Ann suggested that EUR/USD could slip back to 1.0300 and 1.0200 in case it breaches 1.0340.
Key Quotes
24-hour view: “While we expected EUR to weaken yesterday, we were of the view that ‘the chance for a break of the major support at 1.0470 is not high’. However, EUR cracked the major support and plunged to a low of 1.0352. The deeply oversold weakness has scope to drop below 1.0340 first before stabilization can be expected (next support is at 1.0300). Resistance is at 1.0430 followed by 1.0460.”
Next 1-3 weeks: “Last Friday (06 May, spot at 1.0540), we highlighted that EUR has to close below the solid support at 1.0470 before a sustained decline is likely. Yesterday (12 May, spot at 1.0515), we indicated that ‘there is no change in our view for now even though shorter-term downward momentum has weakened a tad and the chance for EUR to close below 1.0470 has increased slightly’. That said, we did expect the reaction upon the break of 1.0470 as EUR crashed to a low of 1.0352. From here, a break of the 2017 low near 1.0340 could trigger further sharp decline. The next support levels are at 1.0300 and 1.0200. Overall, only a break of 1.0490 (‘strong resistance’ level was at 1.0605 yesterday) would indicate that the current weakness in EUR has stabilized.”
These are the main highlights of the CFTC Positioning Report for the week ended on May 10th:
- The speculative community reduced its net longs to the lowest level since early January, while the percentage of the net position on open interest also retreated to multi-month lows around 2.30%. The well-telegraphed 50 bps rate hike by the Federal Reserve coupled with the unabated march higher in US yields and the confirmation of a tight labour market (as per NFP results) kept the European currency and the rest of the risk-linked galaxy under further pressure amidst some range bound trading in EUR/USD just above 1.0500 the figure.
- Net longs in the dollar climbed to levels last seen in early March. Indeed, speculators added to their positive view in the buck following the move on rates by the Fed and the subsequent upside in US yields despite Chief Powell disregarded a 75 bps rate hike in the very near term at his press conference. In addition, another solid print from April’s Nonfarm Payrolls also lent extra legs to the greenback. The US Dollar Index (DXY) extended the move higher well north of the 103.00 mark, or fresh cycle tops.
- Net shorts in the British pound rose to an area last visited in later September 2019. The dovish hike by the BoE on May 5 coupled with a somewhat gloomy perspective for the UK economy in the medium term put the quid under extra pressure and dragged GBP/USD to fresh lows in the sub-1.2400 area.
- In the safe haven universe, net shorts in CHF climbed to levels last seen in early November 201, while USD/CHF kept the bullish stance unchanged and with the next target at the psychological 1.0000 mark. Net shorts in JPY increased to 4-week highs helped by the Fed’s move and higher yields, all motivating USD/JPY to edge higher and print new 2-decade tops past 131.30 (May 9).
- Speculators reduced the gross longs in the Aussie dollar and prompted net shorts to advance to 6-week peaks despite the start of the hiking cycle by the RBA at its May 3 event. The improvement in the sentiment surrounding the greenback deteriorated the price action in the commodity space and directly affected AUD, forcing AUD/USD to break below the psychological 0.7000 mark for the first time since January and record new lows for the year.
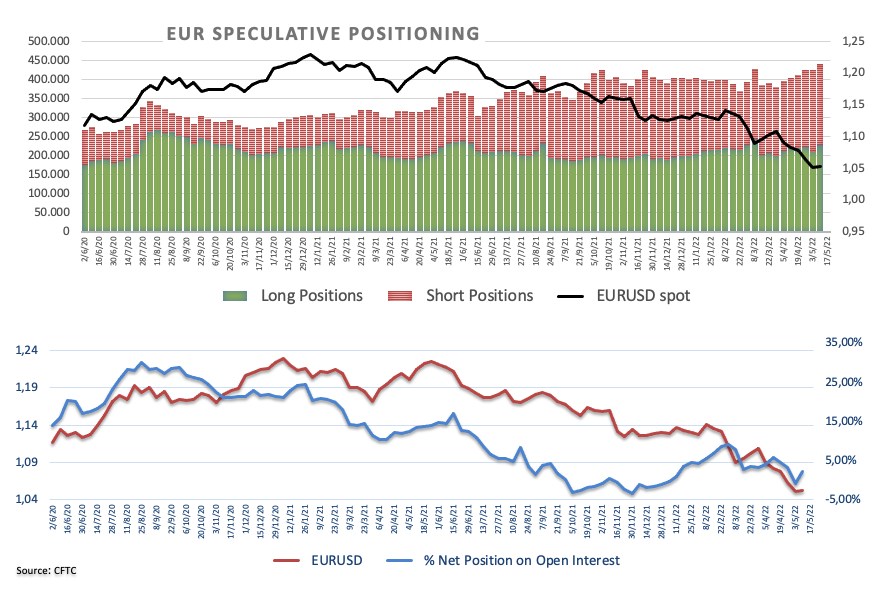
- GBP/USD reverses Friday’s corrective pullback from two-year low.
- UK’s readiness to alter NI protocol, despite EU’s warning, keeps Brexit fears on the table.
- China’s downbeat data, covid news refresh risk-aversion aversion wave.
- Light calendar focuses on qualitative catalysts for fresh impulse, UK jobs report, US Retail Sales are crucial for the week.
GBP/USD holds lower ground near 1.2340 as Friday’s corrective pullback fades amid fresh challenges to sentiment during early Monday morning in Europe. Also weighing on the quote are the fears emanating from Brexit chatters, recently surrounding the Northern Ireland Protocol (NIP).
That said, Market sentiment sours after China reported downbeat figures for April month’s Retail Sales and Industrial Production, backed by conveying fresh fears over the coronavirus resurgence. Furthermore, fears that Germany isn’t going to respect Hungary’s push for no total ban on Russia’s energy imports, as well as news that the military actions in Donbas continue to accelerate, underpin the risk-off mood.
At home, UK PM Boris Johnson braces for altering the NIP with hopes of a change in the European Union’s (EU) position. The UK government is expected to reveal plans for unilateral changes in NIP on Tuesday. The bloc, however, previously warned of such actions with a cut in a trade deal with Britain.
On the other hand, the Financial Times (FT) conveyed optimism at the British manufacturers as they jostle to ease the supply chain concerns. “Three-quarters of companies have increased the number of their British suppliers in the past two years, according to a survey by Make UK, the manufacturers’ trade group,” said the news.
Against this backdrop, the S&P 500 Futures drop 0.80% even after the Wall Street benchmarks rallied the previous day. Further, the US 10-year Treasury yields struggle to extend Friday’s recovery moves as the bond coupon declines 2.5 basis points (bps) to around 2.90% by the press time.
To sum up, the risk-off mood and downbeat sentiment concerning Brexit exert downside pressure on the GBP/USD prices. However, a lack of major data/events during the day may allow the cable to pare the latest losses should the Western markets favor risk appetite. Hence, qualitative catalysts will be in focus ahead of Tuesday’s UK jobs report.
Technical analysis
A three-week-old falling wedge bullish chart pattern, between 1.2310 and 1.2100 of late, suggests that the GBP/USD bears have recently run out of steam.
- USD/INR scales higher to 77.67 amid broader strength in the greenback.
- The Indian rupee has weakened despite falling oil prices.
- An embargo on Russian oil by Europe could delay amid opposition by Hungary.
The USD/INR pair has witnessed a strong upside move at the open and has climbed to near 77.70 despite the US dollar index (DXY) is trading lackluster in the Tokyo session. The DXY is bid directionless amid a light economic calendar this week.
Major key events for the DXY will be the release of the US Retail Sales and the speech from Federal Reserve (Fed) chair Jerome Powell. The US Retail Sales are expected to land at 0.7% against the prior print of 0.5%. A higher-than-expected figure will open doors for the DXY to renew its 19-years high. The DXY is currently trading in a tight range of 104.43-104.65 after hitting a latest 19-year high of 105.00 on Friday.
Apart from that, Fed Powell’s speech will hold significant importance. This will provide cues of the decision-making behind the monetary policy dictation by the Fed in June.
Oil prices are dropping sharply on Monday as lower China Retail Sales have renewed fears of a slump in aggregate demand. The black gold has tumbled below $107.00, easing more than 1.6%, at the press time, in the Asian session. The investment community is focusing on the announcement of the European embargo on Russian oil imports. The European Union (EU) is expected to delay the expected ban after receiving an objection from Hungary.
- Gold prices remain pressured as fresh risk-off sentiment renews US dollar buying.
- Bears cheer Friday’s downside break of key support as China’s data dump, covid news weigh on sentiment.
- Key pivot points lure sellers ahead of January’s low, bulls need validation from $1,835.
Gold (XAU/USD) prices remain pressured around a three-month low, reversing the early Asian rebound, as the risk-off mood underpins the USD’s safe-haven demand. Also keeping the gold sellers hopeful is the clear downbeat break of an ascending trend line from August 2021, portrayed the previous day.
Market sentiment sours after China reported downbeat figures for April month’s Retail Sales and Industrial Production, backed by fresh covid fears emanating from Shanghai and Beijing. Additionally challenging the previous risk-on were fears that Germany isn’t going to respect Hungary’s push for no total ban on Russia’s energy imports. Furthermore, news that the military actions in Donbas continue to accelerate underpin the risk-off mood, as well as favor the US dollar’s safe-haven demand.
Read: Gold, Chart of the Week: Bulls are moving in, but weekly levels are eyed
Gold Price: Key levels to watch
The Technical Confluences Detector shows that the Gold Price is eyeing a test of the Pivot Point 1 month S2 and Pivot Point 1 Day S2, surrounding $1,797.
Should the quote drops below $1,797, which is more likely considering Friday’s key trend line break, lows marked during January around $1,780 will be in focus.
It’s worth noting that the Bollinger Band Lower on 4H and 1D could offer immediate support around the $1,800 threshold.
On the contrary, SMA 5H and Middle Bollinger on 1H may test recovery moves around $1,815.
Following that, 23.6% Fibonacci retracement for one week, around $1,820, will test the upside momentum.
Even if the gold buyers manage to cross the $1,820 hurdle, a clear upside break of the $1,833-35 region, comprising 38.2% Fibonacci retracement on one week, as well as Middle Bollinger on 4H, becomes necessary to retake controls.
Here is how it looks on the tool

About Technical Confluences Detector
The TCD (Technical Confluences Detector) is a tool to locate and point out those price levels where there is a congestion of indicators, moving averages, Fibonacci levels, Pivot Points, etc. If you are a short-term trader, you will find entry points for counter-trend strategies and hunt a few points at a time. If you are a medium-to-long-term trader, this tool will allow you to know in advance the price levels where a medium-to-long-term trend may stop and rest, where to unwind positions, or where to increase your position size.
- The greenback bulls have strongly defended the lower boundary of the Rising Channel.
- The 20- and 50-EMAs are advancing firmly, which favors a bullish bias.
- A Double Distribution trading session will keep the loonie bulls on the backfoot.
The USD/CAD pair has witnessed a strong rebound in the Asian session after hitting a low of 1.2895. The asset is expected to display a bullish Double Distribution trading session as the asset has moved sharply higher after trading in a narrow range of 1.2896-1.2920. Early distribution has been completed, followed by an upside move and the greenback bulls will balance again at elevated levels.
The formation of a Rising Channel chart pattern on a four-hour scale signals an upside move in a specified channel. The upper boundary of the chart pattern is placed from April 13 high at 1.2676 while the lower boundary is plotted from April 21 low at 1.2460 The greenback bulls have displayed a firmer reversal after hitting the lower boundary of the above-mentioned chart pattern.
The 20- and 50-period Exponential Moving Averages (EMAs) at 1.2972 and 1.2938 respectively are scaling higher, which adds to the upside filters.
Also, the Relative Strength Index (RSI) (14) has sensed support from 40.00 levels, which indicates a firmer responsive buying action.
Investors should wait for a minor pullback around the 50-EMA at 1.2938 to initiate long entries. A bargain buy will send the asset towards the psychological resistance at 1.3000, followed by Thursday’s high at 1.3077.
USD/CAD four-hour chart
-637882702432766812.png)
- EUR/USD reverses Friday’s corrective pullback from five-year low.
- Risk-aversion returns to table after China reports downbeat economics, renews covid fears.
- Mixed Fedspeak, softer US data fail test USD bulls of late.
- Eurozone’s quarterly economic forecasts become interesting amid Russia-Ukraine crisis, ECB’s July rate hike concerns.
EUR/USD fails to extend the previous day’s recovery from a five-year high, taking offers to refresh the intraday low around 1.0390 during early Monday morning in Europe.
The major currency pair took a U-turn from a muti-year low the previous day as the US Dollar Index (DXY) consolidated gains around a 20-year high, backed by downbeat US data and Fedspeak. However, the recent risk-aversion wave renews USD buying and weighs on the EUR/USD prices ahead of the quarterly economic forecasts from the European Commission.
Market sentiment sours after China reported downbeat figures for April month’s Retail Sales and Industrial Production, backed by conveying fresh fears over the coronavirus resurgence. That said, Shanghai City Official’s comments and weekend updates from Beijing were the major catalysts to renewing COVID-19 fears. While Shanghai City Official initially mentioned that the city's epidemic is under control, he also stated, “However the risks of rebound remain and we need to continue to stick to controls,” which in turn drowned the market’s risk appetite. On the same line was the weekend news suggesting Beijing’s guidelines to work from home for four districts, including the heavyweight Chaoyang.
Additionally challenging the previous risk-on were fears that Germany isn’t going to respect Hungary’s push for no total ban on Russia’s energy imports. Furthermore, news that the military actions in Donbas continue to accelerate underpin the risk-off mood, as well as favor the US dollar’s safe-haven demand.
Amid these plays, the S&P 500 Futures drop 0.80% even after the Wall Street benchmarks rallied the previous day. Further, the US 10-year Treasury yields struggle to extend Friday’s recovery moves as the bond coupon declines 3.6 basis points (bps) to around 2.95% by the press time.
Moving on, the Eurozone economic forecasts will be crucial amid looming fears of recession and chatters surrounding the European Central Bank’s (ECB) rate hike in July. Should the EC projections fail to comply with the market’s downbeat forecasts, the EUR/USD may have a reason to pare the latest losses, amid a lack of major directives from the US.
Read: EUR/USD Weekly Forecast: How far can the dollar go?
Technical analysis
Failures to approach a three-week-old resistance line, near 1.0500, direct EUR/USD prices towards the south. Also acting as the key hurdle is the monthly peak of 1.0641.
Meanwhile, the 1.0350-40 support zone, comprising the recent low and the year 2017 bottom, puts a strong floor under the EUR/USD prices.
- NZD/USD has plunged to near 0.6230 as China’s Retail Sales underperformed.
- The yearly Retail Sales landed at -11.1%, lower than the forecasts of 6%.
- This week, investors will focus on Fed Powell’s speech and US Retail Sales.
The NZD/USD pair has plunged to near 0.6230 after China’s National Bureau of Statistics reported the Retail Sales. Underperformance has been observed from the economic data as yearly Retail Sales have landed at -11.1%, principally down from the forecasts of -6% and the prior print of -3.5%.
It is worth noting that kiwi is one of the largest trading partners to China and underperformance from the dragon economy poses a serious impact. Lower-than-expected Retail Sales from China have forced the market participants to dump kiwi. Meanwhile, “China’s Stats Bureau Spokesman expects economic operations to improve in May,” per Reuters. The views have arrived after the release of Retail Sales data. Apart from Retail Sales, Industrial Production data has slipped to -2.9%, lower than the consensus and the former figure of 0.7% and 5% respectively.
On the dollar front, the US dollar index (DXY) is trading lackluster in the Asian session. A marginal range of 104.42-104.67 has been recorded yet and a continuation of a rangebound performance is expected later due to the light economic calendar on Monday. This week, a speech from Federal Reserve (Fed) chair Jerome Powell and US Retail Sales will hog the limelight. The monthly US Retail Sales are seen at 0.7%, higher than the previous print of 0.5%. Both events are due on Tuesday.
- The yen bulls got triggered as the asset hit the supply zone in an 89.75-90.05 range.
- AUD/JPY hit hard after China unveiled an underperformance in its Retail Sales data.
- The RSI (14) has displayed a loud downside move, which signals more weakness ahead.
The AUD/JPY pair has witnessed a sheer downside move in the Asian session after hitting a high of 90.13. The risk barometer has sensed an intense selling pressure after China reported yearly Retail Sales at -11.1%, significantly lower than the consensus of -6% and the prior print of -3.5%. Also, the Industrial Production has plunged to -2.9%, lower than the estimated and former figure of 0.7% and 5% respectively.
Aussie bulls have been hammered strongly after the cross attacked the supply zone in a range of 89.75-90.05. A failed attempt of establishment above the supply one has been followed by a sheer downside to near 88.91 has shifted the market structure into the favor of bears.
The 20- and 50-period Exponential Moving Averages (EMAs) at 89.36 and 89.30 respectively are expected to overlap each other ahead, which signals a consolidative move going forward.
Meanwhile, the Relative Strength Index (RSI) (14) has displayed a loud move from the bullish range of 60.00-80.00 to a consolidative range of 40.00-60.00.
For further downside, the asset needs to tumble below Friday’s low at 88.18, which will send the asset towards Thursday’s low at 87.31. A breach of the latter will drag the asset towards the round level support at 86.00.
On the flip side, aussie bulls could dictate the asset if it oversteps Monday’s high at 90.13. This will drive the asset towards Wednesday’s high at 91.77, followed by May 6 high at 93.00.
AUD/JPY hourly chart
-637882661113141793.png)
| Raw materials | Closed | Change, % |
|---|---|---|
| Brent | 111.23 | 2.68 |
| Silver | 21.106 | 1.89 |
| Gold | 1811.65 | -0.62 |
| Palladium | 1935.08 | 0.78 |
CHINA STATS BUREAU SPOKESMAN SAYS EXPECTS ECONOMIC OPERATIONS TO IMPROVE IN MAY
more to come
“5 out of city's 16 districts have reached zero-covid outside quarantined areas status,” said Shanghai City Official, per Reuters, during Monday’s session.
The official also added that the city's epidemic is under control while also saying, “However the risks of rebound remain and we need to continue to stick to controls.”
Additional comments
Focus until may 21 will be to prevent the risks of rebound, many movement restrictions to remain.
Will look to allow normal life to resume in shanghai from June 1.
Will gradually increase flights and rail services to and from Shanghai.
On the same line was the weekend news suggesting Beijing’s guidelines to work from home for four districts, including the heavyweight Chaoyang.
FX implications
The downbeat news from Australia’s biggest customer drowns AUD/USD, together with disappointing Retail Sales and Industrial Production data for April. That said, the pair sellers attack 0.6900 at the latest.
Read: AUD/USD drops back towards 0.6900 on China’s downbeat Retail Sales, Industrial Production
- AUD/USD takes offers to refresh intraday low, reverses Friday’s recovery moves amid disappointment from key customer.
- China Retail Sales slumped 11.1%, Industrial Production growth contracted 2.9% in April.
- PBOC keeps 1-year MLF unchanged, Beijing extends “work-from-home” guidance in four districts.
AUD/USD reverses the previous day’s corrective pullback by dropping back towards 0.6900 following China’s downbeat prints of Retail Sales and Industrial Production (IP) for April. Also weighing on the pair were earlier headlines from China and an absence of major positives in Asia. That said, the quote drops to refresh intraday low around 0.6910 by the press time of Monday’s Asian session.
China’s Retail Sales dropped to -11.1%, more than the -6.0% forecast and -3.5% expected, whereas the Industrial Production (IP) growth turned negative with -2.9% figures compared to 7.0% expected growth.
Read: China Retail Sales and industry data sinks AUD/USD
Earlier in the day, the People’s Bank of China (PBOC) kept the Medium-Term Lending Facility (MLF) rate for 1-year unchanged at around 2.85%. Although traders widely expected the move, the fourth straight month of inaction from the PBOC worries AUD/USD buyers of late.
On the same line was the weekend news suggesting Beijing’s guidelines to work from home for four districts, including the heavyweight Chaoyang. The dragon nation’s powerhouse previously mandated a three-day “homestay” for residents for testing. Additionally, news that many activity restrictions remain intact in Shanghai, despite the zero-covid outside quarantine areas in 15 of 16 districts, also challenges AUD/USD bulls.
It’s worth noting that Friday’s downbeat prints of the US Michigan Consumer Sentiment Index for May, backed by Fed Chair Jerome Powell’s repetition of 50 bps rate hikes concerns, helped the AUD/USD pair to recover from a two-year low. The absence of any major updates on that front during the weekend, however, seems to have paused the pair buyers of late. Furthermore, worsening geopolitical concerns in Ukraine joins the European Union’s (EU) plan for more sanctions on Russia to weigh on sentiment, as well as on the pair prices. Also challenging the mood are broad fears over inflation and economic growth moving forward, mainly due to the covid resurgence in China and the Russia-Ukraine tussles, not to forget tighter monetary policies.
Amid these plays, the S&P 500 Futures print mild losses after the Wall Street benchmarks rallied the previous day. Further, the US 10-year Treasury yields struggle to extend Friday’s recovery moves as the bond coupon seesaws around 2.95% by the press time.
Moving on, AUD/USD traders will keep their eyes on the risk catalysts, mainly on the updates from China and Russia, for fresh impulse. However, major attention will be given to the US Retail Sales and the minutes of the latest Reserve Bank of Australia (RBA) meeting for clear directions.
Technical analysis
Despite the corrective pullback from the two-year low, AUD/USD bulls need validation from January’s bottom surrounding 0.6965 to convince short-term buyers. Failing to do so can redirect the quote towards the recently flashed multi-month low near 0.6830.
China has released April activity data including Retails Sales whereby the ongoing lockdowns are expected to weigh, with a consensus -6.6% for the year versus -3.5% in March.
The data arrived as follows:
"Retail sales in April shrank 11.1% year-on-year amid wider and stringent COVID-19 curbs on activity, after falling 3.5% in March. The figure was below analysts' expectations for a 6.1% drop," Reuters reported.
Meanwhile, the industry and construction are less affected by Covid lockdowns and the Industrial Production came in as follows:
"China's industrial output fell 2.9% in April from a year earlier, down sharply from a 5.0% increase in March, data from the National Bureau of Statistics showed on Monday, and weaker than 0.4% growth seen in a Reuters poll," Reuters reported.
AUD/USD had been attempting to move higher in the open this week but the bears were moving in ahead of the data:

Chinese data sinks AUD:
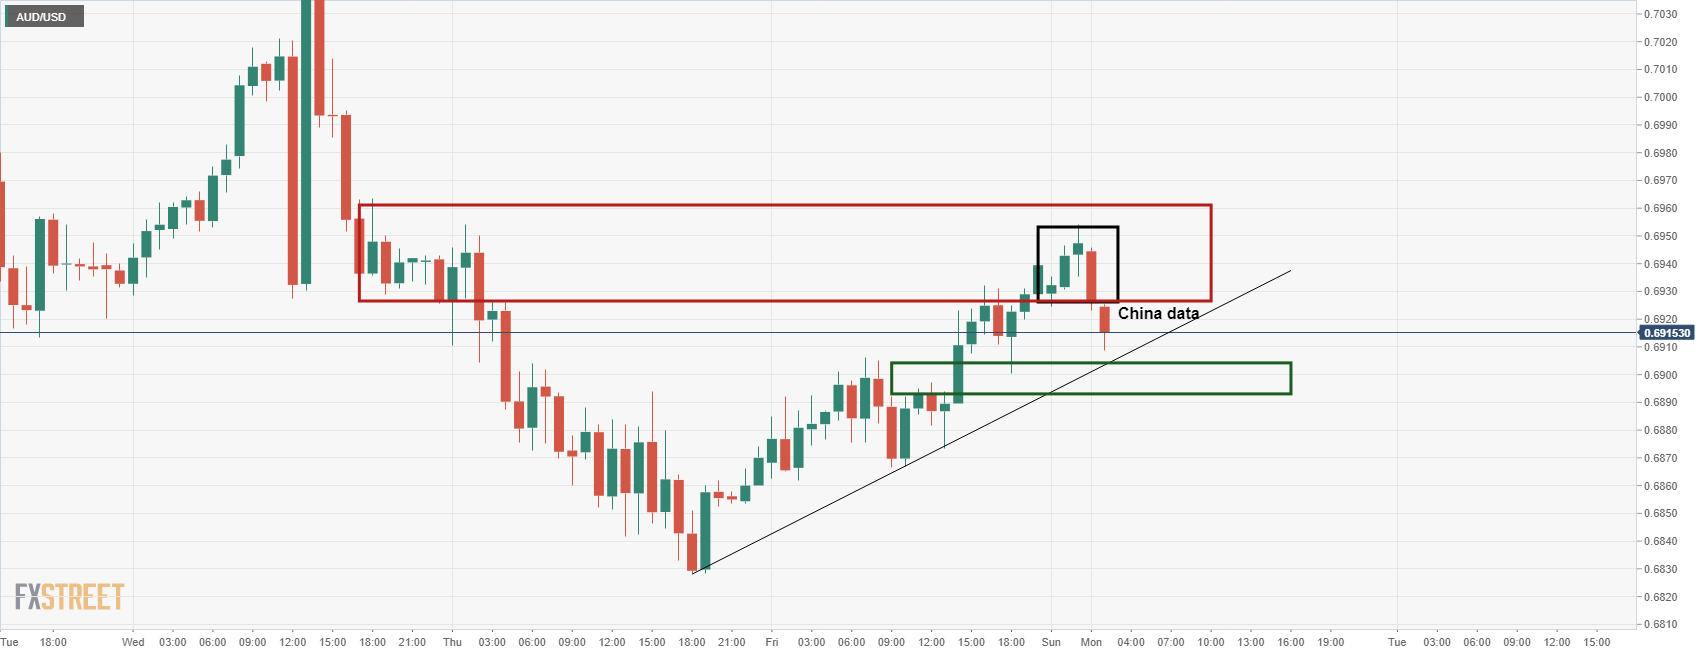
About the Chinese Retail Sales
The Retail Sales report released by the National Bureau of Statistics of China measures the total receipts of the retailed consumer goods. It reflects the total consumer goods that the various industries supply to the households and social groups through various channels. It is an important indicator to study the changes in the Chinese retail market and reflect the degree of economic prosperity. In general, A high reading is seen as a positive (or bullish) CNY, while a low reading is seen as a negative (or bearish) for CNY.
- Market sentiment remains cautiously optimistic amid a quiet session.
- Powell’s 50 bps rate hike, downbeat US data join hopes of faster recovery from covid to underpin positive mood.
- PBOC holds MLF rate unchanged ahead of the key data dump from China.
- US Retail Sales, risk catalysts eyed for fresh impulse.
Global traders keep the previous day’s upbeat mood, despite failing to bolster the bullish bias, amid a quiet Asian session on Monday. The market sentiment remains mildly positive as the latest Fedspeak and the US data join positive headlines from China to keep buyers hopeful. However, geopolitical fears from Europe remain on the table to test the optimism.
While portraying the mood, the S&P 500 Futures print mild gains after the Wall Street benchmarks rallied the previous day. Further, the US 10-year Treasury yields also extend Friday’s recovery moves, up 1.5 basis points (bps) around 2.95% by the press time.
That said, downbeat prints of the US Michigan Consumer Sentiment Index for May, backed by Fed Chair Jerome Powell’s repetition of 50 bps rate hikes concerns, triggered the market’s rebound the previous day.
The positive mood also took clues from the downbeat US inflation expectations, as per the 10-year breakeven inflation rate per the St. Louis Federal Reserve (FRED) data. That said, the inflation precursor dropped to the lowest levels since late February, before portraying a corrective pullback to 2.69%.
Furthermore, hopes of easing the virus spread in China spread optimism in Asia as the latest covid update from Reuters suggests softer numbers from Shanghai. “Chinese financial hub Shanghai reported 869 new local asymptomatic coronavirus cases for May 15, down from 1,203 a day earlier. Confirmed symptomatic cases fell to 69, from 166 the previous day, data released on Monday showed,” said the news.
It’s worth noting that the People’s Bank of China’s (PBOC) refrains from any change in the Medium-Term Lending Facility (MLF) rate, for 1-year it's around 2.85% at the latest, also keeps the traders hopeful.
Meanwhile, worsening geopolitical concerns in Ukraine joins the European Union’s (EU) plan for more sanctions on Russia to weigh on sentiment. Also challenging the mood are broad fears over inflation and economic growth moving forward, mainly due to the covid resurgence in China and the Russia-Ukraine tussles, not to forget tighter monetary policies.
Given the light calendar on Monday, except for China’s Retail Sales and Industrial Production (IP) data, market players may extend Friday’s moves with eyes on qualitative catalysts. That said, the traders’ rush for clues to confirm the global economic challenges surrounding inflation also highlights this week’s US Retail Sales data for April as the key factor to follow.
Also read: Macro and Prices: Sentiment swings between inflation and recession
- USD/JPY stays firmer around intraday high, extends bounce off 13-day low.
- 100-SMA, monthly horizontal resistance challenge recovery moves.
- Firmer RSI line joins bullish MACD signals to keep buyers hopeful.
- Weekly resistance line, double tops around 131.25-30 challenge further upside.
USD/JPY remains on the front foot at around 129.50, keeping the previous day’s rebound from a two-week low during Monday’s Asian session. In doing so, the bulls attack a short-term key horizontal resistance area, also comprising the 100-SMA.
Given the recently firmer RSI and upbeat MACD signals, the yen pair is likely to extend the latest recovery moves beyond the immediate hurdle surrounding 129.50.
Even so, a downward sloping trend line from May 09, near 130.20, will challenge the USD/JPY buyers.
It’s worth noting that the quote’s upside past-130.20 will aim for the key hurdles surrounding 131.25-30, including double tops marked in the last three weeks, a break of which won’t hesitate to challenge the 132.00 threshold.
Meanwhile, pullback moves may aim for the early month low around 128.60 before directing the USD/JPY sellers towards the monthly bottom of 127.51.
Should the quote USD/JPY prices remain weak past 127.51, the late April swing low near 127.00 will be in focus.
USD/JPY: Four-hour chart
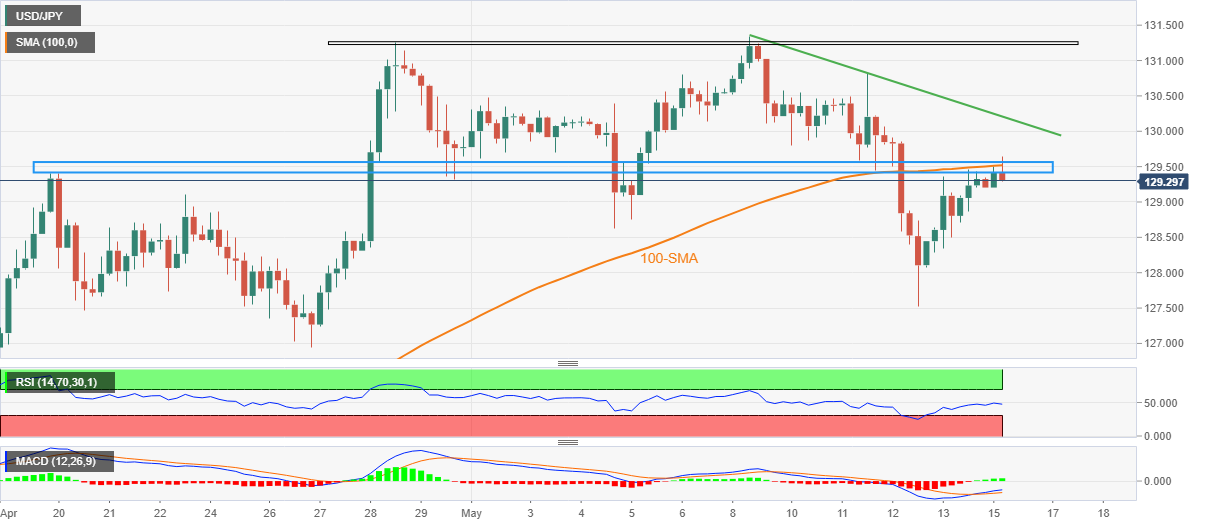
Trend: Further upside expected
In recent trade today, the People’s Bank of China (PBOC) left the 1-year MLF interest rate unchanged at 2.85% and set the yuan (CNY) at 6.7871 vs the previous fix 6.7898 and previous close of 6.7900.
About the fix
China maintains strict control of the yuan’s rate on the mainland.
The onshore yuan (CNY) differs from the offshore one (CNH) in trading restrictions, this last one is not as tightly controlled.
Each morning, the People’s Bank of China (PBOC) sets a so-called daily midpoint fix, based on the yuan’s previous day closing level and quotations taken from the inter-bank dealer.
- USD/CHF is hovering around 1.0020 amid a light economic calendar on Monday.
- Fed Powell has hinted at two more jumbo rate hikes by the end of the year.
- An outperformance is expected from the US Retail Sales as it may land at 0.7% on monthly basis.
The USD/CHF pair is oscillating in a narrow range of 1.0020-1.0030 in early Tokyo as the US dollar index (DXY) is not getting much traction amid the light economic calendar on Monday. Although broad-based fundamentals are still favoring the greenback bulls as the Federal Reserve (Fed) is expected to paddle up the interest rates by one more big number in June to contain the inflation mess.
Last week, Fed’s Powell interview with the Marketplace national radio program unveiled the ongoing discussions between the Fed policymakers over the rate hikes in upcoming monetary policies. Fed Powell dictated that the Fed could announce two more bumper rate hikes in the next two monetary policy meetings consecutively to rein in the roaring inflation.
Meanwhile, the US dollar index (DXY) is balancing in a 104.46-104.60 range after printing a fresh 19-year high of 105.00 on Friday. The DXY is enjoying the broader strength but seeks more triggers to sustain strength. Going forward, two major events on Tuesday will keep investors busy. First will be the speech from Fed Powell, which will dictate the likely monetary policy action in June. The second important event is monthly US Retail Sales, which is seen at 0.7% against the prior print of 0.5%.
On the Swiss franc front, Friday’s Industrial Production data will hog the limelight. The catalyst landed at 7.3% last time. A higher-than-expected figure will support the Swiss franc against the greenback.
- Gold keeps the bounce off three-month low amid cautious optimism.
- DXY extends pullback from 20-year low as softer data joins Powell’s 50 bps rate hike view.
- Covid hopes from China add strength to the market’s mild risk-on mood.
- Gold Weekly Forecast: XAU/USD looks to test $1,800 with sellers retaining control
Gold (XAU/USD) picks up bids to refresh its intraday high around $1,815, extending Friday’s U-turn from a three-month low. The metal’s recent run-up could be linked to a softer USD and cautious optimism in the market amid Monday’s quiet Asian session.
That said, the US Dollar Index (DXY) remains pressured around 104.50 after taking a U-turn from a 20-year high the previous day. In doing so, the greenback gauge justifies downbeat prints of the US Michigan Consumer Sentiment Index for May backed by Fed Chair Jerome Powell’s repetition of 50 bps rate hikes concerns.
Elsewhere, hopes of easing the virus spread in China spread optimism in Asia as the latest covid update from Reuters suggests softer numbers from Shanghai. “Chinese financial hub Shanghai reported 869 new local asymptomatic coronavirus cases for May 15, down from 1,203 a day earlier. Confirmed symptomatic cases fell to 69, from 166 the previous day, data released on Monday showed,” said the news.
On the contrary, worsening geopolitical concerns in Ukraine joins the European Union’s (EU) plan for more sanctions on Russia to weigh on sentiment. Also challenging the mood are broad fears over inflation and economic growth moving forward, mainly due to the covid resurgence in China and the Russia-Ukraine tussles, not to forget tighter monetary policies.
Amid these plays, the S&P 500 Futures print mild gains after the Wall Street benchmarks rallied the previous day. Further, the US 10-year Treasury yields also extend Friday’s recovery moves, up 1.5 basis points (bps) around 2.95% by the press time.
Looking forward, investors will seek more clues to confirm the global economic challenges surrounding inflation, which in turn highlights this week’s US Retail Sales data for April. Meanwhile, qualitative catalysts mentioned above may entertain gold buyers.
Technical analysis
Although oversold RSI conditions triggered XAU/USD rebound from the lowest levels since February, the precious metals remain below the previous key support line from August 2021, around $1,830 by the press time.
Also challenging the recovery moves is a confluence of the 200-DMA and 61.8% Fibonacci retracement of August 2021 to March 2022 upside, around $1,835.
Even if the gold prices rally beyond $1,835, a downward sloping resistance line from April 18 will challenge the bulls at around $1,865.
On the contrary, the $1,800 threshold and lows marked during January 2022, around $1,780, lure gold sellers during fresh downside.
Gold: Daily chart
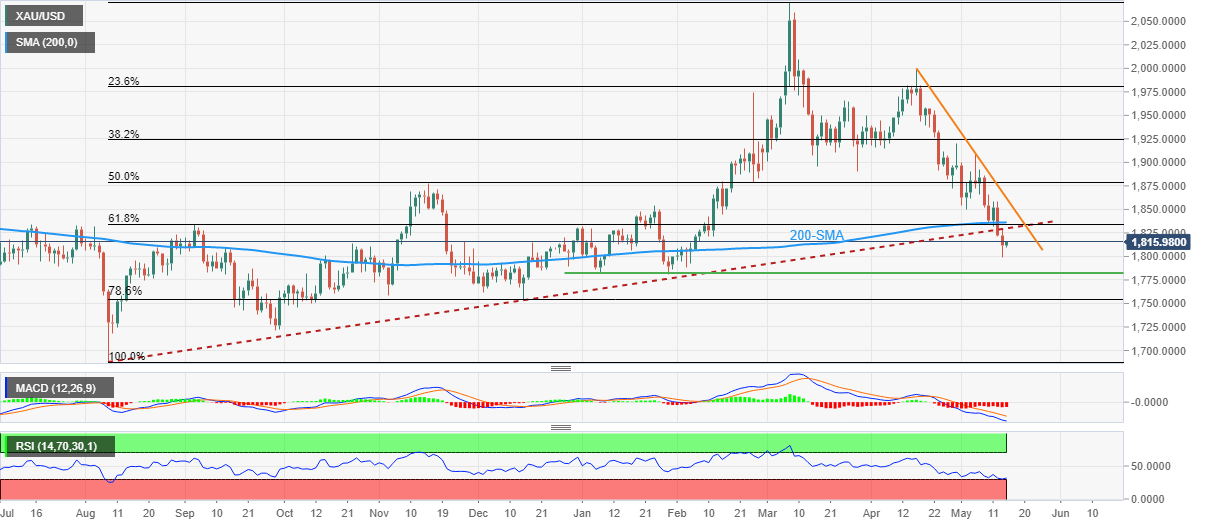
Trend: Bearish
- US dollar under pressure but battles back into the open.
- Bulls meeting resistance on the 4-hour time frame.
The FX space has undergone appreciable moves of late and the US dollar moved into the 105 figure on Thursday only to be met with offers on Friday.
The dollar came under pressure due to a rally in equities that had contributed to a risk-on mood but was still set for a sixth straight week of gains due to ebbing global growth and worries over higher rates. Stagflation is on the lips of economic observers' although readings have recently started to show some signs of relief with regard to inflation pressures.
In that regard, Federal Reserve officials will continue to provide remarks in the upcoming week on the heels of a strong Consumer Price Inflation report, which although was missing the mark vs. expectations, the data has cemented the urgency to move quickly to a more neutral policy stance.
Most key will be Chair Jerome Powell's participation at a WSJ Q&A. NY Fed's John Williams remarks are also likely to grab the spotlight. "Any chatter about the possibility of MBS sales would also garner attention," analysts at TD Securities said.
Then, for data, the analysts explained that they look for Retail Sales to advance firmly in April (1.5%), continuing with the monthly gains registered so far this year. "Spending was likely aided by a strong rebound in auto purchases and an increase in control group sales. We also look for a 1%+ MoM gain in the eating/drinking segment (i.e. bars & restaurants) as consumers continue to transition away from goods spending."
DXY H4 chart
| Index | Change, points | Closed | Change, % |
|---|---|---|---|
| NIKKEI 225 | 678.93 | 26427.65 | 2.64 |
| Hang Seng | 518.43 | 19898.77 | 2.68 |
| KOSPI | 54.16 | 2604.24 | 2.12 |
| ASX 200 | 134.1 | 7075.1 | 1.93 |
| FTSE 100 | 184.9 | 7418.2 | 2.56 |
| DAX | 288.29 | 14027.93 | 2.1 |
| CAC 40 | 156.42 | 6362.68 | 2.52 |
| Dow Jones | 466.36 | 32196.66 | 1.47 |
| S&P 500 | 93.81 | 4023.89 | 2.39 |
| NASDAQ Composite | 434.04 | 11805 | 3.82 |
- GBP/JPY grinds higher after bouncing off two-month low.
- UK PM Johnson reiterates plan to alter NIP amid hopes of EU’s easing stance.
- Likely improvement in British Manufacturing, cautious optimism elsewhere also favor bulls.
- Brexit headlines, UK employment report becomes important for near-term directions, risk catalysts are crucial too.
GBP/JPY picks up bids to renew intraday high around 158.75, extending the previous day’s recovery moves, as Tokyo opens for Monday’s trading. The cross-currency pair’s latest rebound could be linked to the firmer sentiment and mostly positive headlines concerning Brexit.
UK PM Boris Johnson braces for altering the Northern Ireland Protocol (NIP) with hopes of a change in the European Union’s (EU) position. The UK government is expected to reveal plans for unilateral changes in NIP on Tuesday. The bloc, however, previously warned of such actions with a cut in a trade deal with Britain.
On the other hand, the Financial Times (FT) conveyed optimism at the British manufacturers as they jostle to ease the supply chain concerns. “Three-quarters of companies have increased the number of their British suppliers in the past two years, according to a survey by Make UK, the manufacturers’ trade group,” said the news.
Elsewhere, hopes of easing virus spread in China join the Fed Chairman Jerome Powell’s static view of a 50 bps rate hike in the next two meetings, coupled with the downbeat US sentiment data, to underpin the market’s cautious optimism of late.
It’s worth noting, however, that the ongoing virus-led activity restrictions in China join worsening geopolitical conditions in Donbas to probe the GBP/JPY buyers.
While portraying the mood, the S&P 500 Futures print mild gains after the Wall Street benchmarks rallied the previous day. Further, the US 10-year Treasury yields also extend Friday’s recovery moves, up 1.5 basis points (bps) around 2.95% by the press time.
Looking forward, GBP/JPY traders may take clues from the risk catalysts amid a light calendar at home. However, Tuesday’s UK employment figures and Brexit updates will be crucial for clear directions.
Technical analysis
A one-month-old descending trend channel formation restricts short-term GBP/JPY moves between 160.60 and 154.85.
- The cable is attempting to overstep its potential resistance at 1.2266.
- An establishment above the 50-EMA adds to the upside filters.
- The RSI (14) is trading back and forth in a 40.00-60.00 range, which signals a rangebound move.
The GBP/USD pair is displaying back and forth moves in a narrow range of 1.2236-1.2266 in the early Tokyo session. The asset has been gradually scaling higher after hitting a low of 1.2173 on Friday as risk-perceived currencies found significant interest.
An upside break of the cable from its previous range of 1.2173-1.2248 has underpinned the pound against the greenback. The pair is hovering near its crucial horizontal resistance placed from May 9 high at 1.2262. The trendline placed from March 5 high at 1.2663, adjoining the previous week’s high a 1.2400 will act as a major barricade ahead.
An establishment above the 50-period Exponential Moving Average (EMA) at 1.2233 is advocating bulls for further upside. However, the asset is still lower from 200-EMA at 1.2340, which signals that a downside bias persists.
The momentum oscillator, Relative Strength Index (RSI) (14) is oscillating in a 40.00-60.00 range, which signals a directionless move going forward.
Investors should consider a bullish move in the asset if it oversteps the above-mentioned trendline at 1.2300. This will send the asset towards the previous week’s high at 1.2400, followed by May 9 high at 1.2662.
Alternatively, greenback bulls could regain control if the asset drops below Friday’s low at 1.2173, which will send the asset towards the 18 May 2020 low at 1.2075. A breach of the latter will drag the cable towards 25 March 2020 high at 1.1973.
GBP/USD hourly chart
-637882570553272046.png)
| Pare | Closed | Change, % |
|---|---|---|
| AUDUSD | 0.69404 | 1.19 |
| EURJPY | 134.537 | 0.88 |
| EURUSD | 1.0408 | 0.25 |
| GBPJPY | 158.47 | 1.15 |
| GBPUSD | 1.22598 | 0.51 |
| NZDUSD | 0.62892 | 0.93 |
| USDCAD | 1.29084 | -1.06 |
| USDCHF | 1.00204 | -0.11 |
| USDJPY | 129.258 | 0.62 |
- NZD/USD bears are sinking in their teeth in the Tokyo open.
- The bulls eye a break of daily resistance.
NZD/USD is under pressure from daily resistance at this juncture for the open but the weekly chart is overstretched, relatively and corrections to the upside could be on the cards for the sessions ahead. The following illustrates this from a weekly and daily perspective.
NZD/USD weekly chart
The price is still offering some prospects of a move to the downside but the overextendedness of the weekly bearish impulse is likely in need of a correction. This could correct as far as the prior support and beyond 0.64 the figure. However, there is a build-up of daily resistance ahead as follows:
NZD/USD daily chart
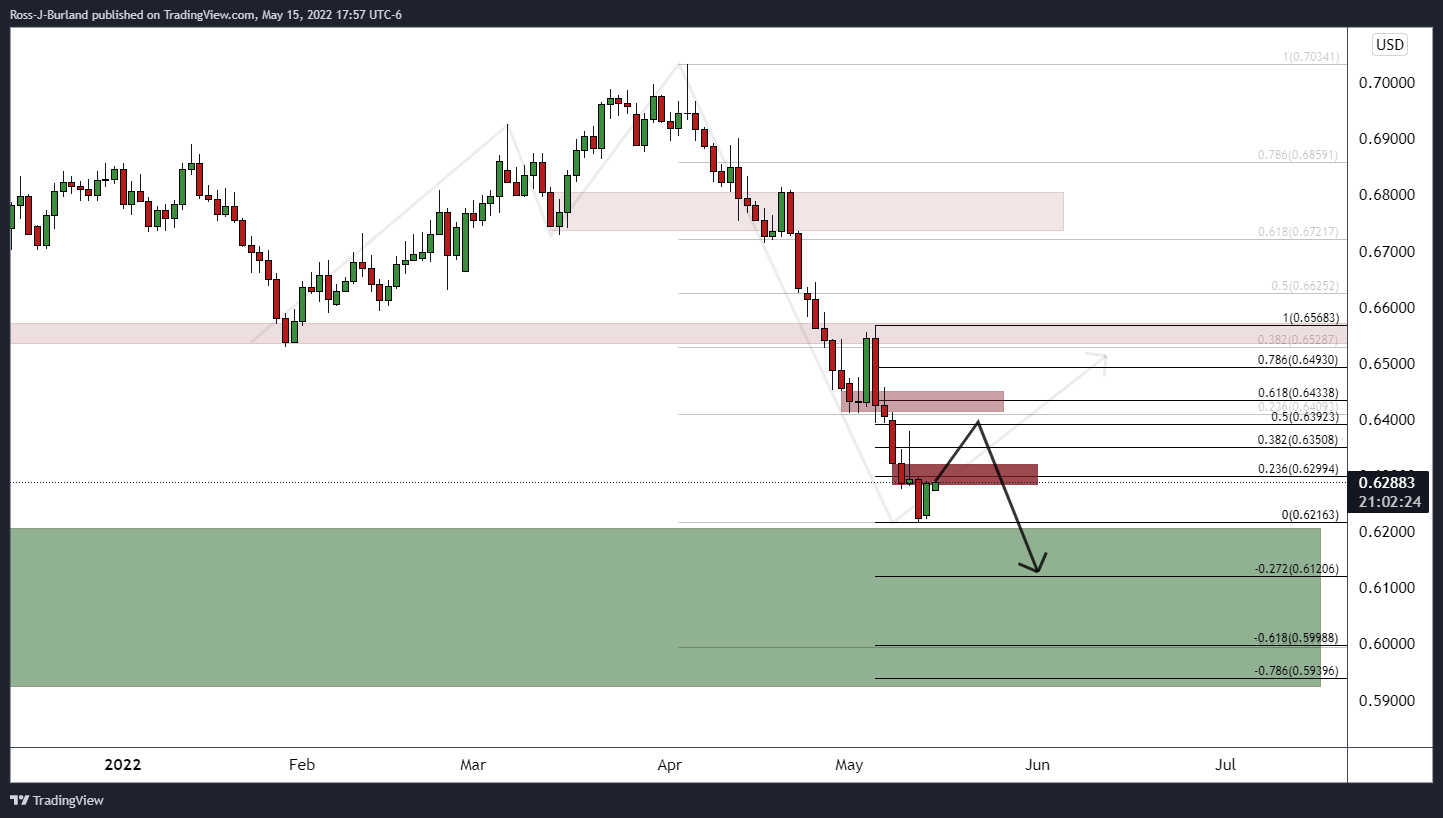
From a daily perspective, the price is meeting structure but a break of that could open the wat to prior levels that would be expected to act as resistance and failures there will pave the way to the next bearish impulse. Failing that, the price goes offered and moves into the weekly target from here considering how much potential resistance there already is at this point.
- DXY remains pressured after reversing from 20-year high.
- Three-week-old support line restricts immediate downside, monthly horizontal area tests bears.
- Bulls need clear break of 105.00 to aim for fresh multi-month high.
US Dollar Index (DXY) extends Friday’s pullback moves around 104.50 during a quiet Asian session on Monday.
In doing so, the greenback gauge justifies recently downbeat MACD signals to approach a three-week-old rising trend line support, near 104.10 by the press time.
However, multiple levels since April 28, around 103.90, restrict DXY’s weakness past 104.10.
Should the quote drop below 103.90, further downside towards the 103.00 threshold and then in direction to the monthly low of 102.34 can’t be ruled out.
Meanwhile, fresh recovery moves need to stay beyond the 105.00 round figure to aim for the September 2020 lows surrounding 105.6.
Following that, the late 2020 peak near 107.40 could lure DXY bulls.
Overall, US Dollar Index seems running out of steam to renew multi-year. The pullback moves, however, have limited downside to cheer.
DXY: Four-hour chart
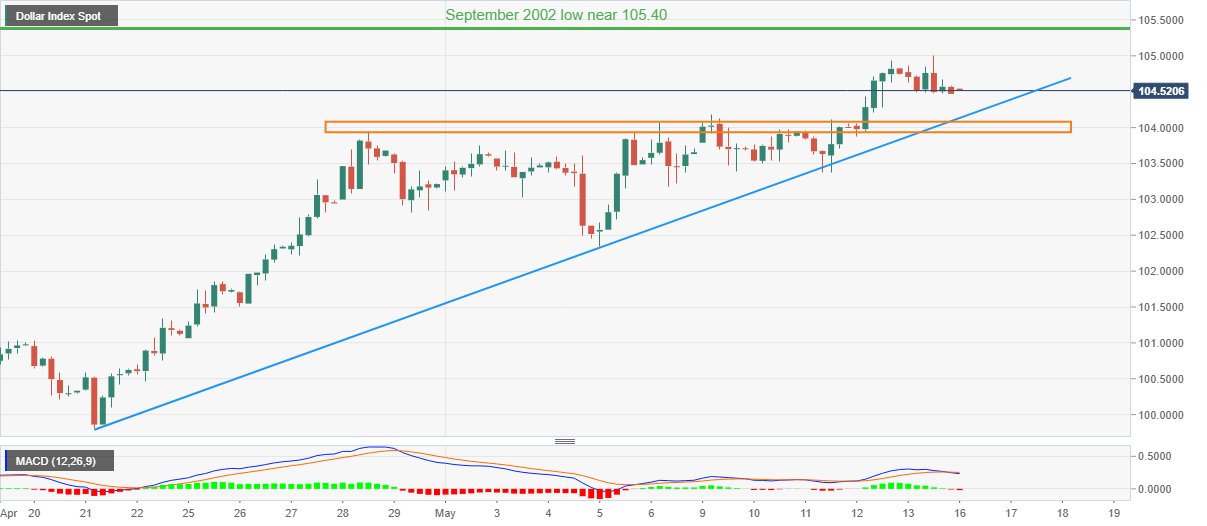
Trend: Further weakness expected


© 2000-2026. All rights reserved.
This site is managed by Teletrade D.J. LLC 2351 LLC 2022 (Euro House, Richmond Hill Road, Kingstown, VC0100, St. Vincent and the Grenadines).
The information on this website is for informational purposes only and does not constitute any investment advice.
The company does not serve or provide services to customers who are residents of the US, Canada, Iran, The Democratic People's Republic of Korea, Yemen and FATF blacklisted countries.
Making transactions on financial markets with marginal financial instruments opens up wide possibilities and allows investors who are willing to take risks to earn high profits, carrying a potentially high risk of losses at the same time. Therefore you should responsibly approach the issue of choosing the appropriate investment strategy, taking the available resources into account, before starting trading.
Use of the information: full or partial use of materials from this website must always be referenced to TeleTrade as the source of information. Use of the materials on the Internet must be accompanied by a hyperlink to teletrade.org. Automatic import of materials and information from this website is prohibited.
Please contact our PR department if you have any questions or need assistance at pr@teletrade.global.
transfers