- Analytics
- News and Tools
- Market News
CFD Markets News and Forecasts — 12-05-2022
- EUR/JPY bulls are moving in following a hard landing on Thursday.
- Risk-off tones have put a bid in the yen and the euro has been pressured.
EUR/JPY was pressured by a strong US dollar and risk-off tones with news relating to tensions between Europe and Russia that escalated again Thursday when Finland said it would apply to join NATO "without delay." Sweden is expected to follow. Russia has said it will be forced to take "retaliatory steps" and this has led to a bid in the yen as the following technical analysis illustrates.
EUR/JPY weekly chart
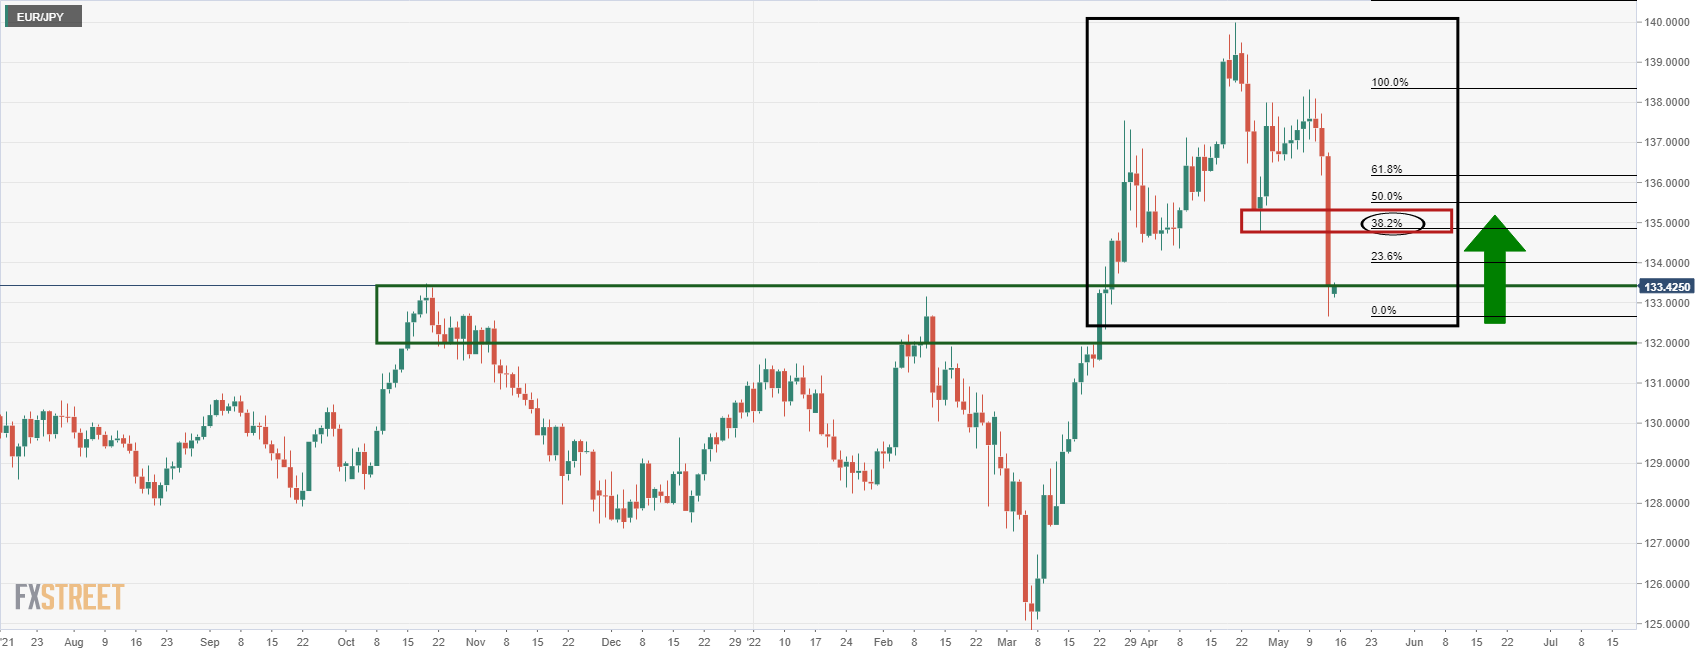
The weekly chart shows that the price is making its way into a key demand area. The M-formation is a reversion pattern so there are prospects of a bullish correction that could be underway.
EUR/JPY daily chart

As it stands, the 38.2% Fibonacci on the daily chart has a confluence of prior lows and support.
- AUD/USD rebounds from 23-month low as bears take a breather after the biggest daily fall since Monday.
- US Treasury yields, stock futures print mild gains to portray market’s consolidation amid a light calendar and fewer macros.
- Comments from Fed’s Powell, Daly also seemed to have paused the bear run of late.
- RBA’s Bullock eyed for the pace of the next rate hike, US Michigan Consumer Sentiment data will be important too.
AUD/USD bears step back from two-year low as the quote refreshes intraday peak near 0.6875 during an inactive Asian session on Friday.
The Aussie pair’s latest rebound from the multi-month low lacked any major change in the macros. However, improvement in the key risk barometers and optimism ahead of a speech from RBA Assistant Governor (Financial System) Michele Bullock could be cited as favoring the latest run-up in the quote.
That said, the US 10-year Treasury yields also portray a corrective pullback after refreshing a two-week low the previous day, around 2.86% by the press time, whereas the S&P 500 Futures print mild gains while licking its wound near one-year low.
Comments from Fed Chair Jerome Powell and San Francisco Fed President Mary Daly could also be linked to the AUD/USD pair’s latest rebound. Fed’s Powell repeated the expectation that the Fed will raise interest rates by half a percentage point at each of its next two policy meetings. The Fed boss also pledged that if data turn the wrong way "we're prepared to do more." On the same line, Fed’s Daly mentioned, “Is it 50, is it 25, is it 75? Those are things that I’ll deliberate with my colleagues, but my own starting point is we don’t want to go so quickly or so abruptly that we surprise Americans”.
It should be noted that the broad risks concerning inflation, economic growth and China’s covid, not to forget the Ukraine-Russia crisis, remain as is, which in turn challenges the AUD/USD buyers despite the latest rebound.
Also, RBA’s Bullock need not cite the economic fears from China’s lockdowns and rallying inflation to keep the AUD/USD on the road to recovery, failing to do so can renew the multi-day bottom marked the previous day.
Following that, the preliminary readings of US Michigan Consumer Sentiment data for May, expected 64 versus 65.2 prior, will be eyed for fresh impulse.
Technical analysis
AUD/USD recovery moves remain doubtful until crossing the early month’s swing low surrounding 0.7030. That said, the 50% Fibonacci retracement (Fibo.) of March 2020 to February 2021, around 0.6760, lures the bears of late.
- An intense sell-off is expected to be followed by a pullback to near the 20-EMA.
- The RSI (14) is hovering in a bearish range of 20.00-40.00, which adds to the downside filters.
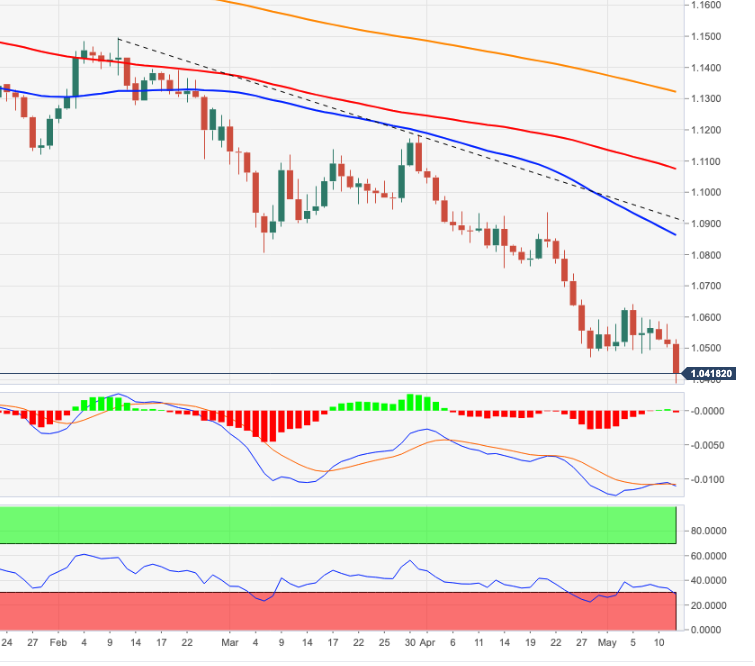
- The asset is likely to print a fresh 19-year low after violating Thursday’s low at 1.0356.
The EUR/USD pair is advancing higher at a nominal pace after printing a low of 1.0355 on Thursday. The asset has extended its losses after witnessing a downside break of a tad wider consolidation placed in a range of 1.0471-1.0642 from April’s last week. In the Asian session, the asset is oscillating in an extremely narrow range of 1.0375-1.0384, which is likely to be followed by a firmer volatility expansion.
On the hourly scale, the shared currency bulls have been through an extreme sell-off after breaking below May’s range of 1.0471-1.0642. This will be followed by a minor bullish pullback to near the 20-period Exponential Moving Average (EMA) at 1.0418 as initiative sellers will kick in. The 50-EMA at 1.0460 is declining sharply, which adds to the downside filters.
Meanwhile, the Relative Strength Index (RSI) (14) is oscillating in a bearish range of 20.00-40.00, which signals more pain ahead.
A pullback move to near the 20-EMA at 1.0418 will trigger an initiative selling action that will drag the asset towards Thursday’s low at 1.0356, followed by the round level support at 1.0300.
On the flip side, euro bulls could regain control if the asset oversteps May 6 high at 1.0600, which will drive the asset higher towards May 5 high and April 25 low at 1.0642 and 1.0700 respectively.
EUR/USD hourly chart
-637879964033737148.png)
- NZD/USD pares recent losses around the lowest levels since May 2020.
- New Zealand’s Business NZ PMI eased to 51.2 in April.
- Fed’s Powell reiterates 50 bps rate hike concerns, Fed’s Daly turns down debate on the pace of rate lifts.
- Risk-aversion keeps USD firmer, US Michigan Consumer Sentiment Index eyed.
NZD/USD picks up bids to 0.6245 while portraying a corrective pullback from the lowest levels in 24 months, flashed on Thursday, as bears take a breather amid a quiet Asian session on Friday. In doing so, the Kiwi pair ignores recently softer activity data from New Zealand (NZ).
That said, Business NZ PMI dropped to 51.2, below 52.8 market forecasts and 53.8 prior, in April. The activity data part ways from the previous day’s upbeat inflation expectations from the Reserve Bank of New Zealand (RBNZ) that raised concerns about the Kiwi central bank’s widely chattered 50 basis points (bps) of a rate hike in June.
It’s worth noting, however, that the kiwi pair’s latest rebound isn’t a sign of recovery as broad economic fears join the Fed’s faster tightening to keep the US dollar ahead of everybody on the currency platter. That said, the US Dollar Index (DXY) refreshed its 20-year high around 105.00 on Thursday, before easing to 104.80 afterward.
The latest pullback in the greenback gauge could be linked to comments from Fed Chairman Jerome Powell as he repeated the expectation that the Fed will raise interest rates by half a percentage point at each of its next two policy meetings. The Fed boss also pledged that if data turn the wrong way "we're prepared to do more." On the same line were statements from President and CEO of the Federal Reserve Bank of San Francisco, Mary C. Daly who mentioned, “Is it 50, is it 25, is it 75? Those are things that I’ll deliberate with my colleagues, but my own starting point is we don’t want to go so quickly or so abruptly that we surprise Americans”.
Amid these plays, the US 10-year Treasury yields also portray a corrective pullback after refreshing a two-week low the previous day, around 2.86% by the press time, whereas the S&P 500 Futures print mild gains while licking its wound near one-year low.
Moving on, the preliminary readings of US Michigan Consumer Sentiment data for May, expected 64 versus 65.2 prior, will be important data to watch but major attention should be given to qualitative catalysts for clear directions.
Technical analysis
Unless crossing the mid-2020 lows surrounding 0.6380, NZD/USD prices are vulnerable to testing April 2020 peak of 0.6176.
- WTI grinds higher past $105.00 after two-day uptrend.
- Steady RSI, DMA breakout keeps buyers hopeful to challenge 50% Fibo.
- Monthly support line appears a tough nut to crack for bears during the pullback.
WTI crude oil prices seem defensive at around $105.00 during Friday’s Asian session, after rising to a four-day high on crossing the 21 and 50 DMAs the previous day.
The black gold’s latest inaction fails to disappoint buyers, backed by the key DMA breakout and steady RSI.
That said, the commodity’s upside momentum remains bumpy as the 50% Fibonacci retracement of February-March upside, around $107.00, appears the nearby key hurdle for buyers to tackle before heading towards the resistance line from late March, near $109.30.
It’s worth noting that, the black gold’s rally beyond $109.30 needs validation from the monthly high near $110.35 to aim for late March’s peak surrounding $115.85.
On the contrary, the 50-DMA and the 21-DMA may initially challenge the quote’s pullback moves respectively around $104.10 and $103.65.
Following that, the 61.8% Fibo. and an upward sloping support line from April 11, close to $102.30 and $98.80 in that order, will challenge the WTI bears.
Overall, WTI is up for further advances but there prevails a bumpy road to the north until the quote stays below $109.30
WTI: Daily chart
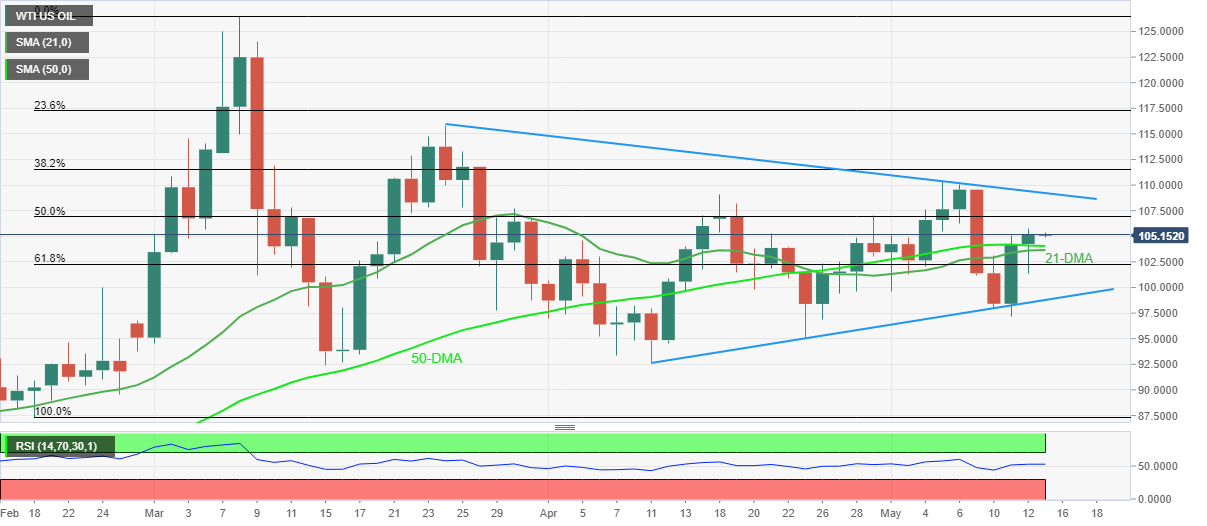
Trend: Further upside expected
- USD/CAD is failing to establish above 1.3050 as oil prices recover Wednesday’s losses.
- Feds Powell is focusing more on price stability and warns of more than two 50 bps rate hikes this year.
- Inflationary pressures are deteriorating the paychecks of the households.
The USD/CAD pair is struggling to sustain above the crucial resistance of 1.3050 as oil prices have rebounded sharply after a mild correction. The asset has juggled in a range of 1.2922-1.3074 the whole week and is likely to display a sheer move going forward.
The odds of a spree of 50 basis point (bps) rate hike by the Federal Reserve (Fed) have strengthened. As per the interview of Fed chair Jerome Powell with Marketplace national radio program, the Fed is expected to raise interest rates by half a percentage point at each of its next two policy meetings. Also, Powell added that the Fed is prepared to do more if data turns the wrong way.
The statement clears that investors should brace for at least more than two rate hikes by 50 bps this year. The price pressures are depreciating the paychecks of the households in the US and price stability is highly needed to stabilize the economy from inflationary shocks.
On the oil front, a rebound in the oil prices after a corrective Wednesday has frozen the asset in a tight range. Lowering restrictions to contain Covid-19 in China has trimmed the fears of demand worries. The oil prices have overstepped $105.00 and are expected to advance further. A pending embargo on oil imports from Russia by Europe will keep the oil prices on edge. The US relies heavily on imports of oil from Canada, therefore higher oil prices are acting as headwinds for the asset.
Amid the sustained fall in US Treasury yields, in contrast to the market’s inflation fears, the US inflation expectations, as per the 10-year breakeven inflation rate per the St. Louis Federal Reserve (FRED) data, dropped to the lowest levels since February 25.
In doing so, the inflation gauge reversed the mid-week rebound from the lowest levels since early March by flashing a 2.59% figure by Thursday’s end of the North American trading session.
Given the market’s rush to risk-safety, the yields have been ignored of late, which n turn weighs on the inflation expectations despite reflation woes. However, the Fedspeak has been hawkish and maintains a view of more than two rate hikes in 2022, although the size of the rate hike being 75 bps is a question.
Hence, although the inflation expectations have recently refreshed multi-day low, the fears of tighter monetary policy and price pressure may remain elevated until the quote drops below the early 2022 levels.
Read: Climbing down from peak inflation looks increasingly challenging
- Silver prices stabilize around 22-month low after the biggest drop in eight months.
- Clear break of 50% Fibonacci retracement level directs bears toward September 2019 peak.
- Corrective pullback needs validation from eight-month-old horizontal resistance, previous support.
Silver (XAG/USD) bears take a breather after the biggest daily fall since September 2021, taking rounds to $20.60-80 during Friday’s Asian session.
The bright metal dropped to the lowest levels since July 2020 the previous day while breaking the 50% Fibonacci retracement (Fibo.) of its run-up from March 2020 to February 2021.
In addition to the downside break of the key Fibo. level, bearish MACD signals and broad risk-off mood also keep XAG/USD sellers hopeful to visit the September 2019 high, around $19.65.
That said, the $20.00 psychological magnet may offer an intermediate halt during the fall whereas February 2020 high of around $19.00 could lure the silver bears past $19.65.
Alternatively, the corrective pullback may initially aim for the aforementioned Fibonacci retracement level near $20.85.
Following that, lows marked during September and December 2021, close to $21.40, could challenge the silver buyers.
Silver: Daily chart
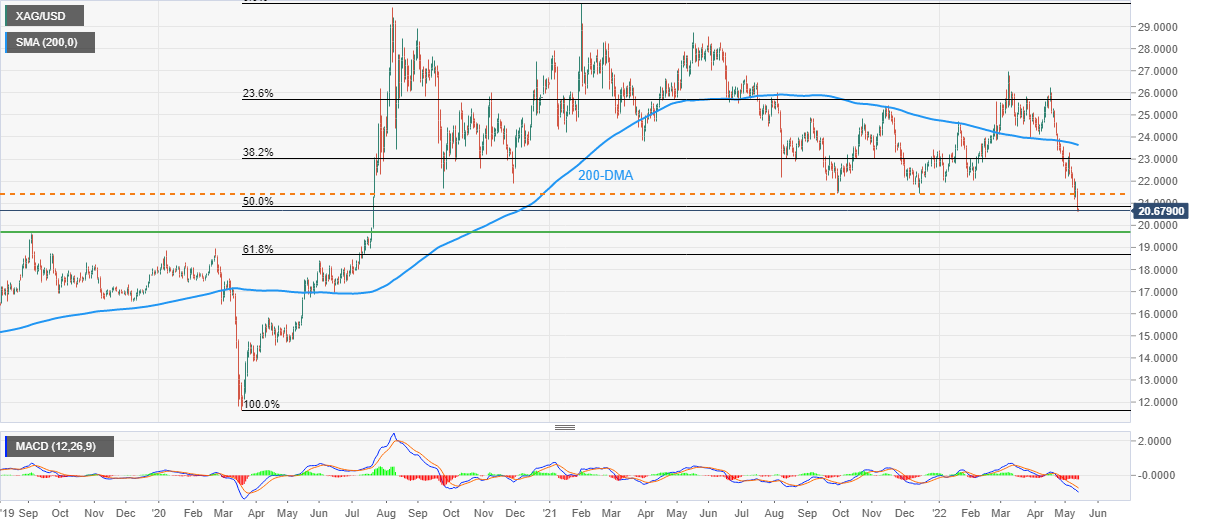
Trend: Bearish
- GBP/USD bears take a breather around two-year low after six-day downtrend.
- Flight to safety fuels US dollar, firmer data, Fed concerns add strength to the run-up.
- UK data, Brexit fears join inflation fears of BOE’s Ramsden to weigh on Sterling.
- US Michigan Consumer Sentiment to decorate calendar, risk catalysts are the key for clear directions.
GBP/USD licks its wounds near 1.2200, after refreshing a two-year low during the uninterrupted fall in the last six days, during the initial Asian session on Friday. In addition to the broad US dollar strength, pessimism surrounding Brexit and the UK’s economic fears are extra negatives that drowned the cable during the last few days.
The US Dollar Index (DXY) refreshed its 20-year high as traders rushed to the greenback in search of risk safety. Market’s fears were mainly propelled by the inflation woes that push global central bankers toward dialing back the easy money and challenging the already weary economic growth. Also challenging the sentiment are the negative impacts of the Russia-Ukraine crisis and China’s covid.
At home, Bank of England (BOE) Deputy Governor Dave Ramsden conveyed fears of prolonged higher inflation, which in turn raised worries for economic growth. The concerns become grim especially when the UK reports downbeat data.
That said, the UK’s first readings of the Q1 2022 GDP eased to 0.8% QoQ, below 1.0% forecasts while the monthly negative print of -0.1% for March, versus +0.1% expected and prior, gains major attention and drown the GBP/USD prices. Other than the UK GDP, Industrial Production and Manufacturing Production for March also disappoint the cable traders and add strength to the bearish bias.
It should be noted that British PM Boris Johnson’s likelihood of repealing part of the Brexit deal, relating to the Northern Ireland Protocol (NIP), joins the Western sanctions on Russia to exert additional downside pressure on the GBP/USD prices.
Amid these plays, Wall Street saw the red while the US Treasury yields renewed their weekly low to 2.85%, down 5.8 basis points (bps).
Looking forward, the preliminary readings of US Michigan Consumer Sentiment data for May, expected 64 versus 65.2 prior, will decorate the calendar but major attention will be given to headlines concerning risk-off mood, Brexit and inflation for clear directions.
Technical analysis
Although oversold RSI teases a corrective pullback towards June 2020 low surrounding 1.2250, buyers aren’t likely to take risks unless witnessing a clear run-up beyond a three-week-old resistance line, around 1.2390 by the press time.
On the contrary, May 2020 bottom surrounding 1.2075 and the 2000 psychological magnet lure sellers.
- A pullback to near 1.0000 looks likely as oscillators have turned extremely overbought.
- The trendline placed from 0.9710 will act as major support for the counter.
- The 20- and 50-EMAs are scaling higher, which cushion the greenback bulls.
The USD/CHF pair has witnessed minor selling pressure after consolidating in a narrow range of 1.0033-1.0049 to a low of 1.0022 in the early Asian session. On a broader note, the asset has remained tightened in the grip of bulls for the past few weeks.
The upside break of the consolidation phase plotted in a range of 0.9873-0.9977 on an hourly scale is demanding a minor correction to test the strength of the greenback bulls. The pair is balancing above the psychological resistance of 1.0000 and a test of the same will add more buyers for resuming the upside rally. The trendline placed from May 5 low at 0.9710, adjoining the weekly lows at 0.9874, will continue to act as major support for the counter.
The 20- and 50-period Exponential Moving Averages (EMAs) at 0.9997 and 0.9873 respectively add to the upside filters.
Meanwhile, the Relative Strength Index (RSI) (14) is oscillating in a bullish range of 60.00-80.00, which usually signals further upside. However, an overbought situation cannot be ruled out.
Should the asset correct to near the psychological support of 1.0000, an initiative buying interest will drive the asset higher towards Thursday’s high at 1.0050. A breach of the latter will send the asset towards a fresh three-year high at 1.0123, which is a little over than 17 May 2019 high at 1.0122
Alternatively, the Swiss franc bulls could regain control if the asset drops below Thursday’s low at 0.9932. This will drag the asset towards Wednesday’s low at 0.9873, followed by May 6 low at 0.9827.
USD/CHF hourly chart
-637879908085612400.png)
- AUD/USD pressured in risk-off markets and US dollar picks up the flows.
- AUD/USD has tracked global shares falling to their lowest point in 18-months.
At 0.6855, AUD/USD is starting out the day flat in Asia following another sell-off to fresh cycle lows weighed by a sea of red on Wall Street while the greenback attracts a safe-haven bid again on Thursday.
The antipodeans have been hit hard again with global shares falling to their lowest point in 18-months, supporting the greenback to a fresh 20-year-high. The markets are worried that inflation pushing up interest rates will bring the global economy to a standstill which is driving up the US dollar.
Additionally, weighing on risk sentiment further, tensions between Europe and Russia escalated on Thursday. Finland said it would apply to join NATO "without delay." Sweden is expected to follow. Russia has said it will be forced to take "retaliatory steps" over its neighbour Finland's move to join Nato. A foreign ministry statement said the move would seriously damage bilateral relations, as well as security and stability in northern Europe, the BBC reported.
As for US data, the headline April Producer Price Index climbed in line with expectations by 0.5% MoM. The annual rate was left at 11.0%. The core measure rose 0.4% MoM (0.7% expected), down from a revised 1.2% in March. Core rose 8.8% YoY vs 9.6% YoY. Consequently, US yields were softer. The yield on the US 10-yr note fell 9.4bps to 2.83%.
- Gold price is declining towards $1,800.00 as DXY has strengthened on upbeat economic data.
- The precious metal has struggled at best to overstep the 200-EMA.
- The DXY has renewed its 19-year high at 104.93 on a higher US PPI.
Gold Price (XAU/USD) is continuously dropping south as raising odds of a bumper rate hike by the Federal Reserve (Fed) in its June monetary policy are punishing the precious metal. The bright metal extended its losses on Thursday after establishing below the two-day low at $1,832.07. The selling momentum is expected to drag the gold prices to near the psychological support of $1,800.00.
The US administration is outperforming on the economic data front. The upbeat US Nonfarm (NFP) Payrolls, higher-than-expected US Consumer Price Index (CPI), and strong Producer Price Index (PPI) numbers are advocating for the continuation of an aggressive hawkish stance by the Fed. The tight labor market and galloping inflationary pressures have left no other option for the Fed than to step up the interest rates.
On the US dollar front, the US dollar index (DXY) has renewed its 19-year high at 104.93 after the US Bureau of Labor Statistics reported the yearly US PPI at 11%, higher than the forecasts of 10.7%. While the core PPI that excludes food and energy prices is landed at 8.8%, a little lower than the consensus of 8.9%.
Gold technical analysis
On the daily scale, gold prices struggled to regain their mojo by overstepping the 200-period Exponential Moving Average (EMA) at $1,858.04. Failing to do so, bears drag the precious metal sharply lower. The 20-EMA at $1,883.18 will continue to act as a major resistance for the counter. Meanwhile, the Relative Strength Index (RSI) (14) has shifted into a bearish range of 20.00-40.00, which adds to the downside filters.
Gold daily chart
-637879888547637583.png)
The Federal Reserve Chair Jerome Powell said on Thursday that the US central bank's battle to control inflation would "include some pain" as the impact of higher interest rates is felt, but that the worse outcome would be for prices to continue speeding ahead."
''We fully understand and appreciate how painful inflation is," Powell said in an interview with the Marketplace national radio program, repeating his expectation that the Fed will raise interest rates by half a percentage point at each of its next two policy meetings while pledging that if data turn the wrong way "we're prepared to do more.""
''Nothing in the economy works, the economy doesn’t work for anybody without price stability," Powell said.
"We went through periods in our history where inflation was quite high ... The process of getting inflation down to 2% will also include some pain, but ultimately the most painful thing would be if we were to fail to deal with it and inflation were to get entrenched in the economy at high levels, and we know what that's like. And that's just people losing the value of their paycheck."
Meanwhile, the US dollar has made a fresh 20-year high on Thursday due to the persisting concerns that the Fed's actions to drive down high inflation would crimp global economic growth, boosting the currency's safe-haven appeal.
- NZD/USD bears take on the 61.8% Fibo of the 2020 rally.
- The US dollar picks up a safe haven bid and US stocks drop, weighing on the high beta currencies.
At 0.6238, NZD/USD is lower by some 0.90% on the day as Wall Street draws to a close. The pair has been in the hands of the bears following a brief correction on Wednesday while the US dollar picks up a safe-haven bid again on Thursday.
The high beta currencies have been pummeled as risk-off sentiment takes hold. Global shares are at their lowest point in 18-months, supporting the greenback to a fresh 20-year-high as investors fear that inflation pushing up interest rates will bring the global economy to a standstill.
''It has been a punishing time for financial assets since the Fed raised rates by 50bps last week and the subsequent strong US jobs market, and CPI data have reinforced concerns over the extent of the task facing the Fed,'' analysts at ANZ Bank said.
''One notable aspect of the turmoil has been lower bond yields, with the US 10yr at ~2.83%, having touched 3.20% on Monday. That signifies that markets think the drama could influence policy. If the ramifications of volatility/tumbling asset prices become that significant, it’s hard to see markets shying away from the USD’s safe-haven appeal any time soon. This morning’s NZD break of 0.6230 (the 61.8% Fibo of the 2020/21 rally off COVID lows) is a negative technical development.''
NZD/USD technical analysis
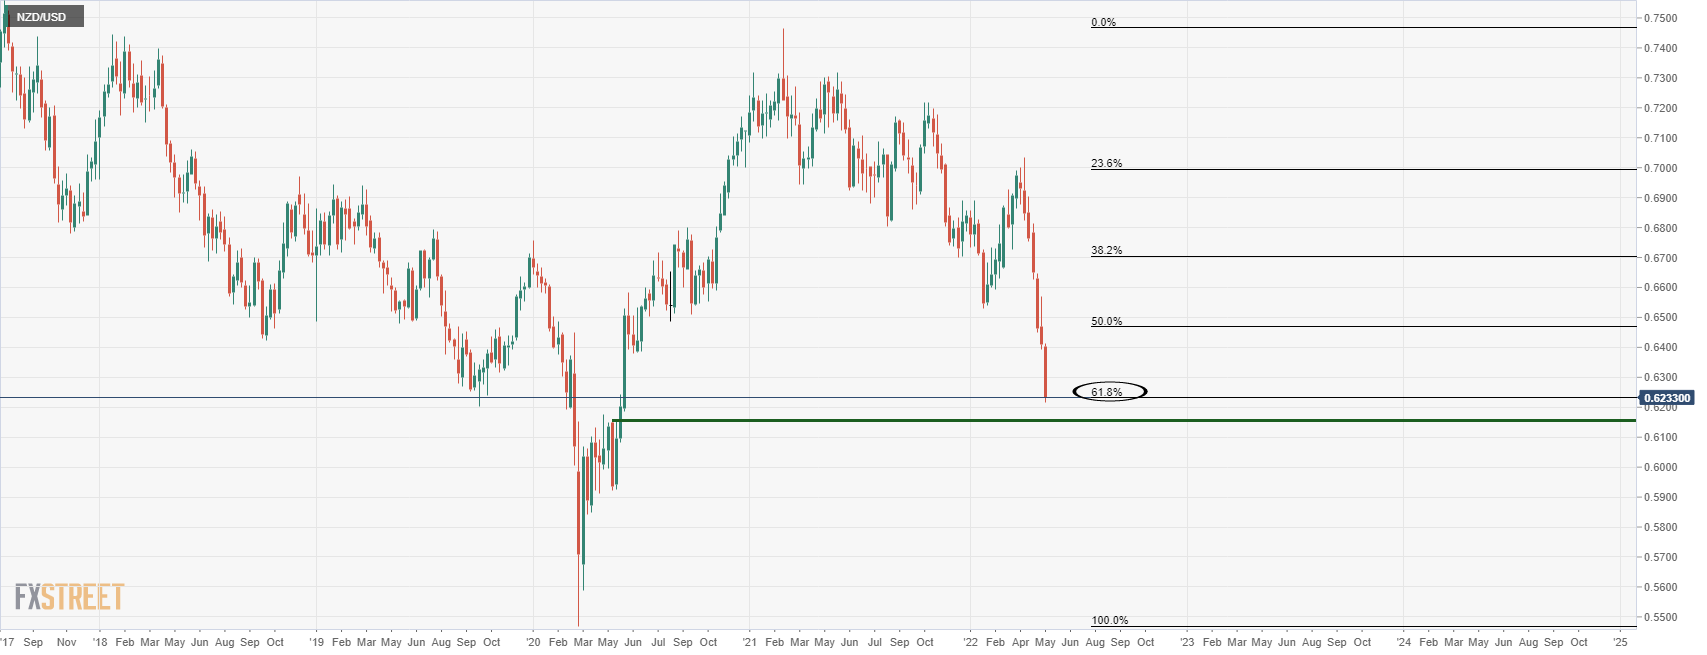
The price is en route towards a break below 0.62 the figure that guards the late May 2020 highs.
What you need to take care of on Friday, May 13:
The American dollar soared on the back of risk-aversion. Panic selling hit equities and cryptos the most, as speculative interest priced in massive quantitative tightening. More and more central bankers are hinting at measures set to drain liquidity.
European Central Bank officials keep paving the way towards a July rate hike, while Bank of Canada Deputy Governor Toni Gravelle suggested that the central bank would need to raise rates above neutral. Finally, Bank of England Governor Ramsden noted that inflation might not drop as fast as forecast, highlighting the need for more rate hikes.
It is worth noting that the US Federal Reserve is two steps ahead of other central banks, hiking rates by 50 bps in May and pledging for at least 2 or 3 more 50 bps hikes while drawing plans to reduce its balance sheet.
Adding to the ruling concerns, tensions escalate between Russia and the western world. Russian Deputy Chairman Dmitry Medvedev warned that military assistance for Ukraine risks creating a conflict between Russia and NATO. Meanwhile, Ukraine has announced it would suspend Gazprom gas transit on its territory. European Commission President Ursula von der Leyen said Russia was the “most direct threat” to the international order.
Also, Russia menaced with retaliation should Finland join NATO. Earlier, Finland’s president and the prime minister said that the country should apply to join NATO “without delay.”
EUR/USD fell to 1.353, now trading at around 1.0370. The GBP/USD pair plunged below the 1.2200 figure. The USD/CHF pair reached parity for the first time since December 2019, now trading at around 1.0040, while USD/JPY edged sharply lower, stabilizing at around 128.40.
Commodity-linked currencies edged lower against the greenback. AUD/USD is now at 0.6850, while USD/CAD trades in the 1.3040 price zone.
Spot gold reached a fresh monthly low, now changing hands at around $1,824 a troy ounce, while crude oil prices kept recovering, with WTI trading at $106.85 a barrel.
Global indexes closed in the red, although Wall Street managed to trim most of its intraday losses ahead of the close.
US Treasury yields retreated amid renewed demand for safety.
Bitcoin price presents buying opportunity despite Coinbase Q1 losses and custody fears
Like this article? Help us with some feedback by answering this survey:
President and CEO of the Federal Reserve Bank of San Francisco, Mary C. Daly has stated that there is no reason to alter the course for 50 bps at the next two meetings, adding that the debate between 50 bps-75 bps is not a primary consideration. She also said she still wants to reach a neutral rate of 2.5% by end of the year.
“Is it 50, is it 25, is it 75? Those are things that I’ll deliberate with my colleagues, but my own starting point is we don’t want to go so quickly or so abruptly that we surprise Americans” already dealing with 40-year-high inflation, Daly told Yahoo Finance earlier on Thursday.
“I’m watching over this year to see how much our move to neutral restrains the economy, along with the repair of supply chains and the fiscal rolloff,” all of which should contribute to easing inflation, she said.
Meanwhile, the US dollar has climbed to a fresh 20-year high on Thursday as concerns persisted that central bank actions to drive down high inflation would crimp global economic growth, boosting the currency's safe-haven appeal.
- USD/JPY bears sink in their teeth on lower US yields, stocks and a heightened sense of risk aversion.
- Bears break below critical support, bucking the trend of bullish flag breakouts.
USD/JPY fell on Thursday to a low of 127.51 from a high of 130.05. A combination of lower US yields and global shares are at their lowest point in 18-months has been supporting both the greenback to a fresh 20-year-high and the yen that has moved out of bearish territory vs. the US dollar.
As a consequence of the risk-off sentiment, the DXY, an index that measures the US dollar vs. a basket of rivals is trading at a new cycle high of 104.925, carving out the way towards the 2002 high near 107. However, the yen has caught a bid also, rallying to its way out of a bullish structure on the daily chart.
Benchmark 10-year Treasury yields, which hit the lowest level in two weeks are down over 3% while the more Fed tentative 2-years are losing 3.7%, weighed by Producer Prices that fell short of expectations. The US Producer Price Index increased by 0.5% in April compared with a 1.6% jump in March. Excluding food and energy, the core PPI climbed by 0.4%, lagging the 0.7% gain expected. Core PPI grew by 1.2% in March. On a year-over-year basis, producer price inflation surged 11% in April, and core PPI jumped 8.8%, the Bureau of Labor Statistics said Thursday.
Meanwhile, the summary of opinions from the April 27-28 Bank of Japan meeting came across as universally dovish and largely unconcerned about rising inflation and the weak yen. The Next policy meeting is June 16-17 and all signs point to continued dovishness from the BOJ.
USD/JPY technical analysis
The pair has bucked the trend on Thursday, breaking below prior support and has denied the bulls that were otherwise seeking more from the bullish flag pattern on the daily chart:
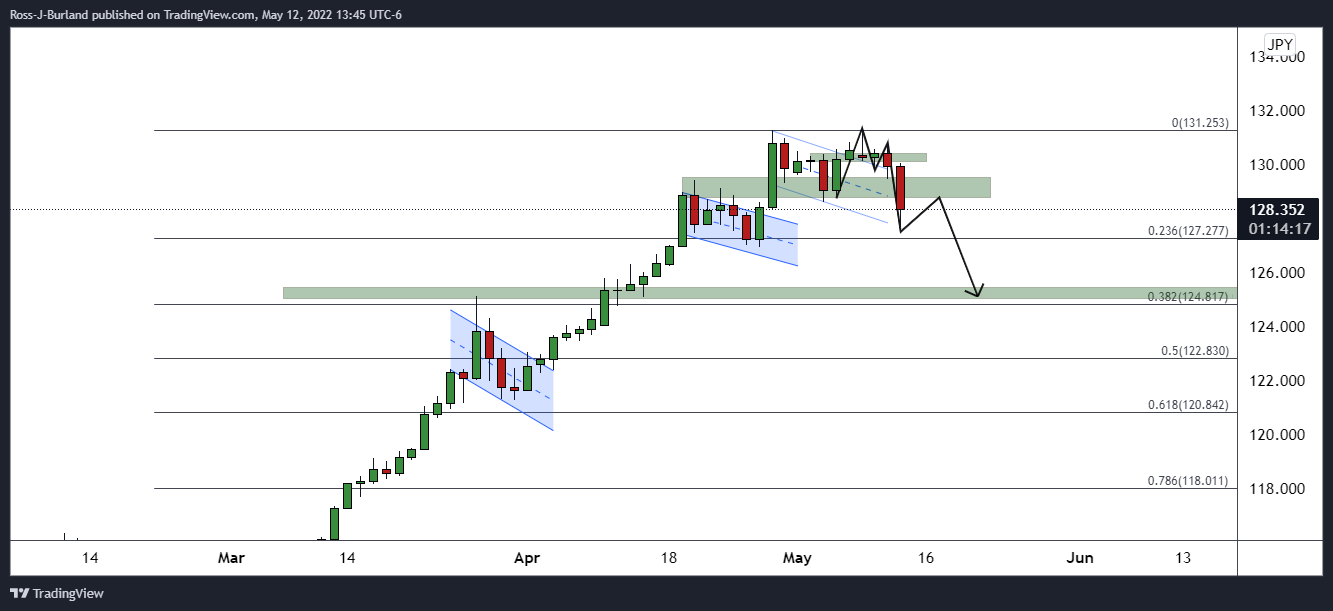
The price action has left an M-formation on the daily chart, a pattern which often sees the price reverting to restest the prior lows, or the neckline of the chart pattern.
- EUR/USD falls to fresh bearish cycle lows as the US reaches a new 20-year high.
- Risk-off sentiment is supporting a flight to the US dollar.
EUR/USD is down some 1.35% after falling from a high of 1.0529 to a low of 1.0353 on Thursday due to a firm US dollar as risk-off sentiment takes hold. Global shares are at their lowest point in 18-months, supporting the greenback to a fresh 20-year-high as investors fear that inflation pushing up interest rates will bring the global economy to a standstill.
Europe's continent-wide STOXX 600 index fell 0.63% on Thursday as German warned that Russia was now using energy supplies as a "weapon" which has weighed on the single currency. Tensions were stoked as Finland confirmed it would apply to join NATO "without delay" in the wake of Russia's invasion of Ukraine, a war that is driving up global energy and food prices.
As a consequence of the risk-off sentiment, the DXY, an index that measures the US dollar vs. a basket of rivals is trading at a new cycle high of 104.925, carving out the way towards the 2002 high near 107. Subsequently, the euro is trading at a new cycle low near despite hawkish the European Central Bank's comments.
European Central Bank policymaker Peter Kazimir dropped a hint about a July interest rate increase on social media on Wednesday, joining a growing number of colleagues in calling for a hike to tackle record-high inflation.
"(I am) ready to hike in July -- and not just the beautiful Atlas Mountains here in #Morocco," the Slovak governor wrote on Twitter.
''Of course, this is a bit anti-climactic after President Lagarde pretty much sealed the deal earlier this week. More importantly, there seems to be a growing consensus that the deposit rate will move into positive territory by year-end, which would require three hikes to accomplish,'' analysts at Brown Brothers Harriman argued.
Meanwhile, the market's expectations for Fed tightening picked up a bit after the Consumer Price Index data but have since fallen back, weighed by Producer Prices that fell short of expectations. The US Producer Price Index increased by 0.5% in April compared with a 1.6% jump in March. Excluding food and energy, the core PPI climbed by 0.4%, lagging the 0.7% gain expected. Core PPI grew by 1.2% in March. On a year-over-year basis, producer price inflation surged 11% in April, and core PPI jumped 8.8%, the Bureau of Labor Statistics said Thursday.
Parity eyed
''The US dollar is gaining today despite falling yields, which illustrates the so-called dollar smile whereby it gains during periods of risk-off as well as in periods of strong US data and rising yields. Either way, the dollar’s climb is likely to continue for the time being,'' the analysts at BBH forecasted. ''We continue to target the January 2017 near $1.0340. After that, we have to start talking about parity.''
Meanwhile, analysts at Rabobank, ''in the current environment'' continue to view the USD as the obvious haven currency.
''We have argued repeated our view the USD’s safe haven credentials stem from the greenback’s own fundamentals rather than those of the US. The USD dominates the global payments systems and is used as an invoicing currency all over the world. Even in the Eurozone, a high proportion of invoices are written in USD,'' the analysts explained.
''In recent years, low US rates has encouraged steady growth of USD denominated det issuance from non-US currencies. These debts need to be maintained. The implication is that there is a strong need for USDs across the globe which is brought into focus as liquidity is tightened.
While we don’t see US fundamentals as creating the USD’s safe haven status, the US’s relatively strong position in terms of food and energy security is likely enhancing the appeal of the greenback. Earlier this week, we revised up our USD forecasts across the board. We see risk of EUR/USD at 1.03 on a 1 month and 3-month view.''
The Bank of Mexico, abbreviated BdeM or Banxico, sets the benchmark interest rate at 7%, although Reuters reports that the board was not unanimous on rate decision with one member of the board voting to hike rates to 7.25%.
Key notes
- Banxico says another four board members voted to hike the rate to 7.00%.
- Says for the next monetary policy decisions the board will monitor thoroughly the behaviour of inflationary pressures and factors impacting foreseen path for inflation and its expectations.
- Says preliminary information suggests that economic activity rebounded during the first quarter of 2022.
- Says given the growing complexity in the environment for inflation and its expectations, taking more forceful measures to attain the inflation target may be considered.
- Says an environment of uncertainty and ample slack conditions continues to prevail, although the latter narrowed compared to the previous quarter.
- Says in view of greater-than-anticipated pressures on inflation, forecasts for headline and core inflation were revised upwards up to the second and third quarters of 2023.
- Says, however, convergence to the 3% target in the first quarter of 2024 is maintained.
- Says the balance of risks for the trajectory of inflation within the forecast horizon remains biased to the upside and continues deteriorating.
- Says took into consideration increasing challenges posed by tightening global monetary and financial conditions, the environment of significant uncertainty, and greater inflationary pressures associated with geopolitical conflict.
- Says in addition to shocks that have affected inflation throughout the pandemic, now there are pressures associated with geopolitical conflict and strict lockdown measures recently imposed by China.
The peso is a touch stronger on the decision with USD/MXN down 0.17% at 20.2685.
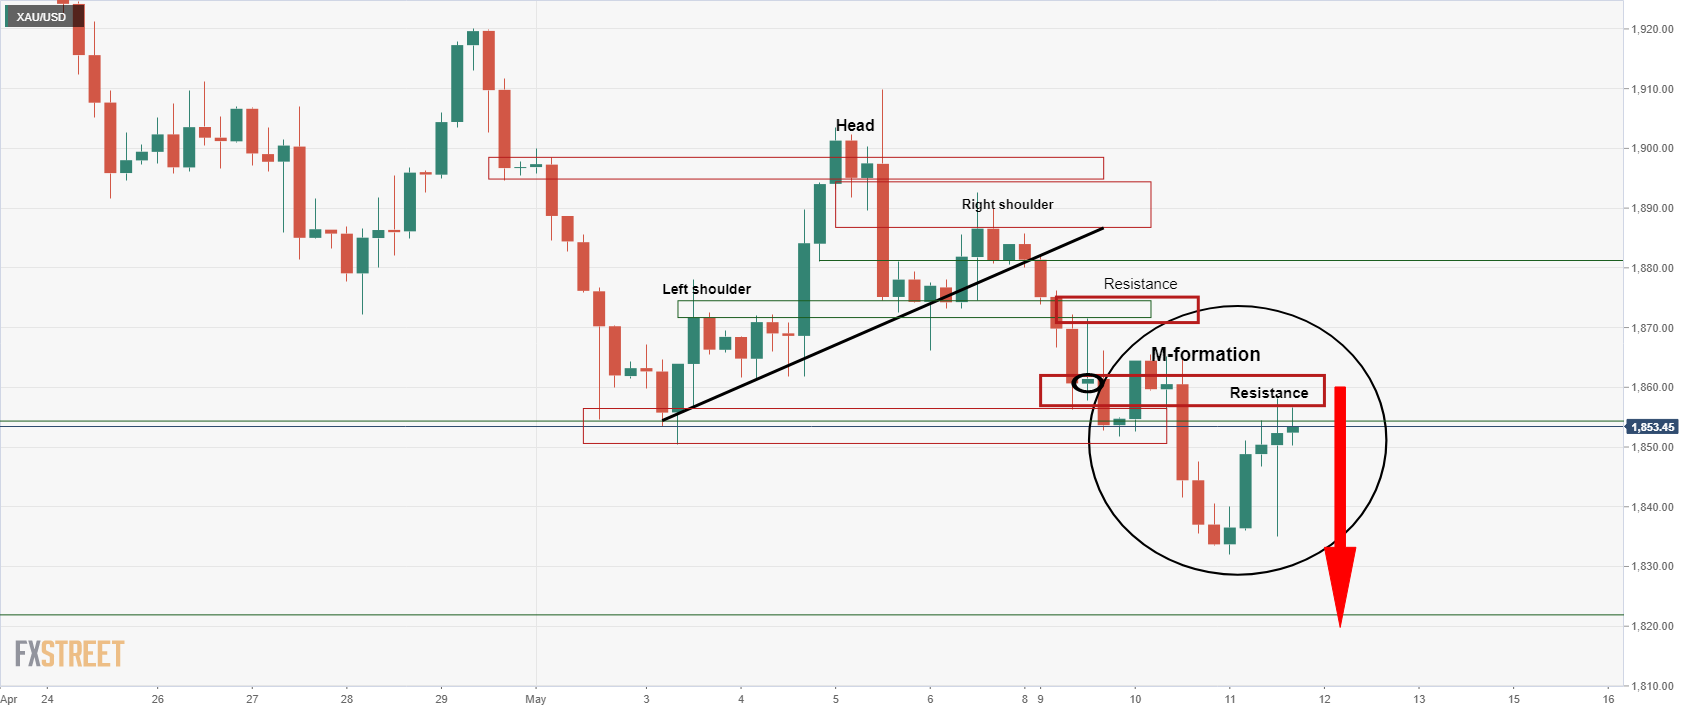
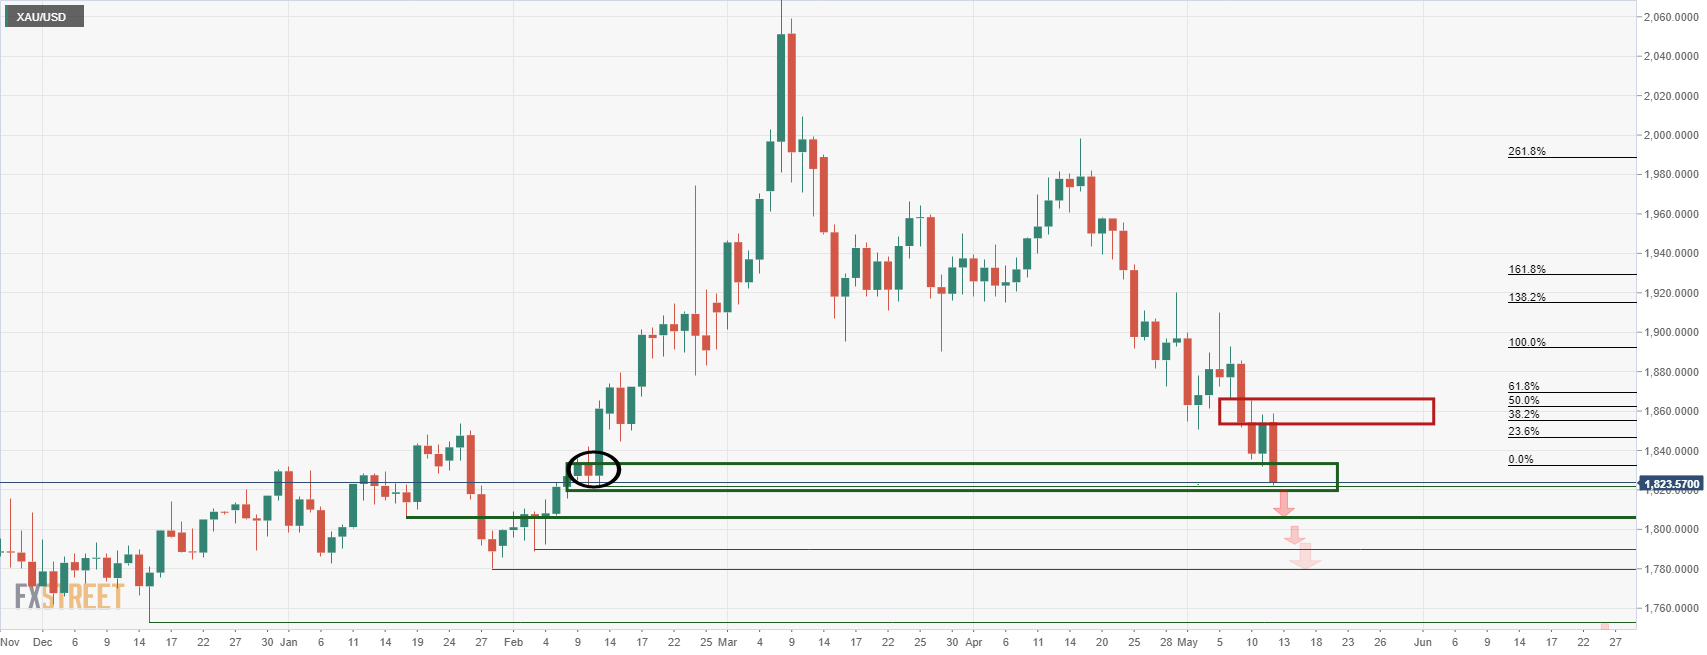
- Gold drops into a fresh critical daily support structure.
- The US dollar is bid and making fresh 20-year highs.
- Price pressures are entrenched and investors are seeking out the safe havens.
The price of gold is losing some 1.60% at the time of writing, falling from a high of $1,858.87 to a fresh cycle low of $1,822.27. The US dollar is bid and climbed to fresh two-decade highs on Thursday as investors flock to the safe-haven currency in the face of surging inflation.
Data on Wednesday confirmed expectations for further aggressive hikes in interest rates by the Federal Reserve. The Consumer Price Index climbed 8.3%, higher than the 8.1% estimate but below the 8.5% in the prior month. The index rose just 0.3% last month, the smallest gain since last August, the Labor Department said on Wednesday, versus the 1.2% MoM surge in the CPI in March, the most significant advance since September 2005. However, ''the fact that the CPI is driven by rents and services implies that price pressures are entrenched and may manifest in upward pressure on wages too,'' analysts at TD Securities argued.
As a consequence, the dollar index (DXY), which measures the greenback's strength against a basket of six currencies, rose 0.4% to 104.92 on Thursday following a jittery day on Wednesday.
"Dollar is rallying as things potentially look negative in the US, which is hurting gold. Also, the market is realising the likelihood of seeing pretty aggressive interest rate increases," analysts at TD Securities said.
However, precious metals are holding up relatively as a drop in the benchmark 10-year Treasury yields, which hit the lowest level in two weeks, has capped some of the bear's progress. The ten-years are down over 3% while the more Fed tentative 2-years are losing 3.7%, weighed by Producer Prices that fell short of expectations.
The US Producer Price Index increased by 0.5% in April compared with a 1.6% jump in March. Excluding food and energy, the core PPI climbed by 0.4%, lagging the 0.7% gain expected. Core PPI grew by 1.2% in March. On a year-over-year basis, producer price inflation surged 11% in April, and core PPI jumped 8.8%, the Bureau of Labor Statistics said Thursday.
''The dollar is gaining today despite falling yields, which illustrates the so-called dollar smile whereby it gains during periods of risk off as well as in periods of strong US data and rising yields. Either way, the dollar’s climb is likely to continue for the time being,'' analysts at Brown Brothers Harriman explained.
Gold technical analysis
The gold price has fallen from a 4-hour resistance as follows:
Prior analysis:
Live update:
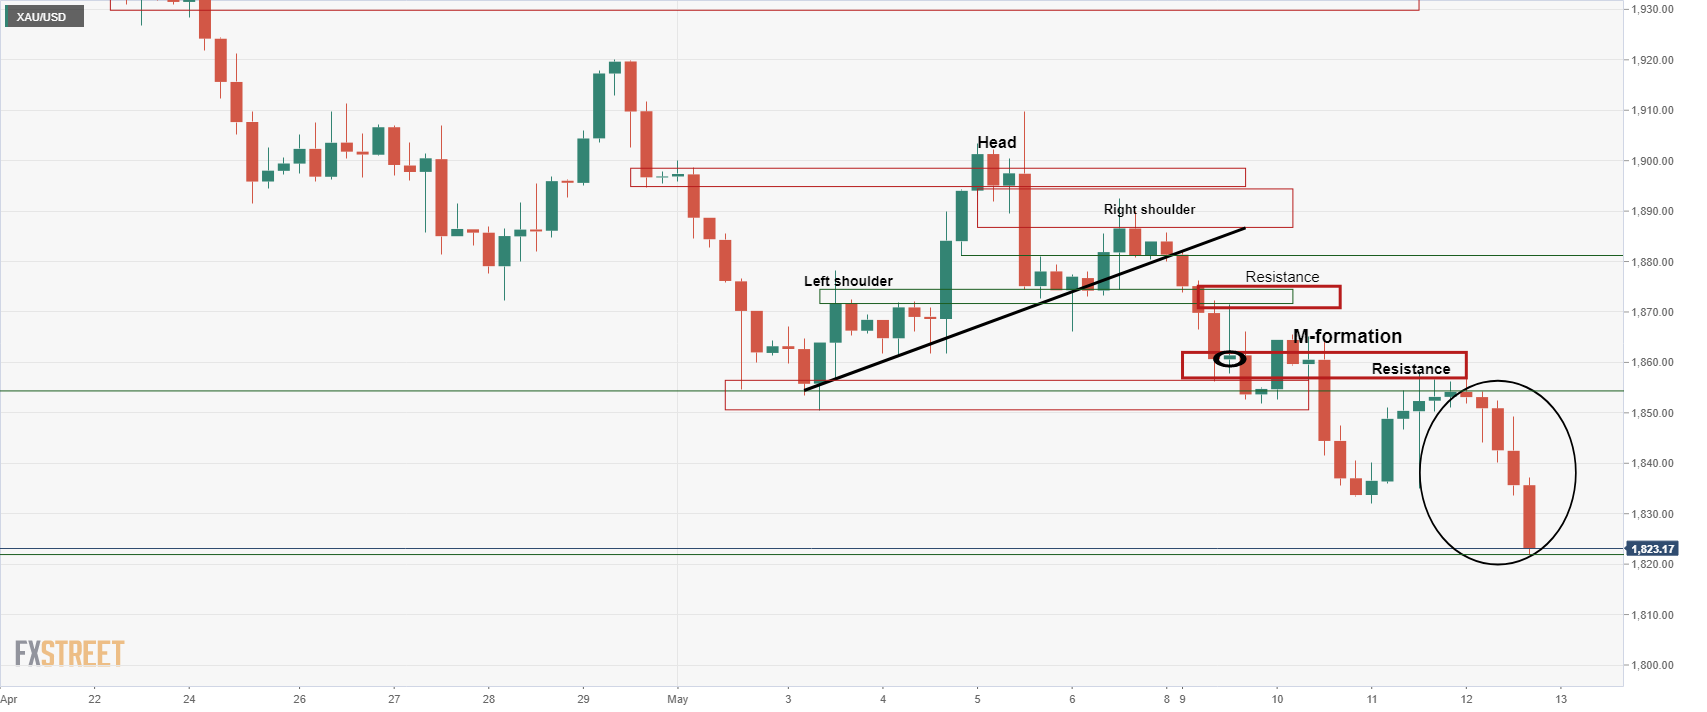
A move below the lows of the day will open new territories for the bears and prospects of a test below the psychological $1,800 round figure:
The deterioration in the growth outlook in the United Kingdom has been negative for the pound, explained analysts at CIBC. They forecast the GBP/USD pair will remain around 1.22 during the next months.
Key Quotes:
“The updated BoE macro outlook now reflects a negative GDP trajectory in 2023, the bank now assumes -0.25% rather than 1.25% previously. The key driver of the deteriorating growth trajectory is the most aggressive correction in real household disposable incomes on record. The drag on consumption will squeeze activity out of the system, obviating the need to tighten as aggressively as the market expects. While Governor Bailey may suggest that a further tightening may be appropriate, this remains in stark contrast to the market implying almost 115bps of additional tightening by the end of 2022.”
“We favour rates ending 2022 at 1.25%. The BoE is in an increasingly uncomfortable position in terms of forecasting an ever higher CPI peak and slowing growth. The combination of extended and elevated price pressures set against downgraded growth forecasts, which are impacting rate assumptions, do not sit comfortably against a backdrop of enduring political uncertainty.”
“Overall, there seems to be little to commend regarding Sterling, hence we have revised our GBP forecasts down.”
US Treasury Secretary Janet Yellen mentioned on Thursday that the Financial Stability Oversight Council (FSOC) is concerned about the functioning of the Treasury market. “We had episodes in which liquidity has dried up.” She is giving testimony before the House Financial Services.
While she testifies, stocks erased gains printing fresh YTD lows and the dollar strengthened. The DXY is at multi-year highs above 104.70. The 10-year US yield stands at 2.84%, down 3% for the day.
Analysts at Wells Fargo continue to believe that the US dollar can strengthen against G10 and emerging market currencies. They consider the aggressive tightening from the Federal Reserve, safe haven capital flows as well as markets that are mispriced for interest rate hikes abroad should all result in a stronger greenback going forward.
Key Quotes:
“A hawkish Federal Reserve has boosted the US dollar against most G10 and emerging market currencies year to date, and we believe this trend is likely to continue. Given our view that the Fed is likely to tighten policy aggressively, we believe capital flows should revert back toward the United States.”
“As higher yields attract capital back to the U.S., the dollar should benefit and strengthen against G10 and developing currencies going forward. We believe emerging market currencies are the most vulnerable against this backdrop, especially as political risks rise and central banks across the developing world may be running out of space to lift interest rates.”
“As far as the G10 currencies, we believe financial markets may be priced for too much tightening by many foreign central banks. As markets adjust to a more gradual pace of tightening abroad, G10 currencies should weaken and the U.S. dollar should get a tailwind.”
Analysts at CIBC forecast the AUD/USD pair at 0.72 by the end of the second quarter, and at 0.75 by the third quarter. They see the Reserve Bank of Australia rising at least another 150bps of tightening by year-end.
Key Quotes:
“The RBA has moved to suggest it is “committed to doing what is necessary to ensure that inflation in Australia returns to target over time. ” The switch to policy front loading is partly a function of the substantive uptick in the inflation profile contained in the Statement on Monetary Policy.”
“As prices are now expected to reach 6% by year-end, the bank deemed it necessary to act aggressively. The central bank has become increasingly wary of inflation expectations becoming de-anchored.”
“Beyond the expected uptick in headline prices, the continued tightening in the labour market also supports tighter monetary policy, and we look for at least another 150bps of tightening by year-end. An unemployment rate below 4% underlines the need for additional tightening. After hiking this month, the market is currently pricing more than 35bps of tightening for the 7 June meeting.”
“We continue to view the AUD as undervalued versus supportive terms of trade and long-term interest rate differentials. However, rising external headwinds, linked to rising Chinese concerns, suggest AUD bulls may need to be patient.”
- US dollar pulls back as Wall Street turns positive.
- Tensions across financial markets remain on the table.
- NZD/USD rebounds modestly, bearish bias persists.
The NZD/USD bottomed during the American session at 0.6222, the lowest level since June 2020 and then rebounded modestly to 0.6266, trimming losses. The dollar moved off high across the board but stays firm amid a volatile financial market.
A recovery in equity prices in Wall Street helped NZD/USD. After a negative opening, the S&P 500 turned positive. Risk aversion is still dominant amid fears about the global economic outlook with higher interest rates ahead.
Data from the US showed the Producer Price Index slowed down from a multi-decade high of 11.5% to 11% in March (annual); on a monthly basis, it rose 0.5%. Jobless claims showed a mixed picture: Initial Claims hit an 11-week high at 203K while Continuing Claims dropped to 1.343M, the lowest since 1970.
Short-term outlook
The bearish pressure remains in place, and more losses seem likely while under 0.6275. The 20 Simple Moving Average in four hours chart is located at 0.6300; if the kiwi rises above, it would alleviate the short-term negative momentum. The next resistance is seen at 0.6335.
On the flip side, a slide under 0.6235 would expose the 0.6222 low. The following support might be located at 0.6190 (Feb 2020 low) and 0.6160.
Technical levels
- USD/USD is consolidating just above 1.3000, not far below 18-month highs at 1.3050.
- A strong US dollar amid recent hot US inflation data and risk-off flows is outweighing higher oil prices.
- Focus is on upcoming comments from BoC’s Tony Gravelle from 1630BST.
USD/CAD stabilised just below multi-month highs in the low 1.3000s on Thursday, as a downturn in global macro risk appetite coupled with the strong performance of the safe-haven US dollar offered the pair support. At current levels around 1.3020, the pair is trading with gains of about 0.25% on the day and earlier came within a whisker of hitting Tuesday’s more than 18-month highs just above 1.3050.
Given US CPI and PPI data over the past two days, both of which showed an (as far as the Fed is concerned, anyway) insufficient moderation of inflationary pressures, it's not surprising to see the US dollar performing so well. The data means that the Fed will likely press ahead with its current aggressive tightening plans and, with fears about central bank tightening weighing heavily on global equities, the buck is also deriving support as a safe haven.
A rebound from earlier session lows in crude oil prices has failed to revive the loonie, which seems likely to continue to trade on the back foot in the run-up to commentary from BoC’s Deputy Governor Tony Gravelle at 1630BST. Gravelle might offer further hints about the extent and timing of the BoC’s monetary tightening plans. Traders should note, however, that the BoC’s hawkish stance has failed to shield the loonie from the US dollar’s advances in recent weeks and probably won’t start this Thursday.
- Oil prices are currently trading on the front foot, though it’s been a choppy day so far.
- WTI has rallied back into the $106.00s from earlier lows in the $102.00s.
- Traders are weighing geopolitical tensions against a bearish macro backdrop.
Oil prices are currently trading on the front foot, though it’s been a choppy day so far. Front-month WTI futures fell as low as the mid-$102.00s earlier in the day, but have since reversed back to trading modestly in the green in the $106.00s. Risk appetite remains ropey at the start of the US trading session, with US equities probing multi-month lows, international equity bourses also suffering and bond yields falling amid a flight to safety.
Traders continue to cite fears about slowing global growth, still, sky-high inflation (see this week’s Consumer and Producer Price Inflation reports) and central bank tightening, all of which come against the backdrop of the ongoing Russo-Ukraine war and widening lockdowns in China, as weighing on sentiment. This clearly was weighing on oil prices earlier in the day.
Commentary from major oil market players has also been bearish sounding. Both OPEC and the International Energy Agency (IEA) released their monthly oil market reports on Thursday. The former cut its global oil demand growth forecast for this year for a second successive month due to the impact of the Russo-Ukraine war, demand destruction as a result of inflation and lockdowns in China.
The IEA’s message was similar. “Soaring pump prices and slowing economic growth are expected to significantly curb the demand recovery through the remainder of the year and into 2023,” they said. “Extended lockdowns across China ... are driving a significant slowdown in the world’s second-largest oil consumer”. The agency also revised lower their expectations for demand growth this year.
But there has also been plenty of focus on worsening Russia/EU relations as Finland and Sweden head closer to joining NATO and Germany accuses Russia of “weaponising” its energy exports. This is keeping fears about the impact on Russian oil output of Western sanctions on Russia over its invasion of Ukraine in the spotlight. The EU is expected to agree on a plan to end Russian oil imports soon, in what analysts have said would be a crippling blow to Russia’s energy industry.
Meanwhile, a French Diplomatic source was recently quoted by Reuters as being pessimistic that the US and Iran will swiftly resolve their differences and return to the 2015 nuclear deal. A return to the old deal would see US sanctions on Iran lifted and as much as 1.3M barrels per day in Iranian exports return to global markets, commodity strategists have said.
The combination of these latter two themes seems to have been enough to entice dip-buyers to return to WTI markets as it prices closer to $100. But against such a bearish macro backdrop, it remains to be seen whether WTI can continue its recovery and test earlier weekly highs above the $110 per barrel mark.
The loonie is having a hard time against the USD in the current market environment. Against the EUR, on the other hand, the CAD was able to gain noticeably as a commodity currency. Economists at Commerzbank expect a more pronounced downward movement in EUR/CAD than in USD/CAD in 2023.
EUR/CAD should trend lower in 2023
“In our main scenario, we continue to expect that the EUR will recover noticeably from the summer onwards, largely supported by the ECB's turnaround. As a result, EUR/CAD should drift upwards. At the same time, the CAD should be able to gain somewhat against the USD.”
“For USD/CAD, a key factor remains how the market views the BoC's stance compared to the Fed. If it is perceived as more hawkish and rate hike expectations change correspondingly, the loonie should benefit – conversely, it should lose accordingly.”
“With the continued tightening of monetary policy in 2023, the BoC is likely to differ from the ECB. We expect the latter to end its rate hike cycle again early in 2023, which should contribute to renewed EUR weakness. Accordingly, we expect a more pronounced downward movement in EUR/CAD than in USD/CAD in 2023.”
Gold dips back to low $1,840s. Economists at TD Securities expect the yellow metal to remain under downside pressure.
A significant amount of complacent length in gold
“A liquidity vacuum is dragging all assets lower, leaving gold to circle the drain in defiance of its safe-haven status, despite the fierce rally in Treasuries.”
“With CTA trend followers joining into the liquidation party, substantial selling flow continues to weigh on the yellow metal at a time when liquidity is scarce. Prices are now struggling to hold onto the bull-market-era defining uptrend in the yellow metal under the pressure of this selling flow.”
“For the time being, the trendline has held despite the strong CPI report, as the turbulence in risk assets sparked a bid in Treasuries, but we continue to see a significant amount of complacent length in gold which could weigh on prices, while the breadth of traders short has just started to rise from near-record lows.”
- USD/JPY came under intense selling pressure on Thursday and dived to over a two-week low.
- The flight to safety benefitted the JPY and dragged the pair lower amid sliding US bond yields.
- The technical set-up favours bearish traders and supports prospects for further near-term losses.
The USD/JPY pair added to the previous day's modest losses and witnessed heavy follow-through selling on Thursday. This marked the second successive day of a negative move - also the third in the previous four - and dragged spot prices to over a two-week low, around mid-127.00s during the early North American session.
The prevalent risk-off mood boosted the traditional safe-haven Japanese yen and exerted heavy downward pressure on the USD/JPY pair. Bearish traders further took cues from an extension of the sharp pullback in the US Treasury bond yields, which forced the US dollar to trim a part of its intraday gains to a two-decade high.
Given the formation of a double-top pattern near the 131.35 region, the overnight breakdown through an ascending trend-line extending from late March was seen as a fresh trigger for bearish traders. A subsequent fall and acceptance below the 129.00 round figure prompted aggressive technical selling and contributed to the steep decline.
From current levels, sustained weakness below the 128.00 mark will set the stage for additional losses and drag the USD/JPY pair further towards testing the 127.55-127.50 intermediate support. The downward trajectory could further get extended towards the next relevant support near the 127.00-126.90 region touched on April 27.
On the flip side, attempted recovery might now confront stiff resistance near the 128.60 area. Any further move up is likely to meet with a fresh supply and remain capped near the 129.00 level. That said, some follow-through buying could trigger a short-covering move and lift the USD/JPY pair back towards the 130.00 psychological mark.
USD/JPY 4-hour chart
-637879594515066872.png)
Key levels to watch
- EUR/USD collapses to fresh lows in the sub-1.0400 area.
- The door is now open to a visit to the 2017 low at 1.0340.
EUR/USD saw its decline markedly accelerated on Thursday, breaking below the 1.0400 support for the first time since early January 2017.
Extra retracements remain well on the cards for the time being. That said, bets are now on the rise for a test of the 2017 low at 1.0340 sooner rather than later. This area is reinforced by the 2003 low at 1.0334 (January 2).
Below the 3-month line near 1.0910, the pair is expected to remain under pressure and vulnerable to extra losses.
EUR/USD daily chart
- Silver is consolidating above $21.00 after hitting its lowest level since July 2020 in the $20.75 region.
- Risk-off flows and lower yields aren’t doing much to help XAG/USD, which is about 2.0% lower on the day.
- Technicians are eyeing more downside to sub-$20.00 levels.
After briefly hitting its lowest level since July 2020 in the $20.75 area per troy ounce, the price of spot silver (XAG/USD) has stabilised just above the $21.00 level. That leaves the metal trading lower by about 2.0% on the session, as the precious metal complex reels against the backdrop of a strong US dollar. With no notable support, all before the 2019 highs in the $19.60s, many technicians think that further XAG/USD downside is likely.
Lower yields across developed markets as a result of a strong safe-haven bid as global equities and other risk assets continue their recent slide has not come to the aid of silver, which is traditionally seen as a safe-haven asset. Meanwhile, further evidence that US inflation isn’t easing as quickly as hoped in the form of the latest US Producer Price Inflation data released earlier on Thursday, which comes on the back of Wednesday’s also hotter than forecast Consumer Price Inflation numbers, has also not sparked any fresh demand for inflation protection that might normally benefit the precious metal
Markets remain very much focused on central bank tightening, with the rhetoric from Fed members this week very much in fitting with Fed Chair Jerome Powell’s message in the post-FOMC meeting press conference last week that substantial further tightening should be expected. Higher interest rates not only by themselves dissuade investors from allocating capital towards silver and gold (given the higher opportunity cost of holding non-yielding assets), but are also likely to result in lower inflation in the long run (as a direct result of demand easing due to tighter financial conditions), lessening the demand for inflation protection.
Reduced demand for inflation protection as a result of the Fed’s hawkish shift in recent weeks can be seen in the recent pullback to multi-month lows in US inflation expectations. 10-year break-evens went as high as 3.1% in mid-April but are now back to the 2.75% area, with this pullback coinciding with the recent drop in XAG/USD.
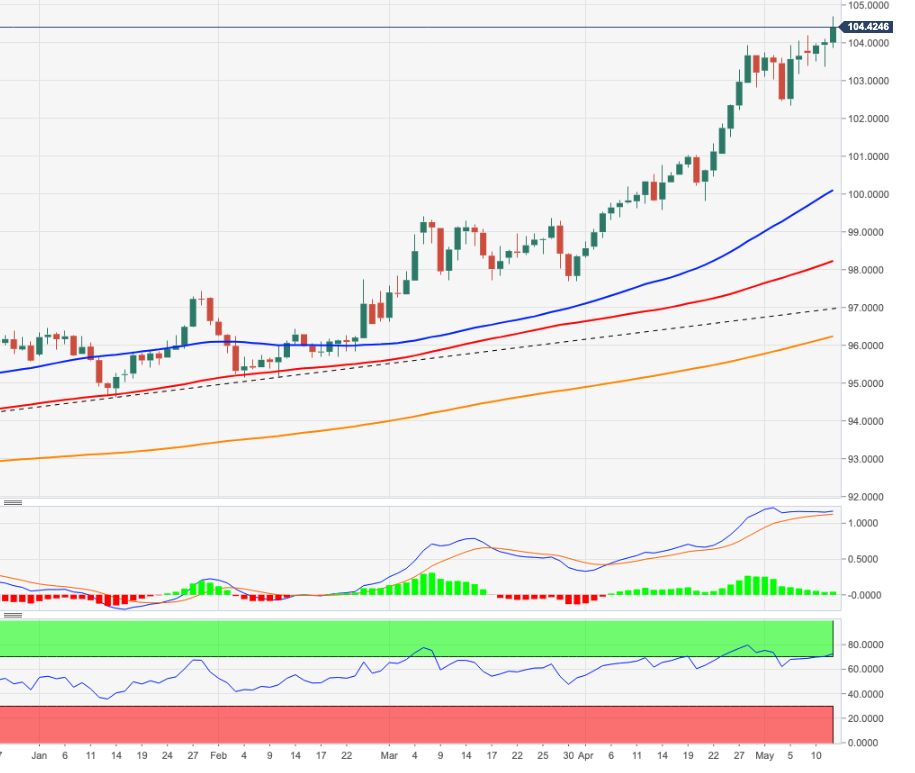
- DXY’s upside momentum gathers extra steam.
- The dollar clinches new cycle tops around 104.70.
The dollar keeps the bid bias unchanged and pushes DXY to new 19-year peaks in the 104.70 region on Thursday.
Considering the ongoing price action, further gains in the index remains well on the cards and with the immediate hurdle at the round level at 105.00 ahead of 105.63 (December 11 2002 high). Further up, the index is expected to challenge the December 2002 high at 107.31.
The current bullish stance in the index remains supported by the 8-month line around 97.00, while the longer-term outlook for the dollar is seen constructive while above the 200-day SMA at 96.21.
DXY daily chart
- AUD/USD prolonged its recent slump and dived to a near two-year low on Thursday.
- Retreating US bond yields capped the USD and assisted the pair to find some support.
- The set-up still favours bearish traders and supports prospects for additional losses.
The AUD/USD pair has managed to rebound a few pips from its lowest level since June 2020 and was last seen trading around the 0.6875-0.6880 region, still down 0.90% for the day.
The US dollar trimmed a part of its intraday gains to a nearly two-decade high amid an extension of the recent sharp pullback in the US Treasury bond yields. This, in turn, assisted the AUD/USD pair to find some support near the mid-0.6800s, though any meaningful recovery still seems elusive.
Wednesday's higher-than-expected US consumer inflation figures reaffirmed bets for a more aggressive policy tightening by the Fed. This, along with recession fears, continued weighing on investors' sentiment, which should act as a tailwind for the safe-haven buck and cap the AUD/USD pair.
From a technical perspective, the overnight sharp pullback from the 0.7055-0.7060 region and subsequent weakness below the previous YTD low, around the 0.6910 area marked a fresh bearish breakdown. The latter should now act as a strong barrier and cap the AUD/USD pair's attempted recovery.
Any further move up might continue to face still resistance and met with a fresh supply near the 0.7000 psychological mark. This should act as a key pivotal point for short-term traders, which if cleared decisively might trigger a short-covering bounce back towards the 0.7055-0.7060 area.
On the flip side, the daily swing low, around mid-0.6800s, now seems to protect the immediate downside. Some follow-through selling will reaffirm the bearish outlook and make the AUD/USD pair vulnerable to prolonging the downward trajectory to test the next relevant support near the 0.6800 mark.
AUD/USD daily chart
-637879573906596704.png)
Key levels to watch
- There were 203K initial claims in the week ending 7 May, a tad above the 195K expected.
- Continued claims saw a much larger than forecast drop.
- FX markets did not react to the latest weekly jobless claims report.
There were 203,000 Initial Jobless Claims in the week ending on 7 May, a little above the expected drop to 195,000 from 202,000 one week ago, data released by the US Department of Labour on Thursday showed. As a result, the four-week average number of Initial Jobless Claims rose to 192,750 from 188,500 a week earlier.
Continued Claims fell to 1.343 million in the week ending on 30 April, larger than the expected decline from 1.387 million to 1.38 million. The Insured Unemployment rate nonetheless remained unchanged at 1.1% for the week ending on 30 April.
Market Reaction
FX markets did not react to the latest weekly jobless claims report.
- Annual headline PPI came in at 11.0% in April, a tad above expected, but Core PPI was a tad lower than expected.
- FX markets hardly reacted at all to the data.
The annual rate of US Producer Price Inflation (PPI) fell to 11.0% in April, above expectations for a fall to 10.7% from 11.2% in March, data released by the Bureau of Labour Statistics and Department of Labour showed on Thursday. MoM, headline producer price pressures came in at 0.5% as expected, falling back from a 1.6% MoM gain in March.
The annual pace of Core PPI came in at 8.8%, a tad lower than the expected drop to 8.9% from 9.6% in March. The MoM pace of Core PPI was also a little lower than expected at 0.4% versus expectations for a drop to 0.6% from 1.2% in March.
Market Reaction
FX markets have hardly reacted at all to the latest mixed US inflation data release.
- A bullish breakout in the buck to fresh yearly highs has seen spot gold pull back from earlier highs in the $1,850s.
- But XAU/USD is finding support and remaining in the $1,840s above its 200-DMA amid geopolitical angst/risk-off flows.
Whilst a broad cross-market bid for safe-haven assets which has resulted in strength in the yen and in government bond prices (meaning yields are lower) is keeping the spot gold (XAU/USD) price supported above its 200-Day Moving Average in the mid-$1,830s for now, a breakout to fresh year-to-date highs in the US dollar that has seen the DXY push into the upper 104s has seen the precious metal reverse back from earlier session highs near $1,860.
XAU/USD current trades in the low $1,840s and is down about 0.5% on the day as the stronger greenback makes USD-denominated commodities (like spot gold) more expensive for international buyers. Whether the buck’s bullish breakout will be enough to push gold to fresh multi-month lows below Wednesday’s $1832 bottom remains to be seen.
At the moment, US (and global yields) are on the back foot amid a safe-haven bid, and lower yields mean a lower opportunity cost of holding non-yielding assets like gold. Meanwhile, concerns about slowing global growth remain ever-present, while European markets are seemingly rattled by the latest geopolitical developments there.
Finland is on the verge of applying to join NATO with Sweden expected to follow. Russia has vowed an unspecified response. Geopolitical tensions in the region add to downside growth risks, all of which could be cited by investors as reasons to own gold. Looking ahead, the imminent release of US Producer Price Inflation figures for April will be worth noting at 13:30 BST, as will any further rhetoric from Fed policymakers.
- GBP/USD dropped to a near two-year low on Thursday in reaction to softer UK macro data.
- Aggressive Fed rate hike bets continued underpinning the USD and added to the selling bias.
- Extremely oversold conditions helped limit losses, though the set-up favours bearish traders.
The GBP/USD pair managed to rebound a few pips from a two-year low and was last seen trading just below the 1.2200 mark, down nearly 0.50% for the day.
The pair extended the overnight rejection slide from the 1.2400 mark and witnessed heavy follow-through selling on Thursday, marking the sixth successive day of a negative move. The British pound took a hit following the release of weaker UK macro data, which, along with sustained US dollar buying exerted pressure on the GBP/USD pair.
The Preliminary UK GDP report showed that the British economy expanded by 0.8% during the first quarter of 2022 as against the 1.3% growth recorded in the previous quarter and the 1.0% anticipated. Adding to this, the monthly GDP print also fell short of market expectations and came in to show that the economy contracted by 0.1% in March.
Separately, the Office for National Statistics (ONS) reported that Manufacturing and Industrial output declined by 0.2% in March, both missing consensus estimates. Moreover, the UK goods trade balance data showed that the deficit unexpectedly jumped to £23.897 billion in March from £21.614 billion recorded in the previous month.
The data reaffirmed a bleak economic outlook by the Bank of England and the National Institute of Economic and Social Research (NIESR), warning that Britain is on course to enter a technical recession. This, in turn, suggested that the current rate hike cycle could be nearing a pause and dragged sterling lower across the board.
On the other hand, the US dollar prolonged its recent strong bullish run and shot to its highest level since December 2002 amid firming expectations for a more aggressive policy tightening by the Fed. Wednesday's release of the US CPI reaffirmed market bets for at least a 50 bps Fed rate hike move at the upcoming policy meetings on June 15 and July 27.
The prospects for rapid rate hikes in the US, along with tight global supply chains resulting from China's zero-COVID policy and the war in Ukraine, fueled worries about a possible recession. This, in turn, took its toll on the global risk sentiment, which was evident from an extended sell-off in the equity markets and further benefitted the safe-haven buck.
That said, extremely oversold conditions helped limit further losses for the GBP/USD pair, only for the time being. Nevertheless, the fundamental backdrop remains tilted in favour of bearish traders, suggesting that any attempted recovery runs the risk of fizzling out rather quickly.
Technical levels to watch
EUR/USD fell below the 1.0400 level for the first time since January 2017 on Thursday, with the bears now eyeing a test of 2017 lows in the 1.0340 area. EUR/USD's on-the-day losses now stand at over 1.1% as traders dump the euro in favour of the safe-haven US dollar amid heightened worries about tensions between the EU and Russia amid the latter's ongoing invasion of Ukraine.
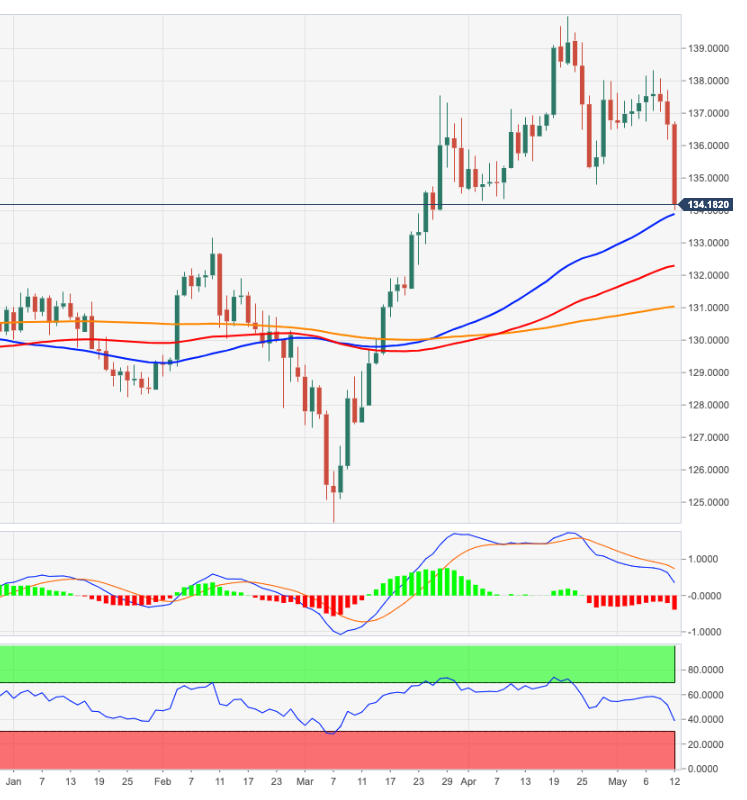
- EUR/JPY corrects sharply lower and challenges 134.00.
- Further downside could see the 55-day SMA retested initially.
EUR/JPY extends the weekly leg lower and revisits the 134.00 neighbourhood on the back of the resurgence of the risk aversion in the broader markets.
The continuation of the downtrend should meet temporary support at the 55-day SMA and the 100-day SMA at 133.87 and 132.27, respectively, in the short-term horizon. Down from here emerges the always relevant 200-day SMA, today at 131.00.
In the meantime, while above the 200-day SMA, the outlook for the cross is expected to remain constructive.
EUR/JPY daily chart
No final decision has been taken on the Northern Ireland Protocol, a spokesperson for UK PM Boris Johnson said on Thursday. The UK will see what, if any, progress can be made on the protocol and there will be further discussions at the official level with the EU in the coming days, the spokesperson added.
The UK government has been threatening to unilaterally scrap the protocol, which is currently the focal point of a political impasse preventing the formation of a new regional Northern Ireland government following regional elections there over the weekend. The EU has threatened to scrap its post-Brexit trade deal with the UK if it takes such a move.
Economist at UOB Group Ho Woei Chen, CFA, reviews the latest inflation figures in the Chinese economy.
Key Takeaways
“China’s headline CPI rose at a faster than expected pace, by 2.1% y/y (Bloomberg est: 1.8% y/y, Mar: 1.5% y/y), to a 5-month high in Apr. Higher fresh food prices due to domestic COVID-19 disruption and increases in fuel costs more than offset the negative impact on services and consumption demand. Compared to the previous month, CPI was up 0.4% m/m after staying flat in Mar.”
“China’s Producer Price Index (PPI) moderated to 8.0% y/y in Apr (Bloomberg est: 7.8% y/y, Mar: 8.3% y/y) due to the high comparison base but this was still above consensus expectation. The sequential gains indicated the presence of cost pressures on producers as PPI rose for the third consecutive month, by 0.6% m/m in Apr (Mar: 1.1% m/m).”
“We maintain our full-year 2022 inflation forecast at 2.9% (2021: 0.9%). The full-year PPI is likely to come in at the higher end of our 5%-6% forecast (2021: +8.1%).”
“Demand-side inflationary pressure has eased in Apr as seen in the moderation of China’s core CPI. The PBoC could reduce its 1-year medium-term lending facility (MLF) rate this month (13-16 May) by 5-10 bps as it increases growth support. We maintain our forecast for the benchmark 1Y loan prime rate (LPR) to fall to 3.55% by the end of 2Q/3Q 2022.”
European Central Bank (ECB) Governing Council member Gabriel Makhlouf said on Thursday that it was realistic to expect that the ECB interest rates are likely to be in positive territory by early next year, as reported by Reuters.
Additional takeaways
"We have reached the point where we on ECB's Governing Council need to act."
"It is time for the council to move to end net asset purchases under the asset purchase programme next month or in July."
"The current level of inflation is concerning."
"Our objective is for inflation to be at 2 % over the medium term - levels are significantly above that now."
"The era of negative rates is reaching its conclusion."
"We are continuing on a path towards the normalisation of monetary policy."
"Tightening labour market should result in stronger and broader-based wage growth than we have observed in recent years."
"Potential of wages becoming detached from underlying productivity growth presents clear risks to Irish competitiveness."
Market reaction
The shared currency stays under selling pressure despite these hawkish comments and EUR/USD was last seen losing 0.75% on a daily basis at 1.0433.
- USD/CAD regained positive traction on Thursday and climbed back closer to the YTD peak.
- Aggressive Fed rate hike bets continued benefitting the USD and extended some support.
- A fresh leg down in oil prices weighed on the loonie and provided an additional lift to the pair.
The USD/CAD pair extended its steady intraday ascent through the mid-European session and climbed to the 1.3045 area, back closer to the YTD peak in the last hour.
A combination of supporting factors assisted the USD/CAD pair to build on the overnight goodish rebound from the 1.2920 area and gain some follow-through traction on Thursday. Firming expectations for a more aggressive policy tightening by the Fed pushed the US dollar to its highest level in nearly two decades. Apart from this, sliding crude oil prices undermined the commodity-linked loonie and acted as a tailwind for the major.
Despite signs that inflationary pressures in the world's biggest economy are peaking, investors seem convinced that the Fed will stick to its rate hike cycle. In fact, money market futures are now pricing in an 81% chance of a jumbo 75 bps rate hike in June amid concerns that China's zero-covid policy and the war in Ukraine would push consumer prices even higher. This, along with the risk-off mood, further benefitted the safe-haven buck.
Worries that fast-rising inflation will drive a sharp rise in interest rates and bring the global economy to a standstill tempered investors' appetite for perceived riskier assets. Apart from growing recession fears, strict Covid-19 lockdowns in China raised concerns about slowing fuel demand. Adding to this, a delay in the approval of the European Union's proposed phased embargo on Russian oil weighed on crude oil prices.
It, however, remains to be seen if bulls can capitalize on the move or if the USD/CAD pair meets with a fresh supply at higher levels, warranting some caution before positioning for any further gains. Market participants now look forward to the US Producer Price Index (PPI), which, along with the US bond yields and the broader risk sentiment, will influence the USD. Traders will further take cues from oil price dynamics to grab some short-term opportunities.
Technical levels to watch
- Copper price resumes the downslide as growth concerns fuel demand fears.
- Comex copper threatens the $4-mark, LME copper breaches the $9,000 level.
- Investors seek refuge in the safe-haven US dollar, as hot US CPI spooks the market.
Copper, the so-called economic bellwether, has resumed its bearish momentum following a temporary rebound seen on Wednesday.
The latest downside leg in the red metal has knocked down the rates to the lowest level since September 2021, as bears look to take out the $4 mark on Comex futures while the LME copper futures are already trading under the $9,000, having lost the $10,000 threshold a week ago.
The renewed sell-off in copper price is mainly driven by growing demand concerns for the metal, as the global economy risks a slowdown amid surging inflation and a hawkish Fed outlook.
Hotter than expected US CPI data fuelled concerns that the Fed could go in for aggressive rate hikes in the coming months, bringing the post-pandemic global economic recovery to a standstill.
Further, China’s covid lockdowns and Ukraine crisis-led supply chain disruptions also add to the global growth worries, eventually heightening fears over the demand for the red metal.
That said, any recovery attempts in the barometer of the world economy are likely to remain short-lived and could be seen as a good selling opportunity for traders.
- EUR/USD collapses to the 1.0420 region on Thursday.
- The re-emergence of the risk aversion put the pair under extra pressure.
- ECB’s Kazimir advocated for a rate hike in July.
Sellers regained control over the single currency and dragged EUR/USD to fresh cycle lows in the 1.0420 region on Thursday, an area last visited back in January 2017.
EUR/USD weak on USD-buying, risk-off
The resurgence of geopolitical-led risk aversion lent unexpected legs to the greenback and the rest of the safe haven universe in the second half of the week and forced EUR/USD to break below the multi-session consolidative theme to print fresh lows in the 1.0420 zone.
In addition, the moderate demand for bonds motivated the German 10y Bund yields to shed ground for the third session in a row and return to the sub-0.90% region so far on Thursday.
No reaction in the exchange rate after ECB’s Board member Kazimir joined the July-rate-hike bandwagon earlier in the session, falling in line with his colleagues’ comments so far this week.
The domestic calendar is muted on Thursday, although Producer Prices and the usual Initial Claims will take centre stage across the Atlantic.
What to look for around EUR
EUR/USD loses the grip and revisits the 1.0420 region for the first time since January 2017. The outlook for the pair remains well entrenched into the negative camp, always in response to dollar dynamics, geopolitical concerns and the Fed-ECB divergence. Occasional pockets of strength in the single currency, in the meantime, should appear reinforced by speculation the ECB could raise rates at some point in the summer, while higher German yields, elevated inflation and a decent pace of the economic recovery in the region are also supportive of an improvement in the mood around the euro.
Key events in the euro area this week: EMU Industrial Production (Friday).
Eminent issues on the back boiler: Asymmetric economic recovery post-pandemic in the euro area. Speculation of ECB tightening/tapering later in the year. Impact on the region’s economic growth prospects of the war in Ukraine.
EUR/USD levels to watch
So far, spot is losing 0.84% at 1.0424 and a break below 1.0422 (2022 low May 12) would target 1.0400 (round level) en route to 1.0340 (2017 low January 3 2017). On the flip side, the next up barrier aligns at 1.0641 (weekly high May 5) followed by 1.0936 (weekly high April 21) and finally 1.1000 (round level).
The Bank of England (BoE) is set to undertake a gradual tightening of monetary policy, which will put the pound under depreciation pressure, economists at Commerzbank report. Moreover, the EUR should benefit from the ECB's interest rate hikes from the summer onward. Thus, EUR/GBP is set to grin higher until end-2022
Cautious BoE to weigh on sterling
“The BoE is continuing its gradual tightening of monetary policy. However, it is likely to act less restrictively than expected by the market. The pound should suffer increasingly from this.”
“Another burdening factor is that the ECB is also likely to initiate its monetary policy turnaround in July. We, therefore, expect EUR/GBP to trade higher in the course of the year.”
“Since the ECB is likely to pause after three rate hikes, while the BoE in our opinion will tighten its monetary policy further in 2023, the pound should be able to appreciate again against the EUR in 2023.”
GBP/USD has slumped to its weakest level in two years below 1.22 as weaker than expected UK growth data weigh heavily on the pound. In the view of FXStreet’s Eren Sengezer, the pair looks likely to continue to push lower amid risk aversion.
Things look bad for the pound after dismal data
“The UK's Office for National Statistics reported that the British economy grew by 0.8% on a quarterly basis in the first quarter. This print missed the market expectation of 1% and reminded investors of the Bank of England's (BoE) warning that there could be a recession in 2022, causing the pound to come under heavy selling pressure.”
“Brexit jitters put additional weight on the pound's shoulders. The European Union (EU) is reportedly ready to suspend the trade deal with the UK if the Northern Ireland Protocol is revoked unilaterally.”
“In case the pair fails to reclaim 1.22 (psychological level, descending trend line), additional losses toward 1.2150 (static level from May 2020) and 1.2100 (May 15, 2020, low, psychological level) could be witnessed.”
“1.2250 (former support, static level from June 2020) and 1.2300 (psychological level, 20-period SMA) align as the next recovery targets if buyers manage to lift cable above 1.22.”
- Gold oscillated in a narrow band around the $1,850 area through the first half of the European session.
- Aggressive Fed rate hike bets pushed the USD to a two-decade higher and capped the commodity.
- Retreating US bond yields and the global flight to safety helped limit losses for the safe-haven metal.
Gold struggled to capitalize on the overnight post-US CPI gains and witnessed subdued/range-bound price action on Thursday. The XAUUSD seesawed between tepid gains/minor losses through the first half of the European session and was last seen trading in neutral territory, around the $1.850 region.
The latest US consumer inflation readings came in higher than expected and reinforced market bets for a more aggressive policy tightening by the Fed. In fact, money market futures are now pricing in an 81% chance of a jumbo 75 bps rate hike in June amid concerns that China's zero-covid policy and the war in Ukraine would continue to push consumer prices higher. This, in turn, pushed the US dollar to its highest level in nearly two-decade and dented demand for the dollar-denominated gold.
The prospects for rapid interest rate hikes in the US, along with strict COVID-19 lockdowns in China, have been fueling concerns about softening global growth and a possible recession. This continued weighing on investors' sentiment and was evident from an extended sell-off in the equity markets, which extended some support to the safe-haven gold. The global flight to safety, coupled with signs that inflationary pressures in the world's biggest economy are peaking, dragged the US Treasury bond yields higher. This was seen as another factor that helped limit any deeper for the non-yielding yellow metal.
Even from a technical perspective, spot prices showed some resilience below the very important 200-day SMA, which further held back bearish traders from placing aggressive bets. Market participants now look forward to the US Producer Price Index (PPI), due for release later during the early North American session. The data, along with the US bond yields, will influence the USD price dynamics and provide some impetus to gold. Traders will further take cues from the broader market risk sentiment to grab some short-term opportunities.
Technical levels to watch
- GBP/USD hovers near two-year lows on risk-off trading, UK growth woes.
- Cable confirmed an ascending triangle breakdown on the 4H chart on Wednesday.
- Bears gear up for the additional downside towards the pattern target of 1.2158.
GBP/USD is trading back below 1.2200 following a temporary pullback to near 1.2230 region, as disappointing UK GDP data continue to power GBP bears.
The UK economy contracted 0.1% in March while expanding merely 0.8% QoQ in the first quarter of 2022, backing the BOE’s forecasts of a likely recession later this year.
The downbeat UK growth data combined with the risk-off market profile keeps the downside pressure intact on cable.
Investors shrugged off the upbeat comments from the BOE Deputy Governor Dave Ramsden, as he said that “the central bank isn’t talking down the economy in forecasts.”
Also read: UK Preliminary GDP expands 0.8% QoQ in Q1 vs. 1.0% expected
Looking at cable’s four-hour chart, Wednesday’s confirmation of the ascending triangle breakdown, below the 1.2310 rising trendline support, has opened floors for a test of the pattern target measured at 1.2158.
The Relative Strength Index (RSI) is probing the oversold territory around 30.00, allowing room for more downside.
Should the abovementioned key support give way, a test of the 1.2100 round figure will be inevitable.
GBP/USD: Four-hour chart
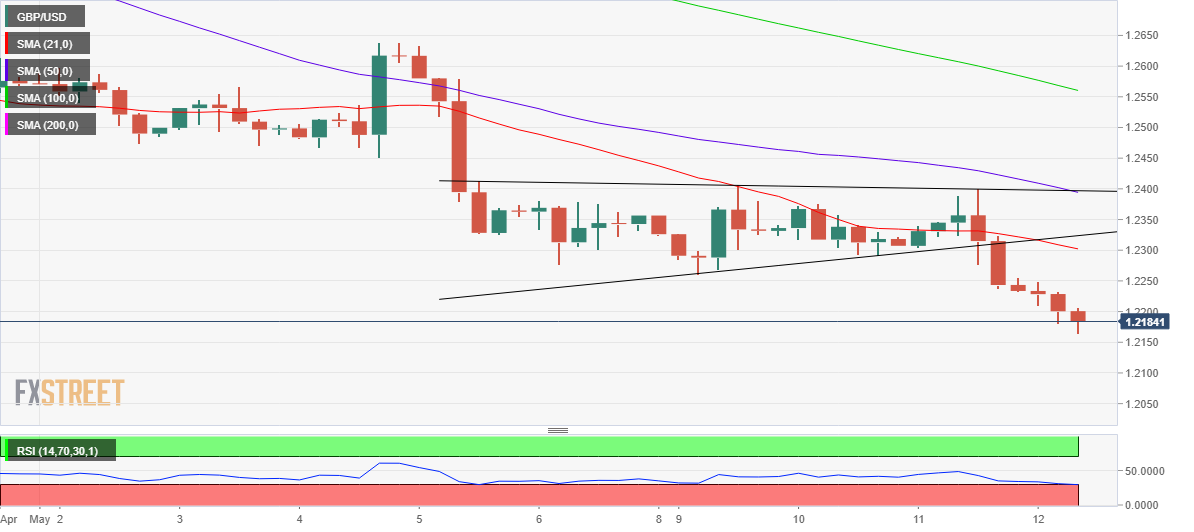
On the other side, any recovery attempts will need acceptance above daily highs of 1.2255.
The next upside target is seen at the bearish 21-Simple Moving Average (SMA) at 1.2302, above which the triangle support now resistance at 1.2323 will come into play.
GBP/USD: Additional technical levels
There is still chance for USD/CNH to retest the 6.8000 region in the next weeks, commented FX Strategists at UOB Group Lee Sue Ann and Quek Ser Leang.
Key Quotes
24-hour view: “We expected USD to ‘trade between 6.7200 and 6.7800’ yesterday. USD subsequently traded within a narrower range than expected (6.7313/6.7675). The current movement still appears to be part of a consolidation and we expect USD to trade between 6.7300 and 6.7800 for today.”
Next 1-3 weeks: “There is not much to add to our update from yesterday (11 May, spot at 6.7500). As highlighted, upward momentum has waned somewhat but until there is a clear breach of 6.7100, we still see chance for one more push higher in USD to 6.8000.”
The European Central Bank (ECB) is rate to hike the key rate in July, ECB policymaker and Slovak central bank Governor Peter Kazimir tweeted out on Thursday.

Kazimir's comments on the rate hike outlook echo his colleagues, as the ECB steers towards a likely rate hike in the early third quarter.
Market reaction
EUR/USD is off the lows but remains 0.53% lower on the day, currently trading at 1.0453.
- AUD/USD witnessed heavy follow-through selling on Friday and dived to a near two-year low.
- Aggressive Fed rate hike bets continued underpinning the USD and exerted downward pressure.
- Recession fears also benefitted the USD and drove flows away from the perceived riskier aussie.
The AUD/USD pair now seems to have entered a bearish consolidation phase and was seen oscillating in a range near its lowest level since June 2020, just below the 0.6900 mark.
Following the previous day's rather volatile price swings, the AUD/USD pair witnessed heavy selling on Thursday and was pressured by the underlying strong bullish sentiment surrounding the US dollar. Despite signs that inflationary pressures in the world's biggest economy are peaking, the markets seem convinced that the Fed would tighten its monetary policy at a faster pace. This, in turn, continued acting as a tailwind for the greenback and dragged spot prices lower.
In fact, money market futures are now pricing in an 81% chance of a jumbo 75 bps rate hike in June amid concerns that China's zero-covid policy and the war in Ukraine would continue to push consumer prices higher. The prospects for rapid interest rate hikes in the US, along with looming recession fears, weighed on investors' sentiment. This further benefitted the greenback's safe-haven status and contributed to driving flows away from the perceived riskier aussie.
The downward trajectory took along some short-term trading stops placed near the previous YTD low, around the 0.6910 region. The subsequent technical selling was seen as another factor that aggravated the bearish pressure and contributed to the AUD/USD pair's steep decline. That said, extremely oversold conditions on hourly charts held back bearish traders from placing fresh bets. Any meaningful recovery, however, seems elusive and runs the risk of fizzling out rather quickly.
Market participants now look forward to the US Producer Price Index (PPI), due for release later during the early North American session. The data, along with the US bond yields, will influence the USD price dynamics and provide some impetus to the AUD/USD pair. Traders will further take cues from the broader market risk sentiment to grab some short-term opportunities.
Technical levels to watch
AUD/USD prints lows since June 2020 below 0.69. Economists at Westpac think that the pair could slide as far as 0.6760.
Australia’s commodity price basket to propel the aussie back to the mid-0.70s in coming months
“Firm USD backed by Fed hawkishness and the not coincidental very sour sentiment in equity markets suggest scope for further AUD decline.”
“Look for a probe of support at 0.6805/33, potentially as far as 0.6760 multi-day/week, a clear buying opportunity.”
“Australia’s commodity price basket should underpin AUD in coming months, back to the mid-0.70s.”
- WTI price is reversing the previous rebound, as it tested $101.50.
- Firmer US dollar, risk-off flows weigh on the higher-yielding US oil.
- WTI sellers remain hopeful following the dismal IEA monthly report.
WTI (NYMEX futures) is trading under heavy selling pressure so far this Thursday, reversing roughly a quarter of Wednesday’s sharp gains.
The renewed downside in the US oil intensified over the last hour, as risk-off intensified on the European open and engulfed higher-yielding assets such as oil.
The US dollar extended its upsurge, benefiting from the risk-off flows, as the dollar gauge trades at its highest level in two decades near 104.30.
Markets shun riskier assets amid heightened worries over surging inflation and global economic growth fears after hotter US CPI bolstered the Fed’s tightening bets. Further, the Chinese covid lockdowns-led supply chain crisis also keeps sapping investors’ confidence.
The International Energy Agency’s (IEA) downward revision to the global oil demand forecasts for 2022 by 70K barrels collaborated with the renewed selling pressure around the black gold. IEA said that Chinese lockdowns and high inflation are to be blamed for lower oil demand projections.
Attention now turns towards the US open, with the risk-off profile likely to extend, reflective of the 0.50% drop in the S&P 500 futures. Unabated US dollar demand is likely to keep the USD-priced WTI on the backfoot.
WTI: Technical levels to watch
In the view of economists at Westpac, the US Dollar Index (DXY) is likely to stay well supported in the coming days and weeks. A clean break of 104 is opening the door to a run at 20-year highs near 107.
DXY uptrend in very good shape
“DXY uptrend in very good shape, the Fed on a resolutely hawkish path, while events in the Eurozone and China weigh on global growth expectations.”
“A break of 104 opens the door to a run at 20-year highs near 107.”
NZD/USD is trading at its lowest level in nearly two years at around mid-0.6200. The near term outlook remains bearish, with potential to reach 0.6230 and possibly 0.6100, economists at Westpac report.
RBNZ inflation expectations survey shows some sign of slowing
“NZD/USD’s downward correction since early April can extend further, the USD remaining supported by the Fed’s tightening cycle as well as broad-based risk-aversion. The next technical target is 0.6230, with 0.6100 a possibility.
“Today’s RBNZ inflation expectation survey for Q2 revealed some slowing in some indicators. Notably, the 2yr-ahead measure remained unchanged, as did the 10yr-ahead measure, suggesting expectations may be at or near a peak.”
“Multi-month, we retain a bullish outlook, targeting 0.7000 by year end. Fed pricing should start to stabilise in the latter part of this year, and NZ commodities are expected to become a major driver of the NZD.”
“I have always said I am ready to do more to support households,” UK Finance Minister Rishi Sunak said Thursday.
Further comments
“We continue to learn more and that will help us to get the decisions right.”
“I am not naturally attracted to windfall taxes in general.”
“Oil and gas firms are making big profits because of elevated prices.”
“If the investment doesn't happen, no options are off the table. “
“He is pragmatic about windfall taxes.”
His comments come after the UK economy contracted 0.1% in March while growing merely 0.8% QoQ in Q1 2022.
Market reaction
GBP/USD remains heavy around 1.2200, fading BOE Dave Ramsden’s comments-led rebound. The pair is down 0.38% so far.
USD/JPY has not been able to break convincingly above 130. In the opinion of economists at Westpac, wider risk-off theme suggests waiting for a break below 128.65 before thinking of buying.
A break above 130 appears just a matter of time
“With the Fed effectively pre-announcing a series of 50bp moves plus record QT, it’s hard to imagine that we have seen the highs, and a break above 130 appears just a matter of time. However, the wider risk-off move in recent sessions may be a factor capping near-term gains, and a break below 128.50 would warn of near-term correction risks.”
“We would like to buy dips into weakness, but are willing to give the risk-off theme a few days to run here.”
The economic and political costs of eliminating dependency on Russian energy are likely to weigh on EU growth and EUR into 2H 2022. Economists at Westpac expect the EUR/USD pair to slide towards 2017 lows of 1.0350/40.
More prolonged conflict in Ukraine would again weigh on EU activity
“The growing guidance towards dealing with the likelihood of inflation now being close to or above target through their forecast period clearly warrants the withdrawal of accommodative policy. Therefore there has been a unified call to end QE in June and start raising rates from current NIRP as early in Q3 as data allows, most likely in July.”
“The key problem for ECB is the risk of escalation of the conflict in Ukraine and the risk of a sudden end to energy supplies from Russia. These pressures are also at risk of dividing the current unified stance of EU. This may mean a less forthright EU stance and, as seems to be Russia’s intent now, more prolonged conflict in Ukraine which would again weigh on EU activity.”
“The lack of key timely data in the coming week will leave EUR at risk of further declines to retest 1.0340/50 (2017 lows) if not the 1.0200-50 area.”
Political risks and the BoE’s challenging task of dealing with escalating UK inflation and the cost of living crunch risk of recession continue to weigh on GBP. Economists at Westpac note that GBP/USD is at risk of falling toward 1.21.
UK’s political backdrop has become more complex after local elections
“Last week’s Bank of England meeting surprised with its elevated profile for inflation within the quarterly MPR (peaking above 10.4%). The MPR incorporated market pricing of BoE’s cash rate rising to 2.5%. Although a lower rate path might allow positive growth, it could fuel higher inflation (above 12%). The uncertainty in their outlook, especially given exogenous supply and cost risks, means that BoE will be increasingly data and survey-dependent. The MPC is facing its greatest challenge since its inflation targeting mandate began.”
“Although a national election is still some way off, UK’s political backdrop has become more complex after local elections which have refreshed independence concerns in Scotland and issues around NI Protocol. Both issues add to uncertainty and pressure on GBP.”
“Unless a clear rebound above 1.2500 occurs, GBP/USD risks a further slide to test 1.2100.”
In its monthly oil market report, the International Energy Agency (IEA) revised down oil demand growth projections for this year by 70,000 bpd on Chinese lockdowns and high prices.
Additional takeaways
Refinery runs set to ramp up by 4.7 mln bpd between now and august but market tightness will continue.
Global observed oil inventories declined by 45 mln barrels in March.
Global refinery margins have surged due to depleted product inventories, constrained refinery activity.
Russia oil exports of 8.1 mln bpd were back to the January February average.
New embargoes could accelerate reorientation of trade flows in russian oil toward Asia.
Despite sanctions, total Russian oil exports increased month-on-month in April by 620,000 bpd.
Russian oil supply losses could expand to around 3 mln bpd from July onwards.
Sees overall decline of Russian supply by 1.6 mln bpd in May and 2 mln bpd in June.
Russia shut in nearly 1 mln bpd of oil in April, driving down world oil supply to 98.1 mln bpd.
Russia sanctions, lack of storage will cause russian producers to shut in more wells.
Expects steadily rising volumes from Mideast OPEC+ states, US as China covid lockdowns sap demand.
Does not expect acute supply deficit amid worsening russian supply disruption.
Market reaction
WTI sees a fresh supply wave on the IEA report, now back under the $102 mark. The US oil is trading at $101.72, down 2.4% on the day, as of writing.
The US Dollar Index (DXY) is edging to a new high. With no signs of a floor in the renminbi and US inflation keeping the Federal Reserve on the front foot, the dollar bull trend looks set to continue, economists at ING report.
April inflation keeps Fed in aggressive tightening mode
“Instead of showing any real signs of slowing, yesterday's US inflation data delivered a worrying 0.6% month-on-month rise in core prices and does nothing to suggest that the Fed will be any more relaxed in the pace and endpoint of its tightening cycle. This should be a core story that supports the dollar over the coming months – i.e. that the Fed has more cause than most to get its policy rate to neutral.”
“Until we see some major Chinese stimulus or a shift in Covid policy (very unlikely), the uncertainty over where this USD/CNY rally stops (6.80 or 7.00?) will keep commodity currencies and EM FX in general under pressure. And will keep the dollar bid.”
“On the calendar today we have US PPI, which is expected to edge lower from its 11% year-on-year peak. We doubt this will soften the dollar at all.”
EUR//USD continues to languish near the lows. Economists at ING believe that the world’s most popular currency pair could test the 1.0350 support.
Little the ECB can do about the soft EUR/USD
“European Central Bank President Christine Lagarde has all but confirmed that the ECB is ready to start hiking rates in July, pointing to a three-hike scenario and the deposit rate ending the year at 0.25%. However, that scenario has been well priced for some time and is providing little support to the euro. Instead, the pro-growth euro is being battered by growth headwinds from the war in Ukraine and China's self-inflicted slowdown.”
“On a day when pro-cyclical currencies are on the back foot, EUR/USD looks as though it can grind lower on its multi-day way towards the next big support at 1.0350.”
Extra range bound within 128.40 and 131.00 is likely in USD/JPY in the next weeks, noted FX Strategists at UOB Group Lee Sue Ann and Quek Ser Leang.
Key Quotes
24-hour view: “Yesterday, we expected USD to ‘consolidate and trade sideways between 129.80 and 130.70’. USD did not quite consolidate as it traded in a volatile manner between 129.43 and 130.81. Despite the volatile price actions, the underlying tone has softened and we downside risk for USD today. That said, any weakness is expected to encounter strong support at 129.20. Resistance is at 130.00 followed by 130.30.”
Next 1-3 weeks: “We continue to hold the same view as from Tuesday (10 May, spot at 130.10). As highlighted, USD appears to have moved into consolidation phase and is likely to trade between 128.40 and 131.00.”
GBP/USD is trading at its lowest level in two years below 1.22. Economists at ING expect cable to extend its losses to tward the 1.20 level.
Politics hit the pound
“Reports suggest that the UK government is giving the EU until early next week to soften Northern Ireland's trading arrangements, otherwise the UK will introduce legislation to do so. A UK-EU trade war will be the headline and will not be welcome for the growth-sensitive sterling.”
“Cable remains very heavy and can continue edging towards 1.20.”
“EUR/GBP could edge higher to 0.8650, but as we have seen with EUR/GBP over the last two years, chasing short-term moves remains dangerous and it could easily reverse.”
- USD/JPY came under intense selling pressure on Thursday and dropped to over a two-week low.
- The risk-off mood underpinned the safe-haven JPY and exerted pressure amid sliding US bond yields.
- Aggressive Fed rate hike bets continued acting as a tailwind for the USD and might extend support.
The USD/JPY pair witnessed aggressive selling during the early European session and dived to a two-week low, closer to mid-128.00s in the last hour.
A combination of factors exerted heavy pressure on the USD/JPY pair for the second successive day on Thursday and dragged spot prices further away from over a two-decade high touched earlier this week. The prevalent risk-off environment - as depicted by an extended sell-off in the equity markets - boosted demand for the safe-haven Japanese yen. This, along with a further pullback in the US Treasury bond yields, further inspired bearish traders and exerted downward pressure on the USD/JPY pair.
The yearly US CPI print suggested that inflationary pressures in the world's biggest economy are peaking. This, along with the anti-risk flow, dragged the yield on the benchmark 10-year US government bond to a two-week low. Apart from this, technical selling below the 100-period SMA support, around mid-129.00s, was seen as another factor that contributed to the USD/JPY pair's downfall. A subsequent slide below the 129.00 round-figure mark might have already set the stage for additional losses.
That said, the underlying bullish sentiment surrounding the US dollar could lend some support to the USD/JPY pair and limit the ongoing corrective slide. The headline and core US CPI were strong enough to reinforce market bets for a more aggressive policy tightening by the Fed. In fact, money market futures are now pricing in an 81% chance of a jumbo 75 bps rate hike in June. This should continue to act as a tailwind for the USD and spot prices amid a big divergence in the Fed-BoJ policy outlooks.
Technical levels to watch
- DXY moves higher and remains supported by risk-off mood.
- Demand for bonds drag US yields lower across the board.
- Weekly Claims, Producer Prices next of relevance in the docket.
The US Dollar Index (DXY), which tracks the greenback vs. a bundle of its main competitors, accelerates gains and reaches new cycle peaks near 104.50 on Thursday.
US Dollar Index stronger on risk-off
The index picks up extra pace and extends the rally to levels last seen back in December 2002 around 104.40/50 against the backdrop of rising risk aversion in the global markets and the subsequent impact on the risk complex.
Furthermore, the prevailing risk-off mood supports fresh inflows into the bonds markets and put yields under extra downside pressure along the curve, at a time when investors continue to gauge the latest US inflation figures vs. the recent hawkish Fedspeak and prospects of further tightening by the Federal Reserve.
Later in the NA session, the usual Initial Claims are due seconded by Producer Prices for the month of April.
What to look for around USD
The dollar extends the march north and prints new tops near 104.50 on Thursday. This time, the move appears underpinned by the re-emergence of the risk aversion, which in turn looks reinforced by geopolitical concerns. Also supporting the buck appears investors’ expectations of a tighter rate path by the Federal Reserve and its correlation to yields, the current elevated inflation narrative and the solid health of the labour market. On the negatives for the greenback turn up the incipient speculation of a “hard landing” of the US economy as a result of the Fed’s more aggressive normalization.
Key events in the US this week: Producer Prices, Initial Claims (Thursday) – Flash Consumer Sentiment (Friday).
Eminent issues on the back boiler: Escalating geopolitical effervescence vs. Russia and China. Fed’s rate path this year. US-China trade conflict. Future of Biden’s Build Back Better plan.
US Dollar Index relevant levels
Now, the index is advancing 0.17% at 104.18 and the breakout of 104.43 (2022 high May 12) would open the door to 105.00 (round level) and finally 105.63 (high December 11 2002). On the other hand, immediate contention appears at 102.35 (low May 5) seconded by 99.81 (weekly low April 21) and then 99.57 (weekly low April 14).
- EUR/USD witnessed heavy selling on Thursday and dived to a fresh multi-year low.
- Aggressive Fed rate hike bets, the risk-off mood continued underpinning the USD.
- Concerns about the economic fallout from the Ukraine crisis weighed on the euro.
The EUR/USD pair broke down of its one-week-old trading range and slipped below mid-1.0400s, to its lowest level since January 2017 during the early part of the European session.
Despite signs that inflationary pressures in the world's biggest economy are peaking, the markets seem convinced that the Fed would tighten its monetary policy at a faster pace. This, in turn, continued acting as a tailwind for the US dollar and exerted downward pressure on the EUR/USD pair.
Apart from this, the prevalent risk-off environment - as depicted by an extended sell-off in the equity markets - further benefitted the greenback's safe-haven status. On the other hand, the shared currency was further weighed down by concerns that the European economy will suffer the most from the Ukraine crisis.
Key levels to watch
- Gold prices rebound from intraday low as US Treasury yields drop to fresh low in two weeks.
- DXY cheers risk-off but yields stay pressured amid mixed Fedspeak, anxiety ahead of US PPI.
- Headlines from China, Russia add to the sour sentiment, S&P 500 Futures refresh yearly low.
- Gold Price Forecast: For how long can the 200-DMA support hold?
Gold (XAU/USD) picks up bids from intraday low to pare daily losses around $1,853 amid the initial hour of the European session on Thursday. The yellow metal’s latest rebound could be linked to a slump in the US Treasury yields, which in turn tests US dollar buyers. Even so, the risk-off mood keeps gold buyers on their toes ahead of the US Producer Price Index (PPI) for April.
US 10-year Treasury yields dropped seven basis points (bps) to 2.84%, the lowest level since April 29. With this, the key bond coupon declines for the fourth consecutive day after refreshing the 20-year high on Monday. It should be noted that the US Dollar Index (DXY) remains firmer around 104.00, after refreshing a two-decade high of 104.21 earlier in the day.
The pullback in the yield could well be linked to the mixed comments from the Federal Reserve (Fed) policymakers. However, the US Dollar remains mostly firmer, despite recently easing, amid the risk-off mood.
That said, the US dollar struggles to cheer firmer inflation numbers, despite the latest uptick near a 20-year high, as policymakers have recently stepped back from bold calls. During early Thursday in Asia, the previously hawkish Federal Reserve Bank of St. Louis James Bullard mentioned that he ''won't emphasize single inflation report too much but inflation is more persistent than many have thought.''
Also contributing to the USD strength is the indecision over China’s covid conditions and Europe’s readiness for more sanctions on Russia. Furthermore, economic fears emanating from the UK’s latest economics also underpin the greenback’s safe-haven demand.
Even so, today’s US PPI for April, expected at 10.7% YoY versus 11.2% prior, will be important for the USD and gold prices.
Technical analysis
A convergence of the 50-HMA and ascending trend line from the previous day’s low, also the lowest since February, at around $1,849, restrict the immediate downside of the gold prices.
However, buyers need to cross the 200-HMA, at $1,868 by the press time, to aim for the $1,900 threshold.
Meanwhile, a sustained trading below $1,849 won’t hesitate to drag gold prices towards a refreshing three-month low, currently around $1,832.
Overall, gold prices remain pressured but the immediate downside seems limited.
Gold: Hourly chart
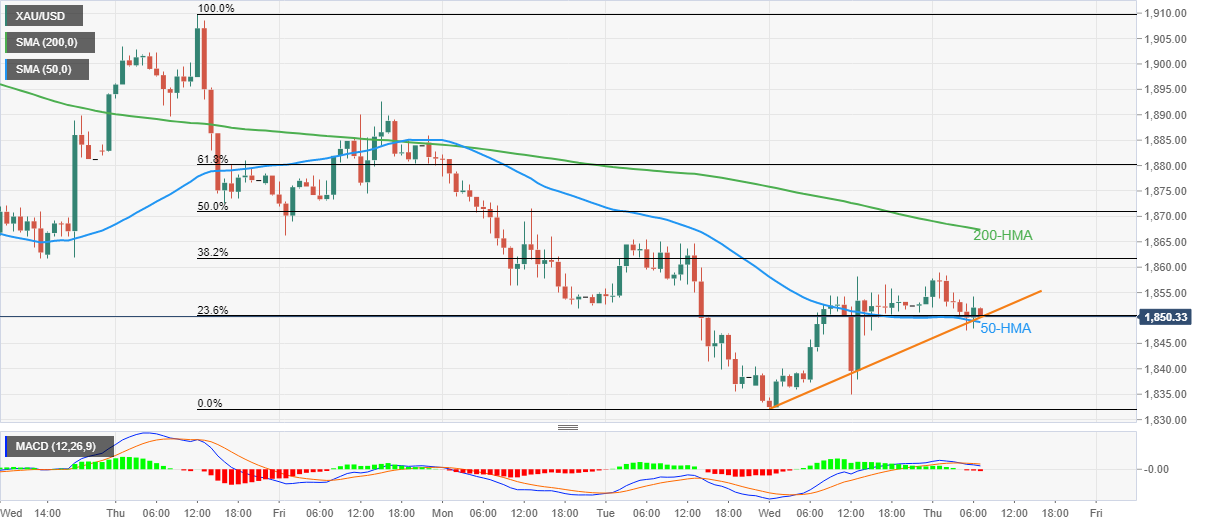
Trend: Corrective pullback expected
Commodity prices broadly remain clearly above pre-covid levels. In the opinion of economists at Danske Bank, persistent supply challenges will likely maintain metal prices clearly above pre-covid lows for the time being.
Metals supply has declined broadly, not just in Russia
“Tight supply still points towards metal prices remaining at elevated levels, while Chinese infrastructure stimulus provides backdrop for demand.”
“Russia is not the only factor weighing on supply: covid-disruptions, earlier underinvestment, strikes and social unrest due to rising costs of living in EM producer countries all contribute toward metal supply remaining below pre-covid trend.”
“Increased investment into alternative energy sources in Europe combined with the persistent supply challenges will likely maintain metal prices clearly above pre-covid lows for the time being.”
Here is what you need to know on Thursday, May 12:
The greenback regathered its strength after the US inflation data on Wednesday and continued to outperform its rivals during the Asian trading hours on Thursday. The US Dollar Index is sitting at its highest level since late-2002 above 104.00 ahead of the April Producer Price Index (PPI) data from the US. Meanwhile, major European equity indices remain on track to open deep in negative territory with Euro Stoxx 600 Futures losing nearly 2% on the day. Similarly, US stock index futures are down 0.3%, reflecting the risk-averse market environment.
The data published by the US Bureau of Labor Statistics showed on Wednesday that inflation in the US, as measured by the Consumer Price Index (CPI), was 8.3% on a yearly basis in April. Although this print was lower than the March reading of 8.5%, it still surpassed the market expectation of 8.1%. Additionally, the Core CPI, which excludes volatile food and energy prices, arrived at 6.2% in the same period, compared to analysts' estimate of 6%.
US CPI Quick Analysis: Dark clouds cover peak inflation, King Dollar to dominate.
Earlier in the day, the UK's Office for National Statistics (ONS) reported that the Gross Domestic Product (GDP) expanded by 0.8% on a quarterly basis in the first quarter. With this figure falling short of the market expectation of 1%, the British pound came under renewed selling pressure. Other data from the UK revealed that the Manufacturing Production declined by 0.2% in March following February's contraction of 0.6%. GBP/USD was last seen trading at its lowest level in two years near 1.2200.
EUR/USD stays on the back foot early Thursday and tests 1.0500. Hawkish comments from European Central Bank (ECB) officials failed to help the shared currency find demand on Wednesday. ECB President Christine Lagarde acknowledged that it was increasingly unlikely for the disinflationary dynamics of the past decade to return and reiterated that a rate hike could come a few weeks after they conclude the APP early in the third quarter.
NZD/USD is trading at its lowest level in nearly two years at around mid-0.6200s on Thursday. In the Asian session, the Reserve Bank of New Zealand (RBNZ) announced that quarterly Inflation Expectations for the second quarter was 3.29%.
Gold managed to snap a two-day losing streak on Wednesday before going into a consolidation phase at around $1,850 early Thursday. The benchmark 10-year US Treasury bond yield fell more than 2% on Wednesday and is already down 2.5% on Thursday, helping XAU/USD hold its ground.
USD/JPY closed below 130.00 on Wednesday and continued to push lower during the Asian session with the JPY attracting investors as a safe haven. At the time of press, the pair was down 0.4% on the day at 129.40.
Cryptocurrencies continue to suffer heavy losses and Bitcoin was last seen trading at its weakest level since January 2021 at $26,600, losing more than 8% on a daily basis. Similarly, ETH/USD is down 12% on the day at $1,830.
Bitcoin at 16-month low as UST collapse shows risks of 'Algo' stablecoins.
Weak domestic oil prices have undermined the CAD, placing it on a defensive tone. However, USD/CAD needs to sustain a rally over a 1.3024 Fibonacci marker and 200-week moving average at 1.3043 to grease further upside momentum, Benjamin Wong, Strategist at DBS Bank reports.
Seasonality studies show CAD is usually on its backfoot in May
“The focus now rests on USD sustaining its bullish pace from recent 1.2403 lows over the 200-week moving average at 1.3043, and the 38.2% Fibonacci retracement of the 1.4668 (March 2020 peak) decline trough low at 1.2007 (June 2021 lows) at 1.3024. The technical indicators all have their tails up, thus siding with the bullish USD mode.”
“The Canadian Effective Exchange Rate measure reveals ongoing CAD weakness, and seasonality studies shows CAD is usually on its backfoot in May.”
The Bank of England (BOE) isn’t talking down the economy in forecasts, the central bank Dave Ramsden said following the release of the UK quarterly growth numbers on Thursday.
Additional quotes
Inflation might not drop as fast as forecasts show.
The BOE is likely to handle active gilt sales.
Sees more rate hikes ahead amid upside CPI risk.
The BOE hasn't yet gone far enough on rate hikes.
Brent crude has traded between $100-110/bbl in recent weeks. Economists at ANZ Bank expect the black gold to break higher and reach the $120 mark in the tirhd quarter.
Inventories to drop sharply in Q3
“Oil prices are expected to remain in the $100-110/bbl range through Q2, even if all EU member states agree to a ban on Russia oil. The market will remain sceptical as to the effectiveness of the ban until evidence suggests Russian oil has been fully replaced.”
“With the market looking extremely tight in Q3, we now see prices breaking above the $100-110/bbl range, with our short-term target raised to $120/bbl.”
- GBP/JPY dropped to a near three-month low and was pressured by a combination of factors.
- Disappointing UK macro data reaffirmed the BoE’s bleak outlook and weighed on sterling.
- A generally weaker risk tone benefitted the safe-haven JPY and contributed to the selling bias.
The GBP/JPY cross added to its intraday losses and dropped to its lowest since March 22, around the 157.80 region in reaction to disappointing UK macro releases.
The Preliminary UK GDP report showed that the British economy expanded by 0.8% during the first quarter of 2022 as against the 1.3% growth recorded in the previous quarter and the 1.0% anticipated. The monthly release showed that the UK economy contracted by 0.1% in March, missing consensus estimates for modest 0.1% rise.
Separately, the Office for National Statistics (ONS) reported that Manufacturing and Industrial output declined by 0.2% in March, both missing consensus estimates. Separately, the UK goods trade balance data showed an unexpected jump in deficit to £23.897 billion in March from £21.614 billion reported in the previous month.
The data comes on the back of a bleak economic outlook by the Bank of England and the National Institute of Economic and Social Research (NIESR), warning that Britain is on course to enter a technical recession. This, in turn, was seen as a key factor that weighed heavily on the British pound and exerted pressure on the GBP/JPY cross.
On the other hand, the recent sell-off across the global equity markets underpinned the Japanese yen's relative safe-haven status and further contributed to the offered tone surrounding the GBP/JPY cross. The latest leg down validated the overnight bearish breakdown through the 159.75 region and supports prospects for further losses.
Hence, some follow-through selling towards testing an important horizontal resistance breakpoint, around the 157.35 region, remains a distinct possibility. That said, RSI (14) on hourly charts is already flashing oversold conditions and warrants caution for aggressive bearish traders, though the path of least resistance is to the downside.
Technical levels to watch
FX option expiries for May 12 NY cut at 10:00 Eastern Time, via DTCC, can be found below.
- EUR/USD: EUR amounts
- 1.0400 507m
- 1.0600 1.3b
- 1.0625 793m
- 1.0650 435m
- GBP/USD: GBP amounts
- 1.2400 709m
- USD/JPY: USD amounts
- 128.00 414m
- 128.25 400m
- 130.00 321m
- 130.95 318m
- USD/CHF: USD amounts
- 0.9950 250m
- USD/CAD: USD amounts
- 1.2755 550m
- 1.3000 300m
- 1.3025 270m
- EUR/GBP: EUR amounts
- 0.8590 550m
- 0.8615 240m
- EUR/CHF: EUR amounts
- 1.0340 952m
Riksbank is concerned about inflation developments in Sweden. The May inflation data is due for publication today. If the print surprise to the upside, the Swedish krona could retrace its losses of the past days a little further, economists at Commerzbank report.
Inflation likely to cause further headaches for Riksbank
“If the inflation data were to surprise on the upside today the likelihood of more Riksbank action increases and krona could retrace its losses of the past days a little further. However, principally we do not see much more appreciation potential as a more restrictive Riksbank is likely to be largely priced in.”
“We expect the ECB to follow suit in July so that over the coming months EUR-SEK is likely to trend sideways around 10.40.”
- EUR/GBP refreshes seven-month high after UK Q1 GDP eased.
- Preliminary GDP growth softened to 0.8% QoQ versus 1.0% forecast.
- Clear break of 13-month-old trend line direct buyers towards September 2021 peak.
Alike other GBP pairs, EUR/GBP also portrayed the British pound’s weakness following a slew of the key macroeconomic data from the UK. That said, the cross-currency pair jumped to a fresh high since October 2021 after downbeat data, recently around 0.8610.
UK’s first readings of the Q1 2022 GDP eased to 0.8% QoQ, below 1.0% forecasts while the monthly negative print of -0.1% for March, versus +0.1% expected and prior, gains major attention and drown the GBP/USD prices. Other than the UK GDP, Industrial Production and Manufacturing Production for March also disappoint the cable traders and add strength to the bearish bias.
Read: UK Manufacturing Production drops 0.2% MoM in March vs. 0% expected
On a technical front, the pair’s sustained break of a downward sloping trend line from April 2021, around 0.8570 by the press time, helps the EUR/GBP to cross the 78.6% Fibonacci retracement (Fibo.) of April 2021 to March 2022 downturn.
The trend line breakout, as well as 78.6% Fibo crossing, also gains from the bullish MACD signals, which in turn suggests the pair’s further upside towards the October 2021 peak of 0.8660.
Should the quote rises past 0.8660, the 0.8700 threshold and early 2021 levels surrounding 0.8715-20 will challenge the EUR/GBP pair’s further advances.
On the flip side, a daily closing below the previous resistance line, around 0.8570, could trigger a profit-booking move that initially targets March’s peak of 0.8512.
However, EUR/GBP bears remain cautious until the pair stays above the 50% Fibonacci retracement level of 0.8461.
EUR/GBP: Daily chart
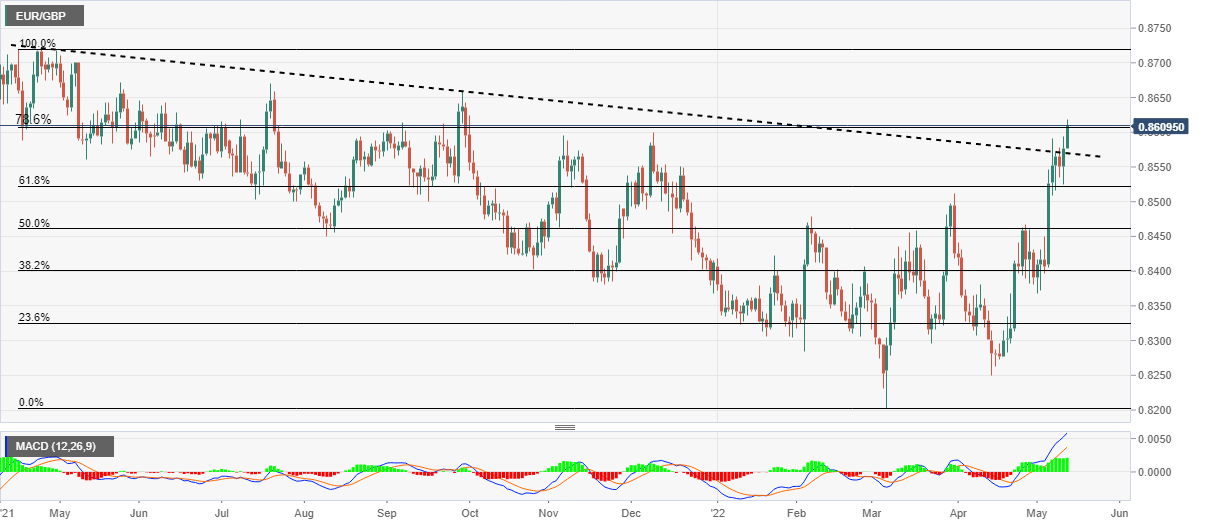
Trend: Further upside expected
Will the US central bank Fed get a handle on inflation or is it out of control? The Fed is being seen as being much more active than many other central banks. Depending on how bad inflation is at that time, the US dollar could enjoy further strength, economists at Commerzbank report.
US inflation expectations are still anchored
“If the FX market assumed that USD positions carry high inflation risk tighter monetary policy would initially have to compensate for this lack of trust and would have a USD-positive effect only after that. We are still a long way away from that scenario.”
“For the time being US inflation expectations are still anchored. And for the time being, the Fed is being seen as being much more active than many other central banks. Whether it will be seen as being sufficiently active to generate USD strength depends on how bad inflation happens to be at that point.”
In three months to March, the British economy expanded 0.8% QoQ as against a 1.3% growth booked in Q4 and 1.0% expectations. This soft print should put depreciation pressure on sterling, economists at Commerzbank report.
Economic concerns in the United Kingdom
“A positive surprise for the GDP data is unlikely to have a significant effect on sterling. A negative surprise would further fuel economic concerns. And the BoE might feel further confirmed in its view that interest rates should only rise gradually. As a result, a negative surprise might put depreciation pressure on sterling.”
“The conflict between the UK and the EU on the Northern Ireland protocol could intensify. If the row cannot be solved and if this was to lead to a trade conflict the outlook for the British economy would deteriorate further. The market might then have to lower its rate expectations, which would put pressure on sterling.”
Russia’s invasion of Ukraine is having a serious impact on regional economies, Japanese Finance Minister Shunichi Suzuki said in a statement on Thursday.
Additional quotes
BOJ's Kuroda explained monetary easing, no queries raised by other participants.
Significant to confirm regional financial cooperation.
No discussions on the US rate hikes impact on emerging market debt at ASEAN+3 meetings.
Market reaction
USD/JPY is tumbling in tandem with risk sentiment, currently trading at 129.59, down 0.28% on the day. The pair failed to resist above the 130.00 level earlier in the Asian trading.
In opinion of FX Strategists at UOB Group Lee Sue Ann and Quek Ser Leang, NZD/USD could still attempt a move to 0.6245 in the next weeks.
Key Quotes
24-hour view: “We highlighted yesterday that ‘the risk still appears to be tilted to the downside’. We added, ‘the support 0.6245 is still likely out of reach’. Our expectations did not materialize as NZD traded in choppy manner between 0.6283 and 0.6379. The underlying tone still appears to be soft and we see scope for NZD to weaken today. That said, a break of 0.6245 is unlikely. Resistance is at 0.6315 followed by 0.6340.”
Next 1-3 weeks: “We have held a negative view in NZD since last Friday (06 May, spot at 0.6430). As NZD declined, in our latest narrative from Tuesday (10 May, spot at 0.6310), we highlighted that the downside risk is still intact and NZD could weaken to 0.6245. Yesterday (11 May), NZD spiked to a high of 0.6379 before dropping quickly to end the day little changed at 0.6292 (-0.02%). While downward momentum beginning to slow, we still see chance for NZD to decline to 0.6245. On the upside, a breach of 0.6385 (no change in ‘strong resistance’ level from yesterday) would indicate that NZD is not ready to break 0.6245. Looking ahead, the next support below 0.6245 is at 0.6200.”
- GBP/USD takes offers as British data confirms policymakers’ economic fears.
- Preliminary readings of UK Q1 2022 GDP eased to 0.8% versus 1.0% forecast, monthly figure turns negative.
- USD strength on risk-aversion wave also exerts downside pressure.
- US PPI will be eyed to confirm CPI’s strong print.
GBP/USD takes offers to renew a 24-month low of around 1.2185 following the disappointment from the latest stream of the UK data during early Thursday morning in Europe. In addition to the disappointment from the data, the risk-off mood also drowned the cable pair.
UK’s first readings of the Q1 2022 GDP eased to 0.8% QoQ, below 1.0% forecasts while the monthly negative print of -0.1% for March, versus +0.1% expected and prior, gains major attention and drown the GBP/USD prices. Other than the UK GDP, Industrial Production and Manufacturing Production for March also disappoint the cable traders and add strength to the bearish bias.
Read: Breaking: UK Preliminary GDP expands 0.8% QoQ in Q1 vs. 1.0% expected
It should be noted that the Bank of England (BOE) has recently flagged fears of recession and triggered a broad risk-off mood in its latest meeting. With the monthly negative GDP, the market players may rush towards risk-safety at a faster pace, which in turn could propel the US dollar demand considering the firmer fundamentals compared to the UK.
Other than the economic fears, Brexit woes also weigh on the GBP/USD prices as the European Union (EU) showed readiness to suspend trade deals with the UK if it unilaterally revokes the Northern Ireland Protocol (NIP), per Bloomberg. It’s worth noting that the pro-Europe Sien Finn’s victory in Irish elections recently triggered Brexit woes.
On a broader front, covid woes and softer yields seem to underpin a mixed session, which in turn keep the markets directed towards the US dollar buying, amid hopes of the Fed’s 70 bps rate hike, especially after the strong US inflation.
Hence, GBP/USD is well set for the further ride to the south even if the bears await the US Producer Price Index (PPI) for April, expected 10.7% YoY versus 11.2% prior.
Technical analysis
A clear break of the two-month-old support line, near 1.2200 by the press time, directs GBP/USD towards May 2020 bottom surrounding 1.2075.
The UK’s industrial sector recovery faltered in March, the latest UK industrial and manufacturing production data published by Office for National Statistics (ONS) showed on Thursday.
Manufacturing output arrived at -0.2% MoM in March versus 0% expectations and -0.6% booked in February while total industrial output came in at -0.2% vs. 0.1% expected and -0.3% last.
On an annualized basis, the UK manufacturing production figures came in at 1.9% in March, missing expectations of 2.3%. Total industrial output rose by 0.7% in the third month of this year against a 0.4% reading expected and the previous 2.1% print.
Separately, the UK goods trade balance numbers were published, which arrived at GBP-23.897 billion in March versus GBP-18.5 billion expectations and GBP-21.614 billion last. The total trade balance (non-EU) came in at GBP-13.804 billion in March versus GBP-13.124 billion previous.
Related reads
- UK Preliminary GDP expands 0.8% QoQ in Q1 vs. 1.0% expected
-
GBP/USD drops to fresh two-year low under 1.2200 on softer UK GDP, US PPI eyed
- Quarterly GDP for the UK expanded by 0.8% in Q1 vs. 1.0% expected.
- UK GDP arrived at -0.1% MoM in March vs. 0.1% expected.
- GBP/USD hits fresh two-year lows below 1.2200 on poor UK GDP.
In three months to March, the British economy expanded 0.8% QoQ as against a 1.3% growth booked in Q4 and 1.0% expectations.
On an annualized basis, the Kingdom’s GDP arrived at 8.7% in Q1 vs. 9.0% expected and 6.6% prior.
The UK GDP monthly release showed that the economy contracted in March, coming in at -0.1% vs. 0.1% expected and 0% previous.
Meanwhile, the Index of services (March) arrived at 0.4% 3M/3M and 0.6% prior and 2.0% anticipated.
Market reaction
The cable remains pressured below 1.2200 on the downbeat UK growth numbers. The spot is down 0.48% on the day, at fresh two-year lows.
About UK GDP
The Gross Domestic Product released by the National Statistics is a measure of the total value of all goods and services produced by the UK. The GDP is considered as a broad measure of the UK economic activity. Generally speaking, a rising trend has a positive effect on the GBP, while a falling trend is seen as negative (or bearish).
The euro area is facing challenges from the protracted war in Ukraine and record-high inflation. Economists at ANZ Bank are now expecting the European Central Bank (ECB) to deliver a July rate hike.
ECB hastens towards lift-off
“We have raised our average HICP forecast for the euroarea this year to 7.8% from 5.0%, and for 2023 to 4.5% from 2.3% and for 2024at 2.4%.”
“The risks of a manufacturing recession are significant, but in aggregate we expect the economy will avoid this, given falling unemployment and service sector strength. The supply of Russian gas is a major uncertainty.”
“We maintain our expectation for lift-off in Q3 and, given our HICP revision, are now biased towards a July hike. We expect that the ECB will raise rates in increments of 25bp and maintain the 50bp corridor to the MRO.”
“We think that the start of normalisation could help to put a floor under euro depreciation, which is adding to HICP pressures given already surging import costs.”
Much attention focuses on a president’s strategy for their five years in office. But the starting point (2022) for the five years of France’s new presidential term will be unfavourable, economists at Natixis report.
An unfavourable starting point for France’s new presidential term
“The war in Ukraine has led to both a loss of growth (France’s GDP is expected to be very flat in 2022) and a sharp rise in commodity prices. Public finances in 2022 will be in a much worse state than previously expected, given the loss of tax revenues due to the loss of growth and the increase in public spending (support for purchasing power). This of course reduces the fiscal policy space for several years.”
“Wage earners’ purchasing power will fall due to the rise in inflation resulting from the rise in commodity prices. This will amplify the loss of growth and reinforce demand for government support for purchasing power at a time when public finances have deteriorated.”
“Even if companies are able to maintain their profit margins thanks to the under indexation of wages to prices, they are still hit by supply chain problems (commodities, components, transport), which curb their production.”
“Interest rates are rising much faster than expected, due to the sharp rise in commodity prices, inflation in the eurozone and the prospect of the ECB tightening its monetary policy.”
- AUD/USD takes offers to refresh multi-month low, neglects Thursday’s Doji, oversold RSI.
- A clear break of yearly support, bearish MACD signals direct sellers towards descending trend line from August 2021.
- Monthly resistance, key DMAs challenge buyers, support-turned-resistance line offers the trigger for the rebound.
AUD/USD skids to the lowest levels since June 2020, taking offers around 0.6880 heading into Thursday’s European session.
The Aussie pair portrayed a Doji candlestick the previous day and raised hopes of witnessing recovery amid an oversold RSI (14) line. However, yuan selling, risk-off mood and downbeat Aussie inflation expectations together weigh on the AUD/USD prices of late.
That said, a downward sloping trend line from August 2021, near 0.6815 by the press time, lures AUD/USD sellers.
Following that, the 0.6800 threshold and the mid-June 2020 swing low surrounding 0.6775 could entertain the bears.
Meanwhile, corrective pullback remains elusive until staying below the yearly horizontal resistance, the previous support around 0.6980-85.
Following that, a descending trend line from early April could test the AUD/USD buyers around 0.7190.
In a case where AUD/USD rises past 0.7190, the 100-DMA and the 200-DMA, respectively near .7250 and 0.7275, should gain the bull’s attention.
AUD/USD: Daily chart

Trend: Further weakness expected
Gold Price tested offers below the critical 200-Daily Moving Average (DMA) at $1,836 on Wednesday, although bulls defended the latter allowing an impressive recovery. For how long can the 200-DMA support hold? FXStreet’s Dhwani Mehta notes that XAU/USD’s bearish potential remains intact.
Daily technical setup continues to point to the downside for XAU/USD
“The renewed upside in XAU/USD seems to be fading this Thursday, as the price is looking to surrender the previous week’s low and the psychological level at $1,850. If the downside accelerates then a retest of the 200-DMA at $1,836 will be inevitable.”
“Daily closing below the 200-DMA at $1,836 is critical to unleashing more declines towards the February 10 lows of $1,822. The next key support is seen at the $1,800 round figure.”
“Acceptance above Tuesday’s high of $1,865 is needed for gold bulls to cement a meaningful recovery towards the horizontal 100-DMA at $1,884. Further, the $1,900 mark will challenge the bearish commitments.”
- USD/CAD sees an upside to near 1.0305 as oil slumps on renewed demand worries.
- The DXY has climbed above 104.00 as investors underpin firmer US inflation.
- Investors should brace for a bullish double-distribution day.
The USD/CAD pair has given an upside break of the intraday consolidation formed in a narrow range of 1.2977-1.3008. The asset is expected to display a bullish Double Distribution day in which the asset moves higher after a balanced profile at the open and forms a distribution again at higher levels. The greenback bulls are aiming to recapture yearly highs at 1.3052.
It would be justified to claim that the US dollar index (DXY) is ruling the FX domain backed by a higher US Consumer Price Index (CPI) and its safe-haven appeal. In the early European session, the DXY has reclaimed its previous day’s high at 104.11 and is expected to extend gains after its decisive violation. The asset is trading long in a consolidation range of 103.38-104.20.
Higher US CPI has strengthened the chances of a continuous jumbo rate hike by the Federal Reserve (Fed). The yearly US CPI figure has landed at 8.3%, a little lower than the former figure of 8.5%, which is showing some signs of a flattening inflation curve. One should keep in mind that the chances of a recession in the US economy are yet not over.
On the oil front, a bearish reversal has been observed in the Asian session as the asset is falling sharply lower after a sheer upside move on Wednesday. The oil prices are expected to slip further to near the psychological support of $100.00 as higher US inflation figures have triggered the alarms of an extremely tightening policy by the Fed. Heavy liquidity contraction will dampen the growth forecasts and henceforth the demand for oil. It is worth noting that Canada is the leading exporter of oil to the US and slippage in oil prices is weakening loonie against the greenback.
Open interest in natural gas futures markets dropped for the fifth session in a row on Wednesday, this time by around 3.2K contracts according to advanced prints from CME Group. Volume followed suit and added to the previous build and went down sharply by around 161.2K contracts.
Natural Gas could retest $6.50
Prices of natural gas advanced further on Wednesday, although the move was in tandem with shrinking open interest and volume, indicative that further strength could be fizzling out in the very near term. On the downside, the next support of note comes at the May at around the $6.50 level per MMBtu.
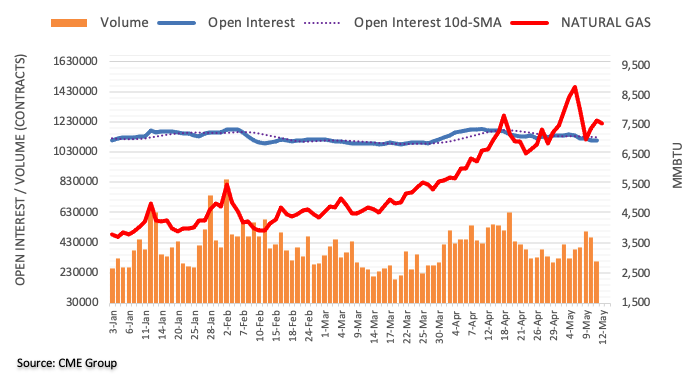
Considering preliminary readings from CME Group for crude oil futures markets, traders added nearly 1K contracts to their open interest positions on Wednesday, reaching the second build in a row. On the other hand, volume went down by just 517 contracts after five consecutive daily advances.
WTI faces decent resistance around $111.00
Wednesday’s uptick in prices of the WTI was on the back of a small gain in open interest. That said, the continuation of the rebound continues to target the May peaks just above the $111.00 mark per barrel, while sellers are expected to meet initial contention around the $98.00 region.
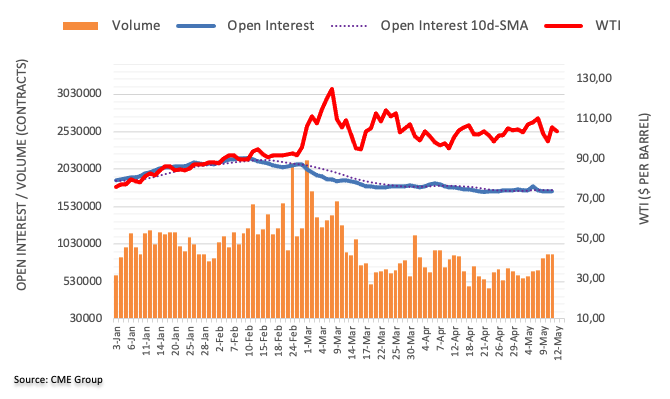
- EUR/USD pauses two-day downtrend but holds lower grounds inside fortnight-long trading range.
- Hawkish ECBspeak contrasts mixed comments from Fed policymakers, strong US inflation keep bears hopeful.
- ECB’s Lagarde, de Guindos teased end of asset purchases in early Q3, indirectly suggest July rate hike.
- US PPI for April could justify 75 bps Fed rate hike calls, could propel USD towards fresh multi-year high.
EUR/USD stays on the back foot around the intraday low, keeping the two-week-old trading range, as it defends the 1.0500 threshold heading into Thursday’s European session. That being said, the major currency pair refrains from stretching the previous two-day downtrend as Euro bulls brace for a return after a long time, despite the recovery being at the nascent stage.
The regional currency seemed to rely on the recently hawkish comments from the European Central Bank (ECB) policymakers. Multiple European Central Bank (ECB) officials, including President Christine Lagarde and Vice President Luis de Guindos, flagged fears of inflation while also fueling calls for the July rate hike. ECB’s Lagarde said, “My expectation is that APP should be concluded early in Q3; followed by a rate hike that could come just ‘a few weeks’ later.” On the same line was ECB Vice President de Guindos who said that inflation is likely to remain at the 4%-5% range at the end of the year in the eurozone. “The debt-buying programme, the Asset Purchase Programme (APP), is likely to stop in July, de Guindos further added per Reuters.
Also keeping the EUR/USD buyers hopeful are the signals from the options market. The one-month risk reversal (RR), the ratio of calls to puts, prints the biggest daily figures in a week while also bracing for the heaviest weekly jump in two months, per the latest data from Reuters. The daily and weekly RR are 0.263 and 0.413 respectively.
On a different page, the US dollar struggles to cheer firmer inflation numbers, despite the latest uptick near a 20-year high, as policymakers have recently stepped back from bold calls. During early Thursday in Asia, the previously hawkish Federal Reserve Bank of St. Louis James Bullard mentioned that he ''won't emphasize single inflation report too much but inflation is more persistent than many have thought.''
Elsewhere, covid woes and softer yields seem to underpin a mixed session, which in turn keep the markets directed towards the US dollar buying, amid hopes of the Fed’s 70 bps rate hike.
Having witnessed a whipsaw move in the US inflation and speeches from ECB policymakers, EUR/USD traders eye monthly prints of the US Producer Price Index (PPI) for April, expected 10.7% YoY versus 11.2% prior. Should the factory-gate inflation also portray the increasing price pressure the hawkish Fed chatters could help the USD to renew its 20-year high.
Technical analysis
A downward sloping trend line from March 31, around 1.0560 by the press time, restricts the immediate upside of the EUR/USD prices. On the contrary, bears need validation from 1.0480 to prosper on the charts.
Cable’s downside momentum could break below the 1.2200 support in the next weeks, suggested FX Strategists at UOB Group Lee Sue Ann and Quek Ser Leang.
Key Quotes
24-hour view: “While we expected GBP to weaken yesterday, we were of the view that ‘the chance for a break of the major support at 1.2250 is not high’. GBP subsequently popped to a high of 1.2400 before dropping below 1.2250 (low of 1.2238). Downward momentum is building quickly and a break of 1.2200 would not be surprising. That said, the next support at 1.2140 is likely out of reach for now. The downward pressure is intact as long as GBP does not move above 1.2320 (minor resistance is at 1.2280).”
Next 1-3 weeks: “We have expected a weaker GBP since last Friday (06 May, spot at 1.2370). As GBP declined, in our latest narrative from Tuesday (10 May, spot at 1.2325), we highlighted that the risk for GBP is still on the downside but GBP has to break 1.2250 before a move to 1.2200 is likely. GBP cracked 1.2250 yesterday and the improved downward momentum suggests that it could breach 1.2200 as well. The next support is at 1.2140. Overall, only a break of 1.2380 (‘strong resistance’ level was at 1.2420 yesterday) would indicate that the current weakness has stabilized.”
CME Group’s flash data for gold futures markets showed open interest increase for the second session in a row on Wednesday, this time by around 4.7K contracts. Volume, instead, reversed four daily builds in a row and shrank by around 52.8K contracts.
Gold looks supported by the 200-day SMA
Gold prices partially reversed the recent sell-off on Wednesday after revisiting once again the $1830 region, where the 200-day SMA sits. The daily rebound came amidst rising open interest, which is supportive of further upside in the very near term. Immediately on the upside emerges the 100-day SMA at $1883 ahead of the May high at $1909 (May 5).
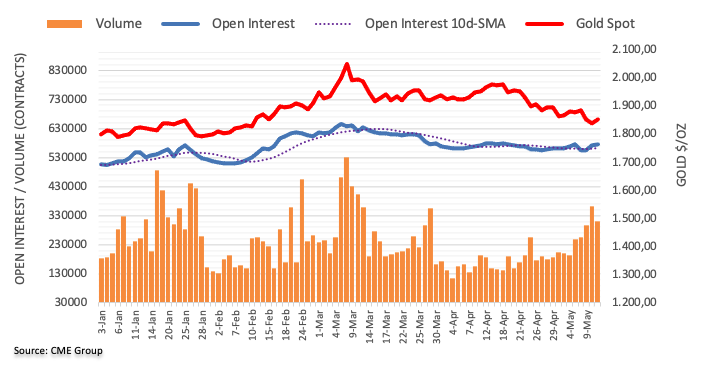
- USD/IDR is eyeing an establishment above 14,580.00 on downbeat Indonesian Retail Sales.
- Strong US CPI numbers have bolstered the odds of a 75 bps rate hike by the Fed.
- For further guidance, US PPI will be in focus.
The USD/IDR is displaying back and forth moves in a narrow range of 14,570-14,581.00 in the Asian session despite poor Retail Sales. The Indonesian Retail Sales have tumbled sharply to 9.3% against the expectations of 11.5% and the prior print of 12.9%. Lower-than-expected Retail Sales will continue to batter the Indonesian Rupiah going forward against the greenback.
Earlier, the pair witnessed a firmer run-up from a low of 14,494.40 to an intraday high of 14,583.45 on upbeat US inflation. The US Consumer Price Index (CPI) landed at 8.3% in comparison with the forecasts of 8.1%. A higher-than-expected inflation figure has bolstered the odds of a 75 basis point (bps) interest rate hike by the Federal Reserve (Fed). No wonder the Fed could step up its borrowing rates by a bumper rate hike to tame the galloping inflation.
Although the street has a 75 bps rate hike figure on their list, St. Louis Fed President holds the view that 50bps hikes at coming meetings are "a good benchmark for now". Adding to that, one single report of inflation is insufficient to be considered in a broader context but inflation will persist longer.
Going forward, the focus of the market participants will be on the US Producer Price Index (PPI) numbers. The US PPI is likely to land at 10.7% against the prior print of 11.2% on yearly basis. While the US PPI excluding food and energy is seen at 8.9% vs. 9.2%.
According to FX Strategists at UOB Group Lee Sue Ann and Quek Ser Leang, further weakness lies ahead for EUR/USD on a break below 1.0470.
Key Quotes
24-hour view: “Yesterday, we highlighted that EUR ‘could edge lower but any weakness is expected to encounter support at 1.0500’. EUR did not quite ‘edge lower’ as it plummeted to 1.0500, rebounded quickly to 1.0576 before dropping back down to close slightly lower at 1.0511 (0.15%). Despite the choppy price actions, the underlying tone has softened and the bias for today is on the downside. However, the chance of EUR breaking the major support at 1.0470 is not high. Resistance is at 1.0540 followed by 1.0560.”
Next 1-3 weeks: “Last Friday (06 May, spot at 1.0540), we highlighted that EUR has to close below the solid support at 1.0470 before a sustained decline is likely. There is no change in our view for now even though shorter-term downward momentum has weakened a tad and the chance for EUR to close below 1.0470 has increased slightly. Overall, only a break of 1.0605 would indicate that the chance for EUR to close below 1.0470 has dissipated. Looking ahead, the next support below 1.0470 is at 1.0420.”
The UK Economic Data Overview
The British economic calendar is all set to entertain the cable traders in early Thursday, at 06:00 GMT, with the preliminary GDP figures for Q1 2022. Also increasing the importance of that time are monthly GDP figures for March, Trade Balance, Manufacturing Production and Industrial Production details for the stated period.
Having witnessed a 6.6% YoY jump in economic activities during the previous quarter, market players will be interested in the first estimation of the Q1 GDP figures, expected 9.0% YoY, to back the BOE’s rate hikes. More interestingly, the QoQ figures are expected to ease from 1.3% to 1.0%.
On the other hand, the GBP/USD traders also eye the Index of Services (3M/3M) for the same period, bearing forecasts of 2.0% versus 0.8% prior, for further insight.
Meanwhile, Manufacturing Production, which makes up around 80% of total industrial production, is expected to ease to 0.0% MoM in March versus -0.4% prior. Further, the total Industrial Production is expected to recover from the previous contraction of 0.6% to a positive reading of 0.1% MoM.
Considering the yearly figures, the Industrial Production for March is expected to have eased to 0.4% versus 1.6% previous while the Manufacturing Production is also anticipated to have weakened to 2.3% in the reported month versus 3.7% last.
Separately, the UK Goods Trade Balance will be reported at the same time and is expected to show a deficit of £9.568 billion versus a £12.138 billion deficit reported in the last month.
Deviation impact on GBP/USD
Readers can find FX Street's proprietary deviation impact map of the event below. As observed the reaction is likely to remain confined around 10-pips in deviations up to + or -2, although in some cases, if notable enough, a deviation can fuel movements over 30-40 pips.
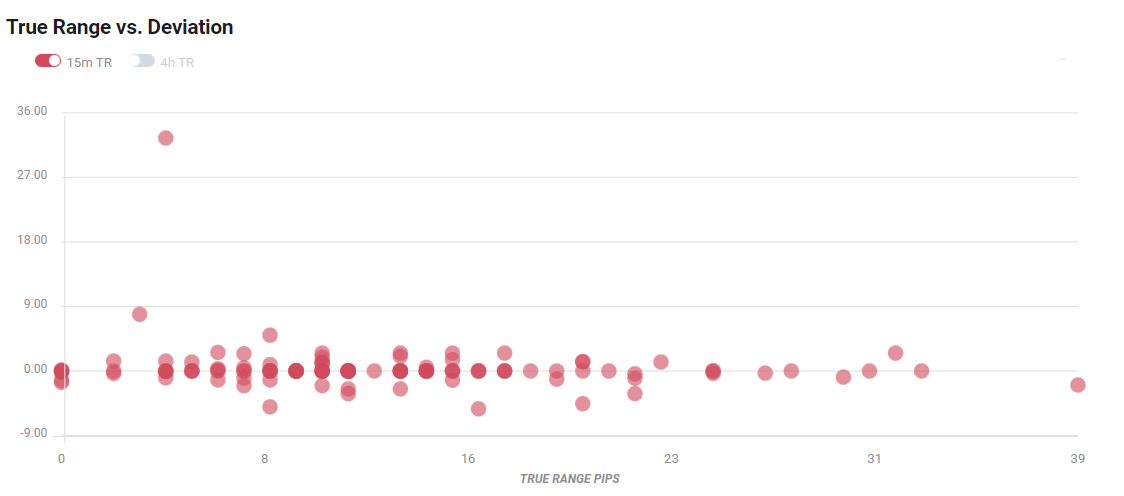
How could affect GBP/USD?
GBP/USD remains on the back foot for the sixth consecutive day while refreshing a two-year low around 1.2210 ahead of the key data on Thursday.
The cable pair’s latest weakness could be linked to the US dollar’s broad recovery moves as market sentiment worsens on inflation and covid fears. Also weighing on the GBP/USD prices are Brexit headlines, suggesting further hardships concerning the Northern Ireland Protocol (NIP).
That said, UK Q1 GDP bears downbeat forecasts and chatters over the Bank of England’s (BOE) more rate hikes are on the table, which in turn keeps the GBP/USD pair on bear’s radar. Also, Brexit talks and the US dollar strength are extra catalysts to weigh on the pair.
As the BOE recently flagged recession risks, any major setback in the data will be detrimental to the GBP/USD prices.
While considering this, FXStreet’s Dhwani Mehta said,
All in all, the quarterly UK growth numbers are unlikely to change the gloomy economic picture, which will likely keep GBP/USD as a ‘sell the bounce’ trade.
Ahead of the release, Westpac said,
GDP growth is anticipated to reflect a decent recovery in Q1 although the Bank of England warns of a sharp slowing in activity over mid-year (market f/c: 1.0%qtr, 8.9%yr). Below average trade volumes are likely to sustain the trade deficit in March (market f/c: -£7800mn).
Key notes
GBP/USD dribbles around 1.2250 amid upbeat options market, pre-UK GDP anxiety
GBP/USD to test 1.2260, downside remains favored on higher US CPI, UK GDP eyed
GBP/USD Forecast: Near-term technicals turn bullish
About the UK Economic Data
The Gross Domestic Product released by the Office for National Statistics (ONS) is a measure of the total value of all goods and services produced by the UK. The GDP is considered as a broad measure of the UK economic activity. Generally speaking, a rising trend has a positive effect on the GBP, while a falling trend is seen as negative (or bearish).
The Manufacturing Production released by the Office for National Statistics (ONS) measures the manufacturing output. Manufacturing Production is significant as a short-term indicator of the strength of UK manufacturing activity that dominates a large part of total GDP. A high reading is seen as positive (or bullish) for the GBP, while a low reading is seen as negative (or bearish).
The trade balance released by the Office for National Statistics (ONS) is a balance between exports and imports of goods. A positive value shows trade surplus, while a negative value shows trade deficit. It is an event that generates some volatility for the GBP.
- NZD/USD takes offers to renew multi-day low, ignores Wednesday’s corrective pullback.
- Bearish chart pattern hints at further downside but RSI signals limited room to the south.
- Convergence of 10-DMA, channel’s resistance line restricts short-term rebound, if any.
NZD/USD stands on slippery grounds during early Thursday morning in Europe, dropping to the fresh low since June 2020 while taking offers near 0.6255 by the press time.
In doing so, the Kiwi pair might have reacted to the latest risk-off mood, as well as the US dollar rebound, while staying inside a one-month-old descending trend channel.
Considering a no-stop road to the south and the latest sour sentiment, NZD/USD is likely to remain bearish, approaching the support line of the stated channel, near 0.6190 by the press time.
Though, the RSI conditions are oversold and may test the bears around the 0.6200 round figure.
Alternatively, the previous support line from August 2021, close to 0.6350, will act as immediate resistance.
However, buyers will wait for a clear break of the 0.6390 resistance confluence, encompassing the 10-DMA and the stated channel’s upper line, to regain short-term optimism.
NZD/USD: Daily chart
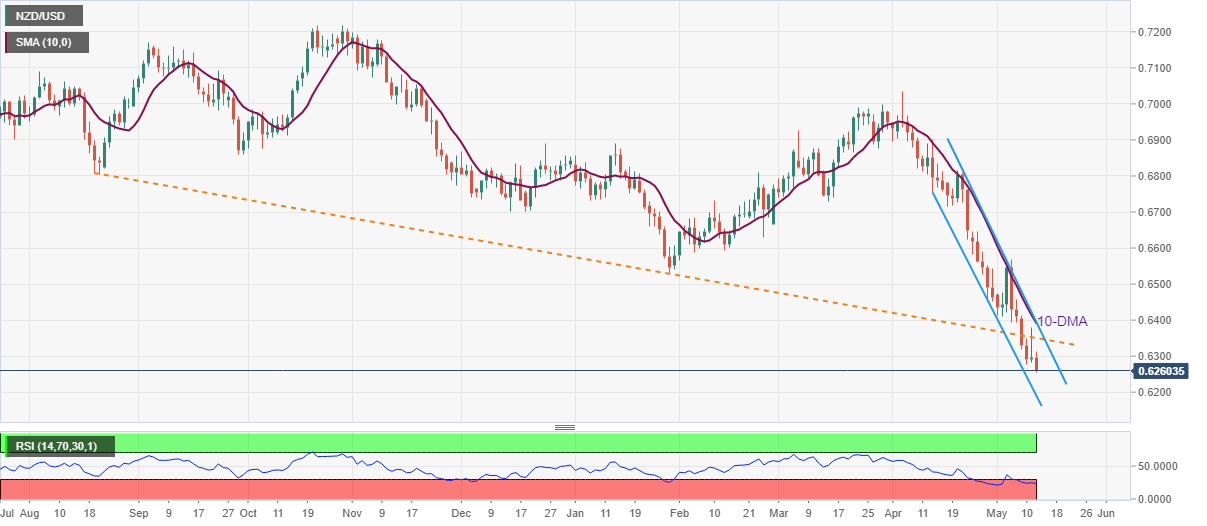
Trend: Bearish
- Equities in Asia-Pacific zone track Wall Street’s losses amid sluggish markets.
- Strong US inflation, fears of fallout from Russia-Ukraine war and China’s struggle with COVID-19 weigh on sentiment.
- Inflation expectations eased in Australia, rose in New Zealand, BOJ Opinion Summary favor easy money policies.
- India CPI, US PPI will be eyed for fresh impulse.
Markets in the Asia-Pacific region remain downbeat as traders struggle to overcome fears of inflation and coronavirus amid a sluggish session during early Thursday.
While portraying the mood, MSCI’s index of Asia-Pacific shares ex-Japan drops 1.4% whereas Japan’s Nikkei 225 print 1.25% intraday loss by the press time.
Worries over inflation bolstered after the US Consumer Price Index (CPI) data crossed softer forecasts for April, published the previous day. That said, the US Consumer Price Index (CPI) rose to 8.3% YoY versus 8.1% expected and 8.5% prior. More importantly, the CPI ex Food & Energy, better known as Core CPI, crossed 6.0% forecasts with 6.2% annual figures, versus 6.5% previous readouts.
Following the data, during early Thursday in Asia, the previously hawkish Federal Reserve Bank of St. Louis James Bullard mentioned that he ''won't emphasize single inflation report too much but inflation is more persistent than many have thought.''
It should be observed that contrasting signals concerning the covid conditions in China and the policymakers’ readiness for more measures to uplift the world’s second-largest economy fail to recall buyers from Beijing. The same weighs on the stocks in Australia and New Zealand. Australia’s Consumer Inflation Expectations dropped more than forecast in May while the Reserve Bank of New Zealand’s (RBNZ) inflation expectations for the second quarter (Q2) rose to 3.28% versus 3.27% prior.
Elsewhere, Indonesia retail sales came out weak for March and drown IDX Composite. On the same line is South Korea’s KOSPI which prints 0.80% intraday loss by the press time as China, South Korea and Japan quote fears from the Ukraine-Russia war.
On a broader front, the US 10-year Treasury yields dropped 1.4 basis points (bps) to 2.92%, around a two-week low by the press time. In doing so, the benchmark bond coupon drops for the fourth consecutive day, bracing for the first negative week in 10. Elsewhere, S&P 500 Futures rise 0.30% intraday gains, in contrast to Wall Street’s losses.
Moving on, India’s Consumer Price Index (CPI) for April will precede weekly prints of the US Jobless Claims and monthly Producer Price Index (PPI) to decorate today’s calendar but major attention will be given to the qualitative catalysts, like Brexit, covid and geopolitics, for clear directions.
Read: S&P 500 Futures rebound from yearly low, yields eye first weekly loss in 10 amid mixed clues
- USD/CNH steps back from multi-day high amid mixed markets, USD pullback.
- PBOC Deputy Governor Chen Yulu hints at more financial support, CCP’s Han Wenxiu signals new incremental policies.
- Shanghai mixed unlock opportunity on community covid cases, China, Japan, South Korea highlight risks from Ukraine-Russia crisis.
- USD remains pressured amid softer yields, mixed Fedspeak, US PPI eyed.
USD/CNH grinds higher around 6.7800 after refreshing the multi-month top during Thursday’s Asian session.
The offshore Chinese yuan (CNH) pair’s latest weakness could be linked to the covid resurgence in the world’s second-largest economy. Also fueling the USD/CNH prices is the monetary policy divergence between the Fed and the People’s Bank of China (PBOC).
Recently, PBOC Deputy Governor Chen Yulu said, “The PBOC will step up financial support for the real economy.” At the same presser, Han Wenxiu, a senior official of China's Communist Party China said that they are eyeing new incremental policies to prop up growth and will take steps when necessary.
On a different page, Shanghai barely missed the covid-led unlock as community cases snapped the two-day absence of coronavirus infections, which could have helped the authorities to remove activity restrictions at the end of the third day, but didn’t.
Elsewhere, the financial leaders from Japan, China and South Korea delivered a joint statement this Thursday, per Reuters, which showed that the policymakers warrant caution over fallouts from the Russia-Ukraine crisis.
It’s worth noting that an absence of hawkish comments from the Fed seems to stop USD bulls from cheering upbeat inflation data. That said, the US Consumer Price Index (CPI) rose to 8.3% YoY versus 8.1% expected and 8.5% prior. More importantly, the CPI ex Food & Energy, better known as Core CPI, crossed 6.0% forecasts with 6.2% annual figures, versus 6.5% previous readouts. Following the data, during early Thursday in Asia, the previously hawkish Federal Reserve Bank of St. Louis James Bullard mentioned that he ''won't emphasize single inflation report too much but inflation is more persistent than many have thought.''
Looking forward, weekly prints of the US Jobless Claims and monthly Producer Price Index (PPI) will also decorate today’s calendar. Should the factory gate inflation also appear strong, the USD may regain the upside momentum as the Fed’s 75 bps rate hike concerns aren’t off the table.
Technical analysis
Overbought RSI conditions test USD/CNH buyers targeting January 2020 low near 6.8455.
- Gold price has frozen in a $1,850.00s area amid a rebound in the DXY.
- The US PPI is seen lower at 10.7% against the prior print of 11.2%.
- The precious metal is trading below the 61.8% Fibo retracement.
Gold Price (XAU/USD) has slipped to near $1,852.00 as the US dollar index (DXY) has rebounded sharply after trading lackluster in the early Tokyo session. The precious metal is wandering in a minute range on Thursday and is expected to trade directionless ahead of the US Producer Price Index (PPI).
The US PPI is seen at 10.7% against the print of 11.2%, recorded a year ago. While the core PPI that excludes food and energy is expected to land at 8.9% lower than the prior figure of 9.2%.
Lately, higher US Consumer Price Index (CPI) numbers have bolstered the odds of a bumper rate hike by the Federal Reserve (Fed). The upbeat US CPI at 8.3% in comparison with the consensus of 8.1% has strengthened the chances of a rate hike by 75 basis points (bps) in June monetary policy.
Meanwhile, the US dollar index (DXY) has rebounded sharply above 104.00 as investors are awaiting an outperformance from the US PPI.
Gold technical analysis
On the daily scale, XAU/USD is trading below 61.8% Fibo retracement (placed from 15 December 2021 low at $1,753.01 to March 8 high at $2,070.54) at $1,875.00. The 50- and 200-period Exponential Moving Averages (EMAs) at $1,902.95 and $1,887.24 respectively have turned lower, which adds to the downside filter. Meanwhile, the Relative Strength Index (RSI) (14) has shifted into a bearish range of 20.00-40.00, which signals more downside.
Gold daily chart
-637879235372842413.png)
- USD/INR retreats from intraday high but stays firmer around all-time high marked on Monday.
- India inflation is expected to jump to 18-month high amid firmer fuel, food prices.
- US inflation failed to propel yields, market sentiment dwindles on mixed clues.
- RBI’s surprise rate hike already signalled higher price pressure, softer number can help INR pare recent losses.
USD/INR portrays the typical pre-data anxiety by retreating from the intraday top to 77.45 amid the mid-Asian session on Thursday. In doing so, the Indian rupee (INR) pair remains on the back foot around the record top, marked on Monday, with eyes on India's inflation data for April, amid expectations of witnessing 18-month high figures.
Although the market forecasts a 7.5% YoY print of India Consumer Price Index (CPI) for April, versus 6.95% prior, traders appear cautious as the Reserve Bank of India (RBI) has already announced 40 basis points (bps) of a rate hike to surprise the market earlier in the month. As result, traders would seek anything above the expectations to mark a notable move.
On Wednesday, much-awaited US Inflation data rose past market consensus but the traders sought solace in softer-than-previous releases. That said, the headline Consumer Price Index (CPI) rose to 8.3% YoY versus 8.1% expected and 8.5% prior. More importantly, the CPI ex Food & Energy, better known as Core CPI, crossed 6.0% forecasts with 6.2% annual figures, versus 6.5% previous readouts.
With this in mind, Reuters said, “Downward pressure on the INR will increase due to a broadly stronger U.S. dollar, higher oil prices and the threat to India's nascent economic recovery from higher interest rates. With the RBI apparently keen to control excessive INR depreciation, choppy trading is likely.”
It’s worth noting that foreign fund outflow and the broad US dollar strength, amid Fed’s 50 bps rate hike keep USD/INR buyers hopeful. “Foreigners have sold a net $19 billion of domestic shares year-to-date and a net $579.10 million of debt in May as investors exit Indian and other emerging markets,” per Reuters.
Also weighing on the USD/INR prices is the latest indecision among the traders, even as stock futures print mild gains and the yields are down. That said, China’s readiness to form policies to better counter the covid woes also underpins the latest cautious optimism and so should recently mix Fedspeak.
Moving on, India inflation will be crucial for USD/INR traders while weekly prints of the US Jobless Claims and monthly Producer Price Index (PPI) will also decorate today’s calendar.
Technical analysis
Bearish RSI divergence and repeated failures to cross a five-month-old ascending resistance line, near 77.55 by the press time, keep USD/INR sellers hopeful of a pullback towards March’s high near 77.17.
The People’s Bank of China (PBOC) will step up financial support for the real economy, the central bank Deputy Governor Chen Yulu said at a press conference on Thursday.
At the same presser, Han Wenxiu, a senior official of China's Communist Party China said that they are eyeing new incremental policies to prop up growth and will take steps when necessary.
China aims to implement existing policies in the first half of the year, Han added.
European Commission President Ursula von der Leyen thanked Japan for diverting some LNG supplies to Europe 'at a most serious time', referring to the Russia-Ukraine war.
Further comments
Indo-pacific is an 'area of tensions,' EU wants to take more active role in region.
We are launching Japan-EU digital partnership.
Will use strategic relationship to strengthen, protect our supply chains.
Related reads
- EU’s Michel: Japan is the Union’s closest strategic partner in Asia
- Japan, China, South Korea caution about fallouts from Russia-Ukraine war
European Council President Charles Michel said in a statement on Thursday, “Japan is EU’s closest strategic partner in Asia.”
Additional quotes
Will expand our close cooperation to condemn Russia, expand sanctions.
Discussed close cooperation to counter measures to circumvent sanctions.
Want to deepen consultations over China.
Discussed how to get most out of various partnerships, including in energy.
In response, Japan PM Fumio Kishida said that they agreed to further cooperate with the EU and the group of seven on measures to deal with Russia.
Market reaction
EUR/USD was last seen trading at 1.0519, up 0.10% on the day.
New Zealand's (NZ) inflation expectations keep pushing higher across the time curve in the second quarter of 2022, the latest monetary conditions survey conducted by the Reserve Bank of New Zealand (RBNZ) showed on Thursday.
Two-year inflation expectations, seen as the time frame when RBNZ policy action will filter through to prices, came in a tad higher at 3.29% from 3.27% last.
NZ Q2 average one-year inflation expectations rose to 4.88% vs. 4.40% seen in the first quarter.
Kiwi shrugs off inflation data
The rise in NZ inflation expectations failed to lift kiwi bulls, as NZD/USD holds the lower ground.
At the time of writing, the kiwi is trading at 0.6270, down 0.46% on the day.
The Wall Street Journal (WSJ) carried a story on Chinese Premier Li Keqiang’s policy framework, which helped the economy avoid a notable slowdown.
Key quotes
“With China mired in its worst economic funk in recent memory, Mr. Li is helping press China’s authoritarian leader to dial back some measures that steered the country away from Western-style capitalism and contributed to China’s economic slowdown, according to government officials and advisers close to decision-making.”
“Under Mr. Li’s influence, those people said, Beijing recently eased a regulatory crackdown on private technology firms, loosened lending to property developers and home buyers, and acted to help some manufacturers resume production when much of China has been forced into lockdowns by Mr. Xi’s zero-Covid approach.”
Related reads
- Japan, China, South Korea caution about fallouts from Russia-Ukraine war
- Coronavirus Update: Shanghai’s community outbreak tempers reopening hopes
- The downside will remain favored on the Inverted Flag chart formation.
- The RSI (14) needs to tumble below 40.00 to validate a bearish setup.
- A broader range consolidation indicates a firmer break on either side.
The EUR/USD pair has witnessed a minor rebound after printing a low of 1.0507 in the Asian session. The asset is oscillating in a broader range of 1.0483-1.0642 since April 28 after witnessing a sheer downside move from 1.0936 on April 21.
On a four-hour scale, the formation of an Inverted Flag is advocating more downside going forward. Usually, an Inverted Flag chart formation denotes the placement of offers by the initiative sellers. The initiative selling perspective signals the continuation of inventory distribution after a downside move.
The major is continuously sensing barricades from the 50-period Exponential Moving Average (EMA), which is trading at 1.0556. While the 100-EMA at 1.0615 is far above the asset price that adds to the downside filters.
The Relative Strength Index (RSI) (14) is oscillating back and forth in a 40.00-60.00 range, which signals a consolidation ahead.
Going forward, a drop below Friday’s low at 1.0483 will drag the asset towards the 29 December 2016 low at 1.0408, followed by the 20 December 2016 low at 1.0352.
Alternatively, violation of the previous week’s high of 1.0642 will send the asset towards the round level resistance at 1.0700. A breach of the latter will drive the asset further to April 19 low at 1.0761.
EUR/USD four-hour chart
-637879203537736395.png)
| Raw materials | Closed | Change, % |
|---|---|---|
| Brent | 107.6 | 5.72 |
| Silver | 21.576 | 1.29 |
| Gold | 1852.26 | 0.72 |
| Palladium | 2026.34 | -1.69 |
- EUR/GBP extends the previous day’s gains to refresh multi-day peak, grinds higher of late.
- ECB’s Lagarde, de Guindos flashed signals for July rate hike in latest speeches.
- Brexit negatives, doubts over BOE’s next moves weigh on GBP ahead of the key UK data.
EUR/GBP bulls take a breather after refreshing seven-month high with eyes on the top-tier UK data. That said the quote remains steady at around 0.8600 during Thursday’s Asian session.
The cross-currency pair rallied the most in a week the previous day as a slew of European Central Bank (ECB) policymakers sound hawkish. Also favoring the pair buyers were downbeat Brexit chatters and fears of the further hardships for the UK’s central bank, namely the Bank of England (BOE).
Multiple European Central Bank (ECB) officials, including President Christine Lagarde and Vice President Luis de Guindos, flagged fears of inflation while also fueling calls for the July rate hike. ECB’s Lagarde said, “My expectation is that APP should be concluded early in Q3; followed by a rate hike that could come just ‘a few weeks’ later.” On the same line was ECB Vice President de Guindos who said that inflation is likely to remain at the 4%-5% range at the end of the year in the eurozone. “The debt-buying programme, the Asset Purchase Programme (APP), is likely to stop in July, de Guindos further added per Reuters.
On the other hand, the European Union (EU) showed readiness to suspend trade deals with the UK if it unilaterally revokes the Northern Ireland Protocol (NIP), per Bloomberg. It’s worth noting that the pro-Europe Sien Finn’s victory in Irish elections recently triggered Brexit woes.
On a broader front, yields remain pressured and the stock futures print mild gains which in turn allow the Euro to remain firmer.
Moving on, the UK’s Q1 2022 GDP is expected to soften to 1.0% QoQ versus 1.3% prior, which in turn will prove right the market’s fears over the BOE’s inability to battle the inflation, howsoever hard it tries.
Also read: UK GDP Preview: BOE’s R-word to overshadow a mild expansion
Technical analysis
A daily closing beyond 0.8600 becomes necessary for the EUR/GBP bulls to keep reins, otherwise, a pullback move towards the previous resistance line from February, near 0.8540, can’t be ruled out.
Financial leaders from Japan, China and South Korea delivered a joint statement this Thursday, warranting caution over fallouts from the Russia-Ukraine crisis.
Key takeaways
We should be cautious about fallouts from Russia/Ukraine conflicts.
Need to guard against risks of earlier-than-expected normalisation of monetary policy, supply-chain disruptions and rising inflation pressure.
We remain committed to continue with support measures to maintain financial stability and long-term fiscal sustainability.
Downside risks to regional economies could cause volatility in financial markets and capital flows.
Market reaction
The joint statement had little to no impact on the market sentiment, as the Asian equities incur losses while the S&P 500 futures remain 0.50% higher on the day.
Having refreshed a two-year low, GBP/USD treads water around 1.2250 amid the mid-Asian session on Thursday.
In doing so, the cable pair struggles to justify the options market optimism as traders remain cautious ahead of the key UK data dump, including the preliminary readings of the Q1 2022 GDP.
That said, the GBP/USD pair’s ratio of calls to puts, known as risk reversal (RR), prints the highest daily figure in two weeks, +0.3000 at the latest, as well as braces for the biggest weekly RR in a month with the +0.325 number by the press time.
The upbeat mood in the options market could be linked to the US dollar’s inability to cheer firmer inflation data and mixed Fedspeak, not to forget the absence of major data/events going forward and the hawkish comments from the European Central Bank (ECB) that negatively impacts the greenback.
Moving on, GBP/USD traders will pay close attention to the UK GDP amid chatters of slower economic growth challenging the BOE’s hawkish plan.
Read: GBP/USD to test 1.2260, downside remains favored on higher US CPI, UK GDP eyed
Shanghai city reopening expectations were dampened by the continued COVID-19 cases breaking out in the community Wednesday.
Shanghai reported a total of 1,449 new infections for Wednesday, down slightly from 1,487 on Tuesday.
While the daily total has steadily fallen, two cases were found in the community Wednesday, CCTV reported.
On Wednesday, Shanghai suspended service on the last two subway lines that were still operating Tuesday, marking the first time the city's entire system has been shut down, according to The Paper.
Shanghai officials are expected to further restrict access to food and hospitals in some parts of the city, the most severe phase of its extended lockdown yet.
Shanghai is now in its seventh week of city-wide restrictions.
China’s zero-covid policy continues to face criticism, with senior Chinese health officials having said in their defense thaqt the lockdown would "buy time to vaccinate more people".
The objective of China's "dynamic zero-COVID" policy aims to maximize the protection of people's safety and health, China's Foreign Ministry spokesperson Zhao Lijian said on Wednesday.
"The policy is not to pursue zero infection, but to contain the pandemic in the shortest possible time at the lowest social cost, so as to safeguard people's lives and health as well as retain the normal order of life to the maximum extent," he said.
Their comments come after the head of the World Health Organisation called China's zero-covid strategy unsustainable.
Market reaction
The market tone is somewhat mixed, with the Asian equities tracking Wall Street after the US inflation beat. Although the S&P 500 futures are up 0.45% on the day, suggesting a minor shift in the market’s risk perception.
- GBP/JPY pares recent losses around the key support area.
- Bearish MACD signals, downbeat RSI test buyers below three-week-old resistance.
GBP/JPY rebounds from the lowest levels since late March, picking up bids near 159.05 during Thursday’s Asian session, as bears lose control near the strong support zone.
The cross-currency pair’s previous weakness could be linked to the clear downside break of the 50-DMA, as well as bearish MACD signals and an absence of oversold RSI.
However, a horizontal area from October 2021 around 157.75-158.25, also comprising the 100-DMA, appears a tough nut to crack for the pair bears.
Should the GBP/JPY prices fail to recover from 157.75, a gradual south-run towards late November 2021 top surrounding 154.75 can’t be ruled out. Though, a five-month-long ascending support line near 152.55 will challenge the bears afterward.
Alternatively, recovery moves need to cross the 50-DMA level of 160.30 to challenge a downward sloping resistance line from April 20, close to 161.25 by the press time.
In a case where GBP/JPY rises past 161.25, highs marked during March and April, near 164.65 and 168.45 respectively, will be in focus.
GBP/JPY: Daily chart
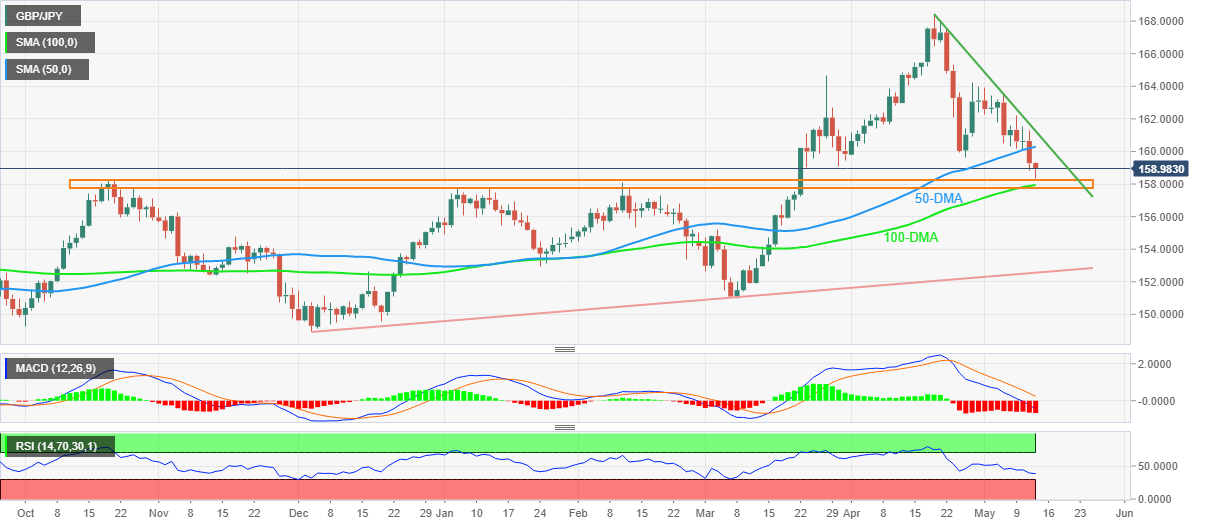
Trend: Further recovery expected
- NZD/USD consolidates, awaiting the next impetus.
- Bears eye a break of critical daily support.
The RBNZ’s Q2 Survey of Expectation is coming up today and the pressure is on from a technical standpoint. NZD/USD has been pressured in a weekly decline with eyes on a move to test the 0.6170s as the following illustrates:
NZD/USD weekly chart
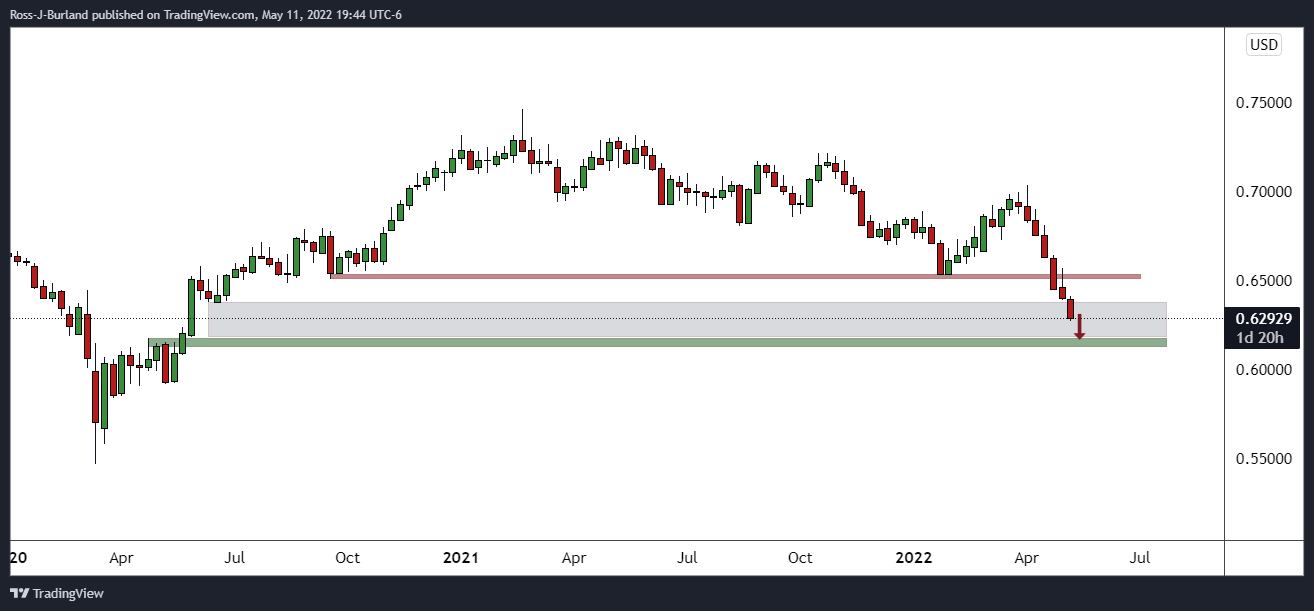
The price is mitigating the price imbalance between June 2020 and April 2020 with some 100 pips to go until the move is complete.
NZD/USD daily chart
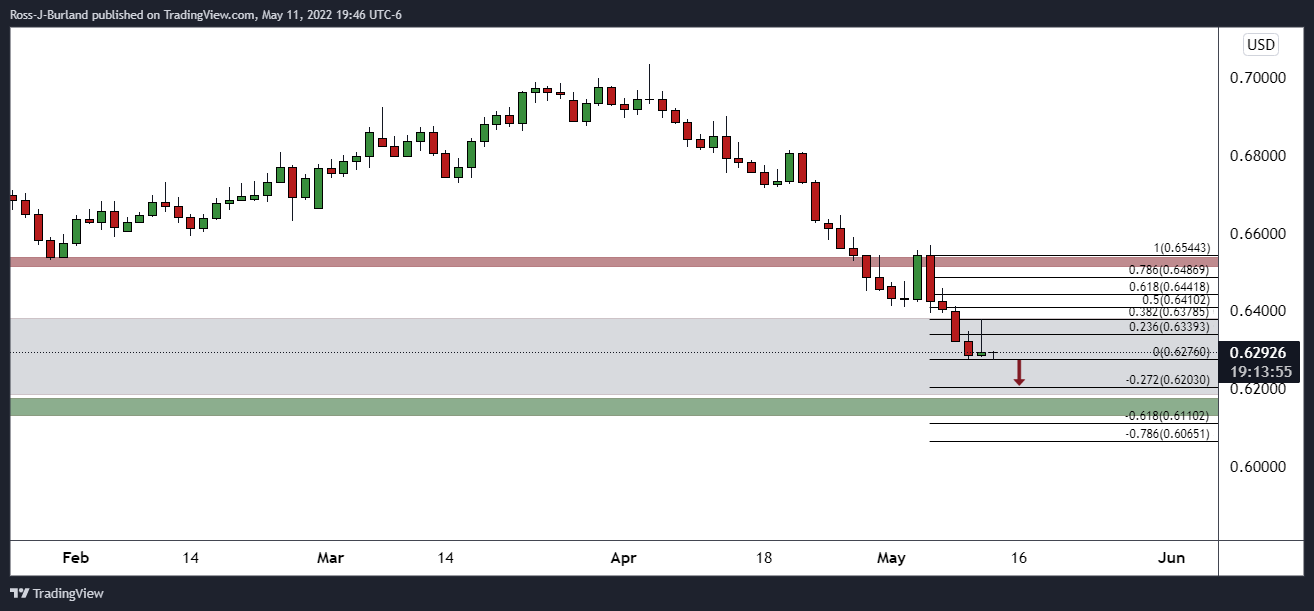
The price has already corrected a 38.2% Fibonacci retracement on the spike from yesterday's trade, but there could be some more to come in that regard before further moves to the downside.
NZD/USD H1 chart

The price is consolidating on the hourly chart and traders will await for an impetus if there is not a technical break one way or the other.
- Market sentiment dwindles as Fedspeak fails welcome firmer US inflation, China covid updates test optimists.
- S&P 500 Futures part ways from Wall Street’s losses as Fed’s Bullard refrains from usual hawkish comments.
- US Treasury yields drop for the fourth consecutive day after refreshing 20-year high.
Global markets remain jittery as traders consolidate recent moves amid a light calendar and mixed comments from the Fed policymakers, not to forget moving beyond the higher US inflation data, during Thursday’s Asian session.
While portraying the mood, the US 10-year Treasury yields dropped 1.4 basis points (bps) to 2.92%, around a two-week low by the press time. In doing so, the benchmark bond coupon drops for the fourth consecutive day, bracing for the first negative week in 10. Elsewhere, S&P 500 Futures rise 0.30% intraday gains, in contrast to Wall Street’s losses.
It’s worth noting that an absence of hawkish comments from the Fed seems to stop USD bulls from cheering upbeat inflation data. That said, the US Consumer Price Index (CPI) rose to 8.3% YoY versus 8.1% expected and 8.5% prior. More importantly, the CPI ex Food & Energy, better known as Core CPI, crossed 6.0% forecasts with 6.2% annual figures, versus 6.5% previous readouts. Following the data, during early Thursday in Asia, the previously hawkish Federal Reserve Bank of St. Louis James Bullard mentioned that he ''won't emphasize single inflation report too much but inflation is more persistent than many have thought.''
Elsewhere, contrasting signals concerning the covid conditions in China also seem to trouble the risk-takers even as softer yields allow stock futures to print mild gains. While stating the fact, the recent coronavirus figures from Shanghai and mainland China ease but the community cases seem to keep the lockdowns intact.
Additionally, Europe’s readiness for the sixth round of sanctions on Russia and Brexit headlines are other catalysts that weigh on the market sentiment, keeping it hard for the bulls to enter.
Moving on, weekly prints of the US Jobless Claims and monthly Producer Price Index (PPI) will decorate today’s calendar but major attention will be given to the qualitative catalysts, like Brexit, covid and geopolitics, for clear directions.
Also read: From flation to stag & back
- AUD/USD struggles to cheer upbeat data, stays pressured around fresh two-year low.
- Australia Consumer Inflation Expectations rose to 5.0% for May but may not justify RBA’s 50 bps rate hike.
- Risk-on mood prevails as traders move past US inflation with softer yields, USD.
- Qualitative catalysts to help determine nearby directions ahead of second-tier US data.
AUD/USD remains pressured around the lowest levels since June 2020, refreshed earlier in Asia, even as Australia’s Consumer Inflation Expectations for May rose past forecasts. In doing so, the Aussie pair also fails to cheer softer US dollar and a pullback in Treasury yields, not to forget cautious optimism in the market.
Australia’s Consumer Inflation Expectations for May came in at 5.0% versus 4.8% expected and 5.2% prior. Although the hopes are in favor of the higher price pressure, the numbers fail to justify the Reserve Bank of Australia’s (RBA) recent 50 basis points (bps) rate hike, which in turn seemed to have weighed on the AUD/USD prices of late.
That said, the Australian dollar’s latest weakness could also be linked to the covid conditions in China. Although the recent coronavirus figures from Shanghai and mainland China ease, the community cases seem to keep the lockdowns intact.
Elsewhere, the US 10-year Treasury yields dropped 1.4 basis points (bps) to 2.92%, around a two-week low by the press time. In doing so, the benchmark bond coupons drop for the fourth consecutive day even as the US Consumer Price Index (CPI) rose to 8.3% YoY versus 8.1% expected and 8.5% prior. More importantly, the CPI ex Food & Energy, better known as Core CPI, crossed 6.0% forecasts with 6.2% annual figures, versus 6.5% previous readouts.
Given the softer yields, S&P 500 Futures rise 0.30% intraday gains, in contrast to Wall Street’s losses, amid mixed chatters from Fed speakers. During early Thursday in Asia, the previously hawkish Federal Reserve Bank of St. Louis James Bullard mentioned that he ''won't emphasize single inflation report too much but inflation is more persistent than many have thought.''
Moving on, weekly prints of the US Jobless Claims and monthly Producer Price Index (PPI) will decorate today’s calendar but major attention will be given to the qualitative catalysts for clear directions.
Technical analysis
Unless crossing a horizontal area comprising lows marked during late 2021 and early 2022, around 0.6990-7000, AUD/USD remains bearish. That said, a three-week-old descending trend channel restricts short-term moves between 0.6870 and 0.7170.
In recent trade today, the People’s Bank of China (PBOC) set the yuan (CNY) at 6.7292 vs. the estimate at 6.7362 and the last close of 6.7236.
About the fix
China maintains strict control of the yuan’s rate on the mainland.
The onshore yuan (CNY) differs from the offshore one (CNH) in trading restrictions, this last one is not as tightly controlled.
Each morning, the People’s Bank of China (PBOC) sets a so-called daily midpoint fix, based on the yuan’s previous day closing level and quotations taken from the inter-bank dealer.
- GBP/USD may find significant offers after a pullback to near 1.2260.
- Higher US CPI has bolstered the odds of a 75 bps rate hike by the Fed.
- The UK GDP is seen diverted on monthly and yearly figures.
The GBP/USD pair has displayed a downside break of its week-long consolidation placed in a range of 1.2260-1.2400. The asset may test the lower range of consolidation to verify bears’ strength but the downside is intact as higher US inflation numbers have strengthened the odds of a bumper rate hike by the Federal Reserve (Fed) in June.
As per the street estimates of 8.1%, US Consumer Price Index (CPI) has outperformed after printing the figure of 8.3% on Wednesday. Markets pundits were expecting that the figure of 8.1% US CPI will advocate a 50 basis point (bps) interest rate hike by the Fed in its June monetary policy. Now, a higher-than-expected US inflation figure has bolstered the odds of a 75 bps rate hike. This has shaken the FX arena and investors are dumping the risk-sensitive assets like there is no tomorrow.
Meanwhile, the US dollar index (DXY) is struggling to sustain above 104.00 but the upside is intact. On the pound front, investors are awaiting the release of the UK Gross Domestic Product (GDP) numbers. The quarterly UK GDP is seen at 1% against the prior print of 1.3% while the yearly figure may land at 9% in comparison with the 6.6% reported earlier. A higher-than-expected UK GDP may cushion sterling from further downside while a more vulnerable figure would elevate the sell-off in the asset.
- Gold prices extend the previous day’s bounce off $1,835 support confluence.
- Yields print four-day downtrend as mixed Fedspeak supersedes hot inflation.
- Absence of major headlines allows traders to consolidate recent losses.
- Gold Price Forecast: Sentiment continues to favor the greenback
Gold (XAU/USD) prices pick up bids to renew intraday high around $1,858, stretching the previous day’s recovery during Thursday’s Asian session. The metal’s latest run-up could be linked to the softer US Treasury yields, as well as downbeat US Dollar Index (DXY) performance as traders seem running out of fuel to cheer the hawkish Fed, despite firmer US inflation data.
That said, the US 10-year Treasury yields dropped 1.4 basis points (bps) to 2.92%, around a two-week low by the press time. In doing so, the benchmark bond coupons drop for the fourth consecutive day.
The yields failed to cheer higher-than-expected US inflation data as the Fedspeak turned out mixed of late. That said, the headline Consumer Price Index (CPI) rose to 8.3% YoY versus 8.1% expected and 8.5% prior. More importantly, the CPI ex Food & Energy, better known as Core CPI, crossed 6.0% forecasts with 6.2% annual figures, versus 6.5% previous readouts.
Following the data, Fedspeak turned out to be mixed as the previously hawkish Federal Reserve Bank of St. Louis James Bullard mentioned that he ''won't emphasize single inflation report too much but inflation is more persistent than many have thought.'' However, Cleveland Fed President and FOMC member Loretta Mester previously recalled the bears as she said, “They don't rule out a 75 basis points rate hike forever”. Recently, Federal Reserve Bank of St. Louis James Bullard mentioned that he ''won't emphasize single inflation report too much but inflation is more persistent than many have thought.''
Against this backdrop, the DXY prints mild losses and the US stock futures rise around 0.30% amid sluggish markets.
Looking forward, weekly prints of the US Jobless Claims and monthly Producer Price Index (PPI) will decorate today’s calendar and hence major attention will be given to the qualitative catalysts for clear directions. Considering the recent consolidation in the market moves, the gold prices are likely to benefit from the softer yields and the US dollar pullback.
Technical analysis
Gold prices remain on the front foot, justifying Thursday’s rebound from a convergence of the 200-DMA, ascending trend line from August 2021 and 61.8% Fibonacci retracement of August 2021 to March 2022 upside.
Also keeping buyers hopeful is the recently improving RSI (14) line and easing the bearish bias of the MACD signals.
As a result, gold buyers are likely heading towards a confluence of the 100-DMA and a downward sloping trend line from April 21, near $1,885.
However, any further upside past-$1,885 will need validation from March’s low near $1,890 before calling XAU/USD bulls to attack $1,900.
Alternatively, pullback remains elusive beyond the $1,835 support confluence, a break of which won’t hesitate to direct gold prices towards the yearly low near $1,780.
Gold: Daily chart
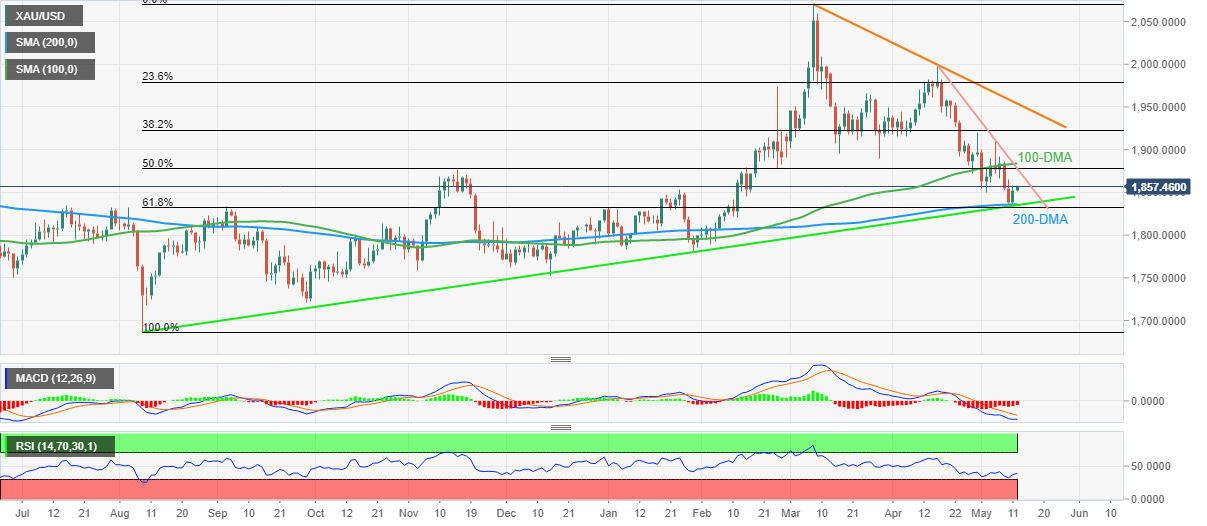
Trend: Further recovery expected
The Ban of Japan's Summary of Opinion was released in recent trade with a number of key statements via Reuters as follows:
Hard to achieve the 2% inflation target as the expected rise in inflation is driven by temporary factors.
Japan's trend inflation likely to accelerate moderately as retailers pass on higher costs.
Crucial for wage hikes, now seen by big firms, to spread to smaller firms for broader wages, and for inflation to rise sustainably.
There is risk prices may come under downward pressure if medium-, and long-term inflation expectations do not heighten sufficiently.
BoJ must continue to support the economy with its current powerful monetary easing.
The challenge for BoJ is not to curb inflation but to pull japan out of too-low inflation.
Inappropriate to change monetary policy when the Ukraine crisis adds to existing downside risks to japan's economy.
Must look at the impact of commodity, fx moves on economy and prices, rather than market moves alone, in guiding monetary policy.
Inappropriate to change monetary policy for the purpose of controlling fx rates.
If it's hard to hit the 2% target in the projected timeframe, BoJ must be mindful of the importance to make its easy policy sustainable.
MoFrepresentative said govt hopes BoJ guides monetary policy appropriately to achieve sustainable price stability, taking into account the impact of Ukraine, and the pandemic fallout.
- DXY snaps two-day uptrend around 20-year high, stays inside bearish chart pattern.
- Failures to refresh multi-day peak, sluggish RSI keep sellers hopeful.
- 100-SMA adds to the downside filters, further advances are likely beyond 104.30.
US Dollar Index (DXY) struggles to extend the previous two-day upside momentum, on the back foot at around 103.95 during Thursday’s Asian session.
In doing so, the greenback gauge stays around the two-decade high marked earlier in the week but prints the daily loss for the first time in three days.
The DXY’s latest grind also highlights a 12-day-old rising wedge bearish formation around the multi-day top. Also highlighting the importance of the chart pattern is the sluggish RSI.
However, a clear downside break of 102.90 becomes necessary to confirm the theoretical fall towards 101.30.
During the fall, the 100-SMA and monthly low, respectively near 102.65 and 102.35 will act as intermediate halts.
Meanwhile, recovery remains elusive until the quote stays below the stated wedge’s resistance line, around 104.30 by the press time.
Following that, a gradual run-up towards September 2002 peak near 109.80 can’t be ruled out.
DXY: Four-hour chart
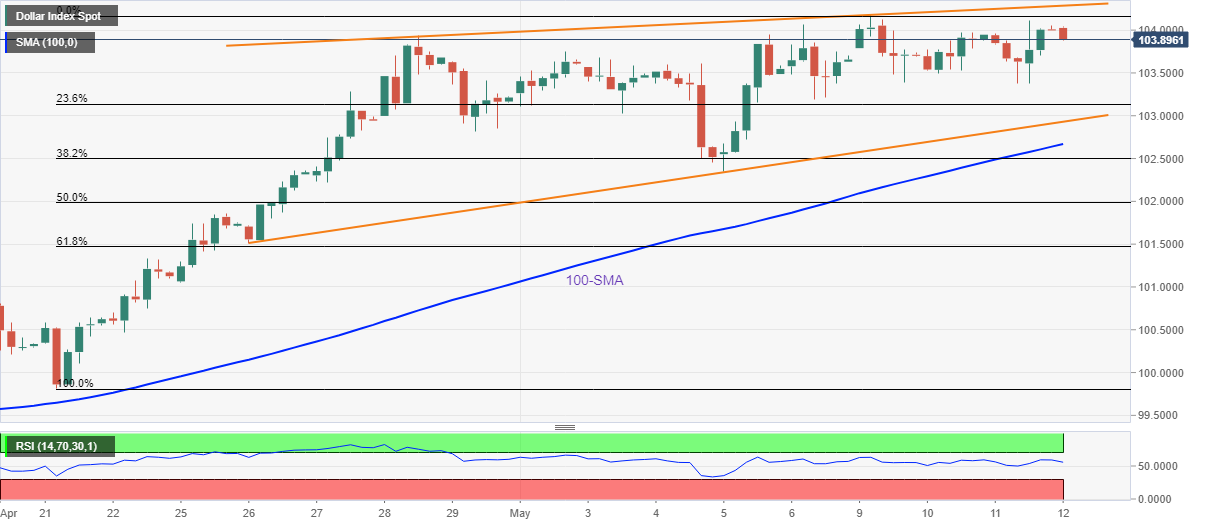
Trend: Pullback expected
- AUD/JPY is falling sharply after violating two day low at 89.78.
- Sixth-time consecutive drop in the Australian Westpac Consumer Confidence has weakened aussie.
- Going forward, investors will focus on Japan's PPI numbers.
The AUD/JPY pair has slipped below the two-day low at 89.78 and is expected to extend losses further as negative market sentiment has dented the demand for risk-perceived assets. The asset has continued its five-day losing streak on Thursday and is likely to display a massive drop to near 86.00.
The asset has remained in the grip of bears after the rate hike decision from the Reserve Bank of Australia (RBA) failed to cheer the market participants. To tame the galloping inflation, the RBA elevated its interest rates by 35 basis points (bps) for the very first time since the emergence of the Covid-19. Rising price pressures forced RBA Governor Philip Lowe to dictate an unexpectedly hawkish tone in the last week’s monetary policy.
Also, the sixth time consecutive drop in the Australian Westpac Consumer Confidence has forced the market participants to dump the Australian dollar. The aussie economic data landed at -5.6% significantly lower than the former figure of -0.9%. A continuous drop in the confidence of the individuals has eventually impacted the antipodean.
Meanwhile, the Japanese yen is getting firmer on improving its safe-haven appeal. The market structure of value buying has supported yen. For further guidance, investors will keep an eye on the Japan Produce Price Index (PPI) numbers, which are due on Monday. A preliminary estimate for the monthly and yearly PPI is 0.3% and 9.7% respectively.
- AUD/NZD bears moving in for some last-minute mitigation.
- Bulls are on the lookout for a discount and a daily extension for the days ahead.
As per the prior session's analysis, AUD/NZD Price Analysis: Bulls looking for a fresh surge to the upside, the price was seen higher on the daily outlook, but not until some further downside mitigation of price imbalance, as indicated by the hourly analysis.
AUD/NZD prior analysis

The price has since failed at moving higher, so far, but this could be a phase of reaccumulation. So long as 1.10 the figure holds, the prospects remain bullish, at least in accordance with the daily structure.
AUD/NZD hourly chart
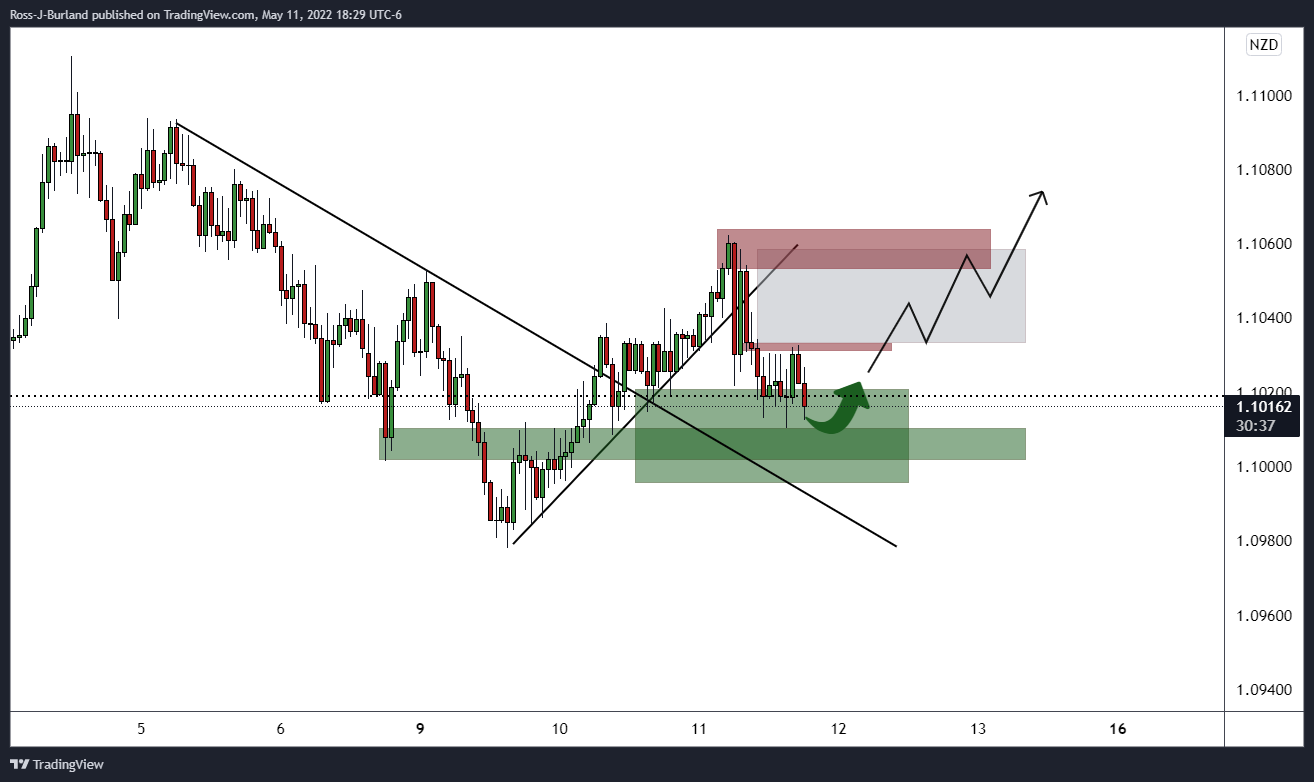
The price is moving in on the 1.10 figure but the bulls would be expected to step in and see off the bears back to resistance near 1.1030.
AUD/NZD daily chart
A break there opens the void towards 1.1060 and onwards as per the daily chart outlook:
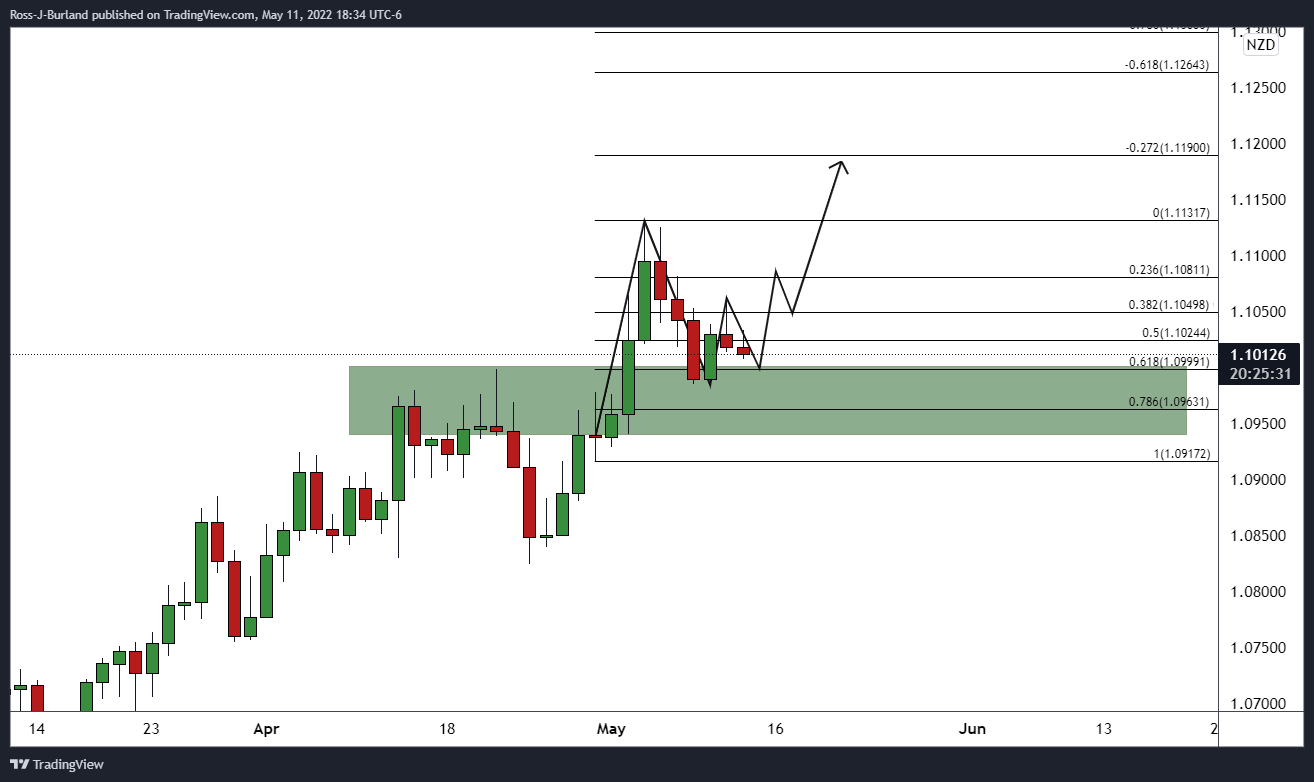
| Index | Change, points | Closed | Change, % |
|---|---|---|---|
| NIKKEI 225 | 46.54 | 26213.64 | 0.18 |
| Hang Seng | 190.88 | 19824.57 | 0.97 |
| KOSPI | -4.29 | 2592.27 | -0.17 |
| ASX 200 | 13.5 | 7064.7 | 0.19 |
| FTSE 100 | 104.46 | 7347.66 | 1.44 |
| DAX | 293.9 | 13828.64 | 2.17 |
| CAC 40 | 152.82 | 6269.73 | 2.5 |
| Dow Jones | -326.63 | 31834.11 | -1.02 |
| S&P 500 | -65.87 | 3935.18 | -1.65 |
| NASDAQ Composite | -373.43 | 11364.24 | -3.18 |
- USD/JPY takes offers to refresh intrday low, signals first weekly losses in 10.
- US Treasury yields fail to cheer hot inflation amid mixed Fedspeak, stock futures print mild gains.
- BOJ Summary of Opinions back easy money policy but highlights risks emanating from Ukraine.
- Risk catalysts may entertain traders amid the absence of top-tier data.
USD/JPY renews daily lows around 129.55 while stretching the previous day’s losses, amid downbeat yields, as Tokyo opens on Thursday. The yen pair’s weakness could also be linked to the Bank of Japan’s (BOJ) Summary of Opinions and the market’s consolidation.
US 10-year Treasury yields dropped 1.4 basis points (bps) to 2.90% at the latest, around a two-week low by the press time. In doing so, the benchmark bond coupons drop for the fourth consecutive day.
The yields failed to cheer higher-than-expected US inflation data as the Fedspeak turned out mixed of late. That said, the headline Consumer Price Index (CPI) rose to 8.3% YoY versus 8.1% expected and 8.5% prior. More importantly, the CPI ex Food & Energy, better known as Core CPI, crossed 6.0% forecasts with 6.2% annual figures, versus 6.5% previous readouts.
Following the data, Fedspeak turned out to be mixed as the previously hawkish Federal Reserve Bank of St. Louis James Bullard mentioned that he ''won't emphasize single inflation report too much but inflation is more persistent than many have thought.'' However, Cleveland Fed President and FOMC member Loretta Mester previously recalled the bears as she said, “They don't rule out a 75 basis points rate hike forever”.
On a different page, the BOJ Summary of Opinions reiterated the policymakers’ favor for easy money while also saying, “It is inappropriate to adjust monetary policy while the Ukraine crisis adds to the economy's already existing adverse risks.”
Elsewhere, the European Union’s (EU) readiness for further sanctions on Russia and China’s covid are extra catalysts that allow the yen to cheer its traditional safe-haven status, especially when the USD and the yields are troubled.
Moving on, weekly prints of the US Jobless Claims and monthly Producer Price Index (PPI) will decorate today’s calendar and hence major attention will be given to the qualitative catalysts for clear directions. Given the downbeat yields, USD/JPY bears are hopeful.
Technical analysis
Although a clear downside break of a six-week-old ascending trend line keeps USD/JPY bears hopeful, the 100-SMA and April 19-20 swing high surrounding 129.40 restricts the pair’s immediate downside.
| Pare | Closed | Change, % |
|---|---|---|
| AUDUSD | 0.6939 | 0.02 |
| EURJPY | 136.652 | -0.46 |
| EURUSD | 1.05153 | -0.15 |
| GBPJPY | 159.155 | -0.86 |
| GBPUSD | 1.22475 | -0.54 |
| NZDUSD | 0.6292 | 0.03 |
| USDCAD | 1.29897 | -0.28 |
| USDCHF | 0.99323 | -0.25 |
| USDJPY | 129.958 | -0.31 |
- The black gold is consolidating in a wider range of $92.77-110.33 with a mild positive bias.
- Oil prices are firmer above the 20-EMA at $103.14.
- The RSI (14) has rebounded sharply from the bearish range of 20.00-40.00.
West Texas Intermediate (WTI), futures on NYMEX, is displaying back and forth moves in a narrow range of $109.98-104.36 in the Asian session. On a broader note, the oil prices are driving higher sharply after testing below the psychological support of $100.00 that triggered the responsive buying action.
The black gold is oscillating in a wider range of $92.77-110.33 with a mild positive bias on a four-hour scale. The oil prices have witnessed a firmer rebound after hitting the low of $97.21 on Tuesday, which has directed the asset towards the upper slight bullish horizontal trendline placed from March 30 high at $107.71.
The black gold has overstepped the 20-period Exponential Moving Average (EMA) at $103.14, which has strengthened the bulls.
Meanwhile, the Relative Strength Index (RSI) (14) has rebounded sharply from the bearish range of 20.00-40.00 but is likely to find a barricade around 60.00.
Should the asset oversteps Wednesday’s high at $103.05, bulls may drive the asset towards the April 29 high at $107.07, followed by the psychological resistance at $110.00.
On the flip side, bulls could lose momentum if the asset drops below the psychological mark of $100.00, which will send the oil prices to near Tuesday’s low at $97.21. A breach of the latter will drag the fossil fuel prices towards April 25 low at $95.07.
WTI four-hour chart
-637879104863054852.png)
- USD/CAD hangs in balance after declining the most in a week, snapping four-day uptrend.
- WTI posted the biggest daily jump in a month on fears of EU’s oil embargo on Russia, ignoring EIA inventories.
- USD grinds higher post-hot inflation data, risk catalysts will be eyed for immediate directions.
- US Jobless Claims, PPI, BOC’s Gravelle decorate calendar.
USD/CAD struggles to keep bears on the board after inviting them for a feast as prices of oil fade upside momentum while markets struggle for fresh clues during Thursday’s Asian session. That said, the quote seesaws around 1.3000 after positing the first negative daily closing in five, not to forget mentioning the pullback from the highest levels since November 2020.
WTI crude oil, Canada’s biggest export item, rallied the most in a month the previous day as European policymakers brace for the sixth round of sanctions on Russia, highlighting a total ban on the bloc’s energy import from Moscow in the next six months. The geopolitical fears also joined uncertainties over the Iran output deal and OPEC+ restrain to increase production, from what’s already known, to propel the energy prices.
While cheering the positive, the black gold paid a little heed to the weekly official oil inventory data from the Energy Information Administration (EIA), 8.487M versus -0.457M expected and 1.302M prior.
On a different page, the US inflation data for April failed to please the greenback buyers, despite crossing the forecasts. The reason could be linked to the mixed comments from the Federal Reserve (Fed) officials as well as a lack of market confidence in the latest data and Fedspeak.
That said, the headline Consumer Price Index (CPI) rose to 8.3% YoY versus 8.1% expected and 8.5% prior. More importantly, the CPI ex Food & Energy, better known as Core CPI, crossed 6.0% forecasts with 6.2% annual figures, versus 6.5% previous readouts.
Following the data, Fedspeak turned out to be mixed as the previously hawkish Federal Reserve Bank of St. Louis James Bullard mentioned that he ''won't emphasize single inflation report too much but inflation is more persistent than many have thought.'' However, Cleveland Fed President and FOMC member Loretta Mester previously recalled the bears as she said, “They don't rule out a 75 basis points rate hike forever”.
Against this backdrop, equities initially rose before ending in the red while the US Treasury yields also rose past 3.0% before ending Wednesday at a one-week low of 2.92%. It’s worth observing that S&P 500 Futures print mild gains by the press time.
Looking forward, weekly prints of the US Jobless Claims and monthly Producer Price Index (PPI) could join a speech from the Bank of Canada (BOC) Deputy Governor Toni Gravelle to direct short-term moves. Given the lackluster moves, coupled with the old fears of inflation and growth, USD/CAD may regain upside momentum in absence of any major positive for oil prices.
Technical analysis
Failure to cross a monthly resistance line, around 1.3065 by the press time, triggered USD/CAD declines the previous day. The pullback moves, however, remain elusive until staying beyond March’s high of 1.2900.


© 2000-2026. All rights reserved.
This site is managed by Teletrade D.J. LLC 2351 LLC 2022 (Euro House, Richmond Hill Road, Kingstown, VC0100, St. Vincent and the Grenadines).
The information on this website is for informational purposes only and does not constitute any investment advice.
The company does not serve or provide services to customers who are residents of the US, Canada, Iran, The Democratic People's Republic of Korea, Yemen and FATF blacklisted countries.
Making transactions on financial markets with marginal financial instruments opens up wide possibilities and allows investors who are willing to take risks to earn high profits, carrying a potentially high risk of losses at the same time. Therefore you should responsibly approach the issue of choosing the appropriate investment strategy, taking the available resources into account, before starting trading.
Use of the information: full or partial use of materials from this website must always be referenced to TeleTrade as the source of information. Use of the materials on the Internet must be accompanied by a hyperlink to teletrade.org. Automatic import of materials and information from this website is prohibited.
Please contact our PR department if you have any questions or need assistance at pr@teletrade.global.
transfers