- Analytics
- News and Tools
- Market News
CFD Markets News and Forecasts — 11-05-2022
- EUR/USD bears sinking in their teeth at daily support.
- US dollar remains on firm grounds with eyes on US inflation.
At 0.6934, EUR/USD is flat on the day so far in an environment of positive stocks in APAC despite the sea of red into the close on Wall Street. The euro was pressured as a consequence of a resilient US dollar and the market's conclusion that the inflation data for April was hot enough to panic, fuelling a bid on the greenback.
It was a mixed report in that the Consumer Price Index climbed 8.3%, higher than the 8.1% estimate but below the 8.5% in the prior month. The index rose just 0.3% last month, the smallest gain since last August, the Labor Department said on Wednesday, versus the 1.2% MoM surge in the CPI in March, the most significant advance since September 2005. However, ''the fact that the CPI is driven by rents and services implies that price pressures are entrenched and may manifest in upward pressure on wages too,'' analysts at TD Securities argued.
As a consequence, the Dow Jones Industrial Average was 1% lower at 31,834.11, wiping gains achieved earlier in the day. The S&P 500 slid 1.7% to 3,935.18. The Nasdaq Composite tumbled 3.2% at 11,364.24. The US 10-year yield slumped by 7.4 basis points to 2.92% but that did not prevent the greenback from rallying.
''The positive surprise in core prices will not be favourable for currencies not named the US dollar. We think the market is far too premature in reducing the Fed's optionality set for tightening. This should leave the USD resilient for now,'' analysts at TD Securities argued.
The US dollar index, DXY, ended towards the session highs of 104.105. It is currently bid and trading at 104.01 which is weighing on the euro as investors assess how aggressive the Fed will need to be. Expectations are completely priced in for another hike of at least 50 basis points at the central bank's June meeting, according to CME's FedWatch Tool.
-
Fed's Bullard: April inflation was “hot” but not far from what was expected
For the week ahead, investors will get another look at inflation data on Thursday in the form of the Producer Price Index for April, with expectations of a monthly increase of 0.5% versus the 1.4% jump in March. On an annual basis, expectations are for a jump of 10.7% compared with the 11.2% surge the prior month.
ECB about to hike?
Meanwhile, a number of European Central Bank speakers including ECB President Christine Lagarde spoke. The communication was decidedly hawkish, as analysts at ANZ Bank explained: ''Lagarde said that a first rate hike could come just weeks after the ECB finishes its QE program in June. This signals the growing possibility of a July hike from the central bank. With the final April CPI data for Germany confirming a 7.8% YoY rise in prices, the hawkish members of the ECB governing council are likely to keep pushing for an earlier tightening in monetary policy.''
EUR/USD technical analysis
As per the pre-Asian session analysis, EUR/USD Price Analysis: Bears lurking near to cycle lows, breakout on the cards? the price is testing critical daily and 4-hour support. A break here could lead to lower levels for longer as per the daily chart:
- Silver prices remains sidelined after snapping four-day downtrend.
- Bearish chart pattern, downbeat MACD signals keep sellers hopeful.
- 100-HMA, weekly horizontal resistance adds to the upside filter.
Silver (XAG/USD) struggles to extend recovery moves from a two-year low inside immediate bearish pennant formation, taking rounds to $21.50 during Thursday’s Asian session.
In addition to a two-day-old bearish chart pattern, sluggish MACD signals also hint at a lack of buying momentum, which in turn keeps sellers waiting for a trigger to take fresh entry.
As a result, a downside break of the stated pennant’s support of around $21.40 will serve as the short-term key level to watch for fresh short positions.
Following that, the recent low of $21.18 and the $21.00 round figure may entertain traders ahead of directing them to the $20.00 threshold.
Meanwhile, recovery moves will have a tough time crossing the $22.00 level comprising the pennant’s upper line and the 100-HMA.
Also challenging the XAG/USD buyers is a weekly horizontal area surrounding $22.10-15.
Should silver buyers keep reins past $22.15, multiple hurdles near $22.85, $23.00 and the monthly peak of $23.28 could flash on their radars.
Silver: Hourly chart
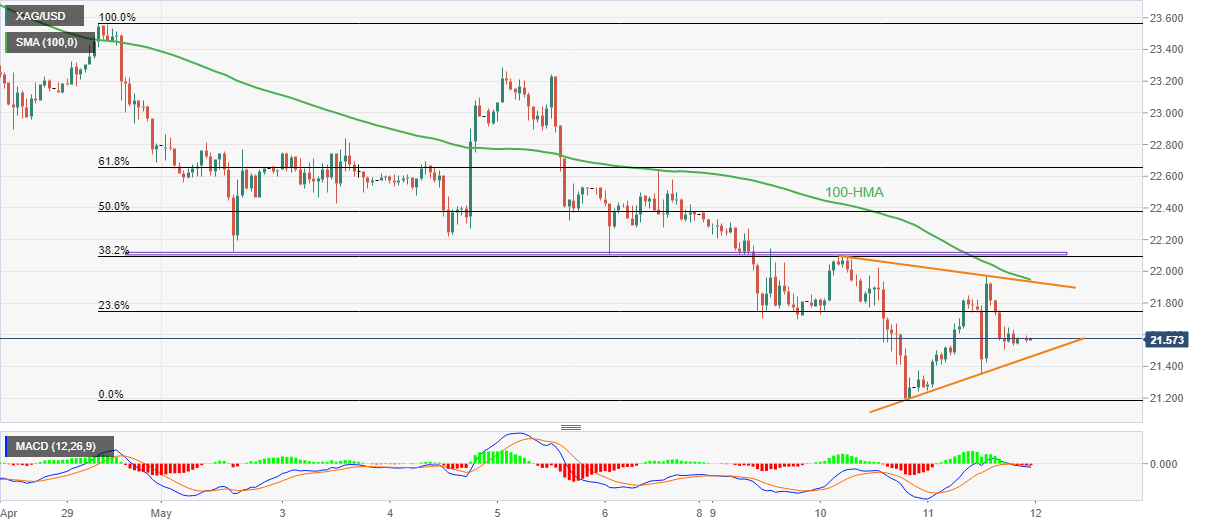
Trend: Further weakness expected
- GBP/JPY has tumbled to near 159.00 on an expectation of mixed UK GDP.
- The quarterly and yearly GDP is seen at 1% and 9% vs. 1.3% and 6.6% respectively.
- On the Japanese front, PPI numbers are due next week.
The GBP/JPY pair is consolidating in a narrow range of 158.91-159.31 after a serious drop from 161.31 in the New York session. The cross failed to sustain above 161.00 and tumbled sharply to a low of 158.83. The sheer downside move in the cross is expected to drag it lower to near the crucial support at 157.70.
A preliminary estimate for the quarterly UK Gross Domestic Product (GDP) is 1% against the prior print of 1.3% while the yearly UK GDP may land at 9%, higher than the former figure of 6.6%. The expectation of underperformance from the quarterly UK GDP is denting the demand for sterling in the FX domain.
The renewed fears of recession after the statement from Bank of England (BOE) Governor Andrew Bailey brought a sell-off in pound over the past few trading sessions. Apart from that, BOE’s bailey dictated that the UK inflation could reach 10% by 2023.
Meanwhile, the value buying structure is strengthening the Japanese yen against sterling. Also, the ongoing risk-off impulse has improved the appeal of safe-haven assets. Going forward, yen bulls will be impacted by the release of the Japan Producer Price Index (PPI), which is due on Monday. Japan's PPI is seen at 0.3% and 9.7% on a monthly and yearly basis.
- AUD/USD dribbles around yearly low after more than 100-pip move.
- Risk appetite remains divided, mostly sour, as equities/yields initially gained before closing negative.
- Firmer US inflation, mixed Fedspeak and headlines from China keep traders confused even as bears hold the reins.
- Australia’s Consumer Inflation Expectations for May will be observed closely after RBA’s surprise rate hike.
AUD/USD traders take a breather around 0.6940, following a whippy move of near 120 pips surrounding the US inflation release, as markets wait for fresh clues during the initial Asian session on Thursday. That said, Australia’s Consumer Inflation Expectations for May appear an immediate catalyst to watch for the pair traders, in addition to the widely chatters news over China, Russia and inflation.
The Aussie pair rallied 120 pips before reversing from 0.7050 to just end Wednesday with a “no-change day” sign, suggesting the traders’ indecision despite the firmer US inflation data. That said, the headline Consumer Price Index (CPI) rose to 8.3% YoY versus 8.1% expected and 8.5% prior. More importantly, the CPI ex Food & Energy, better known as Core CPI, crossed 6.0% forecasts with 6.2% annual figures, versus 6.5% previous readouts.
Following the data, Fedspeak turned out to be mixed as the previously hawkish Federal Reserve Bank of St. Louis James Bullard mentioned that he ''won't emphasize single inflation report too much but inflation is more persistent than many have thought.'' However, Cleveland Fed President and FOMC member Loretta Mester previously recalled the bears as she said, “They don't rule out a 75 basis points rate hike forever”.
Not only the Fed but multiple policymakers from the European Central Bank (ECB) also sounded hawkish and renewed rate-hike, as well as growth fears, which in turn weighed on the AUD/USD prices.
Also exerting downside pressure on the quote were softer prints of Australia’s Westpac Consumer Confidence, -5.6% versus -0.9%. However, firmer inflation numbers from China and news that eight districts from Shanghai witnessed zero covid spread seemed to have kept the buyers hopeful, before the US inflation woes weighed on the prices.
Amid these plays, equities initially rose before ending in the red while the US Treasury yields also rose past 3.0% before ending Wednesday at a one-week low of 2.92%. It’s worth observing that S&P 500 Futures print mild gains by the press time.
Looking forward, an expected weakness in the Aussie Consumer Inflation Expectations for May, to 4.8% from 5.2% prior, could add strength to the AUD/USD pair’s bearish bias as the same won’t back the Reserve Bank of Australia’s (RBA) 50 basis points (bps) rate hike and hints at softer move ahead.
Technical analysis
A three-week-old descending trend channel restricts short-term AUD/USD moves between 0.6870 and 0.7170. That said, a horizontal area comprising lows marked during late 2021 and early 2022, around 0.6990-7000, appears a nearby hurdle to cross for the pair buyers.
- USD/CHF is approaching 1.000 as DXY strengthens on higher US inflation.
- The DXY is holding itself above 104.00 ahead of the US PPI.
- The flat jobless rate and CPI have pushed the Swiss franc into a negative trajectory over the last week.
The USD/CHF pair is moving north firmly after the release of the US Consumer Price Index (CPI) on Wednesday. The asset found significant bids at around 0.9874 and is now scaling sharply higher towards the psychological resistance of 1.0000.
It is worth noting that the major is displaying a broader consolidation in a range of 0.9874-0.9975 from Monday. No doubt the anxiety over the release of the US CPI was keeping investors on the edge. Now, the above-expected US inflation figure at 8.3% is telling a different story. The yearly inflation levels are at a peak now and the curve may start trending downside amid the strict deployment of quantitative measures by the Federal Reserve (Fed). No wonder the story of contained inflation is far from over and investors will continue to brace volatility at the higher side but price pressures will ease gradually.
The US dollar index (DXY) is trying to hold itself above 104.00 as the negative market sentiment has diminished the risk appetite of investors. In the New York session, investors will keep the US Producer Price Index (PPI) on the radar, which will provide further guidance to the market participants. The US PPI is seen at 10.7% on yearly basis.
On the Swiss front, the Swiss franc is underperforming continuously for the last week after the Swiss agencies reported the Unemployment Rate and CPI numbers. The former landed at 2.2% while the latter printed at 2.5%, both catalysts remained in line with the market consensus.
- GBP/USD remains sidelined around two-year low, maintains weekly falling channel.
- Sluggish RSI, MACD tests further downside around channel’s support.
- Multiple hurdles to the north challenge recovery move unless crossing 1.2415.
- UK’s monthly data dump includes preliminary readings of Q1 GDP, making it the key.
GBP/USD takes rounds to the lowest levels since June 2020 as traders await the UK Q1 GDP during Thursday’s Asian session. In doing so, the cable pair stays inside a one-week-old descending trend channel, flirting with the 1.2250 level by the press time.
Also read: UK GDP Preview: BOE’s R-word to overshadow a mild expansion
That said, the support line of the stated channel, around 1.2235-40, joins nearly oversold RSI and sluggish MACD to challenge the GBP/USD pair’s immediate moves.
Should the quote bounces back from the latest multi-month low, a convergence of the channel’s upper line and three-week-old descending trend line, around 1.2385-80, will test the rebound. Also acting as an immediate upside hurdle is the 50-SMA level surrounding 1.2415.
Hence, the GBP/USD bears seek more clues after traveling a long distance. However, the bulls have a bumpy road to travel and remain unwelcomed before crossing 1.2415.
Should the quote rises past 1.2415, early May’s top surrounding 1.2640 should be on the GBP/USD pair buyer’s radar.
GBP/USD: Four-hour chart
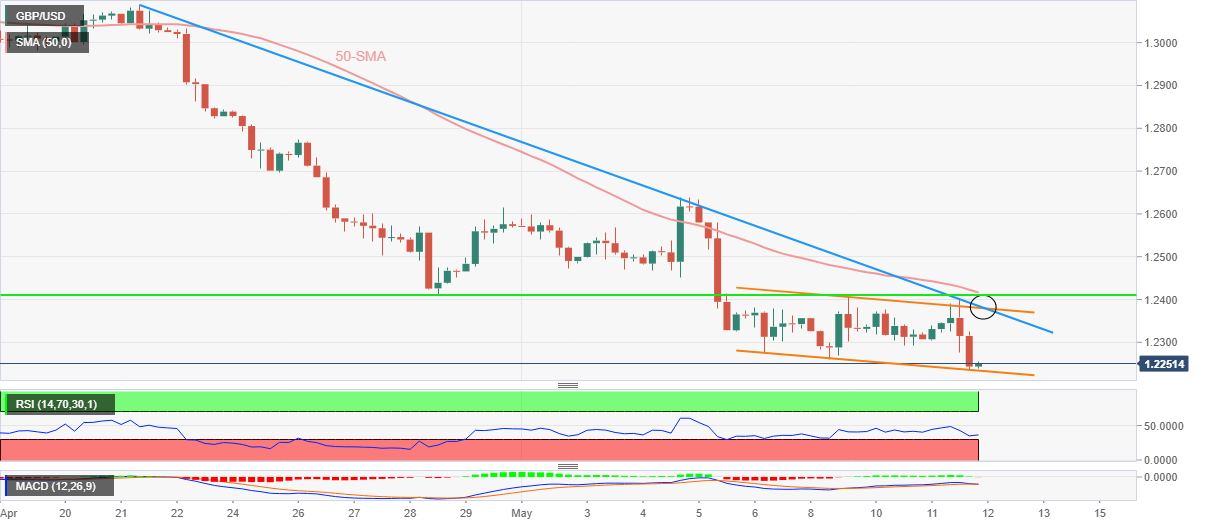
Trend: Corrective pullback expected
- NZD/USD seesaws near Wednesday’s open after a 100-pip move.
- US inflation crossed forecasts in April, justifying hawkish Fedspeak and firmer USD.
- NZ FinMin Robertson signals short-term inflation pressure at home.
- China’s covid conditions, geopolitical tensions add to the bearish bias ahead of a busy calendar in Asia.
NZD/USD revisits the 0.6300 mark, completing a home round after almost 100 pips of the inflation-induced move, as the pair traders await a set of key data from New Zealand during early Thursday morning in Asia. Also likely to have restricted the Kiwi pair’s moves are mixed concerns amid firmer US CPI and zigzag moves of yields, not to forget risks emanating from China and Russia.
The much-awaited US Inflation data rose past market consensus but the traders sought solace in softer-than-previous releases. That said, the headline Consumer Price Index (CPI) rose to 8.3% YoY versus 8.1% expected and 8.5% prior. More importantly, the CPI ex Food & Energy, better known as Core CPI, crossed 6.0% forecasts with 6.2% annual figures, versus 6.5% previous readouts.
It should be noted, however, that the Fedspeak remained hawkish and renewed US dollar strength just after an initial drop. That said, Federal Reserve Bank of St. Louis James Bullard recently mentioned that he ''won't emphasize single inflation report too much but inflation is more persistent than many have thought.''
At home, New Zealand Finance Minister (FinMin) Grant Robertson praised the nation’s economic strength in a pre-budget speech while also highlighting inflation as a short-term challenge. The policymaker also expects the price pressure to ease in the second half of the year.
On a different page, global markets dwindled as equities initially rose before ending in the red while the US Treasury yields also rose past 3.0% before ending Wednesday at a one-week low of 2.92%.
It’s worth observing that China’s struggle with covid and Europe’s readiness for the sixth round of sanctions on Russia are extra catalysts that weigh on the market sentiment, in addition to the inflation fears. The same exerts downside pressure on the NZD/USD prices ahead of the key Q2 Inflation Expectations from the Reserve Bank of New Zealand (RBNZ), previous 3.27%.
“The RBNZ will be hoping to see some moderation in inflation expectations measures – especially at the longer horizons. That would give them some leeway to slow down the pace of rate hikes after what we expect will be another 50bp hike to 2% on 25 May,” said Australia and New Zealand Banking Group (ANZ) ahead of the data release.
Other than the RBNZ Inflation Expectations for Q2, US Jobless Claims and Producer Price Index (PPI) will also be important to watch for immediate directions.
Technical analysis
Given the pair’s failure to rebound from a two-year low, NZD/USD prices are likely bracing for October 2019 low surrounding 0.6200.
Meanwhile, multiple lows marked during mid-2020, around 0.6380-85, restrict immediate recovery moves.
- Gold prices are stuck in a $14-range on upbeat US inflation.
- The DXY is sustaining above 104.00 as the odds of a rate hike by the Fed have bolstered.
- Higher US CPI at 8.3% indicates the Fed has a long way to go to ease price pressures.
Gold Price (XAU/USD) has frozen at around $1,852.00 after the US Bureau of Labor Statistics unveiled the US Consumer Price Index (CPI) for the month of April. The precious metal is oscillating in a minor range of $1,846.44-1,858.30 as investors are planning the next move after the higher-than-expected inflation figures. The US agency reported yearly inflation at 8.3% against the estimate of 8.1% while the core CPI figure has climbed to 6.3%, higher than the forecasts of 6%.
The Federal Reserve (Fed) is getting prepared for a bumpy ride as soaring price pressures will demand more mega rate hikes from the central bank. No doubt, the odds of a rate hike by 75 basis points (bps) have also strengthened as surging inflationary pressures are required to get contained with extremely aggressive quantitative measures.
Meanwhile, the US dollar index (DXY) is establishing above 104.00 and is likely to remain topsy-turvy till it violates the 19-year high at 104.20 or breaks below the previous week’s low at 103.19. In today’s session, the US Producer Price Index (PPI) will remain in focus, which is expected to land at 10.7% on yearly basis.
Gold technical analysis
On an hourly scale, Gold prices have shown some signs of exhaustion on the downside. The bright metal has formed a Bullish Divergence. The asset formed a lower low at $1,832.09 while the momentum oscillator, Relative Strength Index (RSI) (14) denied forming a lower low, which shows exhaustion in the downtrend. The RSI (14) has shifted to a 40.00-60.00 range from a bearish range of 20.00-40.00 but seeks more validation. Gold bulls are firmer above the 20-period Exponential Moving Average (EMA) at $1,849.90.
Gold hourly chart
-637879044849328009.png)
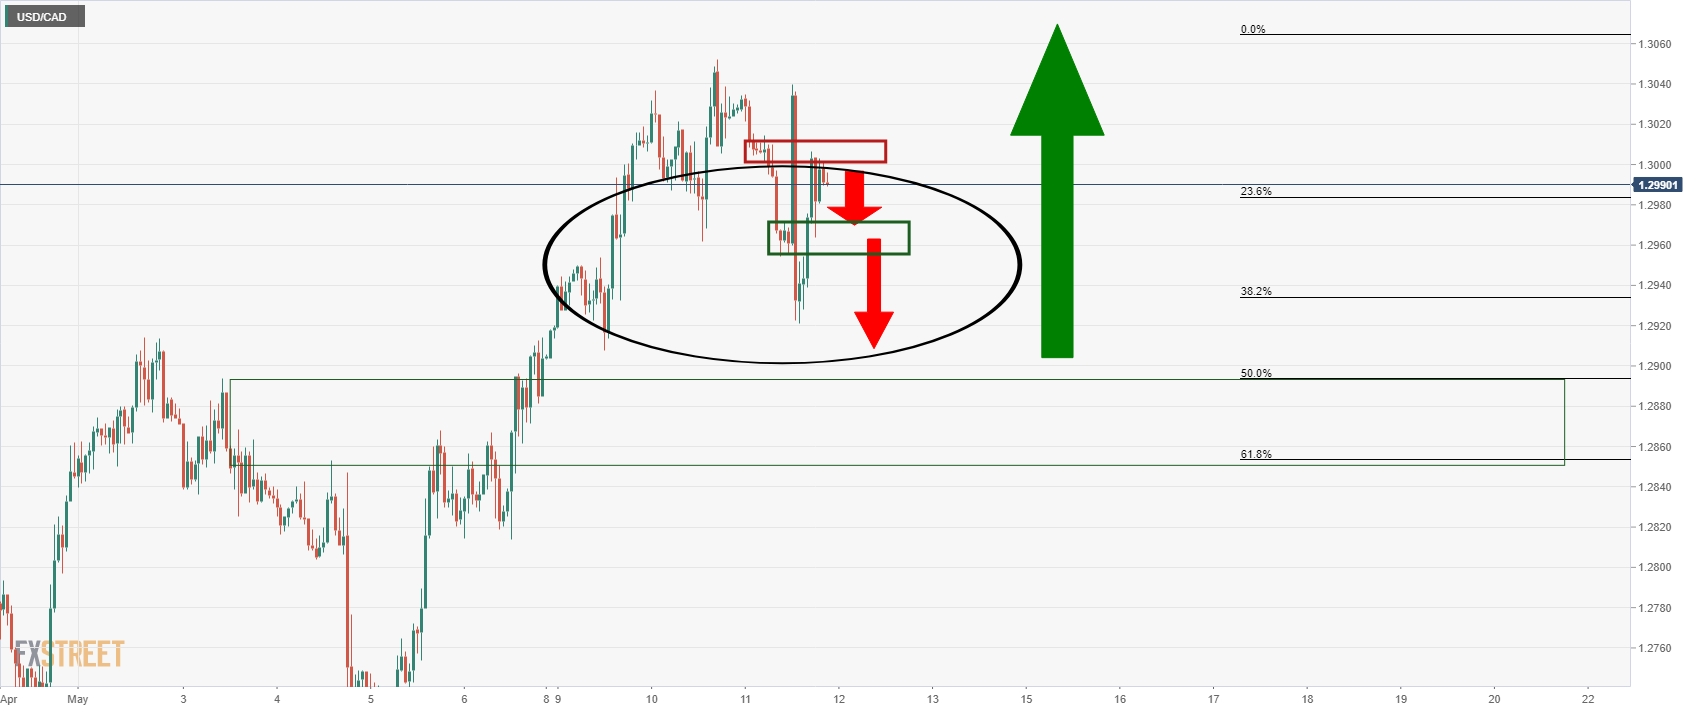
- USD/CAD bears are holding up the bullish advance.
- Eyes on 1.29 the figure prior to fresh higher highs.
USD/CAD is under pressure again despite the rise in the greenback. The technical picture is meanwhile bearish given the daily wick on Wednesday close and the prospects of a more thorough correction prior to the next significant rally and prospects of a fresh cycle high. The following illustrates this on the daily and hourly time frames:
USD/CAD daily chart
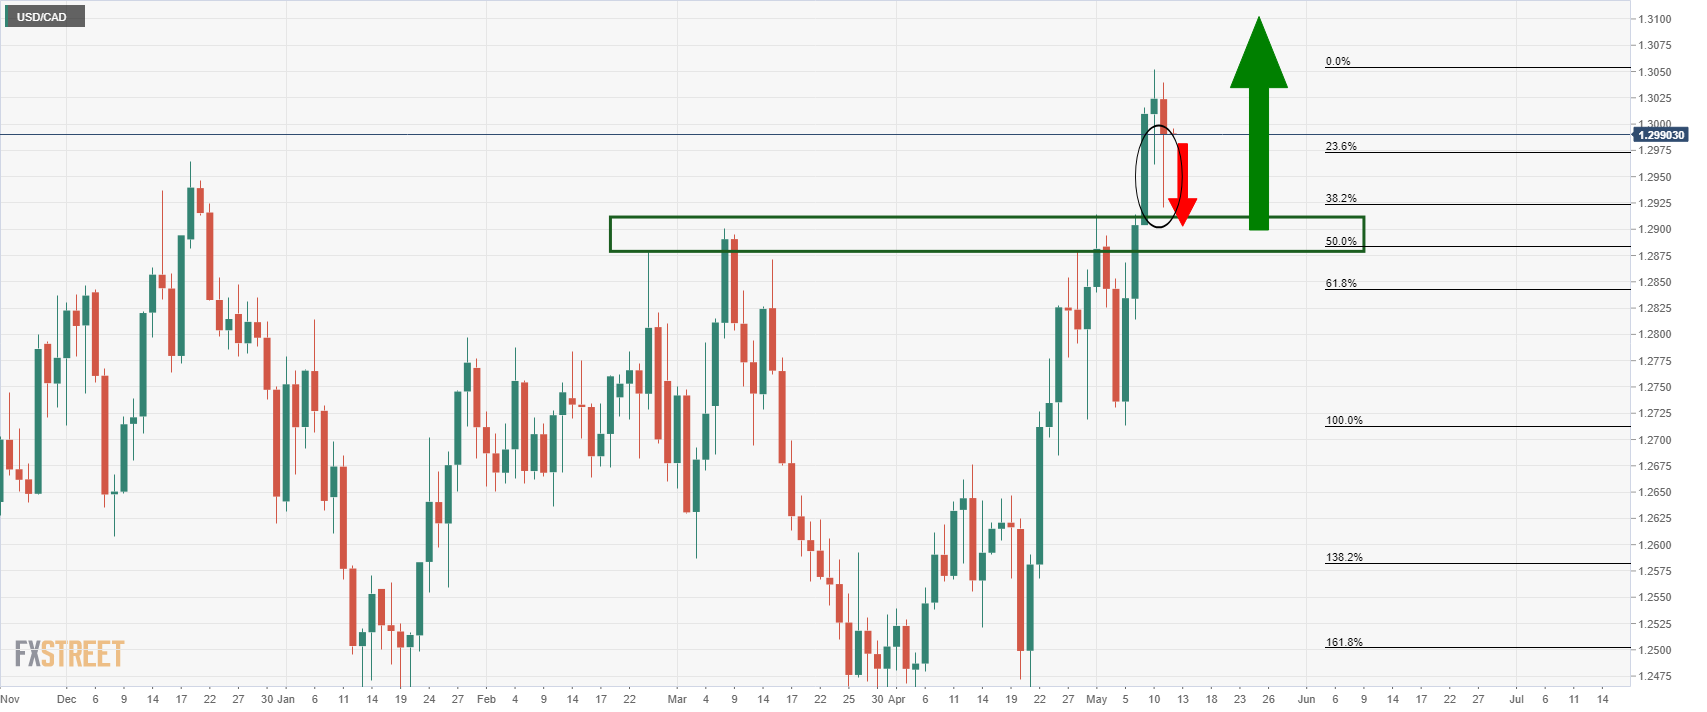
The surge in the greenback on Wednesday has sent the price higher for a bearish candle close and bearish wick. There is a high probability that the wick will be mitigated in the coming sessions which would mean a more purposeful move to the downside to targeting the prior daily highs near 1.29 the figure.
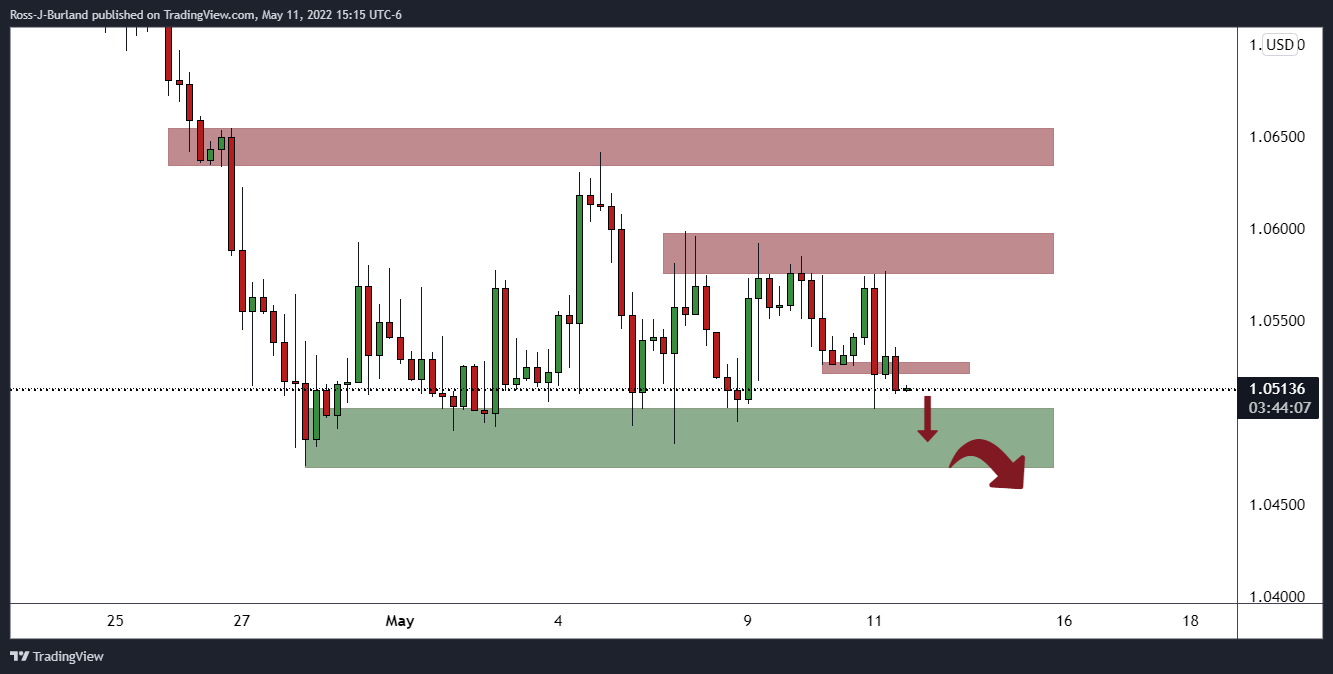
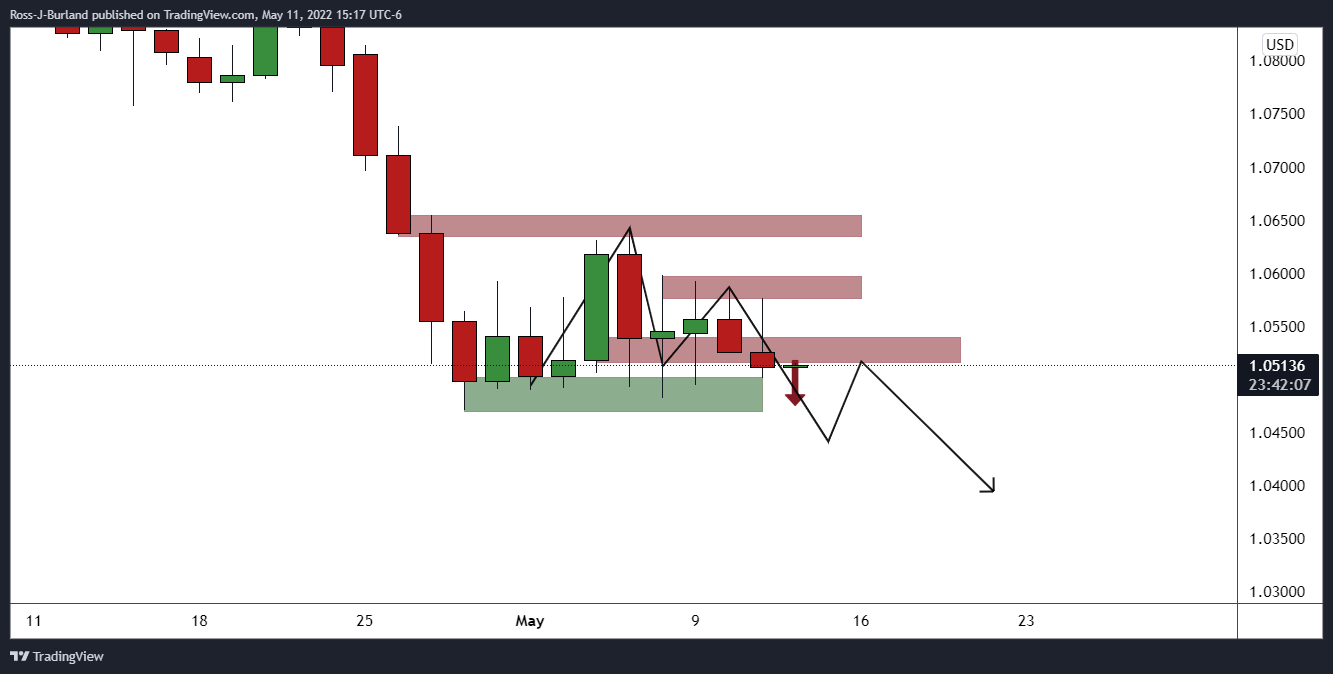
USD/CAD H1 chart
The hourly picture has price being resisted and a followthrough from the bears will need to take out the near term support in the 1.2950s. If, however, his were to hold the test of time, then the bulls could be encouraged to move in and cack the 1.30 figure again with sights on higher daily highs.
- USD/JPY looks to overstep 130.00 on higher-than-expected US inflation.
- The US inflation print at 8.3% indicates that the Fed needs to struggle more going forward.
- The core CPI has also increased to 6.3% against the forecasts of 6%.
The USD/JPY pair is struggling a little around 130.00 but is likely to accelerate further as the higher-than-expected US Consumer Price Index (CPI) has bolstered the odds of a mega rate hike by the Federal Reserve (Fed) in June.
As per the market consensus, the US CPI was seen at 8.1%, lower than the former figure of 8.5%. While the print of 8.3%, higher than the forecasts has cleared that the Fed has a long way to go and an aggressive hawkish tone will remain on the cards. One thing can be concluded that the inflation is near its peak levels and now the market participants could expect a diminishing rate journey led by higher rates and a quicker balance sheet reduction process.
Meanwhile, the core CPI that excludes food and energy prices has landed at 6.2% higher than the estimates of 6%, which clears that higher energy bills and food prices are not the only expenses that are impacting the real income of the households. The US dollar index (DXY) is attempting to sustain above 104.00 as higher-than-expected CPI has worsened the situation for Fed policymakers.
On the Tokyo front, yen bulls are displaying some strength after a prolonged weak period. The situation of value bet is supporting the yen bulls against the greenback. Although the situation won’t persist longer as the Bank of Japan (BOJ) will continue to stick with its ultra-loose monetary policy, which will dampen the demand for yen sooner rather than later.
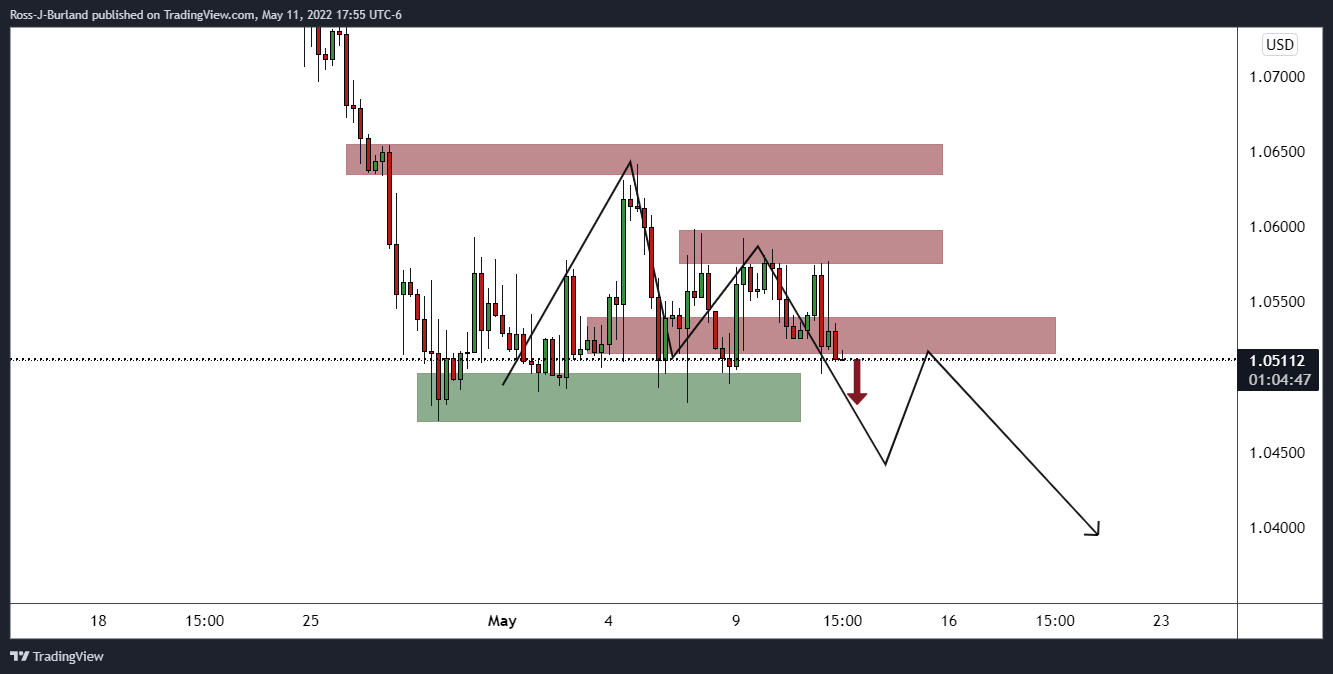
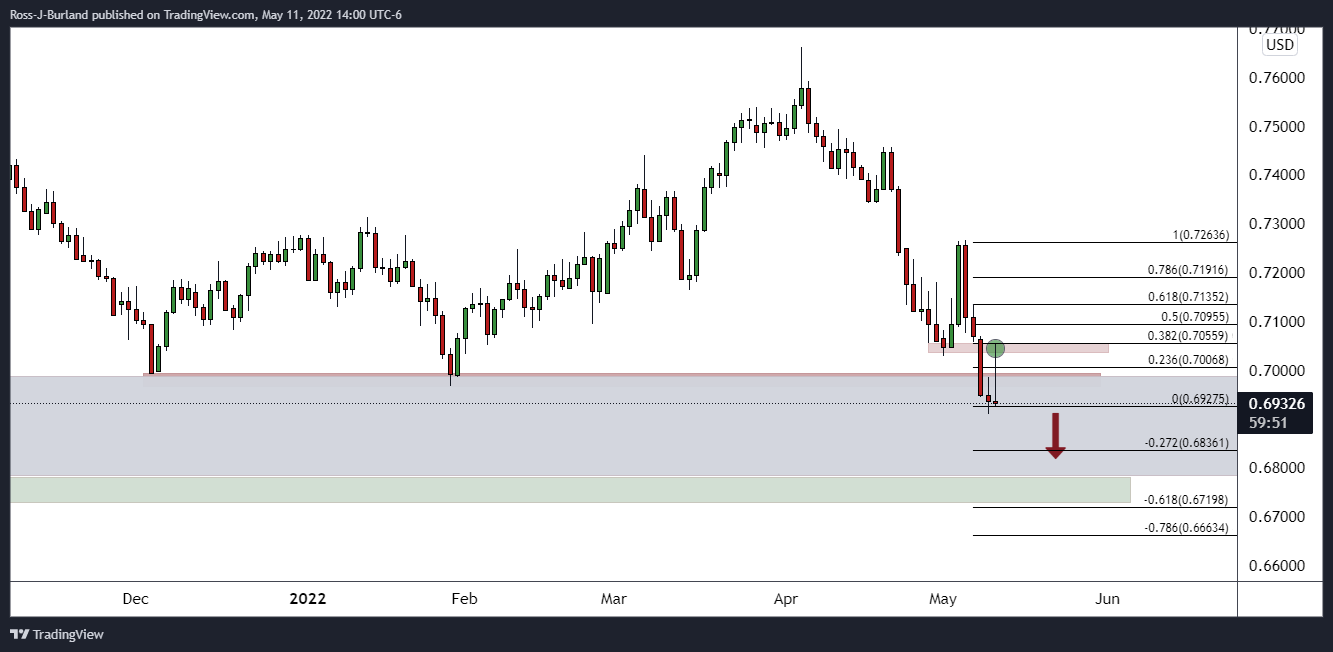
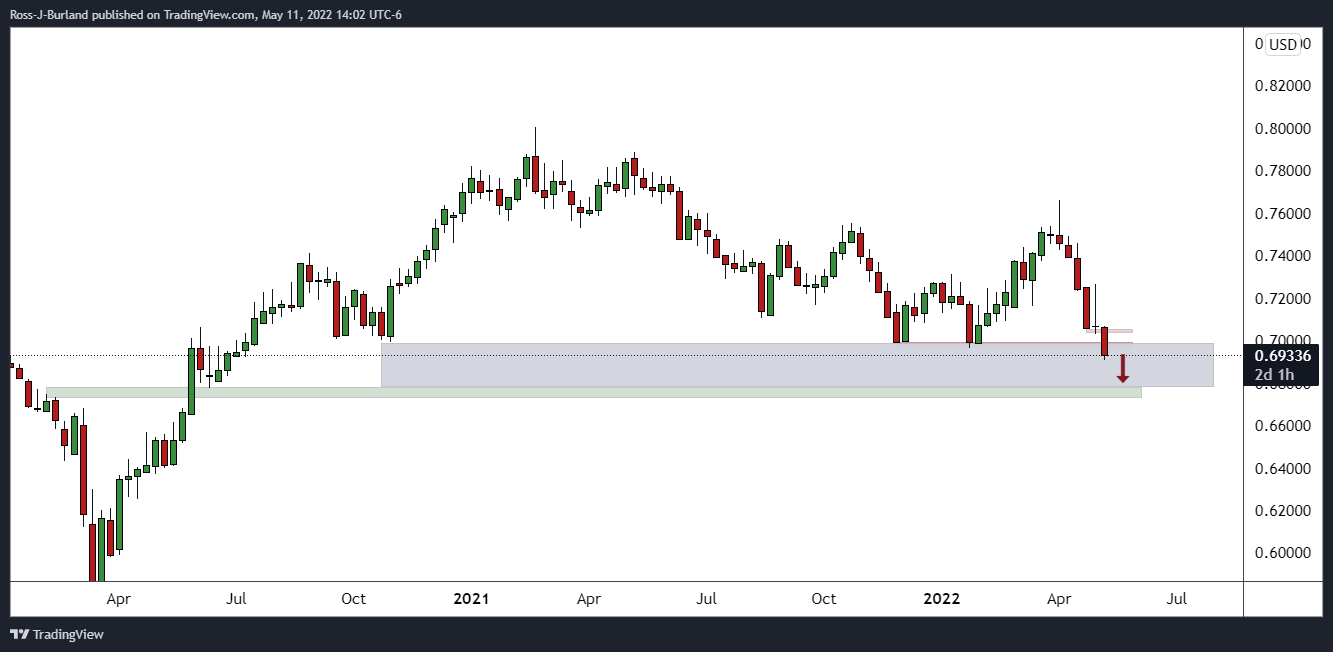
- EUR/USD bears moving in around the cycle lows.
- Bears in the verge of taking the euro to fresh lows, but the daily M-formation is compelling.
The price of the euro has been shunned yet again by the bears in an attempt to correct from the cycle lows of 1.0470 this month so far.
The bulls met fierce opposition at the start of May when the price was rejected from a corrective high of 1.0641 in the face of renewed US dollar strength. The bulls have been unable to recover from the sell-off and there are prospects of a downside continuation for the forthcoming days ahead.
As per the prior analysis, EUR/USD Price Analysis: redistribution taking shape?, the EUR/USD price remains in a consolidation phase and it is yet to be seen if this is just a respite or accumulation. However, the price action is leaning more and more bearish as the week moves along:
EUR/USD H4 chart
From a 4-hour perspective, the price could be on the verge of a move lower:
EUR/USD daily chart
From a daily perspective, however, a move lower will leave a bullish reversion chart pattern behind as follows:
As illustrated, the M-formation would be something to note and would require management in case of a move back higher to restest the old support area, or the neckline, of the M-pattern.
Finance Minister Grant Robertson is making a pre-Budget speech to the Wellington Chamber of Commerce, further pushing along Labour’s fiscal agenda for the year.
The speech comes ahead of both the Budget, and the country’s first emission reduction plan which will be unveiled by James Shaw next Monday. Before then, we will have inflation expectations which will bring the central bank sentiment into the forex market for the day ahead.
Robertson has said that New Zealand's short-term inflation challenge is significant and that the economy is facing capacity constraints, and they will set fiscal policy in place with that in mind.
- He says the economy is in a strong position to weather whatever storm.
- Not signalling that they are about to enter a recession. Will return to surplus in 2024/25.
James "Jim" Bullard who is the president and CEO of the Federal Reserve Bank of St. Louis, is crossing the wires and says that he ''won't emphasize single inflation report too much but inflation is more persistent than many have thought.''
His comments, that follow, come after today's Consumer Price Index report that has contributed t markets turning on a dime in recent trade and sell off to session lows.
Key comments
- 50bps hikes at coming meetings "a good benchmark for now".
- Feel goal should be about 3.5% on the Fed funds rate by end of the year.
- Some of April's inflation number is "transitory," but "a big chunk" is likely persistent and will need a policy response.
- "Base case" does not include a three quarter-point rate increase.
- April inflation was "hot" but not far from what was expected.
- Effects of Fed policy being felt quickly in financial markets.
- Says does not think recession risk is that high in the US right now.
- Volatility in stablecoin market does not look "systemic," but is validating to those who perceive them as risky.
Market implications
The markets are in a freefall into the closing bell on Wall Street on hawkish Fed sentiment. Markets have digested the inflation data over the course of the trading day making for swings in risk sentiment and price action across the financial asset classes. It was a mixed report in that the Consumer Price Index climbed 8.3%, higher than the 8.1% estimate but below the 8.5% in the prior month.
Also, the index rose just 0.3% last month, the smallest gain since last August, the Labor Department said on Wednesday, versus the 1.2% MoM surge in the CPI in March, the most significant advance since September 2005. However, ''the fact that the CPI is driven by rents and services implies that price pressures are entrenched and may manifest in upward pressure on wages too,'' analysts at TD Securities argued. The sentiment is weighing on US stocks into the closing bell.
At the time of writing, the Dow Jones Industrial Average is falling some 1% giving up earlier gains to print fresh lows for the session. The S&P 500 slid 1.7% after increasing 0.5% earlier in the session to new session lows and the Nasdaq Composite has dropped by over 3%, currently extending intraday declines while the 2-year yield increased to 2.857% and is aligned closely with Federal Reserve's interest rate policy.
- AUD/USD bears move in after a significant 38% daily correction.
- The focus is on keeping below daily resistance and weekly downside targets.
- US inflation keeps investors hitting the bid on Wall Street, weighing on high beta FX.
AUD/USD is back under pressure into the closing hours on Wall Street as risk sentiment deteriorates. Traders are moving back into the US dollar and selling equities in what has been a volatile trading session for North American markets. At 0.6935, AUD/USD is now printing in the red after falling from a high on the day of 0.7053 to a low of 0.6927.
Markets have digested the inflation data over the course of the trading day making for swings in risk sentiment and price action across the financial asset classes. It was a mixed report in that the Consumer Price Index climbed 8.3%, higher than the 8.1% estimate but below the 8.5% in the prior month.
Also, the index rose just 0.3% last month, the smallest gain since last August, the Labor Department said on Wednesday, versus the 1.2% MoM surge in the CPI in March, the most significant advance since September 2005. However, ''the fact that the CPI is driven by rents and services implies that price pressures are entrenched and may manifest in upward pressure on wages too,'' analysts at TD Securities argued.
Wall Street hitting the bid
As a consequence, we have seen both a bid and an offer in the US dollar and US yields and stocks. The high beta currencies, such as the Aussie, have been pulled along for the ride. In most recent trade, after an initial rally, the Dow Jones Industrial Average is falling some 0.9% giving up earlier gains to print fresh lows for the session. The S&P 500 slid 1.7% after increasing 0.5% earlier in the session to new session lows and the Nasdaq Composite has dropped 3.19%, currently extending intraday declines while the 2-year yield increased to 2.857% and is aligned closely with Federal Reserve's interest rate policy.
''The positive surprise in core prices will not be favourable for currencies not named the US dollar. We think the market is far too premature in reducing the Fed's optionality set for tightening. This should leave the USD resilient for now,'' analysts at TD Securities argued.
Expectations are completely priced in for another hike of at least 50 basis points at the central bank's June meeting, according to CME's FedWatch Tool. The US dollar index, DXY, is making its way back towards the session highs of 104.105 in a firm but slow bullish drift to currently trade at 103.99 which is weighing on the antipodeans as investors assess how aggressive the Fed will be.
For the week ahead, investors will get another look at inflation data on Thursday in the form of the Producer Price Index for April, with expectations of a monthly increase of 0.5% versus the 1.4% jump in March. On an annual basis, expectations are for a jump of 10.7% compared with the 11.2% surge the prior month.
AUD/USD technical analysis
As per the prior session's analysis, AUD/USD Price Analysis: Longer-term 'Shorts' eye a run to June 2020 lows, 0.6776, where the price was expected to make a bullish correction to the 38.2% ...
the bulls moved in on Wednesday and came in within a few pips shy of the target as follows:
If the bears can now stay on top and keep the price below the resistance, 6990, then there will be prospects of an extension all the way to a weekly target as follows:
What you need to take care of on Thursday, May 12:
The American dollar finished the day with gains against most major rivals, although price action was choppy across the FX market. The greenback rallied after the US annual Consumer Price Index printed at 8.3%, higher than the 8.1% anticipated. The monthly figure was up 0.3% against the 0.2% expected. Finally, the annual core CPI hit 6.2%, slightly below the previous 6.5%, but above the 6% expected. Investors were hoping for confirmation inflation would have peaked, but such numbers hint at a long battle ahead to tame price pressures.
Stocks plunged with the news and managed to turn green afterwards, although the positive tone was short-lived. US indexes closed the day in the red. US government bond yields ended the day down amid demand for safety, with the 10-year Treasury note yielding 2.92% at the close.
The EUR/USD pair trades around 1.0520, weighed by central banks’ imbalance. The European Central Bank has decided to catch up with the rest of major central banks. President Christine Lagarde hinted the central bank could hike rates as soon as July as inflation continues to rise. Also, ECB’s Governor Madis Muller noted that the stimulus program known as APP should end in July, while a hike must not be far behind. Another Governing Council Member, Francois Villeroy, added that the central bank would start hiking this summer.
GBP/USD plunged to the 1.2240 price zone, its lowest since May 2020. The Pound was hit by Brexit woes as the EU announced it would suspend its post-Brexit trade deal with the UK if the UK unilaterally revokes the Northern Ireland Protocol
Meanwhile, the European Commission keeps discussing an embargo on Russian oil imports. The main issue is Hungary’s dependence on Russian supplies.
AUD/USD is down, trading at around 0.6930, while USD/CAD stands at around 1.3000. The Japanese yen appreciated against the greenback, with USD/JPY ending the day at 129.85.
Commodities posted modest intraday advances. Gold is trading at around $1,854 a troy ounce, while WTI recovered to $105.00 a barrel.
Why the current XRP price slump has nothing to do with the SEC
Like this article? Help us with some feedback by answering this survey:
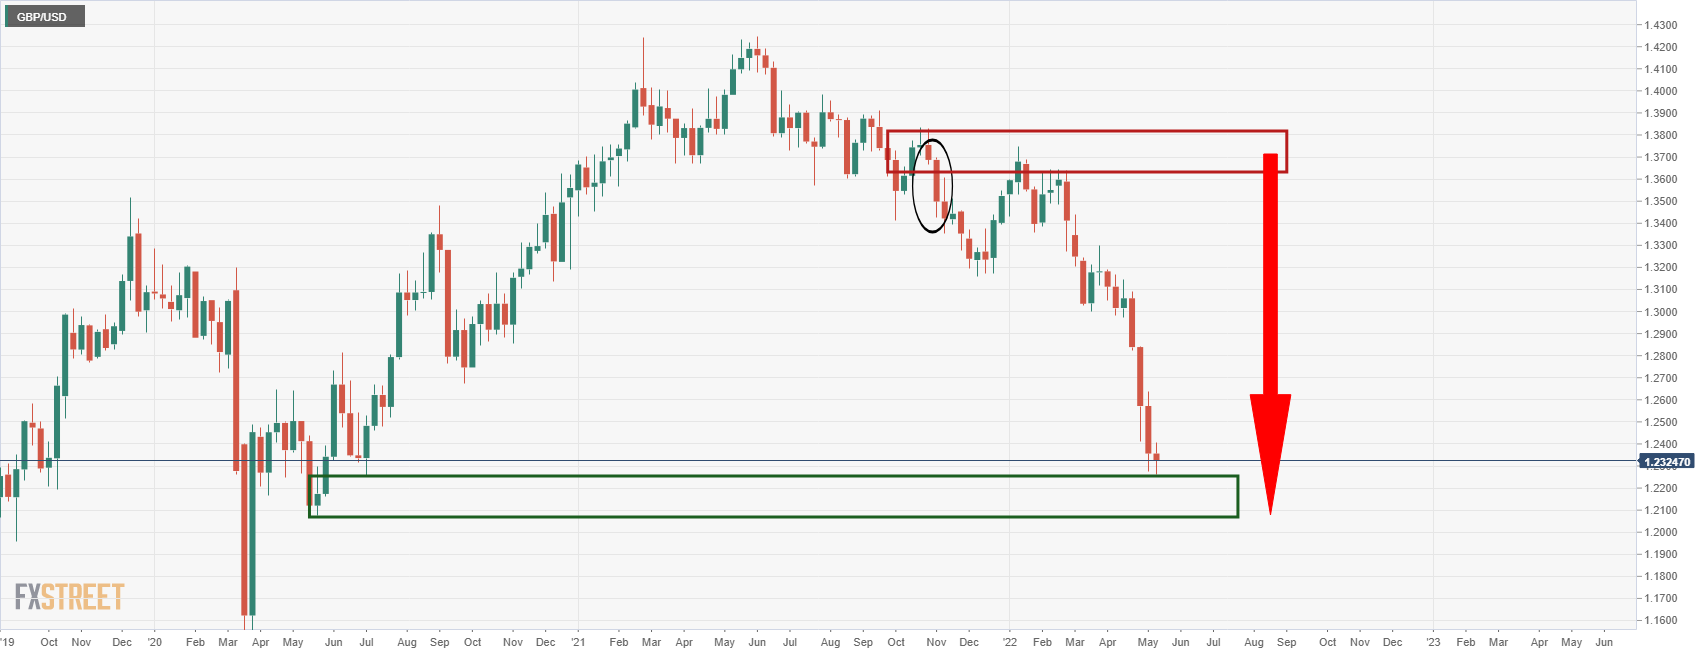
- GBP/USD bears are moving back in and have eyes on 1.2251 weekly lows.
- US dollar remains firm as investors price in Fed rate hikes following strong CPI data.
- US stocks are under pressure in a risk-off pivot late in the US session.
GBP/USD is on the backfoot as US session risk sentiment deteriorates. Cable is down some 0.3% at the time of writing around 1.2272 and is extending from a high of 1.2400 to a low of 1.2263.
The US dollar has moved sharply off its lows, turning positive again for the day as markets digest the inflation data from earlier in the US session. While the data showed that inflation has slowed, underlying price pressures remain elevated which is weighing on investor sentiment and US stocks.
The Consumer Price Index climbed 8.3%, higher than the 8.1% estimate but below the 8.5% in the prior month. Also, the index rose just 0.3% last month, the smallest gain since last August, the Labor Department said on Wednesday, versus the 1.2% MoM surge in the CPI in March, the most significant advance since September 2005.
However, ''the fact that the CPI is driven by rents and services implies that price pressures are entrenched and may manifest in upward pressure on wages too,'' analysts at TD Securities argued.
The Dow Jones Industrial Average fell 0.8% giving up earlier gains. The S&P 500 slid 1.3% after increasing 0.5% earlier in the session. The Nasdaq Composite dropped 2.5% and is currently extending intraday declines while the 2-year yield increased to 2.857% and is aligned closely with Federal Reserve's interest rate policy.
''The positive surprise in core prices will not be favourable for currencies not named the US dollar. We think the market is far too premature in reducing the Fed's optionality set for tightening. This should leave the USD resilient for now,'' analysts at TD Securities said.
The dollar index (DXY), which had touched a four-session low of 103.37 ahead of the report, immediately strengthened to a session high of 104.13 in the wake of the data, just below the two-decade high of 104.19 reached on Monday. However, it has been volatile as traders try to unravel the finer details. Investors have been attempting to assess how aggressive the Fed will be.
Expectations are completely priced in for another hike of at least 50 basis points at the central bank's June meeting, according to CME's FedWatch Tool. The US dollar is making its way back towards the session highs in a firm but slow bullish drift which is weighing on the pound.
For the week ahead, investors will get another look at inflation data on Thursday in the form of the Producer Price Index for April, with expectations of a monthly increase of 0.5% versus the 1.4% jump in March. On an annual basis, expectations are for a jump of 10.7% compared with the 11.2% surge the prior month.
UK GDP coming up
The UK's growth data for March will be released on Thursday. ''While the real income squeeze likely put substantial downward pressure on GDP in March, we look for strong growth in accommodation and food services to put overall services sector growth at 0.1% MoM (in line with consensus),'' analysts at TD Securities explained.
''We expect manufacturing growth of 0.5% (mkt: flat), leaving overall GDP growth just in positive territory in the month and at 1% for the quarter.''
GBP/USD technical analysis
The bears have been in control since breaking 1.3670 back in November 2021. The price is making its way into meeting a prior low of 1.2251 which guards a run to mitigate the imbalance of price between there and the 1.2075 May 18 2020 low:
- The price of gold is trying to correct from daily support.
- Bullish correction eyed towards M-formation neckline but bears lurk at a daily 38.2% Fibo.
- US CPI was regarded as a meanwhile relief for financial markets.
At the time of writing, the gold price is some 0.8% higher and correcting from daily support located in the lows of the day at $1,832.07. At $1,853.40, gold is close to the day's highs of $1,858.30. The markets have been centred around US inflation on Wednesday when the Consumer Price Index was released earlier in the North America session.
While the US inflation data reinforces a hawkish sentiment from the Federal Reserve and justifies front loading called for by the Fed's chairman, Jerome Powell, markets were relieved that the data showed a decline in CPI on an annual basis.
CPI climbed 8.3%, higher than the 8.1% estimate but below the 8.5% in the prior month. Also, the index rose just 0.3% last month, the smallest gain since last August, the Labor Department said on Wednesday, versus the 1.2% MoM surge in the CPI in March, the most significant advance since September 2005.
The dollar index, DXY, moved sharply off its lows on the knee jerk as the data came in higher than expected, so it was unlikely to cause the Federal Reserve to adjust its aggressive path of monetary policy. DXY, which hit a four-session low of 103.37 ahead of the report, immediately strengthened to a session high of 104.13 in the wake of the data.
However, the rally came in short of the 20-year high of 104.19 reached on Monday and traders were quick to move in again and sell the US dollar to a fresh season-low of 103.372 before making its way back towards the session highs in a firm but slow bullish drift.
US stocks back under pressure
Markets have digested the data that shows that inflation has slowed, and underlying price pressures remain elevated which is weighing on investor sentiment and US stocks.
''The fact that the CPI is driven by rents and services implies that price pressures are entrenched and may manifest in upward pressure on wages too,'' analysts at TD Securities argued. ''This likely means gold traders will expect the Fed to step up their hawkish signals.''
The Dow Jones Industrial Average fell 0.8% giving up earlier gains. The S&P 500 slid 1.3% after increasing 0.5% earlier in the session. The Nasdaq Composite dropped 2.5% and is currently extending intraday declines while the 2-year yield increased to 2.857% and is aligned closely with Federal Reserve's interest rate policy.
''The positive surprise in core prices will not be favourable for currencies not named the US dollar. We think the market is far too premature in reducing the Fed's optionality set for tightening. This should leave the USD resilient for now,'' analysts at TD Securities said.
The bearish outlook for gold
''Given that positioning is still tilted to the long end of exposure, continued higher-than-expected price prints could easily send gold below $1,830/oz in the not too distant future. Higher nominal and real rates along with less liquidity due to QT are the likely financial market catalysts driving gold,'' the analysts at TD Securities explained.
''If prices dip below the $1,830s support levels, technicians could pull the yellow metal down toward the $1790s fairly quickly.''
Gold technical analysis
Gold prices had perked up on the news and were moving in on a the M-formation's neckline as follows:
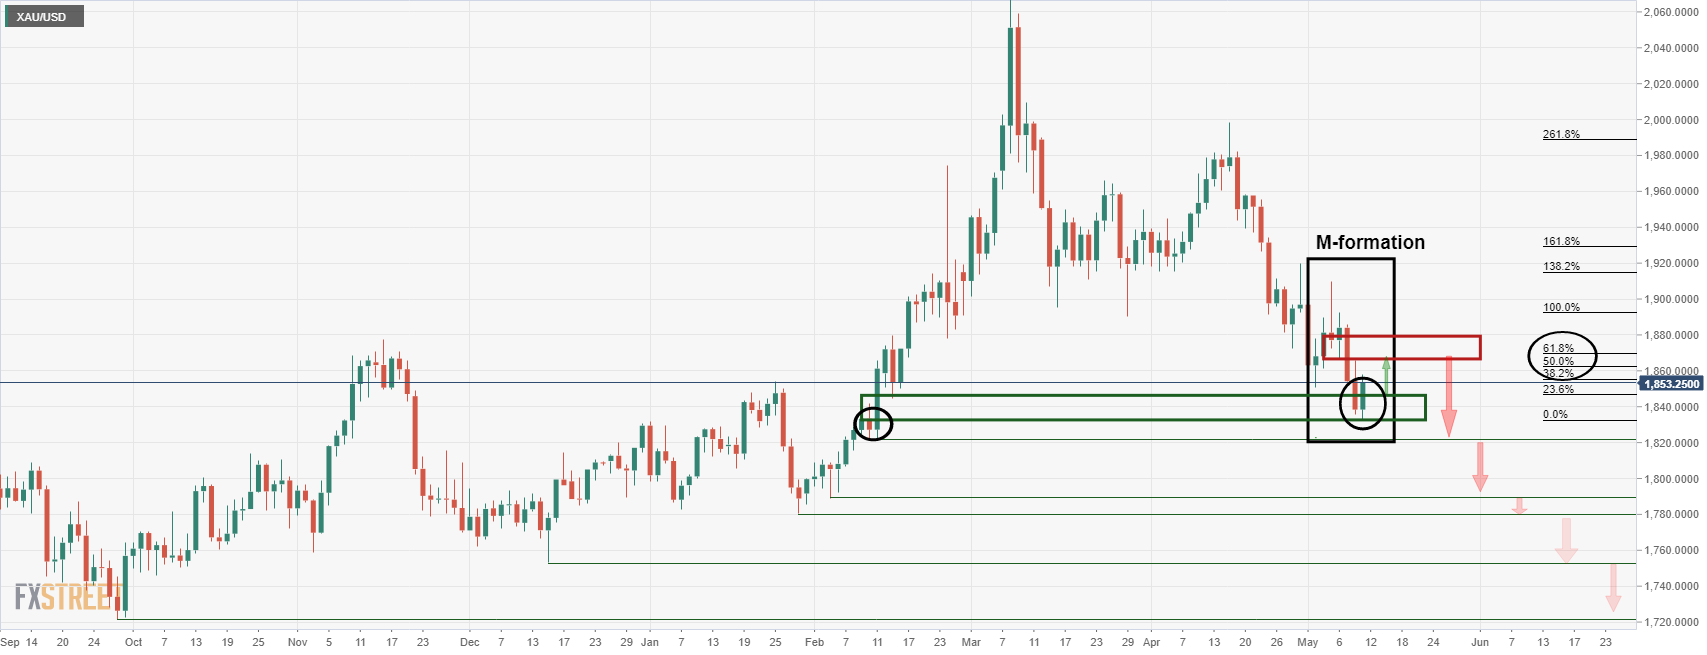
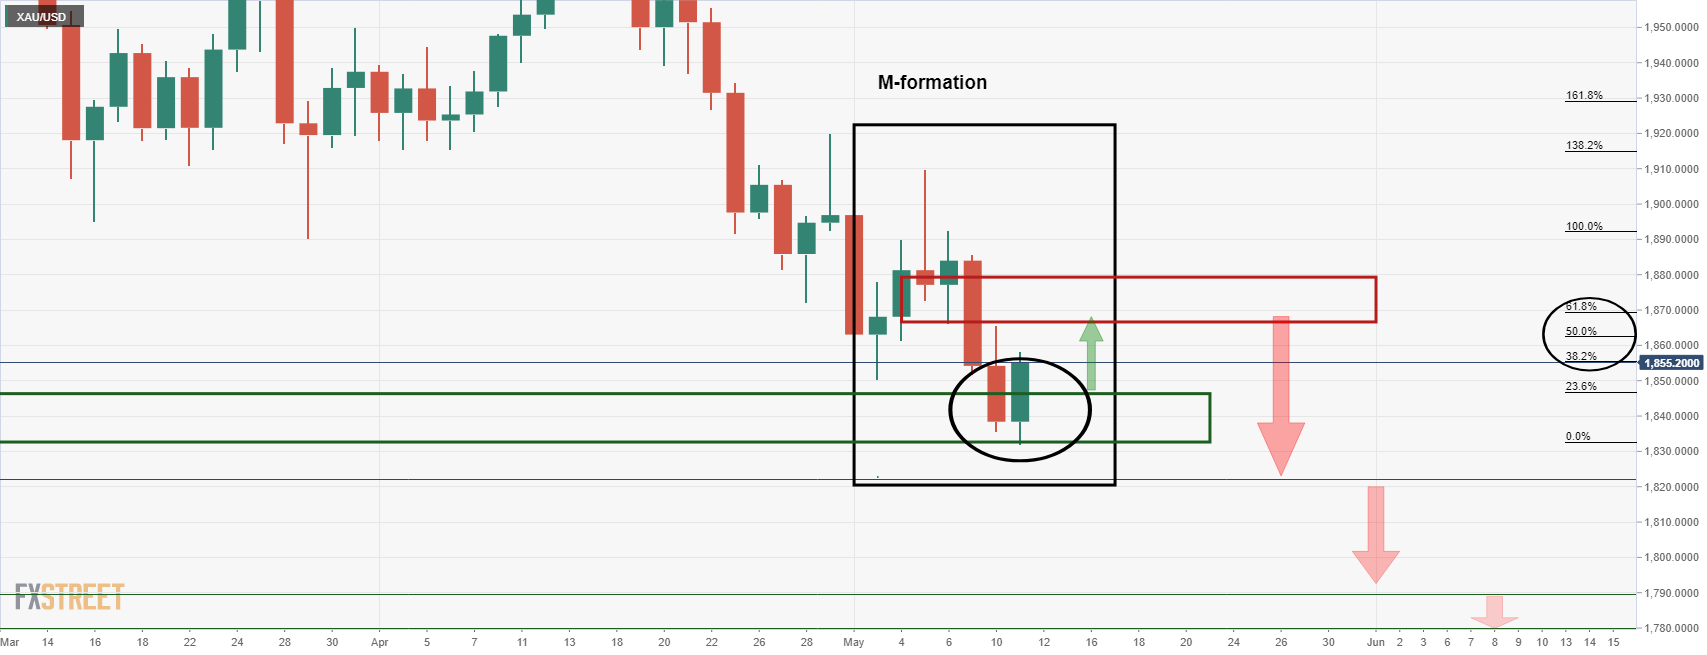
The above charts are daily charts and following a break of a 38.2% Fibonacci resistance at the current highs of the day, there would be prospects of a move into the 50% and 61.8% ratios that align with the M-formation's neckline. However, the 4-hour chart could put up some resistance in the way there:
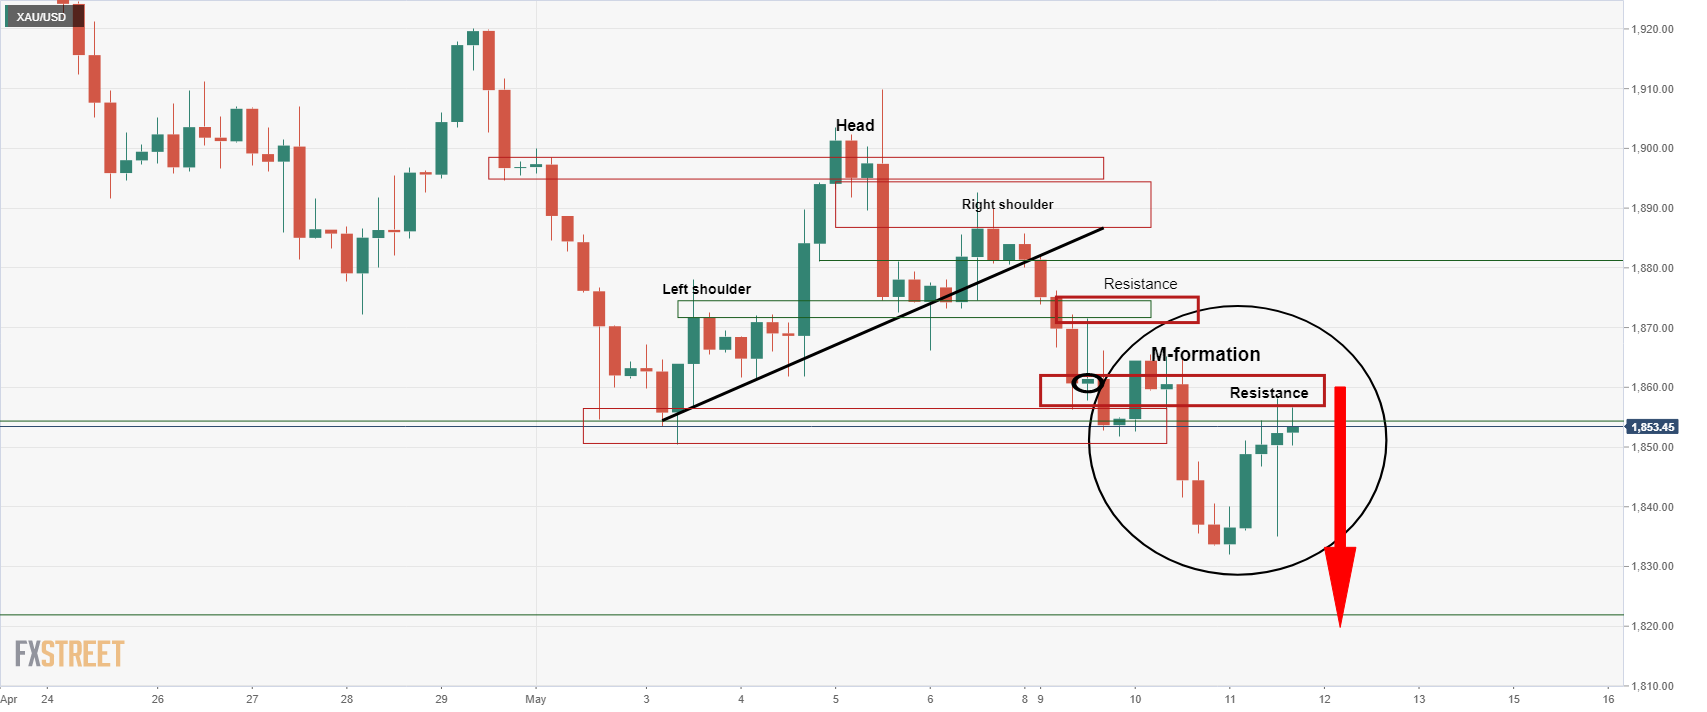
The 4-hour chart has formed an M-formation also and the resistance of the neckline could lead to a downside continuation. This marks a 38.2% Fibonacci retracement on the daily chart as well.
- US dollar jumps and then makes a full pullback.
- Mexican peso gains on risk appetite, on Thursday Banxico’s decision.
- USD/MXN upside capped by 20.45, testing the 20-day SMA.
The USD/MXN made a run to 20.46 after the release of US inflation data, reaching the highest level in a week. Then, amid a general reversal of the US dollar pulled back all the way down back and printed a fresh daily low at 20.21, slightly above the 20-day Simple Moving Average (SMA).
The 20-SMA at 20.20 is the immediate support level and a break lower should clear the way for a test of an uptrend line at 20.08. Below the line there is not much support until the May low at 19.99, also a horizontal critical area.
The daily RSI and the Momentum turned south, suggesting some strength ahead for the Mexican peso that would be confirmed with a daily close under 20.20.
If USD/MXN remains above 20.25, a new test of 20.45 would remain on the table. The area around 20.45 also contains the 200-day SMA. A consolidation above should clear the way for more gains above the 20.50 horizontal resistance. The next significant barrier is seen at 20.70.
USD/MXN daily chart
-637878828137070246.png)
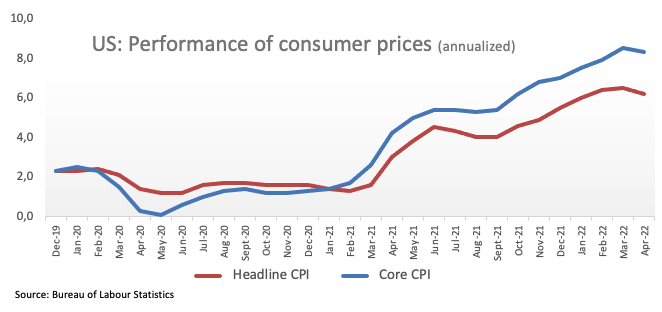
The key report of the week was released on Wednesday. The annual inflation rate in the US dropped in April to 8.3% from the March 8.5% reading (41-year high). The increase was larger than expected. Analysts at Wells Fargo point out April's CPI data served as a stark reminder that the Federal Reserva has a long road ahead of it in bringing down inflation.
Key Quotes:
“The onslaught of inflation this past year eased somewhat in April with the Consumer Price Index posting its smallest gain in nine months. Prices rose 0.3% over the month compared to consensus expectations for a 0.2% rise. Yet even accounting for the moderation, prices continue to rise at a formidable pace. While the year-over-year rate of CPI inflation slowed for the first time since August, prices are still up 8.3%—a rate unthinkable a year ago.”
“Core inflation rose 0.6% in April, hotter than even our above-consensus call for a 0.5% increase and a pickup from last month's 0.3% rise. After slipping in March, core goods prices rose 0.2% in April. The resilience of core goods prices can be tied to a more modest drop in used vehicles and a 1.1% jump in new vehicles as the BLS incorporated new source data with today's release.”
“Although base effects are starting to help drive the year-over-year rates of inflation lower, that will no longer be the case come mid-summer. With the underlying trend in inflation still well-above what the Fed considers desirable, another 50 bps rate hike at the June 14-15 FOMC meeting seems all but assured, with further hikes of that magnitude highly likely to follow in our view.”
- US April inflation data above expectations triggers volatility.
- US dollar jumps across the board and then tumbles.
- EUR/USD remains sideways in the recent range.
The EUR/USD is marginally higher on Wednesday as it trades around 1.0550 after making sharp moves following the April US CPI. The dollar is falling but is off lows.
Dollar drops as yields pullback and stock rise
The greenback weakened on Wednesday after economic data and amid an improvement in risk sentiment. The Dow Jones is rising by 1.24%, and the Nasdaq gains 0.33%, after a negative opening. At the same time, the US 10-year yield stands at 2.96% after reaching 3.07% following the CPI report.
Inflation in the US rose 8.3% in April compared to a year ago; the number was above 8.1% consensus and marked a slowdown from the 41-year high March reading of 8.5%. The core numbers also rose above expectations, sending the dollar to the upside immediately after the numbers were released.
“The positive surprise in core prices will not be favorable for currencies not named the US dollar. We think the market is far too premature in reducing the Fed's optionality set for tightening. This should leave the USD resilient for now”, said analysts at TD Securities.
Despite volatility, EUR/USD continues to trade sideways, in a range unable to move away from the 1.0550 area. A close above 1.0600 should point to more gains ahead, while on the flip side, the 1.0500 is the immediate support followed by the critical area of 1.0480 that if broken, could trigger a bearish acceleration.
Technical levels
Consumer prices surpassed expectations in April, rising a firm 0.3%. The core index surged above the consensus median as well, posting a strong 0.6% MoM increase. These figures bode well for the US dollar, economists at TD Securities report.
Core services shock
“Consumer prices surpassed expectations in April, rising a firm 0.3% MoM. The core index surged above the consensus median as well, posting a strong 0.6% MoM increase led by strengthening services inflation.”
“The positive surprise in core prices will not be favorable for currencies not named the US dollar.”
“We think the market is far too premature in reducing the Fed's optionality set for tightening. This should leave the USD resilient for now.”
Economists at Commerzbank are seeing depreciation pressure for the Chinese yuan over the coming year. They forecast USD/CNY at 6.70 and 6.80 by the year-end of 2022 and 2023 respectively.
A weakening bias for CNY
“A strong dollar due to policy tightening is likely to the main theme in the coming years, while China has much smaller room to maneuver which implies a downside risk for the Chinese currency.”
“The policy divergence between PBoC and Fed implies a weakening bias for the Chinese currency.”
“We forecast 6.7 and 6.8 for USD/CNY at year-end of 2022 and 2023 respectively.”
- NZD/USD has rebounded to the 0.6350 area on Wednesday as risk appetite steadies, despite hot US CPI data.
- But the outlook for a sustained rebound doesn’t look good, with NZD/USD still trading near its lowest levels since 2020.
- Continued concerns about global growth and central bank tightening could yet send the pair lower.
A broad stabilisation in the market’s appetite for risk (US equities are mostly higher) on Wednesday despite the release of hotter-than-expected US Consumer Price Inflation figures coupled with a broad commodity price rebound has seen shorts on the risk/commodity-sensitive New Zealand dollar pared. NZD/USD was last trading higher by nearly 1.0% on the day in the mid-0.6300s after hitting its lowest level since June 2020 at 0.6276 on Tuesday.
But the pair has struggled to push into the upper 0.6300s amid the presence of key chart resistance levels around the 0.6400 mark. NZD/USD failure to break convincingly back to the north of the 0.6350 mark also reflects broader concerns that Wednesday’s improvement in risk appetite will not last.
Indeed, it’s been a rough couple of weeks for the likes of the global stock market and risk-sensitive currencies like the kiwi. NZD/USD has been on a bearish trajectory for more or less the entirety of the last six weeks, with market participants worried about Fed (and global central bank) tightening to address sky-high inflation even though global growth appears to be quickly slowing. The pair is currently down nearly 10% versus its early April highs.
For the rest of the week, commentary from Fed policymakers and the University of Michigan’s preliminary May Consumer Sentiment survey will be the main focus stateside. NZD/USD traders should also keep an eye on the upcoming release of New Zealand Q1 inflation expectations data, which could impact RBNZ tightening expectations. However, it should be noted that the fact that the RBNZ is well ahead of the Fed regarding the lifting of interest rates, and looks set to remain so, has not prevented NZD/USD’s decline in recent weeks.
US core prices have leaped by 0.6% MoM in April, substantially higher than expected. After dropping to the low $1,840s shortly after the data release, gold popped higher into the $1,850s. Despite today's bounce, stubborn inflation poses downside risks for the yellow metal, strategists at TD Securities report.
Still plenty of long exposure in gold
“The US CPI came in at a higher-than-expected 0.3% MoM, with core also up a higher-than-expected 0.6%. While inflation is down to 8.3% and 6.2% y/y in April, it is higher than was anticipated and may suggest that inflation is more entrenched than the Fed is anticipating.”
“The fact that the CPI is driven by rents and services implies that price pressures are entrenched and may manifest in upward pressure on wages too. This likely means gold traders will expect the Fed to step up their hawkish signals.”
“Given that positioning is still tilted to the long end of exposure, continued higher-than-expected price prints could easily send gold below $1,830/oz in the not too distant future.”
“If XAU/USD dips below the $1,830s support levels, technicians could pull the yellow metal down toward the $1,790s fairly quickly.”
- Oil is on the front foot on Wednesday with geopolitics in focus amid disruption to gas flows to Europe via Ukraine.
- WTI has rallied nearly $6.0 on the day to the $105.00s, though is still down over $5.0 on the week.
Global oil prices, though still substantially lower on the week, have seen solid gains on Wednesday, with front-month WTI futures posting an aggressive recovery from earlier session lows underneath the $100 per barrel mark. WTI is now trading above the $105.00 level, still about $5.0 below earlier weekly highs, but up nearly $6.0 on the day.
The ongoing downturn in global equity markets (led by US tech) as investors fret about central bank tightening amid still sky-high inflation and a slowing global growth impulse can be attributed as causing the pullback from recent highs above $110. But fears about supply shortages as a result of the Russo-Ukraine war continue to entice dip-buying upon retests of the $100 level.
Those fears have been in focus in recent weeks as the EU wrangles its way closer to an agreement on a ban on all Russian oil imports, a move that commodity strategists think would be devastating to the country’s producers. Hungary is for now blocking a final deal on the embargo, the latest reporting on the issue suggests, but it seems a compromise is soon likely to be reached.
Meanwhile, gas flows to Europe via Ukraine have been disrupted for the first time amid alleged interference in a major transit route by occupying Russian forces (so Ukraine says), marking the first disruption to gas flows in the country since the war started two and a half months ago. This is likely also to be giving oil markets some support on Wednesday.
WTI bulls will be hoping for a retest of recent highs above $110 in the coming days, though so long as broader risk appetite remains on the ropes, this will be a difficult task to manage. In the immediate future, crude oil traders will be monitoring official weekly US crude oil inventory data out at 1530BST after private weekly inventory data on Tuesday showed a surprise build.
The tensions have calmed somewhat on the markets since the start of the Ukraine war, and the Swiss franc is less in demand as a safe haven. Economists at Commerzbank see EUR/CHF higher in the course of the year but only moderately.
Dovish SNB
“The SNB is likely to want to stick to the status quo for the time being. As long as risk aversion does not pick up more strongly again, the franc could trend weaker due to the SNB's monetary policy stance. Moreover, if the ECB initiates its turnaround in July, the EUR should gain.”
“We see EUR/CHF strengthening somewhat in the course of the year. However, only moderately since the SNB should then ultimately raise its key rate in July as well.”
“Against the USD, the franc should appreciate somewhat in the course of the year, when it becomes clear that the SNB is also initiating the turnaround in monetary policy. However, since the Fed will probably act much more actively, we see USD/CHF at higher levels again next year.”
Another session of range-trading for the EUR/USD leaves the pair’s technical picture looking broadly intact. Economists at Scotiabank note that the 1.05 and 1.06 levels remain solid support and resistance, respectively.
Losses below 1.05 find support at the late April low of 1.0472
“The 1.05 and 1.06 figure areas remain solid support and resistance zones, respectively, while the broad trend in the EUR points to this consolidation period eventually giving way to further losses to a five-year-low.”
“Intraday support ahead of the figure is ~1.0525 while the daily high of ~1.0575 stands as intermediate resistance followed by ~1.0585 ahead of the figure zone.”
“Losses below 1.05 find support at the late Apr low of 1.0472.”
- USD/TRY clinches new 2022 peaks near 15.40.
- Turkey 10y bond yields rise above 24.00%.
- Markets’ attention no shift to the CBRT event in late May.
The Turkish lira remains on the defensive and pushes USD/TRY to new YTD peaks in the vicinity of 15.40 on Wednesday.
USD/TRY in 5-month highs
USD/TRY posts gains for the fifth consecutive session on Wednesday and extends the recent breakout of the 15.00 barrier on the back of the persistent sell-off in the Turkish currency.
Indeed, the lira drops to levels last seen back in late December 2021, as the currency remains under heavy pressure following prospects of a longer-than-anticipated military conflict in Ukraine and its potential impact on energy prices.
In the meantime, investors continue to closely follow any indication of intervention by the Turkish central bank (CBRT) in the FX markets in order to prevent the lira to depreciate to unwelcomed levels.
The CBRT meets again on May 26 and market participants have already started to price in another “on hold” stance from the central bank, despite inflation rose to almost 70% in the year to April.
What to look for around TRY
The lira broke below the multi-week range bound theme vs. the greenback and lifted USD/TRY to the area beyond the 15.00 neighbourhood. So far, price action in the Turkish currency is expected to gyrate around the performance of energy prices, the broad risk appetite trends, the Fed’s rate path and the developments from the war in Ukraine. Extra risks facing TRY also come from the domestic backyard, as inflation gives no signs of abating, real interest rates remain entrenched in negative figures and the political pressure to keep the CBRT biased towards low interest rates remain omnipresent.
Key events in Turkey this week: Unemployment Rate (Tuesday).
Eminent issues on the back boiler: FX intervention by the CBRT. Progress (or lack of it) of the government’s new scheme oriented to support the lira via protected time deposits. Constant government pressure on the CBRT vs. bank’s credibility/independence. Bouts of geopolitical concerns. Structural reforms. Upcoming Presidential/Parliamentary elections.
USD/TRY key levels
So far, the pair is gaining 0.38% at 15.3059 and faces the next hurdle at 15.3746 (2022 high May 11) seconded by 18.2582 (all-time high December 20) and then 19.00 (round level). On the other hand, a drop below 14.6836 (monthly low May 4) would expose 14.5458 (monthly low April 12) and finally 14.5136 (weekly low March 29).
The past month has seen significant further increases in US yields, with 10Y US Treasury yields rising to 3%. Economists at Danske Bank expect yields to peak in six months.
10-year US yields to peak six months from now
“We now expect 10Y Treasury yields to increase to 3.5% in the course of the next 6 to 12 months. We previously expected an increase to 3.1%.”
“Note that we have now pencilled in a peak for yields in 6 months’ time. On a 12-month horizon, we estimate that markets will seriously begin to price short rates at close to peaking and the next shift in rates to be downwards – not least, if the economic cycle turns out weaker in 2023 than we expect.”
- USD/JPY faded stronger US CPI-led intraday bullish spike and retreated to the 130.00 mark.
- The formation of a double-top and ascending trend-line breakdown favours bearish traders.
- Weakness below the 100-period SMA on the 4-hour chart will reaffirm the negative bias.
The USD/JPY pair caught aggressive bets during the early North American session and shot to the daily high in reaction to stronger-than-expected US consumer inflation figures. The momentum, however, ran out of steam near the 130.80 region and the subsequent pullback dragged spot prices back closer to the 130.00 psychological mark.
Looking at the broader picture, this week's pullback from a fresh two-decade high, around the 131.35 region touched on Monday, constitutes the formation of a bearish double-top on short-term charts. A subsequent slide below an ascending trend-line extending from late March could be seen as a fresh trigger for bearish traders.
The negative outlook is reinforced by the fact that technical indicators on hourly charts have just started drifting into bearish territory. Some follow-through selling below the 100-period SMA on the 4-hour chart will reaffirm the bearish bias and pave the way for some meaningful corrective slide for the USD/JPY pair.
Spot prices could then accelerate the fall towards intermediate support near the 129.35 region before eventually dropping to the 129.00 round-figure mark. The downward trajectory could further get extended towards testing the 128.25-128.20 region en-route the 128.00 mark and the 127.70-127.65 support zone.
On the flip side, the 130.70-130.75 region now seems to have emerged as an immediate strong resistance ahead of the 131.00 mark. Some follow-through buying would negate the near-term bearish bias and allow the USD/JPY pair to surpass the recent swing high, around the 131.35 region, and aim to conquer the 132.00 round figure.
USD/JPY 4-hour chart
-637878745052326385.png)
Key levels to watch
- USD/CAD has been choppy in wake of US CPI, but has ultimately fallen back below 1.2950 as crude prices rise.
- However, the sour tone to trade in US equities hampers the prospect for a broader loonie rebound.
- USD/CAD hit its highest level since November 2021 on Tuesday in the mid-1.30s.
USD/CAD saw a momentary jump higher in recent trade in wake of hotter than forecast US Consumer Price Inflation data and came close to testing Tuesday’s multi-month highs in the mid-1.3000s. However, almost as quickly as the pair rose, it has reversed lower again and recently fell back to the 1.2950, where it trades with on the day losses of about 0.5%.
Global crude oil prices have regained their poise after dipping earlier in the week and this is helping the loonie to recover from its weakest levels against the US dollar since November 2021. But the downbeat tone to US (and global) equity markets presents a barrier to USD/CAD trading any lower or testing support in the 1.2900 area.
US equities, with which the risk-sensitive loonie has been closely correlated (as has also been the case with other risky currencies) in recent weeks, are under pressure once again on Wednesday as investors fret about what the latest US inflation figures mean for the Fed policy outlook. Investors are concerned about the Fed tightening aggressively this year and next to stymie still elevated inflation despite a weakening global growth outlook.
Even though the BoC is arguably even more hawkish than the Fed, this hasn’t been enough to shield the risk-sensitive loonie from the impact of the downturn in risk appetite in recent weeks. The BoC will be in focus later this week when its Deputy Governor Toni Gravelle speaks on the topic of commodities, growth and inflation on Thursday. Traders will listen closely, as he could offer further hints about the outlook for interest rates.
- GBP/USD quickly recovered around 75 pips from the post-US CPI slide to the 1.2275 area.
- The USD witnessed selling following the release of a stronger US CPI and extended support.
- Negative Brexit headlines, a bleak outlook for the UK economy should cap any further gains.
The GBP/USD pair reversed the post-US CPI slide during the early North American session and was last seen trading with modest intraday gains, around mid-1.2300s.
The headline US CPI rose 0.3% MoM in April and the yearly rate decelerated to 8.3% from 8.5%. This, however, was still above consensus estimates pointing to a reading of 0.2% and 8.1%, respectively. Adding to this, core CPI, which strips out volatile food and energy prices, climbed 0.6% during the reported month, surpassing the 0.4% expected.
This comes amid tight global supply chains resulting from China's zero-covid policy and the war in Ukraine and suggested that inflationary pressures are likely to remain high in the next few months. Nevertheless, the data reaffirmed bets for a more aggressive policy tightening by the Fed, which was evident from a sharp spike in the US Treasury bond yields.
The US dollar, however, witnessed a typical 'buy the rumour, sell the news' kind of trade and also seemed rather unaffected by a turnaround in the global risk sentiment. This, in turn, assisted the GBP/USD pair to rebound swiftly from the 1.2275 area, though any meaningful upside seems elusive and the attempted recovery runs the risk of fizzling out rather quickly.
Against the backdrop of the Bank of England's gloomy economic outlook last week, the UK economic think-tank - NIESR - warned that Britain is on course to enter a technical recession in the second half of 2022. This, along with negative Brexit-related headlines, should act as a headwind for the British pound and cap gains for the GBP/USD pair, at least for the time being.
A spokesperson for UK Prime Minister Boris Johnson said that Northern Ireland Protocol (NIP) talks are in a serious situation. Britain reserves the right to take further action if solutions cannot be found urgently, the spokesman added further. Separately, an EU official threatened that the EU is ready to suspend its post-Brexit trade deal and might also halt talks regarding Gibraltar if the UK unilaterally revokes the NIP.
Hence, it will be prudent to wait for strong follow-through buying before confirming that the GBP/USD pair has bottomed out in the near term and positioning for a further appreciating move. Nevertheless, spot prices, for now, seem to have snapped a four-day losing streak and are holding comfortably above the YTD low, around the 1.2260 region touched earlier this week.
Technical levels to watch
- Gold has pulled back from earlier highs in the $1850s in wake of hotter than forecast US CPI data.
- XAU/USD is for now being supported by its 200DMA in the mid-$1830s.
- But for how long the 200DMA can hold amid rising US yields and buoyant buck remains to be seen.
After rebounding from a test of its 200-Day Moving Average at $1835 during Asia Pacific trade to as high as the $1850s during the late European morning, spot gold (XAU/USD) prices have slipped up once again following hotter than expected US inflation data. Prices are back to trading in the low $1840s, after market participants upper their Fed tightening bets on the back of a larger than expected MoM in Core price pressures.
At current levels, XAU/USD still trade about 0.3% higher on the day, with demand ahead of the 200DMA for now remaining robust. But in wake of the US inflation data, US yields have turned sharply higher, with the 10-year back above 3.0% from the low 2.90s%, while and the DXY also bounced to the upper 103.00s. Both are eyeing a test of recent multi-year highs.
Against the backdrop of buoyant US yields (which represent a higher “opportunity cost” of holding non-yielding assets like gold) and a stronger US dollar (which makes USD-denominated commodities more expensive for international buyers, it feels like a matter of time under XAU/USD drops under its 200DMA.
That would open the door to a run lower towards the psychologically important $1800 level and a test of annual lows around $1780 just below it. Gold bulls will be hoping for fresh negative developments regarding Western sanctions on Russian energy exports (an EU embargo to be agreed soon?) and China lockdowns (Beijing and Shanghai are still struggling to contain infections) to spur safe-haven/inflation protection demand and avert a drop back under $1800.
- Silver prices have pulled lower from earlier highs near $22.00 following hotter than expected US inflation data.
- XAG/USD is back under $21.50 and eyeing a move to fresh multi-year lows under $21.00 as hawkish Fed bets build.
Spot silver (XAG/USD) prices have fallen back sharply from earlier session highs in the upper $21.00s per troy ounce and are now back to trading back under the $21.50. At current levels in the $21.40s, on-the-day gains have now been pared to about 1.0%. Just released US Consumer Price Index data showed a slower than expected moderation in the YoY rate of headline price pressures and a larger than expected jump in MoM Core price pressures in April.
The US dollar and US yields jumped as a result and this explains the recent pullback in XAG/USD. Some traders had been hoping for a moderation in inflation pressures to ease the pressure on the Fed to tighten monetary policy so aggressive this year and next. The latest data certainly doesn’t do that, hence the rebuilding of some hawkish Fed bets.
After breaking out to its lowest levels under $21.20 since mid-2020 on Tuesday, XAG/USD attempted rebound has been cut short. Should the US dollar and yields continue to press higher, a drop towards $21.00 certainly seems on the cards. A break lower would open the door to an eventual drop to the next area of key support under the $20 mark.
- EUR/USD gives away initial gains and challenges the 1.0500 region.
- ECB-speakers advocated for a rate hike this summer.
- US CPI rose more than expected in April.
The initial reaction to the release of US CPI sent EUR/USD back to the negative territory in the boundaries of the 1.0500 zone on Wednesday.
EUR/USD looks supported near 1.0500
EUR/USD now alternates gains with losses around the 1.0500 neighbourhood after US inflation figures showed the headline CPI rise at an annualized 8.3% in April, and the Core CPI advance 6.2%. Despite both prints came above initial estimates, they eased a tad from the previous readings, hinting at the possibility that consumer prices could have peaked in March.
The higher-than-predicted CPI figures encouraged US yields to make a U-turn and now advance modestly along the curve.
Earlier in the session, ECB’s Lagarde suggested the APP could end early in Q3, while normalization will be at a gradual pace following the initial rate hike. Previous comments from ECB Board members also advocated for the first rate hike at some point this summer.
What to look for around EUR
EUR/USD revisits the 1.0570/80 band following the choppy performance of the greenback on Wednesday. The outlook for the pair still points to the bearish side, always in response to dollar dynamics, geopolitical concerns and the Fed-ECB divergence. Occasional pockets of strength in the single currency, in the meantime, should appear reinforced by speculation the ECB could raise rates at some point in the summer, while higher German yields, elevated inflation and a decent pace of the economic recovery in the region are also supportive of an improvement in the mood around the euro.
Key events in the euro area this week: Final Germany Inflation Rate, ECB Lagarde (Wednesday) – EMU Industrial Production (Friday).
Eminent issues on the back boiler: Asymmetric economic recovery post-pandemic in the euro area. Speculation of ECB tightening/tapering later in the year. Impact on the region’s economic growth prospects of the war in Ukraine.
EUR/USD levels to watch
So far, spot is gaining 0.05% at 1.0529 and faces the next up barrier at 1.0641 (weekly high May 5) followed by 1.0936 (weekly high April 21) and finally 1.1000 (round level). On the other hand, a break below 1.0470 (2022 low April 28) would target 1.0453 (low January 11 2017) en route to 1.0340 (2017 low January 3 2017).
- AUD/USD surrendered a major part of its intraday gains in reaction to stronger US CPI print.
- The US CPI report reaffirmed aggressive Fed rate hike bets and boosted demand for the USD.
- A turnaround in the risk sentiment also benefitted the safe-haven buck and exerted pressure.
The AUSD/USD pair fell over 60 pips in reaction to hotter-than-expected US consumer inflation figures and was last seen trading with only modest intraday gains, just below mid-0.6900s.
The Bureau of Labour Statistics reported this Wednesday that the headline US CPI rose 0.3% MoM in April as against consensus estimates pointing to a reading of 0.2%. The yearly rate also surpassed market expectations and climbed 8.3% during the reported month. Core inflation, which excludes food and energy prices, came in at 0.6% MoM and 6.2% YoY rate as against 0.4% and 6% anticipated, respectively.
The data suggested that inflationary pressures in the world's biggest economy are peaking, though were strong enough to reaffirm market bets for a more aggressive policy tightening by the Fed. In fact, the markets are still pricing in a further 200 bps rate hike for the rest of 2022 amid concerns that China's zero-covid policy and the war in Ukraine might continue to push consumer prices higher.
Apart from this, a turnaround in the global risk sentiment - as depicted by a sharp intraday slide in the equity markets - boosted demand for the safe-haven US dollar and exerted downward pressure on the AUD/USD pair. The emergence of fresh selling at higher levels suggests that the recent downtrend witnessed over the past one month or so might still be far from over and favours bearish traders.
Technical levels to watcha
- Headlines CPI came in at 8.3% YoY, above the expected 8.1%.
- Measures of core inflation were also hotter than forecast.
- The DXY jumped as a result and is now probing the 104.00 level once again.
The annual pace of headline inflation in the US according to the Consumer Price Index (CPI) fell to 8.3% in April from 8.5% in March, according to the latest release from the Bureau of Labour Statistics on Wednesday. That was above the expected decline to 8.1% YoY. The MoM pace of headline inflation fell to 0.3% in April from 1.2% in March, also above the expected drop to 0.2%.
Measures of core inflation according to the Core Consumer Price Index also came in above expectations. The YoY rate clocked 6.2%, below March's 6.5%, but above the expected drop to 6.0%, while the MoM saw a larger than expected jump to 0.6% from 0.3% in March versus the expected 0.4% reading.
Market Reaction
The US Dollar Index (DXY) jumped to print fresh session highs near 104.00 as a result of the higher than expected inflation readings, especially given the MoM pick up in the pace of Core CPI inflation. These numbers will worry the Fed and underpin expectations for aggressive tightening this year and next.
There is a risk that high inflation becomes entrenched, ECB Executive Board member Isabel Schnabel said on Wednesday in a speech. As a result, its time to conclude the measures that were enacted to combat low inflation, she continued, adding that policy action is required for price stability.
- GBP/JPY dropped to a two-week low in reaction to the incoming negative Brexit headlines.
- The gloomy UK economic outlook further undermined the GBP and exerted some pressure.
- The risk-on impulse dented demand for the safe-haven JPY and helped limit further losses.
The GBP/JPY cross quickly recovered over 60 pips from a two-week low touched during the mid-European session and was last seen trading in neutral territory, around mid-160.00s.
The British pound weakened a bit in reaction to negative Brexit-related headlines, which, in turn, was seen as a key factor that exerted some downward pressure on the GBP/JPY cross. A spokesperson for UK Prime Minister Boris Johnson said that Northern Ireland Protocol (NIP) talks are in a serious situation. Britain reserves the right to take further action if solutions cannot be found urgently, the spokesman added further.
Separately, an EU official warned that the EU is ready to suspend its post-Brexit trade deal and might also halt talks regarding Gibraltar if the UK unilaterally revokes the NIP. This comes on the back of the Bank of England's gloomy economic outlook. Moreover, the UK economic think-tank - NIESR - noted that Britain is on course to enter a technical recession in the second half of 2022, which further weighed on sterling.
On the other hand, strong recovery in the global risk sentiment - as depicted by a generally positive tone around the equity markets - dented the Japanese yen's safe-haven status. Apart from this, the Bank of Japan's dovish monetary policy stance kept a lid on any meaningful gains for the JPY and assisted the GBP/JPY cross to rebound swiftly from sub-160.00 levels. The mixed fundamental backdrop warrants some caution for aggressive traders.
Technical levels to watch
- EUR/USD regains upside traction and retests 1.0570.
- The weekly high at 1.0641 emerges as the next target of note.
EUR/USD keeps the choppy trade well and sound above the 1.0500 region so far this week.
While further consolidation remains likely in the very near term, occasional bouts of strength could see the pair initially targeting the round level at 1.0600 prior to the more relevant weekly high at 1.0641 (May 5).
Above the 3-month line near 1.0920, the selling pressure is expected to alleviate somewhat. This area reinforces the weekly high recorded on April 21 at 1.0936.
EUR/USD daily chart
- GBP/USD is subdued in the mid-1.2300s in the run-up to the release of US CPI data.
- Sterling has been resilient to increased negative Brexit newsflow and forecasts for a UK recession in H2 2022.
- Some are saying a lot of bad news is already in the price, but political risk limits rebound potential.
Despite the increasingly concerning tone to Brexit newsflow, with the EU threatening to revoke its trade deal with the UK should the latter unilaterally scrap the Northern Ireland Protocol (as it has been jawboning about this week), and despite a UK-based economic think tank forecasting that the UK will be in a technical recession in the second half of this year, GBP/USD continues to trade in a stable fashion in the mid-1.2300s and is well with recent intra-day ranges.
After recent big moves to the downside, some are arguing that a lot of pessimism about the UK economy (and thus the outlook for BoE monetary policy tightening), is already in the price, limiting the scope for further near-term downside in cable. Meanwhile, subdued FX market trade in the run-up to key US Consumer Price Inflation data at 13:30 BST should not be too surprising. Traders tend to refrain from placing big bets ahead of big, potentially market-moving events.
US inflation data is expected to moderate versus recent months and some are saying this could induce some USD profit-taking as traders scale down the excessiveness of recent hawkish Fed bets. That could offer GBP/USD a modest short-term lift, perhaps back into the 1.2400s. But as political jawboning about the NIP and post-Brexit trade deal from the UK and EU gets louder, this could prevent sterling from making any further substantial gains.
There has been no progress on Wednesday towards an agreement on an embargo of Russian oil imports at a meeting between ambassadors of EU 27 nations, a WSJ reporter wrote on Twitter. According to the reporter, some are beginning to think a EU 27 leaders summit is going to be needed to reach an agreement on this.
Hungary has been the main opponent of a Russian import oil embargo and reports earlier suggested the EU might be considering giving the country financial compensation.
US CPI Overview
Wednesday's US economic docket highlights the release of the critical US consumer inflation figures for April, scheduled later during the early North American session at 12:30 GMT. The headline CPI is anticipated to rise by 0.2% during the reported month, down sharply from the 1.2% rise reported in March, suggesting that inflationary pressures in the world's biggest economy are peaking. The yearly rate is also projected to have decelerated from 8.5% in the previous month to 8.1% in April. Core inflation, which excludes food and energy prices, is expected to rise 0.4% MoM and come in at a 6% YoY rate as compared to 0.3% and 6.5%, respectively, in March.
According to Eren Sengezer, Editor at FXStreet: “coronavirus-related restriction measures and lockdowns in China remained in place throughout the month, suggesting that supply-chain challenges are likely to continue to drive prices higher. In the meantime, consumer demand remains healthy in the US. The strong consumer demand combined with higher input and energy prices in the private sector indicates that inflationary pressures are likely to remain high in the next couple of months.”
How Could it Affect EUR/USD?
The markets seem convinced that the US central bank would need to take more drastic action to bring inflation under control. A stronger than expected CPI print would further boost bets for a more aggressive policy tightening by the Fed and push the US bond yields higher, along with the US dollar. Conversely, a softer reading might do little to ease recession fears, which should continue to benefit the greenback's safe-haven status. Apart from this, concerns that the European economy will suffer the most from the Ukraine crisis suggest that the path of least resistance for the EUR/USD pair is to the downside.
Meanwhile, Eren Sengezer offered a brief technical outlook for the EUR/USD pair: “The Relative Strength Index (RSI) indicator on the four-hour chart rose above 50 early Wednesday, pointing to a bullish tilt in the near term. Additionally, EUR/USD continues to trade above the 20 and 50-period SMAs on the same chart, confirming the view that sellers remain on the sidelines.”
Eren also outlined important levels to trade the major: “On the upside, 1.0600 (psychological level, Fibonacci 23.6% retracement of the latest downtrend) aligns as key resistance. With a four-hour close above that level, further recovery gains toward 1.0630 (100-period SMA) and 1.0660 (Fibonacci 38.2% retracement) could be witnessed. Supports are located at 1.0540 (20-period SMA, 50-period SMA), 1.0500 (psychological level and 1.0470 (multi-year low set on April 26).”
Key Notes
• US April CPI Preview: Has inflation peaked?
• US CPI Preview: Hard core inflation to propel dollar to new highs, and two other scenarios
• EUR/USD Forecast: Euro could break out of weekly channel on US CPI
About the US CPI
The Consumer Price Index released by the US Bureau of Labor Statistics is a measure of price movements by the comparison between the retail prices of a representative shopping basket of goods and services. The purchasing power of USD is dragged down by inflation. The CPI is a key indicator to measure inflation and changes in purchasing trends. Generally speaking, a high reading is seen as positive (or bullish) for the USD, while a low reading is seen as negative (or Bearish).
The EU is ready to suspend its post-Brexit trade deal with the UK if the UK unilaterally revokes the Northern Ireland Protocol (NIP), reported Bloomberg on Wednesday citing an EU official. The EU might also halt talks regarding Gibraltar if the UK acts unilaterally on the Brexit deal, the EU official warned.
NIP talks are in a serious situation, a spokesperson for UK PM Boris Johnson said on Wednesday, adding that whilst the UK prefers a negotiated solution, it reserves the right to take further action if solutions cannot be found urgently.
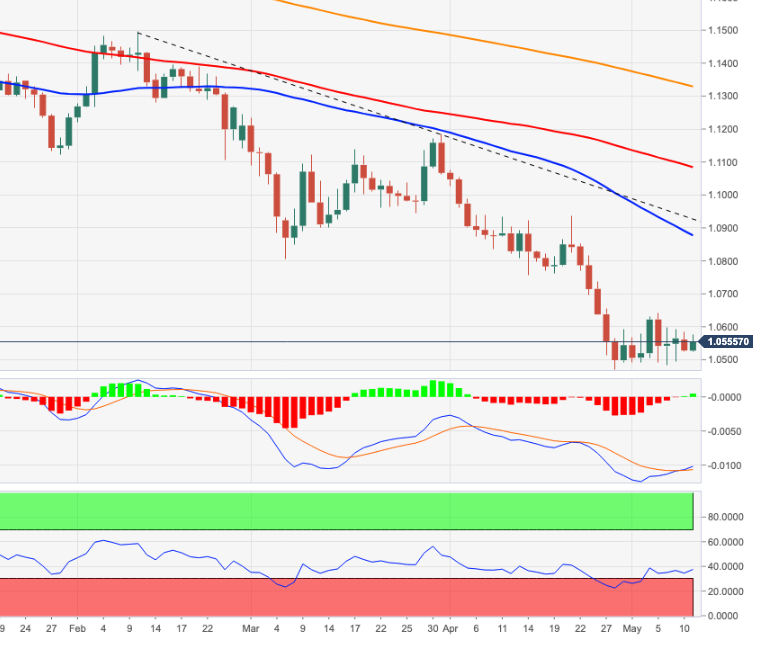
- DXY extends its consolidation in the upper end of the recent range.
- Immediately to the upside comes the 2022 peak near 104.20.
DXY comes under some selling pressure and drops well below the 104.00 mark on Wednesday.
According to the recent price action, the index could face some consolidation in the very near term. The break above this theme could open the door to a visit to the 19-year high at 104.18 (May 9) prior to the round level at 105.00, which precedes 105.63 (December 11 2002 high).
The current bullish stance in the index remains supported by the 8-month line around 97.00, while the longer-term outlook for the dollar is seen constructive while above the 200-day SMA at 96.15.
DXY daily chart
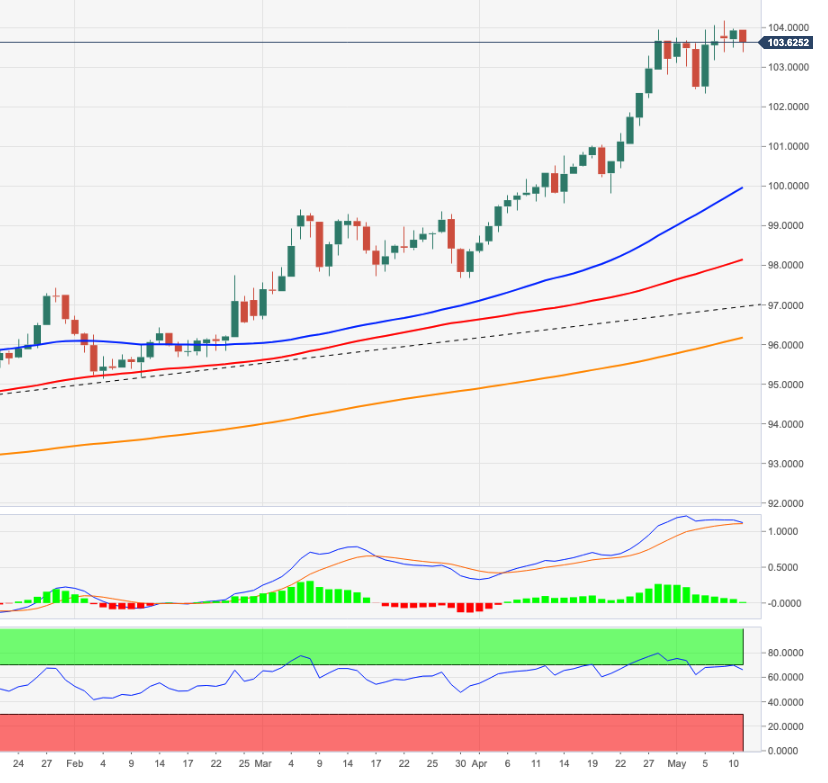
Northern Ireland Protocol (NIP) talks are in a serious situation, a spokesperson for UK PM Boris Johnson said on Wednesday. Whilst the UK prefers a negotiated solution, the spokesperson added, the UK reserves the right to take further action if solutions cannot be found urgently. A definitive timescale on talks would not be helpful, they added.
Separately, the spokesperson said that Johnson urged his ministers to move faster in tackling cost-of-living crisis issues and that the public can expect the government to say more in the days to come on the cost of living crisis.
- EUR/JPY adds to the ongoing bearish leg around 137.00.
- Bullish attempts initially target the 138.30 region.
EUR/JPY extends the weekly decline for the third session in a row and breaks below the 137.00 mark on Wednesday.
The cross, in the meantime, keeps trading within the consolidative theme in place since the beginning of the month. The breakout of this pattern should leave behind the weekly high at 138.31 (high May 9) to allow for a potential visit to the round level at 139.00 ahead of the 2022 high around 140.00 (April 21).
In the meantime, while above the 200-day SMA at 130.98, the outlook for the cross is expected to remain constructive.
EUR/JPY daily chart
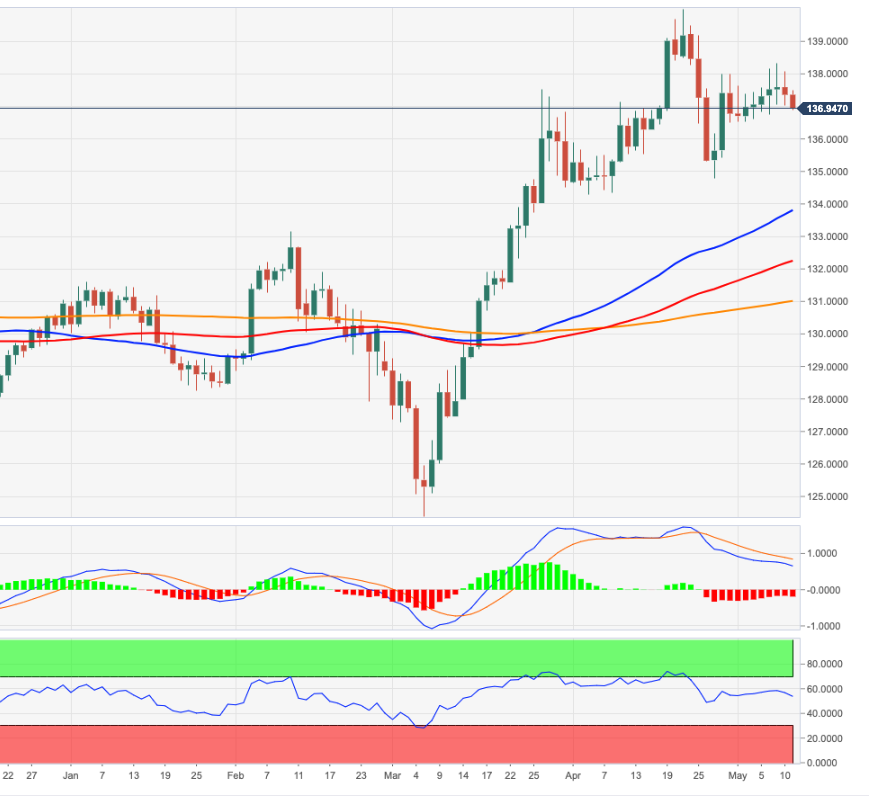
UOB Group’s Senior Economist Julia Goh and Economist Loke Siew Ting, comments on the recent release of the labour market results in Malaysia.
Key Takeaways
“Malaysia’s unemployment rate held steady at 4.1% in Apr after the labour force continued to grow by 35.8k or 0.2% m/m to its record size of 16.44mn (Feb: +36.3k or +0.2% m/m to 16.40mn). Accordingly, the labour force participation rate hit an all-time high of 69.2% (Feb: 69.1%).”
“Similarly, total employment increased further by 38.5k or 0.2% to another new record level of 15.77mn (Feb: +44.8k or +0.3% m/m to 15.73mn). It was again driven by additional hiring in services, manufacturing, and construction sectors, fully offsetting the persistent reduction in employment in both agriculture and mining & quarrying sectors for the 20th straight month.”
“Overall, the labour market has improved for eight straight months, reinforcing our expectations of a sustained recovery through 2022. The country’s transition to endemicity from 1 Apr and upliftment of most COVID containment measures by 15 May are key catalysts for the ongoing economic recovery. However, uncertainty surrounding geopolitical tensions, new coronavirus variants, and intensified business costs suggests that a full labour market recovery back to pre-pandemic levels is unlikely for now. We maintain our year-end jobless rate forecast at 3.6% (end-2021: 4.1%, end2019: 3.3%).”
- USD/CHF corrected sharply on Wednesday and snapped a four-day winning streak.
- Retreating US bond yields prompted some USD profit-taking and exerted pressure.
- The risk-on mood might undermine the safe-haven CHF and limit any further losses.
- The focus remains glued to the release of the latest US consumer inflation figures.
The USD/CHF pair added to its intraday losses and dropped to a fresh daily low, around the 0.9870 area during the first half of the European session.
The pair witnessed heavy selling on Wednesday and snapped a four-day winning streak to its highest level since May 2019, around the 0.9975 touched the previous day. The ongoing retracement slide in the US Treasury bond yields forced traders to lighten their US dollar bullish bets. This, in turn, was seen as a key factor that exerted downward pressure on the USD/CHF pair.
The downside, however, seems limited amid a generally positive tone around the equity markets, which tends to undermine the safe-haven Swiss franc. Apart from this, the prospects for a more aggressive policy tightening by the Fed should help limit the downside for the buck and lend support to the USD/CHF pair, warranting caution before placing fresh bearish bets.
The Fed is widely expected to tighten its monetary policy at a faster pace to combat stubbornly high inflation. In fact, the markets are pricing in a 200 bps rate hike for the rest of 2022 amid concerns that China's zero-covid policy and the war in Ukraine would result in tight global supply chains. This could push already elevated consumer prices even higher.
Hence, the focus will remain glued to the US CPI report, due for release later during the early North American session. The data could influence the Fed's tightening path, which, in turn, would influence the near-term USD price dynamics. Hence, it will be prudent to wait for strong follow-through selling before confirming that the USD/CHF pair has topped out.
Technical levels to watch
- Gold Price rebounds in tandem with risk sentiment, regains $1,850.
- US dollar resumes corrections alongside the Treasury yields.
- XAU/USD remains a ‘sell the bounce’ trade amid Fed’s hawkish outlook.
Gold Price is looking to extend its recovery from three-month lows of $1,836 in the European session, as it recaptures the psychological $1,850 barrier ahead of the critical US inflation data.
The recovery momentum in XAU/USD strengthens, as the US dollar index extends its pullback from above the 104.00 level, undermined by the relief rally seen across the global markets.
Hopes that consumer price inflation will likely peak in the US economy in April are offering a temporary reprieve to the market.
The ongoing retreat in the US Treasury yields from three-year peaks also adds to the weight on the dollar, aiding the Gold Price rebound.
The bright metal also stages a strong comeback after it manages to defend the critical 200-Daily Moving Average (DMA), aligned at $1,836.
Gold Price Technical levels on the daily chart
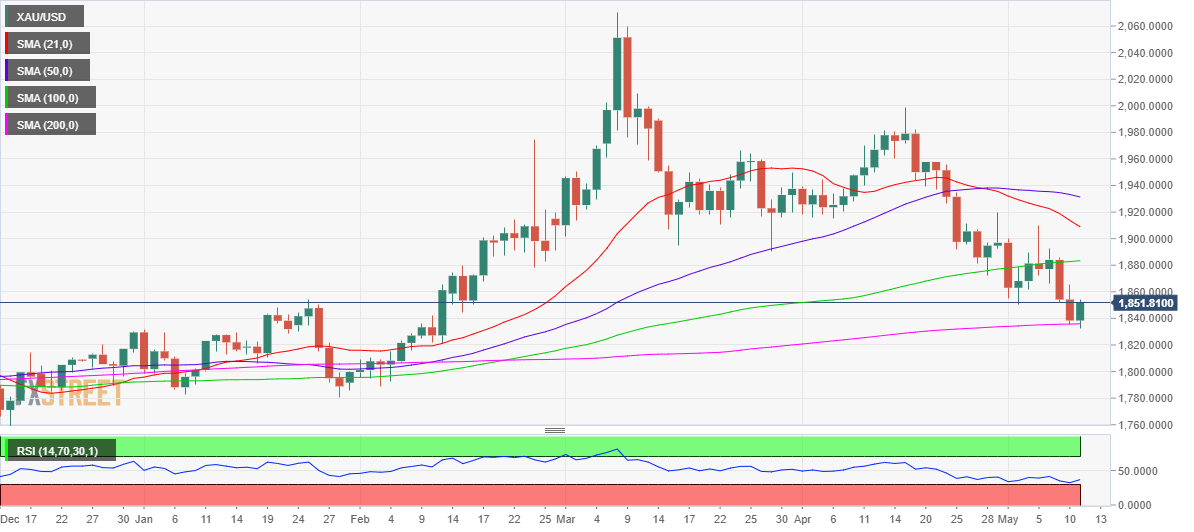
Sellers need a daily closing below the latter to extend the sell-off towards the February 10 lows of $1,822.
The next key support is seen at the $1,800 round figure, below which the February lows at $1,769 will be in focus.
The 14-day Relative Strength Index (RSI) is sitting just above the oversold region, allowing room for more declines.
Also read: Gold Price Forecast: XAU/USD eyes US inflation and daily close below 200-DMA
On the flip side, if gold bulls manage to defend the 200-DMA on a daily closing basis, then a rebound towards the previous week's low of $1,850 will be inevitable.
Further up, gold buyers will aim for Tuesday’s high of $1,865 on their way to the $1,900 mark.
Economist at UOB Group Enrico Tanuwidjaja comments on the latest GDP figures in the Indonesian economy.
Key Takeaways
“The Indonesian economy grew 5.01% y/y in 1Q22, marking a steady start for the year but hardly better than 4Q21’s reading of 5.02%. It was above our forecast of 4.90%. All expenditure components grew except for government consumption, which posted quite a contraction.”
“Household consumption posed fourth straight quarters of positive gains since 2Q21, similarly for investment spending. Since expansionary fiscal policy begun during the start of COVID19 pandemic in 2Q20 and registered strong growth in the next six quarters thereafter, government spending contracted for the first time, marking the start of fiscal consolidation. Exports and imports continue to register double-digits growths in 1Q22, though momentum has slowed to half of that seen in 4Q21.”
“Nevertheless, with upside inflationary pressures posing risks of an all-round recovery in consumer demand, growth momentum is likely to slow in quarters to follow. We keep our GDP growth forecasts of 4.8% for 2022 and 5.0% for 2023.”
- NZD/USD gained positive traction on Wednesday and snapped a four-day losing streak to the YTD low.
- Retreating US bond yields, the risk-on impulse weighed on the safe-haven USD and extended support.
- Aggressive Fed rate hike bets should limit the USD losses and cap the major ahead of the US CPI report.
The NZD/USD pair extended its steady intraday ascent through the first half of the European session and climbed to a fresh daily high, around mid-0.6300s in the last hour.
The pair witnessed a short-covering bounce on Wednesday and for now, seems to have snapped a four-day losing streak to its lowest level since June 2020, around the 0.6275 area touched the previous day. The ongoing retracement slide in the US Treasury bond yields prompted some selling around the US dollar. Apart from this, a strong recovery in the global risk sentiment further undermined the safe-haven buck and extended support to the perceived riskier kiwi.
That said, lingering recession fears - amid tight global supply chains resulting from China's zero-covid policy and the war in Ukraine - acted as a tailwind for the buck. In fact, the markets seem convinced that the Fed would need to tighten its monetary policy at a faster pace to combat stubbornly high inflation and are pricing in a 200 bps rate hike for the rest of 2022. This, in turn, should limit the USD losses and cap the upside for the NZD/USD pair.
Hence, the focus will remain glued to the latest US consumer inflation figures, due for release later during the early North American session. The US CPI report would influence the Fed's tightening path and influence the near-term USD price dynamics. This, along with the broader market risk sentiment should provide a meaningful impetus to the NZD/USD pair and allow traders to grab short-term opportunities.
Technical levels to watch
In its latest research report, economists at Morgan Stanley have slashed India's gross domestic product (GDP) growth forecasts to 7.6% for FY2023 and to 6.7% for FY2024.
Key quotes
"Our global economics team expects global growth to average 2.9% YoY in 2022 slowing from 6.2% growth in CY21. Against this backdrop, we lower our forecasts of India's GDP growth to 7.6% for F2023(from 7.9%) and 6.7% for F2024 (from 7%)."
“Slower global growth, adverse terms of trade shock, and impact on business confidence from geopolitical tensions weigh on the near-term outlook.”
"The government's policy reforms, plus expansion of public infrastructure spending alongside an increase in capacity utilization levels, should help private capex to recover in 6-9 months."
- EUR/USD trades on a positive note and retargets the 1.0600 mark.
- German final CPI rose 7.4% YoY, 0.8% MoM in April.
- ECB’s Lagarde expects the APP to end at some point in Q3.
The single currency regains some composure and lifts EUR/USD back to the 1.0570 region on Wednesday.
EUR/USD up on USD weakness, ECB
EUR/USD resumes the upside and leaves behind Tuesday’s downtick, although the bullish attempt once again bumped against the 1.0570/80 resistance area.
The positive performance of the pair came in response to the renewed weakness in the greenback as well as the persistent hawkish message from ECB speakers. On the latter, Board members Müller and Villeroy continue to lean towards an interest rate hike as soon as this summer, while Chairwoman Lagarde reiterated that the bond-purchase programme is expected to conclude in Q3 and that the central bank will normalize its monetary policy at a gradual pace following the first rate hike.
Speaking about cash markets, the German 10y Bund yields grind lower for the third session in a row and slip back below the 1.00% mark so far on Wednesday. The move echoes the performance of their US and UK peers.
Data wise, German final CPI rose 7.4% YoY and 0.8% MoM in April. Across the pond, weekly Mortgage Applications are due in the first turn seconded by key inflation figures gauged by the CPI for the month of April.
What to look for around EUR
EUR/USD revisits the 1.0570/80 band following the absence of upside traction in the greenback on Wednesday. The outlook for the pair still points to the bearish side, always in response to dollar dynamics, geopolitical concerns and the Fed-ECB divergence. Occasional pockets of strength in the single currency, in the meantime, should appear reinforced by speculation the ECB could raise rates at some point in the summer, while higher German yields, elevated inflation and a decent pace of the economic recovery in the region are also supportive of an improvement in the mood around the euro.
Key events in the euro area this week: Final Germany Inflation Rate, ECB Lagarde (Wednesday) – EMU Industrial Production (Friday).
Eminent issues on the back boiler: Asymmetric economic recovery post-pandemic in the euro area. Speculation of ECB tightening/tapering later in the year. Impact on the region’s economic growth prospects of the war in Ukraine.
EUR/USD levels to watch
So far, spot is gaining 0.43% at 1.0571 and faces the next up barrier at 1.0641 (weekly high May 5) followed by 1.0936 (weekly high April 21) and finally 1.1000 (round level). On the other hand, a break below 1.0470 (2022 low April 28) would target 1.0453 (low January 11 2017) en route to 1.0340 (2017 low January 3 2017).
- AUD/USD capitalizes on the risk-on flows and broad US dollar retreat.
- The aussie tracks the over 1% surge in the S&P 500 futures
- Focus shifts to the US inflation for fresh hints on the Fed’s next policy move.
AUD/USD is trading above 0.7000, staging an impressive recovery from 22-month lows of 0.6911 reached on Tuesday.
In doing so, the aussie is rallying as much as 1% on the day, snapping a four-day losing streak.
The return of risk appetite in the markets combined with the US dollar pullback is boding well for aussie bulls. The better market mood, reflective of the over 1% rise in the S&P 500 futures, is collaborating with the American dollar retreat while aiding the high-beta Australian dollar.
Investors seem to be taking profits on their dollar longs ahead of the critical US inflation data release, which is expected to show inflation peaking in the world’s largest economy. Hot US consumer inflation could prompt the Fed to maintain its outlook on the interest rates.
On the other side, upbeat Chinese inflation is underpinning the sentiment around the aussie, although the data failed to move the needle on the AUD in an immediate reaction. China's April CPI came in at +2.1% YoY vs. prior 1.5%, beating expectations of 1.8%.
The broad market sentiment will continue influencing the aussie ahead of the US inflation release. US President Joe Biden’s speech will be also closely followed.
AUD/USD: Technical levels to consider
Gold came under noticeable pressure again on Tuesday and even dipped briefly to a three-month low of a good $1,830 this morning. Today, investors await the Consumer Price Index (CPI) data from the US. Barring a surprising print, the yellow metal is set to shrug off the release, economists at Commerzbank report.
Gold is continuing to lose the support of financial investors
“Yesterday saw the gold ETFs tracked by Bloomberg register their most pronounced daily outflow to date this year, namely 8.3 tons. Gold is continuing to lose the support of financial investors, in other words.”
“The inflation figures for April will be published in the US today. Like our economists, the Bloomberg consensus expects the inflation momentum to have declined slightly, though this is unlikely to influence the Fed’s monetary policy. In our opinion, the gold price will only be moved by the data if they are significantly surprising and spark a response from the US dollar.”
See – US CPI Preview: Forecasts from 12 major banks, the first decelerating print in a long time
- USD/CAD witnessed fresh selling on Wednesday and was pressured by a combination of factors.
- Rebounding oil prices underpinned the loonie and exerted pressure amid modest USD weakness.
- Aggressive Fed rate hike bets should limit the USD losses and lend support ahead of the US CPI.
The USD/CAD pair weakened further below the 1.3000 psychological mark and dropped to a fresh daily low during the early part of the European session. The pair was last seen trading around the 1.2970-1.2965 region, down over 0.40% for the day.
Following the previous day's good two-way price moves, the USD/CAD pair came under some renewed selling pressure and for now, seems to have snapped a four-day winning streak to the fresh YTD peak. A goodish pickup in crude oil prices underpinned the commodity-linked loonie and exerted downward pressure on spot prices amid modest US dollar weakness.
Crude oil made a solid comeback from a near three-week low amid concerns about tight global supply, led by the war in Ukraine. That said, the bleak outlook for global fuel demand on the back of growing recession risks and strict coronavirus-induced lockdowns in top oil importer - China - should cap gains for the black liquid, at least for the time being.
On the other hand, the ongoing retracement slide, along with strong rally in the equity markets, prompted some selling around the safe-haven USD. This was seen as another factor that acted as a headwind for the USD/CAD pair. That said, the prospects for aggressive policy tightening by the Fed should help limit deeper losses for the greenback.
In fact, the markets seem convinced that the Fed would need to take more drastic action to bring inflation under control and are pricing in a 200 bps rate hike for the rest of 2022. Hence, the focus will remain glued to the latest US consumer inflation figures, due for release later during the early North American session.
The US CPI report could influence the Fed's tightening path, which, along with the broader market risk sentiment, would influence the USD demand. Apart from this, traders will take cues from oil price dynamics to grab short-term opportunities. Nevertheless, the fundamental backdrop supports prospects for the emergence of some dip-buying around the USD/CAD pair.
Technical levels to watch
"What started as a one-off shock has now become a more broad-based phenomenon," European Central Bank (ECB) Governing Council member Bostjan Vasle said on Wednesday, per Reuters. "When the circumstances change, the policy response must follow," the Slovenian central bank Governor added.
Vasle further noted that he is in favour of the ECB taking further and faster action to tame inflation.
Market reaction
The shared currency holds its ground against its major rivals after these comments. As of writing, the EUR/USD pair was up 0.3% on a daily basis at 1.0558.
Further upside in USD/CNH could revisit the 6.8000 level in the next weeks, said FX Strategists at UOB Group Lee Sue Ann and Quek Ser Leang.
Key Quotes
24-hour view: “We highlighted yesterday that ‘conditions are deeply overbought and USD is unlikely to strengthen much further’ and we expected USD to ‘trade between 6.7350 and 6.7800’. USD subsequently traded within a wider range than expected (6.7098/6.7750) before closing at 6.7498 (-0.15%). The price actions appear to be part of a consolidation and we expect USD to trade between 6.7200 and 6.7800 for today.”
Next 1-3 weeks: “We highlighted yesterday (10 May, spot at 6.7620) that solid upward momentum is likely to lead to further USD strength to 6.8000. USD subsequently dropped a couple of pips below our strong support level of 6.7100 (low of 6.7098) before rebounding. Upward momentum has waned somewhat but until there is a clear breach of 6.7100, we still see chance for one more push higher to 6.8000.”
- DXY reverses part of the recent uptrend and retest 103.60.
- US yields look to extend the move lower on Wednesday.
- US Inflation gauged by the CPI will be the salient event later.
The greenback, in terms of the US Dollar Index (DXY), looks offered and trades in the lower end of the range near 103.60 on Wednesday.
US Dollar Index focuses on CPI data
The index loses ground for the first time after four consecutive daily advances midweek amidst the improvement in the risk-linked galaxy and the continuation of the downtrend in US yields.
On the latter, yields in the short end of the curve have returned to the 2.60% area, while the belly has slipped back to the sub-3.00% region and the long end has broken below the 3.10% yardstick.
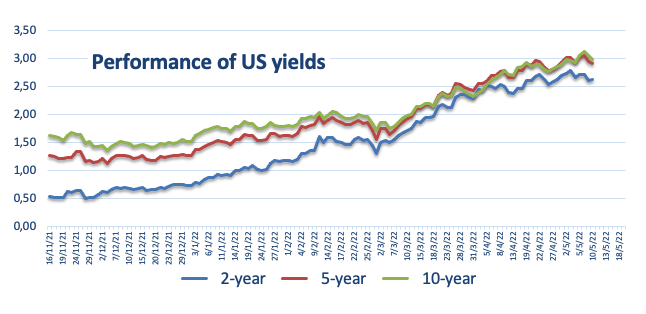
In the meantime, most of FOMC governors fall in line with Chief Powell regarding the likelihood that extra 50 bps rate hikes remain well in store in the next meetings, while a 75 bps rate hike seems to have lost some appeal as of late. All in all, the size of the next interest rate hikes remains data dependent in a context where inflation could have peaked in March/April and the labour market remains tight.
Later in the NA session, MBA Mortgage Applications is due, while all the attention is expected to be on the publication of the Inflation Rate measured by the CPI for the month of April.
What to look for around USD
The dollar sparked a corrective knee-jerk following new highs beyond the 104.00 mark on Monday, as investors’ expectations for a tighter rate path by the Federal Reserve have been nothing but reinforced by the FOMC event last week. The constructive stance in the dollar is also underpinned by the current elevated inflation narrative and the solid health of the labour market as well as bouts of geopolitical tensions and higher US yields.
Key events in the US this week: MBA Mortgage Applications, Inflation/Core Inflation Rate (Wednesday) – Producer Prices, Initial Claims (Thursday) – Flash Consumer Sentiment (Friday).
Eminent issues on the back boiler: Escalating geopolitical effervescence vs. Russia and China. Fed’s rate path this year. US-China trade conflict. Future of Biden’s Build Back Better plan.
US Dollar Index relevant levels
Now, the index is retreating 0.28% at 103.63 and faces immediate contention at 102.35 (low May 5) seconded by 99.81 (weekly low April 21) and then 99.57 (weekly low April 14). On the upside, the breakout of 104.18 (2022 high May 9) would open the door to 105.00 (round level) and finally 105.63 (high December 11 2002).
The lira exchange rate has temporarily stabilised after the government and central bank launched rescue measures. After a brief pause, economists at Commerzbank anticipate the next big move in USD/TRY.
Next big move around the corner
“We think that the significant rise of long-term inflation expectations over the past month, relative to the unchanging central bank rate, has opened the door for the next big decline in coming months. Already there are media reports that state banks and other institutions are having to sell substantial precious FX to prop up the lira – this is never a good sign.”
“We anticipate pressure to return to the exchange rate over the coming two quarters, which will likely create more stress for the financial system and the central bank, ultimately forcing at least an interim reversal via emergency rate hikes.”
“Rate hikes by CBT under the current policy framework will not be credible and the lira will likely establish a renewed depreciation path through 2023. Precisely when and how this policy experiment will be abandoned remains completely unclear.”
EUR/PLN is set to trade sideways from here. Especially during 2022, economists at Commerzbank forecast the 4.70 level.
In 2023, the worst of the inflation impulse is expected to be over
“We see risk that volatility will remain high because of regional geopolitical developments, latest dovish surprise by the central bank, and EU disputes. Our base-case, however, is that EUR/PLN will trade sideways at around the 4.70 level through to year-end.”
“In 2023, we see EUR/PLN gravitate back towards the 4.65 level assuming that the worst of the inflation cycle will come into view by then.”
European Central Bank President Christine Lagarde reiterated on Wednesday that the Asset Purchase Programme (APP) should be concluded early in the third quarter, as reported by Reuters.
"Our inflation projections are increasingly pointing towards inflation being on target over the medium term," Lagarde added. "It looks increasingly unlikely that the disinflationary dynamics of the past decade will return."
Market reaction
The EUR/USD pair continues to trade in positive territory after these comments and was last seen rising 0.25% on a daily basis at 1.0555.
Market participants will pay attention to the release today of the latest US CPI report. Economists at MUFG Bank note that only a soft CPI print could derail the dollar’s appreciation trend.
All eyes on US CPI report
“The US CPI report is expected to reveal that both headline and core inflation dropped back towards 8% and 6.0% respectively in April. Market participants will be scrutinizing closely to see if there are any further encouraging signs that inflation pressures are moving closer to peaking out albeit at very elevated levels.”
“The dollar declined by around -0.3% in the first hour following the release last month of the CPI report for March which showed a softer than expected core inflation reading. Another softer CPI print will be required today to threaten the US dollar’s current bullish trend, and even then it is unlikely to be sufficient on its own to trigger a sustained reversal lower for the US dollar.”
See – US CPI Preview: Forecasts from 12 major banks, the first decelerating print in a long time
- USD/JPY came under fresh selling pressure on Wednesday amid modest USD weakness.
- Retreating US bond yields kept the USD bulls on the defensive and weighed on the pair.
- A positive risk tone, the Fed-BoJ policy divergence to limit losses ahead of the US CPI.
The USD/JPY pair witnessed some selling during the early part of the European session and dropped to a fresh daily low, around the 129.90 area in the last hour.
Following a brief consolidation through the first half of trading on Wednesday, the USD/JPY pair met with a fresh supply and slipped back below the 130.00 psychological mark. The ongoing retracement slide in the US Treasury bond yields weighed on the US dollar, which, in turn, exerted downward pressure on spot prices.
The downside, however, seems limited amid a generally positive tone around the equity markets, which tends to undermine the safe-haven Japanese yen. Apart from this, a big divergence in the monetary policy stance adopted by the Bank of Japan and the Fed should hold back bearish traders from placing aggressive bets around the USD/JPY pair.
The Japanese central bank has vowed to keep its existing ultra-loose policy settings and promised to conduct unlimited bond purchase operations to defend its “near-zero” target for 10-year yields. In contrast, the Fed is widely expected to tighten its monetary policy at a faster pace to combat stubbornly high inflation.
In fact, the markets are pricing in a 200 bps rate hike for the rest of 2022 amid concerns that China's zero-covid policy and the war in Ukraine would result in tight global supply chains and push consumer prices higher. Hence, the focus will remain glued to the US CPI report, due for release later during the early North American session.
Ahead of the key data risk, the US bond yields will continue to play a key role in influencing the USD price dynamics. Apart from this, traders will take cues from the broader market risk sentiment to grab some short-term opportunities around the USD/JPY pair.
Technical levels to watch
The Bank of England (BoE) hiked its policy rate by 25bp but it maintained guidance that further tightening “might” still be appropriate and cut its medium-term inflation forecasts. The bigger picture for the GBP remains challenging, which may not improve anytime soon, in the view of economists at HSBC.
Further decline ahead
“The BoE hiked its policy rate by 25bp to 1.00%. However, we think that the BoE has stuck to its dovish guns in many ways. First, the BoE kept its guidance unchanged. The BoE’s latest forecasts also underline the dovish case. For example, the BoE now forecasts economic contraction of 0.25% in 2023 and cuts its medium-term inflation forecast to just 1.3%, well below its 2% inflation target. These forecasts suggest that the BoE might not be able to deliver the degree of rate hikes priced by the market.”
“We think that the balance of this BoE announcement will continue to weigh on the GBP, and the bigger picture for the currency remains challenging, as domestic and external challenges may not improve anytime soon.
“The domestic outlook appears to be souring, amidst the worsening cost of living squeeze. This, alongside a worsening external picture and potential widening of the current account deficit this year, all points to ongoing GBP weakness.”
Analysts at the Bank of America Global Research examine the seasonality trade for the USD in 2022. They note that the greenback tends to gain on Thursdays and Firdays while it retraces on Wednesdays.
USD is still advancing on Mondays, but even more so at end of the week
"In 2022, the USD is still advancing on Mondays, but even more so at end of the week on Thursdays and Fridays. Cumulative USD return for Thursdays and Fridays are respectively 1.9% and 2.2% in 2022."
"Retracement for the year-to-date USD rally has occurred more on Wednesday, with larger USD retracements during the FOMC Wednesdays. Investors are likely ‘selling-the fact’ on FOMC meetings days, but quickly re-engage with the risk-off USD demand as uncertainty remains elevated."
AUD/USD is attempting to see a sustained break below its two-year lows at 0.6990/66. A weekly close below here would be sufficient to trigger further sustained downside in the medium-term, in the view of analysts at Credit Suisse.
Move below 0.6774/57 to reinforce the downside further
“While we stay wary of a potential bounce back higher to the middle of the recent range, a weekly close below 0.6990/66 would likely mark a major breakout to the downside, leading us to anticipate further sustained weakness in the medium-term.”
“A weekly close below 0.6990/66 support would open up next support at the mid-June 2020 low and the 50% retracement of 2020/21 uptrend at 0.6774/57. A move below here would reinforce the downside further and trigger a move to the 61.8% retracement at 0.6461 in due course.”
Inflation is likely to remain at the 4%-5% range at the end of the year in the eurozone, European Central Bank (ECB) Vice President Luis de Guindos said on Wednesday, as reported by Reuters.
The debt-buying programme, the Asset Purchase Programme (APP), is likely to stop in July, de Guindos further added.
Market reaction
These comments don't seem to be having a significant impact on the shared currency's performance against its major rivals. As of writing, the EUR/USD pair was up 0.25% on a daily basis at 1.0555.
Today's US April CPI release is unlikely to weigh on the dollar unless the monthly figures, with core inflation expected at a still high 0.4%, surprise to the downside. Therefore, the US Dollar Index (DXY) is set to trade in a 103.20-104.00 range, economists at ING report.
Barring a very soft CPI figure, there is no reason for a sharp dollar sell-off
“Headline year-on-year inflation may well be past its peak, helped by base effects and used car prices, yet the focus will still be on the core month-on-month figures. A still high 0.4% MoM core inflation increase is expected today. Unless that surprises at something like 0.2% MoM, we would expect the dollar to stay largely bid – or consolidate near the highs.”
“DXY could trade in a 103.20-104.00 range and barring a very soft CPI figure we see no reason for a sharp dollar sell-off.”
See – US CPI Preview: Forecasts from 12 major banks, the first decelerating print in a long time
USD/CAD has broken above the top of its long-term range at 1.2947/63. However, a weekly close above 1.3020/41 is still needed to confirm the medium-term turn higher, analysts at Credit Suisse report.
USD/CAD to fall back to 1.2445 on failure to break above 1.3020/41
“A weekly close above the 38.2% retracement of the 2020/21 downtrend and the 200-week moving average at 1.3020/41 is still needed to confirm a major breakout to the upside and pave way for a move to the 50% retracement at 1.3334, ahead of the September 2020 high at 1.3420.”
“A failure to break above 1.3020/41 would likely result in a fall back to the bottom of the range at 1.2445.”
Big day for the Czech National Bank. The CNB dove, Ales Michl will likely be the successor to outgoing governor Jiri Rusnok whose term ends in June. This announcement is set to weigh on the koruna, economists at ING report.
A new central bank governor could be announced today
“EUR/CZK volatility looks assured over the next two months as the existing hawks have one last chance to express themselves at the 22 June meeting. Yet, the Czech koruna may remain fragile on a potentially big shift in direction in the second half of this year.”
“Confirmation today that Ales Michl will be the next governor could hit the koruna again.”
European Central Bank (ECB) Governing Council member and German central bank head Joachim Nagel said Wednesday that expectations are rising according to various surveys of households and businesses and worries that "all this suggests that higher inflation rates will prevail in the near future and that inflation expectations could become less anchored".
Nagel reiterated a June end to QE and a rate lift-off in July. He added that he is willing to play ball with the ECB script in making both conditional on incoming data and on new projections, per IFR News.
Market reaction
EUR/USD is on a gradual recovery, currently trading around 1.0550, adding 0.25% on the day. The pair awaits ECB President Christine Lagarde’s speech for the further upside.
Gold slumped to its weakest level in nearly three months at $1,832 early Wednesday. Analysts at Credit Suisse expect XAU/USD to tumble towards the$1,691/77 support zone on a weekly close below $1,828.
Gold on course to test support from its uptrend and 200-day average at $1,838/28
“We look for a fall back to the uptrend from last August and 200-day average at $1,838/28, but with fresh buyers expected here. A weekly close below $1,828 though would warn of a retest of pivotal long-term support at $1,691/77.”
“Above $1,998 is needed to reassert an upward bias for a retest of the $2,070/75 record highs.”
- Sliding US bond yields undermined the USD and assisted gold to gain traction on Wednesday.
- Concerns about softening global growth extended additional support to the safe-haven metal.
- Aggressive Fed rate hike bets could keep a lid on any further gains ahead of the US CPI report.
Gold staged a goodish bounce from a three-month low, around the $1,832 area set earlier this Wednesday and for now, seems to have snapped a two-day losing streak. The XAUUSD climbed to a fresh daily top during the early European session and was last seen trading around the $1,850 level, up nearly 0.50% for the day.
The ongoing retracement slide in the US Treasury bond yields kept the US dollar bulls on the defensive, which, in turn, was seen as a key factor that offered support to the dollar-denominated gold. Apart from this, concerns about softening global growth further underpinned the safe-haven precious metal amid tight global supply chains resulting from China's zero-covid policy and the war in Ukraine.
That said, a combination of factors held back bulls from placing aggressive bets and kept a lid on any further gains for the commodity. A generally positive tone around equity markets, along with the prospects for a more aggressive policy tightening by the Fed, held back traders from placing bulls bets around the non-yielding gold.
The markets seem convinced that the Fed would need to take more drastic action to bring inflation under control and have been pricing in a further 200 bps rate hike for the rest of 2022. This should help limit the USD losses and further contribute to keeping a lid on any runaway rally for gold prices. Investors might also be reluctant to place aggressive bets ahead of the latest US consumer inflation figures, due for release later during the early North American session.
The US CPI report could influence the Fed's tightening path, which, in turn, would influence the USD price dynamics and provide a fresh directional impetus to gold. Hence, it will be prudent to wait for strong follow-through buying before confirming that the XAUUSD has formed a near-term bottom and positioning for any further appreciating move.
Technical levels to watch
EUR/USD continues to move up and down in its tight weekly range above 1.05. In the near-term the pair may trade within a 1.05-1.06 range, but economists at ING note that the 1.05 floor does not look particularly strong.
ECB tightening expectations quite steady
“Market expectations for ECB policy rate changes this year have been quite steady over recent weeks, with 85bp of hikes now priced in. We have a whole host of ECB speakers today, who will probably support that pricing. Yet we doubt EUR/USD derives much support until Fed tightening expectations falter – and that seems unlikely.”
“1.05-1.06 may be the near-term range. But with the EU moving ever closer to a full embargo on Russian energy – with negative implications for European growth – the 1.05 floor in EUR/USD does not look particularly strong.”
- USD/RUB reverses from one-week high after the previous day’s bearish candlestick.
- 10-day EMA also favor the pullback moves targeting monthly low.
- June 2020 lows may offer immediate support, bulls need validation from early April’s bottom.
USD/RUB snaps a three-day rebound, down 1.12% around 69.35, heading into Wednesday’s European session.
In doing so, the ruble (RUB) takes a U-turn from the weekly peak after the previous day’s Doji candlestick formation.
The pullback move also takes place from the 10-day EMA, suggesting further downside of the USD/RUB prices.
However, the bullish MACD signals hint at a bumpy road for the pair bears unless they dominate past the latest swing low, around 64.25. During the fall, lows marked in June 2020, near 68.00, can offer an intermediate halt.
In a case where USD/RUB stays comfortably below 64.25, the early 2020 bottom close to 61.00 should be in focus.
On the contrary, a clear upside break of the 10-day EMA level, at 70.30 by the press time, could keep buyers hopeful.
Though, sustained trading beyond early April’s low of 76.26 could amplify the bull’s confidence.
USD/RUB: Daily chart
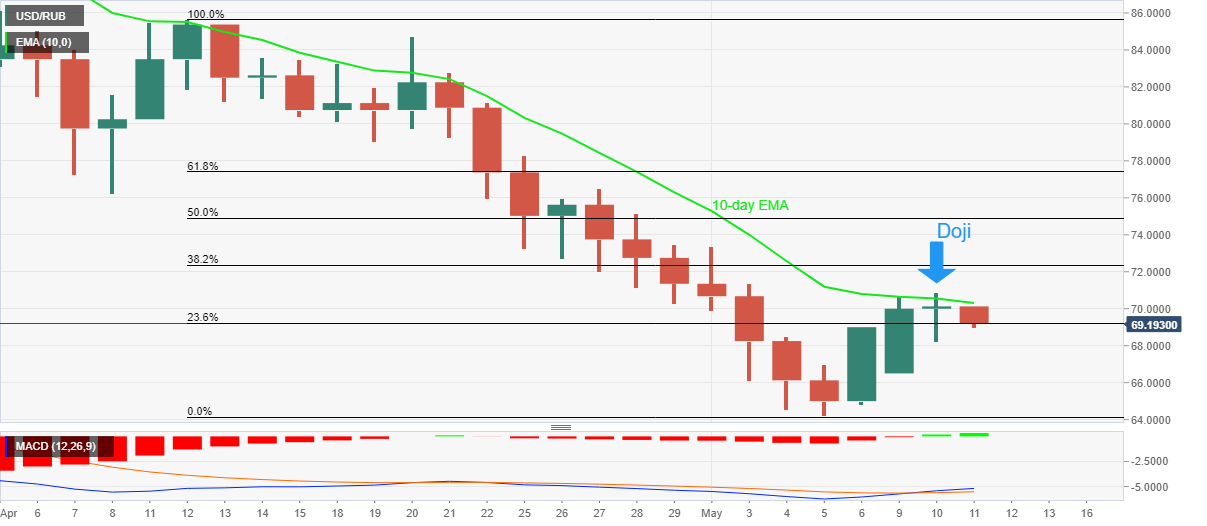
Trend: Further weakness expected
USD/JPY is expected to keep its consolidation unchanged within the 128.40-131.00 range in the next weeks, noted FX Strategists at UOB Group Lee Sue Ann and Quek Ser Leang.
Key Quotes
24-hour view: “Yesterday, we expected the sharp pullback in USD to ‘extend to 129.60’. Our expectations did not materialize as USD dropped to 129.79 before rebounding. Downward pressure has eased and USD is likely to consolidate and trade sideways between 129.80 and 130.70.”
Next 1-3 weeks: “We continue to hold the same view as from yesterday (10 May, spot at 130.10). As highlighted, USD appears to have moved into consolidation phase and is likely to trade between 128.40 and 131.00.”
GBP/USD is consolidating after heavy losses. Economists at ING believe that cable could stage a technical correction towards the 1.25 level.
Expect further EUR/GBP range trading
“A technical correction could see 1.2500 (1.2600/1.2660 looks too far) before the bear trend resumes to drag GBP/USD to 1.20. That certainly looks the direction of travel over coming weeks and months.”
“EUR/GBP is consolidating in a 0.8500-0.8600 range. Expect further range trading, although politics is never far from sterling and could weigh on it at any time. Here UK-EU trade relations seem to be deteriorating again, with Downing Street threatening to unilaterally suspend parts of the Northern Ireland protocol. Doing so could spark an unwelcome trade war.”
Open interest in natural gas futures markets shrank for the fourth consecutive session on Tuesday, this time by around 9.2K contracts according to preliminary readings from CME Group. Volume went down by round 39.6K contracts after three daily builds in a row.
Natural Gas met support near $6.50
Tuesday’s drop and rebound from the $6.50 region in natural gas came amidst shrinking open interest and volume, exposing the continuation of the rebound in the very near term with the next target of note at the so far 2022 high around the $9.00 mark per MMBtu (May 6).
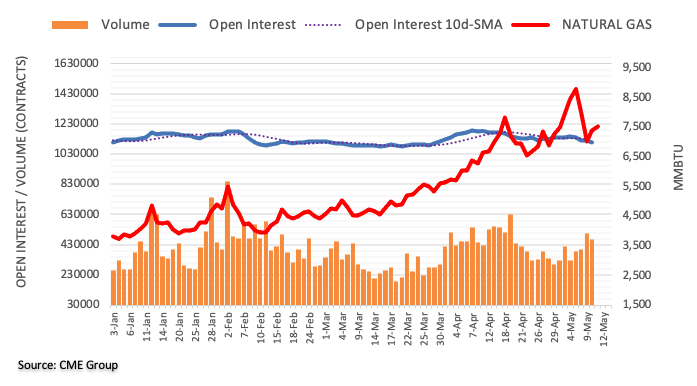
The European Union (EU) Commissioner for Trade and Executive Vice President Valdis Dombrovskis said that he still believed that the member nations could reach an agreement on the sixth package of the bloc’s sanctions against Russia, including a ban on oil.
Bulgaria and several other EU member states have opposed the embargo on Russian oil imports.
Key quotes
"With the first five packages [of sanctions against Russia] not all the decisions were taken immediately ... but at the end of the day all member states were able to agree and we do hope that this is going to be the case now."
"By putting sanctions on hydrocarbons, we are really getting to the heart of Kremlin's war machine financing.”
Market reaction
EUR/USD is keeping its range around 1.0540, adding 0.16% on the day.
Here is what you need to know on Wednesday, May 11:
The positive shift witnessed in risk mood mid-week makes it difficult for the greenback to continue outperforming its rivals. As investors await the Consumer Price Index (CPI) data from the US, which is expected to decline to 8.1% on a yearly basis in April from 8.5% in March, the US Dollar Index stays relatively quiet below 104.00. Market participants will also continue to pay close attention to comments from central bankers, including European Central bank Christine Lagarde, throughout the day.
US CPI Preview: Hard core inflation to propel dollar to new highs, and two other scenarios.
On Tuesday, US President Joe Biden said that the Federal Reserve is focused on taming inflation and added that his administration was considering eliminating Trump-era tariffs on Chinese imports to lower prices. "No decision has been made on it," Biden further noted. The Shanghai Composite Index rose more than 1% on a daily basis on this headline. The S&P 500 Index closed in positive territory on Tuesday but the Dow Jones Industrial Average and the Nasdaq Composite indexes registered losses. Early Wednesday, US stock index futures post modest gains. The data from China showed that the annual CPI jumped to 2.1% in April, compared to the market expectation of 1.8%.
US April CPI Preview: Has inflation peaked?
Meanwhile, the benchmark 10-year US Treasury bond yield fell for the second straight day on Tuesday and continues to push lower below 3% early Wednesday. Cleveland Fed President Loretta Mester said on Tuesday that the Fed will have to see what's more needed after hiking the policy rate by 50 basis points in June and July.
EUR/USD continues to move up and down in its tight weekly range above 1.0500 early Wednesday. European Central Bank (ECB) Governing Council member Francois Villeroy de Galhau told France Inter radio on Wednesday that the illusion of a limitless and costless debt was very attractive but also very dangerous.
GBP/USD closed flat above 1.2300 on Tuesday and posts small gains at around 1.2350 in the European session. In a recently published report, the UK's National Institute of Economic and Social Research (NIESR) said that the Bank of England needs to raise the policy rate to 2.5% next year to be able to battle inflation.
Gold slumped to its weakest level in nearly three months at $1,832 early Wednesday. Despite falling US Treasury bond yields, the yellow metal continues to have a tough time finding demand. XAU/USD is trading modestly higher on the day at around $1,845 n the European morning.
USD/JPY stays directionless above 130.000 for the fourth straight trading day on Thursday. Japan's Chief Cabinet Secretary Hirokazu Matsuno said earlier in the day that the government must respect the Bank of Japan's (BOJ) jurisdiction in setting the monetary policy.
Following Monday's sharp decline, Bitcoin rebounded modestly on Tuesday but failed to gather bullish momentum. At the time of press, BTC/USD was down more than 1% on the day at $30,600. Ethereum rose more than 5% on Tuesday but reversed its course early Wednesday. ETH/USD was last seen losing 1.3% at $2,300.
EUR/CHF is threatening to break higher. The pair is now attempting to challenge the 200-day moving average (DMA) at 1.0498, but analysts at Credit Suisse expect this level to cap to prevent further sustained upside.
Sustained move above 1.0498 to open up the 2022 high at 1.0612
“Although weekly MACD momentum is turning higher and the 55-DMA is also rising, we look for the 1.0498 level to hold into the weekly close for a fall back lower again to 1.0402 at first, before ideally moving back to the late April low at 1.0188/87.”
“A sustained move above 1.0498 would raise a big question mark over the validity of the current downtrend and see scope to move to the 2022 high at 1.0612 next. If reached, we would expect this level to serve as a solid ceiling for a potentially broader 1.06 to parity range.”
- GBP/USD gained some positive traction on Wednesday amid modest USD downtick.
- Retreating US bond yields and a positive risk tone undermined the safe-haven buck.
- Fed rate hike bets should limit the USD losses and cap the pair ahead of the US CPI.
The GBP/USD pair traded with a mild positive bias through the early European session and was last seen hovering near the daily high, just below mid-1.2300s.
The ongoing retracement slide in the US Treasury bond yields, along with a generally positive tone around the equity markets, undermined the safe-haven US dollar. This, in turn, was seen as a key factor that assisted the GBP/USD pair to attract some buying near the 1.2300 mark on Wednesday. That said, any meaningful upside still seems elusive, warranting caution before placing intraday bullish bets.
The UK economic think-tank, National Institute of Economic and Social Research (NIESR), said that Britain is on course to enter a technical recession in the second half of 2022. The NIESR now forecasts that the UK GDP will contract 0.2% in Q3 and 0.4% in the last three months of the year. This comes on the back of the Bank of England's gloomy outlook, which should act as a headwind for the British pound.
Apart from this, expectations that the Fed would need to take more drastic action to bring inflation under control should limit the USD losses and further contribute to capping the GBP/USD pair. In fact, the markets are still pricing in a further 200 bps rate hike for the rest of 2022 amid worries about tight global supply chains resulting from China's zero-covid policy and the ongoing war in Ukraine.
Hence, the focus will remain glued to the release of the latest US consumer inflation figures, due later during the early North American session. The US CPI report could indicate how aggressively the Fed would tighten its monetary policy. This, in turn, would influence the near-term USD price dynamics and provide a fresh directional impetus to the GBP/USD pair.
Technical levels to watch
So far, the gas pipelines that transport Russian gas through Ukraine to Central and Western Europe are working despite the war. That might change now. The euro is set to continue under pressure amid a potential energy crisis, economists at Commerzbank report.
Prospect of a possible energy crisis in the eurozone alive
“The suspicion arises that the Russian side wants to illustrate the risks for the gas supply to Europe more clearly than technically is necessary. None of these are earth-shattering announcements, but they keep the prospect of a possible energy crisis in the eurozone alive.”
“Under these circumstances, it can be assumed that the risk premium for an energy crisis in the eurozone, that is currently putting pressure on the EUR exchange rates, will be with us for some time to come.”
In opinion of FX Strategists at UOB Group Lee Sue Ann and Quek Ser Leang, further downside in AUD/USD could retest the 0.6900 region ahead of 0.6870 in the next weeks.
Key Quotes
24-hour view: “We expected AUD to ‘weaken to 0.6900’ yesterday. Our expectations did not materialize as it dipped to 0.6911 before rebounding slightly. While downward momentum has waned, we still see room for AUD to weaken to 0.6900. The next support at 0.6870 is unlikely to come under threat. Resistance is at 0.6960 followed by 0.6985.”
Next 1-3 weeks: “Our update from yesterday (10 May, spot at 0.6945) still stands. As highlighted, AUD is still weak. The next support is at 0.6900 followed by 0.6870. Overall, only a breach of 0.7030 (‘strong resistance’ level was at 0.7050 yesterday) would indicate that the current weakness has stabilized.”
FX option expiries for May 11 NY cut at 10:00 Eastern Time, via DTCC, can be found below.
- EUR/USD: EUR amounts
- 1.0500 342m
- USD/JPY: USD amounts
- 130.00 500m
- USD/CAD: USD amounts
- 1.2770 1.4b
- 1.2790 1.1b
- AUD/JPY has turned sideways as the FX domain is awaiting the US inflation.
- A broader risk-off impulse has underpinned yen against aussie.
- China’s CPI has increased to 2.1% while PPI is elevated to 8%.
The AUD/JPY pair is oscillating in a range of 90.33-90.80 despite the fact that the Australian Westpac Consumer Confidence has dropped sharply in the Asian session. The cross is trading lackluster from the previous trading session as the FX domain is awaiting the release of the US inflation.
It is worth noting that the Australian Westpac Consumer Confidence has dropped consecutively for the sixth time. The catalyst is landed at -5.6% significantly lower than the former figure of -0.9%. A continuous plunge in the confidence of the individuals may weigh some pressure on the aussie dollar. Meanwhile, the elevation in China’s Consumer Price Index (CPI) has also failed to impact the antipodean. China’s yearly inflation has landed at 2.1%, higher than the forecasts of 1.7%. Also, the Producer Price Index (PPI) remained higher at 8% against the estimates of 7.7%.
Meanwhile, a broader risk-off impulse in the market has underpinned the Japanese yen lately. Investors have started pouring funds into yen in the context of a value bet. Although the Bank of Japan (BOJ) will stick with its ultra-loose monetary policy as the Japanese economy has failed to reach the growth rate recorded in its pre-pandemic era. The falling yen will continue to attract funds due to higher exports and corporate may continue to report higher earnings.
- Market sentiment improves amid hopes of softer US inflation, mixed Fedspeak.
- US Treasury yields remain sidelined, pressured after stepping back from 20-year high.
- S&P 500 Futures, Euro Stoxx 50 Futures extend previous day’s rebound from yearly low.
- US CPI ex Food & Energy appears crucial amid chatters over 75 bps rate hike.
Global markets portray a typical pre-data consolidation, with softer yields and firmer stock futures, as traders await US Consumer Price Index (CPI) data heading into Wednesday’s European session. The cautious optimism takes clues from expectations of easing inflation pressure in the US, as well as headlines from China, amid mixed comments from the Fed speakers.
That said, the US 10-year Treasury yields print a three-day downtrend by shedding 2.5 basis points (bps) to 2.966% by the press time. It’s worth noting that the key bond yields refreshed a 20-year high on Monday before reversing from 3.20%.
Also portraying a mildly positive mood are the gains of stock futures from the US and Europe. The S&P 500 Futures and Euro Stoxx 50 Futures extend the previous day’s recoveries from the year and a two-month low in that order. With this, the S&P 500 Futures add 16.75 points, or 0.42% to regain the 4,012 level whereas the Euro Stoxx 50 Futures rise 1.0%, or 35 points, to 3,563 by the press time.
Comments from Atlanta Fed President Raphael Bostic, crossed wires during the early Asian session, initially favored a risk-on mood as he mentioned that the US economy is strong and demand is high while also expecting the neutral rate at 2.0-2.5%. Even so, Cleveland Fed President and FOMC member Loretta Mester keep the market bears hopeful as she said that the Fed doesn't rule out a 75 basis points rate hike forever.
On the other hand, ECB policymakers refrained from reiterating the July rate hike concerns during their latest comments. Among them are European Central Bank (ECB) policymaker Madis Muller and ECB Governing Council member, as well as Bank of France's head, Francois Villeroy de Galhau.
Also favoring the prices could be headlines from Shanghai local authorities that mentioned no virus spread in eight districts.
However, China’s strict “Zero Covid Tolerance” policy and fears of further escalation in the Russia-Ukraine crisis join central bankers’ rush towards tighter monetary policies to favor bears.
Hence, trades take solace ahead of a likely risk-positive print of the US CPI, expected to ease to 8.1% from 8.5%. However, a major focus will be on the US Consumer Price Index ex Food & Energy figures which are likely to ease to 6.0% YoY versus 6.5% prior. Should the inflation figures refrain from easing for April, the US Treasury yields could take the US dollar with it to refresh multi-day high while equities and commodities may reverse recent gains.
Read: US April CPI Preview: Has inflation peaked?
GBP/USD has seen a further sharp fall to the June 2020 low at 1.2251. Economists at Credit Suisse expect the pair to extend its decline towards the 1.2072/1.2017 support zone and even lower.
Resistance at 1.2637 set to cap
“Whilst some near-term consolidation is expected at the June 2020 low at 1.2251, we look for a break in due course for a fall to what we look to be stronger support at the 61.8% retracement and May 2020 low at 1.2072/1.2017.”
“Should the 1.2072/1.2017 also fail, this would be seen to expose much more important support at the 2020 low and the potential uptrend from the 1985 low at 1.1467/1.1409.”
“Resistance at 1.2637 ideally still caps. Above can see a corrective recovery back to 1.2973/81.”
Economists at Credit Suisse think the Reserve Bank of India (RBI) will defend the 78.00 level in USD/INR in the short-term. Nevertheless, once the 78 level breaks, a new USD/INR trading range of 77-80 is expected.
Strong Indian consumption and imports to put weakening pressure on the rupee
“In the short term, we think the RBI will defend the 78.00 level in USD/INR, but once that breaks (likely in the next four weeks) we expect a new USD/INR trading range of 77-80.”
“Over time we think strong Indian consumption and imports will continue to put weakening pressure on the rupee, while the RBI’s ‘permitted’ USD/INR trading range (currently 76-78) will shift higher.”
“We think the RBI will continue accumulating reserves, and will limit INR strength to 76.00.”
NZD/USD is back above 0.63. As economists at ANZ Bank note, US CPI data represents major event risk, with a hot print to trigger a wave of risk aversion, weighing on the kiwi.
US CPI data poses binary risks
“NZ considerations are being all but ignored by markets and this is the USD show, and it’s benefiting from a flight-to-safety bid amid softness in commodities and risk assets.”
“US CPI data poses binary risks. While a softer result (as the street is expecting) will be mildly relieving, a rise in inflation has potential to trigger another wave of risk aversion (likely at the expense of the kiwi).”
“Support 0.5940/0.6230 Resistance 0.6465/0.6545/0.6700”
See – US CPI Preview: Forecasts from 12 major banks, the first decelerating print in a long time
CME Group’s flash data for crude oil futures markets noted traders added almost 4K contracts to their open interest positions on Tuesday, reversing at the same time two consecutive daily pullbacks. In the same line, volume extended the uptrend, this time by around 51.3K contracts.
WTI: Initial support comes near $95.30
Tuesday’s moderate retracement in prices of the barrel of the WTI was in tandem with increasing open interest and volume, exposing the continuation of the downtrend in the very near term and with the next down barrier at the weekly low at $95.34 (April 25).
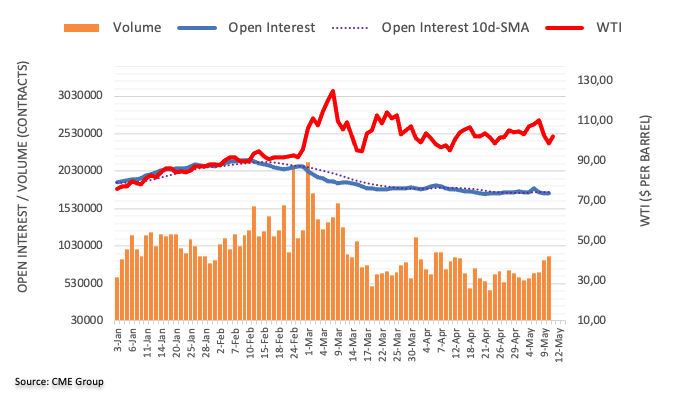
EUR/USD continues to hold long-term channel support at 1.0485. Still, the broader risk stays seen lower, economists at Credit Suisse report.
EUR/USD to suffer an eventual fall to parity
“Our bias is to look for a consolidation phase at the lower end of the broad potential downtrend channel from 2016 at 1.0485, but with this seen as a temporary pause only ahead of a resumption of the core downtrend in due course to test the 1.0341 low of 2016.”
“Big picture, we look for an eventual fall to parity.”
“Resistance is seen at 1.0642 initially, above which can see a recovery back to 1.0760/1.0860, but with this ideally capping.”
The illusion of a limitless and costless debt is attractive but "very dangerous,” European Central Bank (ECB) Governing Council member and Bank of France head Francois Villeroy de Galhau told France Inter radio on Wednesday.
Additional quotes
War in Ukraine is a "negative shock" for the French economy.
French economy resists on employment and activity fronts but inflation is very high.
Inflation is main worry of companies and citizens.
Inflation should stay high the whole year.
Inflation should be back at around 2% in 2024.
Interest rates will be raised gradually.
ECB will start raising rates this summer.
Market reaction
Despite the hawkish ECB-speak, EUR/USD remains capped below 1.0550. The pair is currently trading at 1.0539, up 0.13% on the day.
European Central Bank (ECB) policymaker Madis Muller said Wednesday that the central bank “could outline future rate expectations already at June policy meeting.”
Additional comments
APP should end early July or a few weeks earlier; rate hike must not be far behind.
Current ECB policy inappropriately easy given high inflation.
Appropriate to raise rates into positive territory by year end; moves by 25 bps increments appropriate.
Rise in spreads consistent with changed ECB policy outlook.
Details of spread fighting tool may not need to be announced in advance; tool should be tailored to specific situation.
Market reaction
EUR/USD is unfazed by the above comments, currently trading 0.18% higher on the day at 1.0542.
- EUR/USD picks up bids inside a fortnight-old trading range, weekly symmetrical triangle.
- Clear break of three-week-old descending trend line, firmer RSI adds strength to the recovery moves.
- 100-SMA offers an extra challenge to buyers before giving them control.
EUR/USD extends the early Asian session rebound towards poking the 1.0550 mark as European traders brace for Wednesday’s bell.
The major currency pair’s latest recovery could be linked to the U-turn from the previous resistance line stretched from April 21. Also keeping buyers hopeful is the recently firmer RSI (14) line.
It should be noted, however, that a one-week-long symmetrical triangle restricts short-term EUR/USD moves between 1.0565 and 1.0520.
Hence, the latest upside momentum eyes the triangle’s resistance line, namely around 1.0565, a break of which could direct buyers towards the 100-SMA level, near 1.0630 at the latest.
Even if the quote rises past 1.0630, the current month high around 1.0640-45 will act as an additional filter to the north before confirming the advances targeting the 1.0700 region.
On the contrary, a downside of the stated triangle’s support, around 1.0520, will be challenged by the resistance-turned-support line, close to 1.0515 at the latest.
Should the quote drop below 1.0515, the 1.0500 and April’s low near 1.0470 will lure the EUR/USD bears.
EUR/USD: Four-hour chart
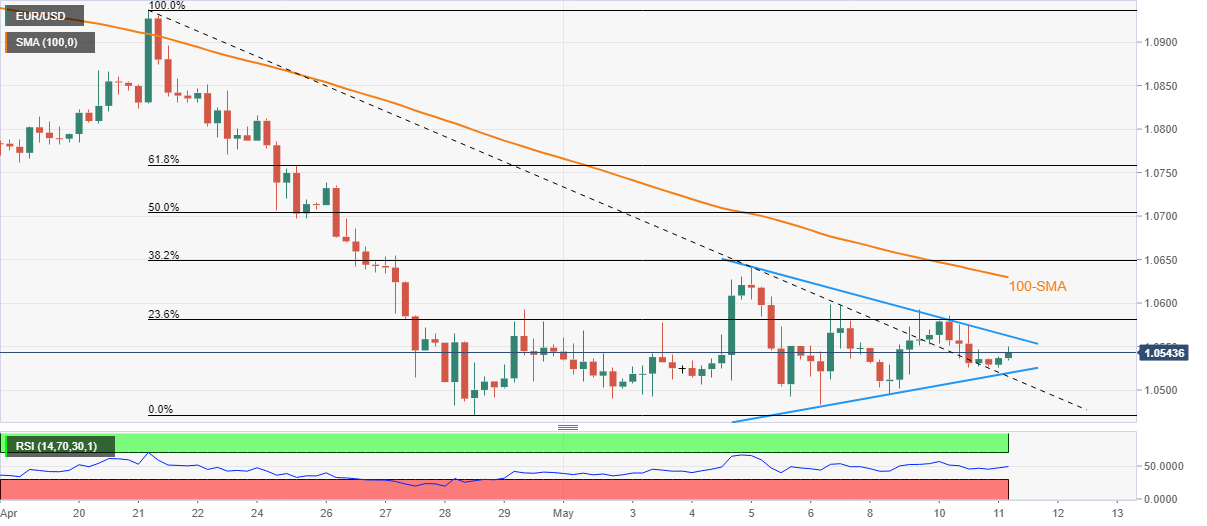
Trend: Further recovery expected
Gold Price is meandering near three-month lows. XAU/USD eyes US inflation and daily close below 200-Daily Moving Average (DMA) at $1,836, FXStreet’s Dhwani Mehta reports.
Signs of inflation peaking in the US to save the day for gold bulls
“US Consumer Price Index (CPI) data for April is seen easing to 8.1% YoY in April vs. 8.5% booked in March. The core CPI is also expected to soften, on an annualized basis, to 6%. Any signs of inflation peaking in the US economy are likely to temper Fed’s hawkish expectations, which could save the day for gold bulls. On the other hand, hotter than expected US inflation readings will push for aggressive Fed rate hikes, supporting the case for a 75 bps June lift-off at gold’s expense.”
“Sellers need a daily closing below the 200-DMA at $1,836 to extend the sell-off towards the February 10 lows of $1,822. The next key support is seen at the $1,800 round figure, below which the February lows at $1,769 will be in focus.”
“If gold bulls manage to defend the 200-DMA on a daily closing basis, then a rebound towards the previous week low of $1,850 will be inevitable. Further up, gold buyers will aim for Tuesday’s high of $1,865 on their way to the $1,900 mark.”
See – US CPI Preview: Forecasts from 12 major banks, the first decelerating print in a long time
USD/CNY maintains its advance. A sustained break above 6.7434 is set to further solidify the uptrend, economists at Credit Suisse report.
USD/CNY to remain within its broad 7.20 to 6.20 range on a long-term 1-3 year perspective
“USD/CNY is attempting to break above the 200-week moving average as well as the 50% retracement of the 2019/22 downtrend at 6.7335/7434. With the moving averages and the weekly MACD momentum remaining clearly supportive, we expect this zone to be eventually broken, solidifying the current uptrend and seeing scope to reach the 61.8% retracement at 6.8475 next.”
“On a long-term 1-3 year perspective, we expect the USD/CNY to remain within its broad 7.20 to 6.20 range and oscillate around the completely flat 20-week average.”
Tentative slowdown in housing prices could be an excuse for the Reserve Bank of Australia (RBA) to push back against priced-in tightening. Subsequently, risks are skewed to the downside for the aussie, economists at Credit Suisse report.
Burning down the house
“The Australian housing market, with its high reliance on variable rate mortgage borrowing, stands out as more exposed than peers to rising yields. While this aspect is still far from central to the FX investor mindset, we see scope for it to become much more relevant if sudden sharp declines in housing activity were to call back into question the RBA’s willingness to hike.”
“We retain a bearish AUD/USD target of 0.69, with risks skewed towards the lower end of our target range at 0.6750.”
- USD/CHF pulls back from the highest levels in two years, snap four-day uptrend.
- Rising wedge, bearish MACD signals keep sellers hopeful.
- Bulls may aim for the late 2019 peak during further upside.
USD/CHF takes offers to refresh intraday low around 0.9940, down 0.21% on a day, as the Swiss currency (CHF) pair takes a U-turn from the highest levels since November 2019 during early Wednesday.
The pair’s latest pullback takes clues from the MACD signals. However, the USD/CHF prices remain inside a short-term rising wedge bearish chart pattern and hence a confirmation becomes necessary for the further downside bias.
As a result, the 0.9930 level appears crucial for the pair sellers to watch. Also acting as a downside filter is the 100-HMA level of 0.9891.
In a case where USD/CHF remains pressured below 0.9891, the theoretical target of around 0.9780 will gain the market’s attention.
Meanwhile, recovery remains elusive until the quote stays below the 0.9985 level comprising the aforementioned wedge’s resistance line.
Should the USD/CHF bulls manage to cross the 0.9985 hurdle, the odds of the pair’s rally towards the 1.0000 psychological magnet and November 2019 peak of 1.0023 can’t be ruled out.
USD/CHF: Hourly chart
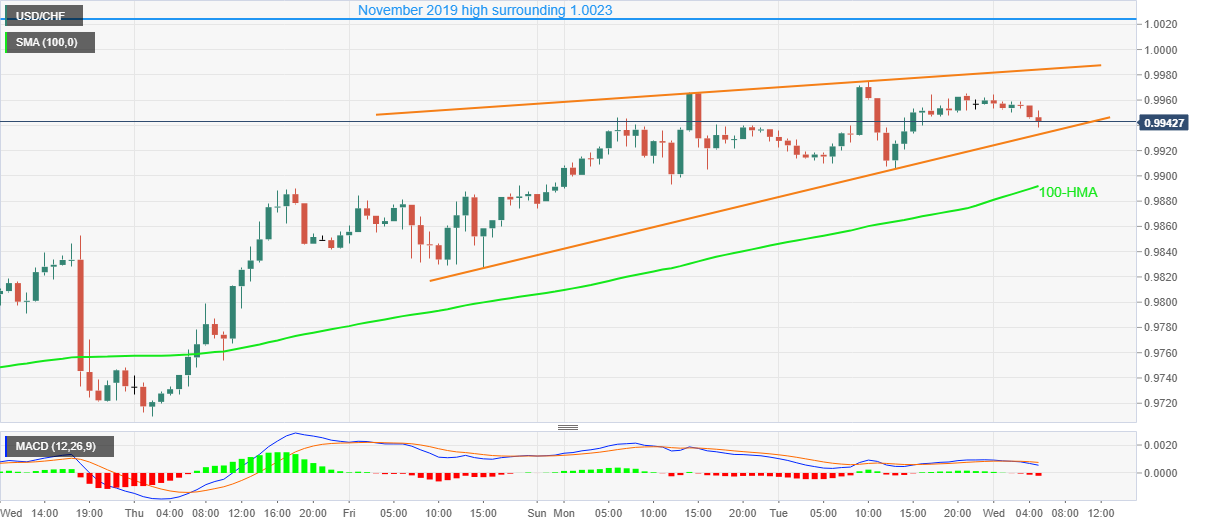
Trend: Pullback expected
- EUR/GBP is hovering around 0.8550 ahead of ECB Lagarde’s speech and Germany’s HICP.
- Investors may find insights about APP conclusions and growth forecasts.
- Germany’s HICP is seen at 7.8, in line with the prior figures.
The EUR/GBP pair is trading back and forth in a narrow range of 0.8535-0.8578 in the Asian session. Investors are focusing on the speech from European Central Bank (ECB)’s Christine Lagarde, which is due in the European interval.
The speech from ECB’s Lagarde is expected to dictate over concluding the Asset Purchase Program (APP), which is likely to kick-start from the third quarter of this year. ECB policymaker in her last monetary policy announcement stated that a rate hike is not on the list till the APP gets terminated. Apart from the APP, ECB’s Lagarde could dictate the growth forecasts, which have surely been trimmed after the Ukraine crisis. The ongoing discussion of an embargo on Russian oil by Europe is gaining momentum. However, the announcement of an embargo could have multiplier effects on employment and other related catalysts.
Apart from Lagarde’s speech, investors will also keep Germany’s HICP on the radar. The yearly HICP is expected to land at 7.8%, in line with the prior figure. A higher-than-expected figure could weaken the euro bulls.
On the pound front, the delay in decision-making over the Northern Ireland Protocol (NIP) is weighing pressure on sterling. The spokesperson from the UK administration said Johnson urged them to deliver for the people of Northern Ireland. "We want to fix some of the underlying challenges" regarding the NIP, the spokesperson added.
- Copper picks up bids as market sentiment improves during pre-CPI inaction.
- China’s inflation numbers, announcements from Shanghai also underpin metal’s rebound.
- USD eases on softer yields, mixed Fedspeak ahead of expectedly soft US CPI.
Having paused the bearish trajectory the previous day, copper prices improve during early Wednesday amid hopes of softer US inflation, as well as improvement in the covid conditions of its largest customer China. Also favoring the metal’s price rebound are the softer US Treasury yields and the US dollar, as well as mildly bid equities.
That said, the benchmark three-month copper on the London Metal Exchange (LME) gains over 1.0% with the latest price being $9,330. Also, the most active June copper futures contract on Shanghai Futures Exchange (SFE) rises around 0.40% to 71,650 yuan (Approximately $10,660).
Headlines from Shanghai local authorities that mentioned no virus spread in eight districts and firmer inflation numbers from the dragon nation seem to help the red metal pick up bids. That said, China’s Consumer Price Index (CPI) rose past the 1.8% market consensus to 2.1% YoY whereas the Producer Price Index (PPI) crossed 7.7% expectations with the 8.0% yearly.
Mixed comments from Federal Reserve policymakers and downbeat US inflation expectations, as per the 10-year breakeven inflation rate per the St. Louis Federal Reserve (FRED) data, weigh on the US dollar and offer additional strength to the copper prices.
That said, the US 10-year Treasury yields and the US Dollar Index (DXY) remain pressured at around 2.99% whereas the S&P 500 Futures print mild gains near the 4,000 level after a mixed closing on Wall Street.
Furthermore, worker strikes in Peru’s one of the key copper mines also keep the metal buyers hopeful. “Peru's government on Tuesday failed to reach an agreement with a group of indigenous communities whose protests have halted operations at MMG Ltd's massive Las Bambas copper mine,” per Reuters.
Alternatively, the market’s inflation fears ahead of the US Consumer Price Index (CPI) figure, expected to ease to 8.1% YoY from 8.5% prior, join the overall hawkish approach of major central banks and likely negative impacts of the same on the growth weigh on copper.
Further, China’s covid conditions are grim and hence test the metal prices due to Beijing’s status as the world’s largest industrial player. “China's April copper cathode output fell on both a monthly and annual basis, state-backed research house Antaike said on Tuesday, as maintenance and the COVID-19 outbreak in the country curbed smelters from producing more metal,” said Reuters.
To sum up, copper’s latest rebound has more negatives to face ahead and a disappointment from the US inflation could be all to recall the metal bears.
Read: US April CPI Preview: Has inflation peaked?
GBP/USD could still grind lower and revisit the 1.2200 zone in the next weeks, suggested FX Strategists at UOB Group Lee Sue Ann and Quek Ser Leang.
Key Quotes
24-hour view: “We highlighted yesterday that ‘the movement is likely part of a consolidation and we expect GBP to trade between 1.2280 and 1.2410’. While our view for consolidation was not wrong, GBP traded within a narrower range than expected (1.2292/1.2375). The underlying tone has weakened a tad and GBP could edge lower from here. That said, the chance for a break of the major support at 1.2250 is not high for now (minor support is at 1.2280). Resistance is at 1.2345 followed by 1.2385.”
Next 1-3 weeks: “There is not much to add to our update from yesterday (10 May, spot at 1.2325). As highlighted, while the risk is still on the downside, GBP GBP has to break clearly below 1.2250 before a move to 1.2200 is likely. On the upside, a breach of 1.2420 (‘strong resistance’ level was at 1.2450 yesterday) would indicate that GBP is not ready to break 1.2250.”
Considering advanced prints from CME Group for gold futures markets, open interest reversed two consecutive daily pullbacks and rose by nearly 22K contracts on Tuesday. Volume followed suit and extended the uptrend for the fourth straight session, this time by around 66.6K contracts.
Gold now looks to $1800
The moderate weekly decline in gold prices was on the back of rising open interest and volume on Wednesday. That said, extra retracements appear on the cards in the very near term and with the immediate target at the key $1800 mark per ounce troy.
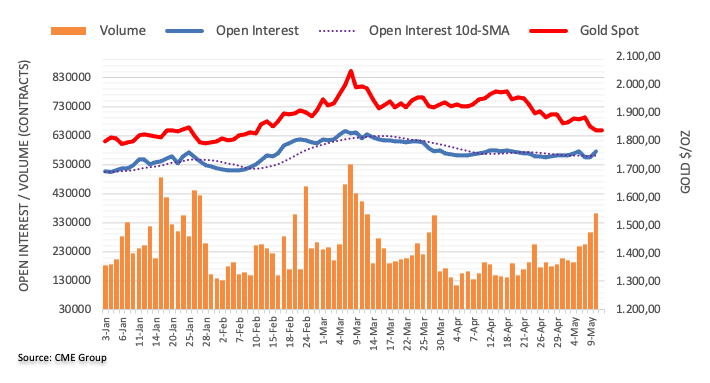
According to FX Strategists at UOB Group Lee Sue Ann and Quek Ser Leang, the downside pressure in EUR/USD is expected to alleviate on a close above 1.0620.
Key Quotes
24-hour view: “Yesterday, we expected EUR to ‘consolidate and trade within a range of 1.0510/1.0610’. EUR subsequently traded within a narrower range than expected (1.0524/1.0585). Despite the relatively quiet price actions, the underlying tone appears to have weakened. For today, EUR could edge lower but any weakness is expected to encounter support at 1.0500. The major support at 1.0470 is unlikely to come under threat. Resistance is at 1.0560 followed by 1.0585.”
Next 1-3 weeks: “We continue to hold the same view as from last Friday (06 May, spot at 1.0540) where EUR has to close below the solid support at 1.0470 before a sustained decline is likely. Shorter-term downward momentum has weakened a tad and the chance for EUR to close below 1.0470 has increased slightly. Overall, only a break of 1.0620 would indicate that the chance for EUR to close below 1.0470 has dissipated.”
- WTI has recovered intraday losses and has moved above the psychological resistance of $100.00.
- The RSI (14) has moved into a 40.00-60.00 range, which signals a neutral stance.
- Bulls are firmer above the 20-EMA but seek more validation.
West Texas Intermediate (WTI), futures on NYMEX, has witnessed a firmer bullish reversal after slipping below the psychological support of $100.00. The emergence of responsive buyers drove the asset higher in the Asian session.
On an hourly scale, WTI has overstepped the 20-period Exponential Moving Average (EMA) at $99.96. The asset has also climbed above the supply zone placed in a narrow range of $99.46-99.66, which has triggered a potential bullish reversal. The 50-period EMA at $101.74 is still trending lower and is favoring bears.
Meanwhile, the momentum oscillator, Relative Strength Index (RSI) (14) has strongly moved in the range of 40.00-60.00 from the bearish range of 20.00-40.00. A firmer momentum in range shift signals a solid upside move.
For an optimal buying position, investors should wait for a pullback towards the above-mentioned supply zone. An occurrence of the same will drive the asset higher towards the 50-EMA at $101.74, followed by Tuesday’s high at $103.08.
Alternatively, bears can regain control if the asset drops below Tuesday’s low at $97.14. This will send the asset towards April 25 low at $95.07. A breach of the latter will drag the asset towards April 7 low at $93.62.
WTI hourly chart
-637878415061972741.png)
- AUD/USD pares intraday gains, seesaws inside nearby symmetrical triangle around two-year low.
- Lower-high prices, higher-high RSI hints at an absence of bullish momentum.
- Previous resistance line from last Thursday will test the bears before giving them control.
AUD/USD struggles to extend the first daily gains in four as 50-HMA probes recovery moves inside a two-day-old symmetrical triangle. That said, the Aussie pair takes rounds to 0.6955-60 amid the early Wednesday morning in Europe.
Other than the 50-HMA and upper line of the stated triangle, respectively near 0.6965 and 0.6975, the 0.7000 threshold and 200-HMA level of 0.7075 also challenge AUD/USD buyers.
It should be noted that the hidden bearish RSI divergence, a condition where prices fail to improve even as RSI makes higher-high, also keeps the pair sellers hopeful.
Though, the aforementioned triangle’s support line and the previous resistance line from stretched from May 05, respectively near 0.6925 and 0.6900, restrict the pair’s short-term downside.
In a case where AUD/USD drops below 0.6900, it becomes vulnerable to testing the mid-June 2020 low surrounding 0.6775.
On the upside, a clear break post 0.7075 will direct AUD/USD buyers toward challenging the monthly top near 0.7265.
AUD/USD: Hourly chart
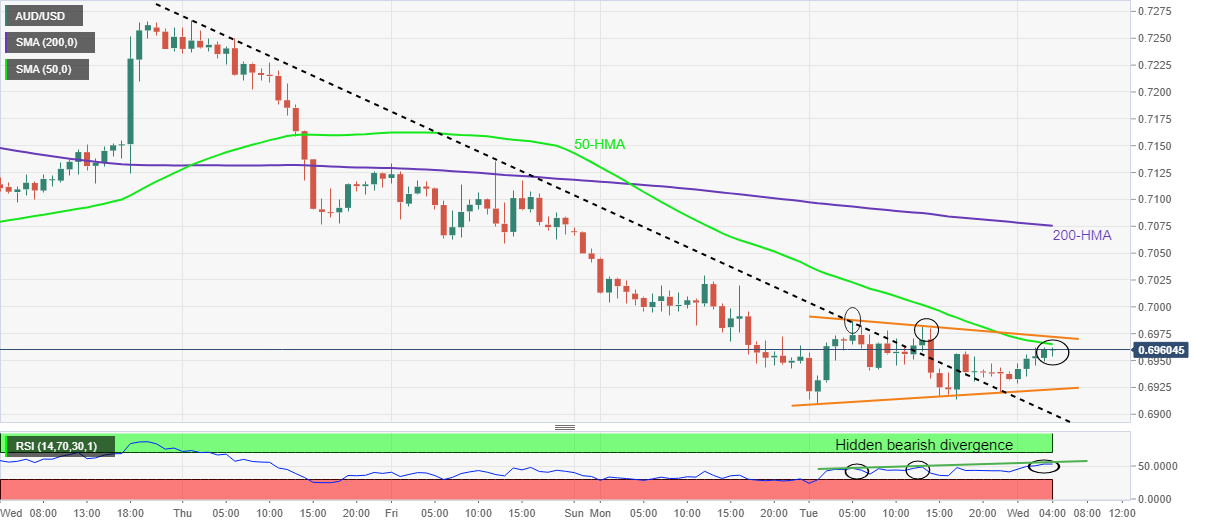
Trend: Pullback expected
- Gold Price extends the previous sell-off, with more pain in the offing.
- Hawkish Fedspeak, pre-US inflation anxiety boost the USD despite falling yields.
- Gold Price Forecast: On its way to challenging the $1,800 threshold.
Gold Price is testing the critical support, licking its wounds near three-months troughs below $1,850. The resurgent US dollar haven demand amid looming global growth and inflation fears weighed negatively on Gold Price, as traders ignored the pullback in the Treasury yields from multi-year highs. Additionally, hawkish Fedspeak also boosted the US dollar, exacerbating the pain in XAU/USD. Attention turns towards the critical US inflation release for a fresh direction in Gold Price.
Also read: US April CPI Preview: Has inflation peaked?
Gold Price: Key levels to watch
The Technical Confluences Detector shows that the Gold Price is testing the bullish commitments at critical support of $1,836. At that level, the SMA200 one-day, the previous day’s low and SMA5 one-hour coincide.
The next relevant support awaits at the previous low four-hour at $1,833, below which a fresh drop towards the pivot point one-day S1 at $1,827 cannot be ruled out.
Further down, sellers will target the pivot point one-week S2 at $1,822. The last line of defense for gold bulls is seen at $1,817, the pivot point one-day S2.
On the upside, any recovery could gain momentum only on a sustained break above the previous high four-hour at $1,841, above which the Fibonacci 23.6% one-day could be tested.
The confluence of the pivot point one-month S1 and Fibonacci 38.2% one-day at $1,847 will come into play.
The previous week’s low at $1,850 could be also on the buyers’ radars, opening gates towards $1,853, the intersection of the Fibonacci 61.8% one-day and pivot point one-week S1.
Here is how it looks on the tool
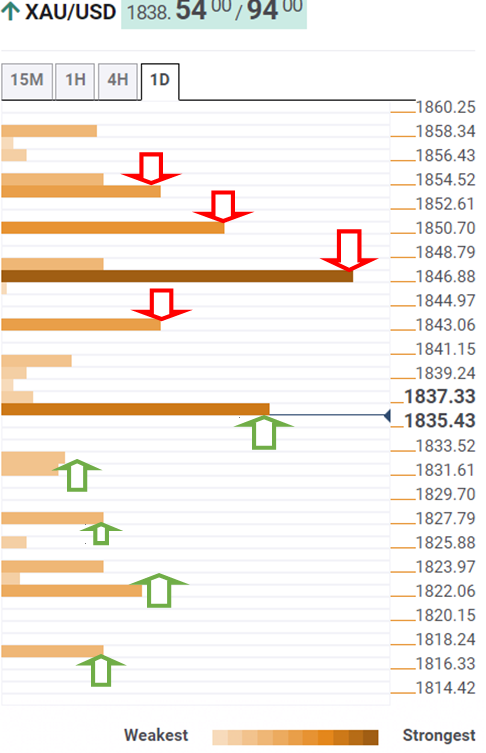
About Technical Confluences Detector
The TCD (Technical Confluences Detector) is a tool to locate and point out those price levels where there is a congestion of indicators, moving averages, Fibonacci levels, Pivot Points, etc. If you are a short-term trader, you will find entry points for counter-trend strategies and hunt a few points at a time. If you are a medium-to-long-term trader, this tool will allow you to know in advance the price levels where a medium-to-long-term trend may stop and rest, where to unwind positions, or where to increase your position size.
- GBP/USD snaps four-day downtrend with mild gains around two-year low.
- UK PM Johnson gives last chance to EU before scrapping Brexit protocols over NI.
- UK think-tank suggests rate hike to 2.5%, expects firmer consumption due to pandemic savings.
- USD pulls back as yields retreat, sentiment improves amid mixed Fedspeak, hopes of easing CPI.
GBP/USD pares recent losses around the lowest levels since June 2020, up 0.13% intraday near 1.2330, during early Wednesday morning in Europe. In doing so, the cable pair prints intraday gains for the first time in five days as market sentiment consolidates amid pre-CPI caution, as well as due to mixed data/updates.
Other than the market’s capitulation, mainly due to the mixed comments from the Fed speakers and upbeat news from China, GBP/USD buyers also cheer a temporary Brexit relief. “Despite being closer to the Foreign Secretary, Nicholas Watt claimed Mr. Johnson wants one last push in which the EU needs to be less ‘theological’,” per the UK Express. “The news comes after EU leaders urged the UK Government to back down over the Northern Ireland Protocol,” adds the news.
Additionally, comments from the UK think-tank, shared by the Financial Times (FT) also favor GBP/USD prices as the news said, “While we expect consumption to grow overall due to households using their pandemic savings, aggregates can hide what’s happening at the disaggregate level.” The analysis also mentioned that the Bank of England will need to raise interest rates to 2.5% and keep them there until the middle of the decade in order to bring soaring inflation under control.
On a different page, headlines from Shanghai local authorities that mentioned no virus spread in eight districts and firmer inflation numbers from China also favored the latest improvement in the market’s mood. Additionally, lower yields probe the US dollar buyers ahead of the key data and hence add strength to the latest GBP/USD rebound.
That said, the Federal Reserve policymakers seemed to have weighed on the US Treasury yields of late. Earlier in Asia, Atlanta Fed President Raphael Bostic mentioned that the US economy is strong and demand is high while also expecting the neutral rate at 2.0-2.5%. Even so, Cleveland Fed President and FOMC member Loretta Mester kept the bears hopeful as she said, on Tuesday, that the Fed doesn't rule out a 75 basis points rate hike “forever”.
It’s worth noting that the US 10-year Treasury yields and the US Dollar Index (DXY) remain pressured at around 2.99% and 103.90 levels respectively whereas the S&P 500 Futures print mild gains near the 4,000 level after a mixed closing on Wall Street.
Looking forward, GBP/USD traders will keep their eyes on the Brexit headlines for fresh impulse but the US Consumer Price Index (CPI) figures, expected to ease to 8.1% YoY from 8.5% prior, will be crucial to follow.
Read: US April CPI Preview: Has inflation peaked?
Technical analysis
A downward sloping resistance line from April 21, around 1.2450, restricts the short-term recovery of the GBP/USD prices. The downside moves, however, remain doubtful unless breaking June 2020 low surrounding 1.2250.
- Asian stocks have bounced back as DXY is performing lackluster ahead of the US inflation release.
- Chinese indices are outperforming as the US drops some tariffs imposed on Chinese imports.
- Oil prices have tumbled below the $100.00 mark on rising demand worries.
Markets in the Asian domain have witnessed a decent reversal after a spree of bearish trading sessions. This has come after the investors shrug off the anxiety over the US inflation release. Easing uncertainty in the Asian markets has also been accompanied by falling oil prices, which have brought a power-pack responsive buying action on Wednesday.
At the press time, Japan’s Nikkie225 gained 0.30%, India’s Nifty50 added 0.25%, Hang Seng jumped 1.50% and China’s SZSE Component surged 2.86%.
A strong rebound in the Chinese indices has been backed by the announcement of tariff withdrawal on Chinese imports by the US. US President Joe Biden on Tuesday announced that the administration could some of the tariffs imposed against Chinese imports to lower inflation. Meanwhile, China’s yearly inflation has landed at 2.1%, higher than the forecasts of 1.7%. Also, the Producer Price Index (PPI) remained higher at 8% against the estimates of 7.7%.
Also Read:
Meanwhile, the US dollar index (DXY) has struggled to breach the round levels resistance of 104.00. The DXY is trading lackluster as investors are on the sidelines ahead of the US Inflation release. The yearly US inflation is expected to land at 8.1% while the core CPI may print at 6%.
On the oil front, rising odds of a 75 basis point (bps) interest rate hike by the Federal Reserve (Fed) have elevated the demand worries. The aggregate demand may nosedive on liquidity contraction from the economy. Easy money will move out and the labor market could be hit hard. This has hammered oil prices below the psychological support of $100.00. Lower oil prices are boon for the Asian economies as they are the leading importers of fossil fuels.
- USD/JPY remains sidelined, mildly offered, inside a bullish chart pattern.
- Steady RSI, successful trading beyond 100-SMA keeps buyers hopeful.
- 131.25-35 appears a tough nut to crack for bulls.
Unlike other currency major pairs, USD/JPY fails to cheer DXY pullback as it treads water around 130.40 during the mid-Asian session on Wednesday. Even so, an upward slopping trend channel since late March joins steady RSI to defend the pair’s buyers.
That said, the current recovery moves from the channel’s support eye to a two-week-long horizontal resistance area surrounding 131.25-35.
Should the USD/JPY bulls manage to cross the 131.35 hurdle, the 132.00 round figure may offer an intermediate halt during the pair’s rally targeting the stated channel’s upper line, close to 133.35 of late.
Alternatively, a downside break of 130.00 level, comprising the channel support, will need validation from the 129.35-30 area, including the 100-SMA and April 19 peak, to convince the USD/INR sellers.
Following that, a downward trajectory towards the late April lows near 127.00 can’t be ruled out.
USD/JPY: Four-hour chart
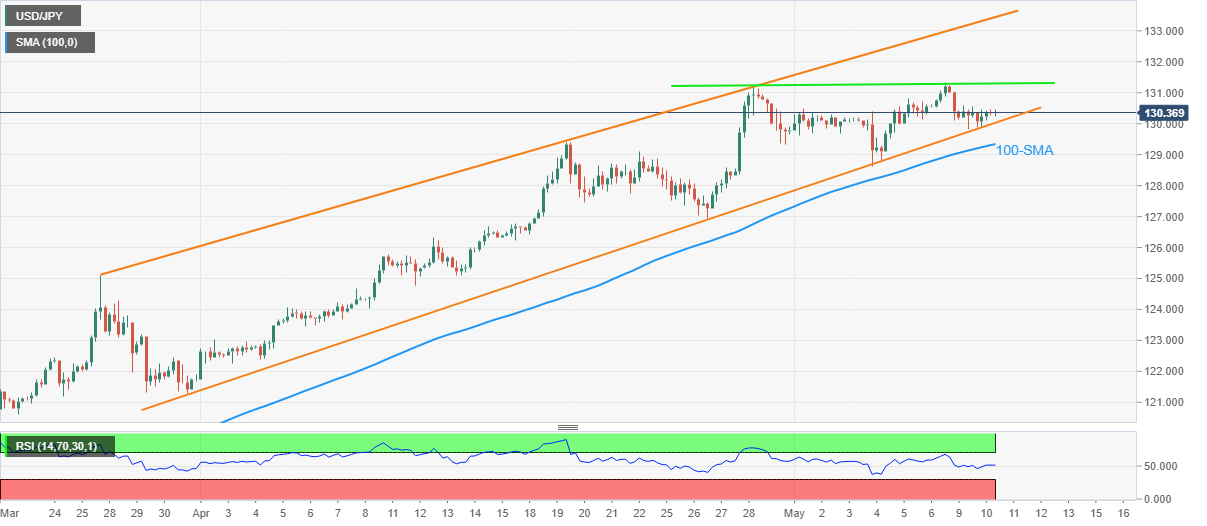
Trend: Bullish
- USD/INR extends pullback from record top, takes offers to renew intraday low.
- Better sentiment, softer yields probe USD buyers ahead of the key US CPI data.
- Fears of ‘shocker’ inflation from India jostle RBI intervention to defend the pair buyers.
- Fedspeak, China and Russia are extra catalysts to watch for clear directions.
USD/INR takes offers to renew intraday low around 77.20, stretching the previous day’s U-turn from a record high, as markets brace for the all-important US inflation data during early Wednesday.
Other than the consolidation amid pre-CPI anxiety, headlines from Shanghai local authorities that mentioned no virus spread in eight districts and firmer inflation numbers from China also favored the latest improvement in the market’s mood. Additionally, lower yields probe the US dollar buyers ahead of the key data and hence add strength to the latest weakness in the USD/INR prices.
Also positive for the Indian rupee (INR) could be the chatters surrounding the Reserve Bank of India’s (RBI) intervention to defend the national currency.
Mixed comments from the Federal Reserve policymakers seemed to have weighed on the US Treasury yields. Earlier in Asia, Atlanta Fed President Raphael Bostic mentioned that the US economy is strong and demand is high while also expecting the neutral rate at 2.0-2.5%. Even so, Cleveland Fed President and FOMC member Loretta Mester kept the bears hopeful as she said, on Tuesday, that the Fed doesn't rule out a 75 basis points rate hike “forever”.
Meanwhile, China’s “Zero Covid Tolerance” policy despite the World Health Organization’s (WHO) push to ease the rigid activity restrictions in Shanghai and Beijing also tests the latest optimism in the markets. Furthermore, the tales of the Russia-Ukraine war and its likely negative implications also keep gold sellers hopeful. As per the latest updates, Europe needs to divert its gas flow from Russia which previously used to arrive via Ukraine. On the same line are the fears of India’s consumer inflation jumping to an 18-month high, as per a Reuters poll, as well as recent improvement in the oil prices.
That said, the US 10-year Treasury yields and the US Dollar Index (DXY) remain pressured at around 2.99% whereas the S&P 500 Futures print mild gains near the 4,000 level after a mixed closing on Wall Street.
Given the light calendar in India ahead of Thursday’s inflation data, the USD/INR moves will rely on the US Consumer Price Index (CPI) figures, expected to ease to 8.1% YoY from 8.5% prior.
Also read: US CPI Preview: Hard core inflation to propel dollar to new highs, and two other scenarios
Technical analysis
USD/INR pair’s pullback from the five-month-old resistance line, around 77.52 by the press time, aims to revisit March’s peak of 77.17 before the 77.00 threshold could lure the bears. It’s worth noting, however, that a clear downside break of the 77.00 round figure could make the quote vulnerable to decline towards the late 2021 peak of 76.59.
Alternatively, sustained run-up beyond 77.52 won’t hesitate to challenge the 78.00 round figure ahead of aiming the 80.00 psychological manget.
- EUR/USD is sustaining below 1.0540 amid anxiety over the US Inflation release.
- Fed’s Mester believes that the Fed won’t stop interest rate hikes till it finds a compelling plunge in inflation.
- ECB’s Lagarde may dictate over concluding the APP and growth rate amid the Ukraine crisis.
The EUR/USD pair is displaying back and forth moves in a narrow range of 1.0526-1.0538 in the Asian session. The greenback bulls are frozen now as investors are preferring to remain on the sidelines amid anxiety over the release of the US inflation.
The mega event of the US Consumer Price Index (CPI) will release today and investors are seeing yearly inflation on the lower side. A preliminary estimate of 8.1% against the prior print of 8.5% is very much lucrative for the Federal Reserve (Fed). However, the deviation between the targeted inflation of 2% and inflation forecasts is extremely wider. This will continue to haunt the US economy as elevated price pressures will continuously reduce the real income of the households. The core CPI that excludes food and energy prices is seen at 6%, lower than the former release of 6.5%.
Meanwhile, the US dollar index (DXY) has tumbled to near 103.83 after a long consolidation in the early Tokyo session. The comments from Cleveland Fed President Loretta Mester have bolstered the fact that the Fed won’t get softer on interest rates sooner. Fed policymaker believes that the central bank won’t stop until it finds a ‘compelling’ slippage in inflation numbers.
On the euro front, the speech from European Central Bank (ECB) President Christine Lagarde will remain in focus. ECB Lagarde may dictate the roadmap for concluding the Asset Purchase Program (APP) in the third quarter of this year. Apart from that, the speech will put some light on the employment numbers and growth rate of the eurozone.
- The formation of a bullish divergence bolsters exhaustion signals.
- The 20-EMA is testing the strength of the kiwi bulls.
- Momentum oscillator RSI (14) has shifted in the 40.00-60.00 range.
The NZD/USD pair has displayed a volatility contraction as the asset is oscillating in a narrow range of 0.6280-0.6310 from the previous trading session. Earlier, the asset witnessed an extreme sell-off after slipping below the previous week’s low at 0.6394.
The greenback bulls are showing signs of exhaustion after a prolonged south move. A bullish divergence has been formed on an hourly scale that adds to the bullish reversal filters. The asset formed a lower low at 0.6276 while the momentum oscillator, Relative Strength Index (RSI) (14) denied forming a lower low, which shows exhaustion in the downtrend. The RSI (14) has shifted to a 40.00-60.00 range from a bearish range of 20.00-40.00 but seeks more validation.
The 20-period Exponential Moving Average (EMA) at 0.6303 is testing kiwi bulls’ strength and responsive buyers’ action to provide a green signal. While the 50-EMA at 0.6327 is still favoring the downside.
For a meaningful bullish reversal, kiwi bulls need to violate the trendline placed from near Monday’s high of 0.6372 at 0.6320. This will drive the asset towards Tuesday’s high and Wednesday’s high at 0.6349 and 0.6377 respectively.
On the flip side, kiwi bulls could lose support if the asset tumbles below Tuesday’s low at 0.6276. This will drag the asset towards the 28 May 2020 high at 0.6228, followed by the round level support at 0.6200.
NZD/USD hourly chart
-637878354689632572.png)
| Raw materials | Closed | Change, % |
|---|---|---|
| Brent | 102.4 | -2.96 |
| Silver | 21.262 | -2.53 |
| Gold | 1838.21 | -0.82 |
| Palladium | 2062.6 | -0.4 |
The House on Wednesday passed a $39.8 billion military and humanitarian aid package for Ukraine, as it fights off the Russian aggression.
Key details
in an overwhelming 368 to 57 vote, weeks after lawmakers overwhelmingly approved $13.6 billion in emergency aid for the war effort.
That total — roughly $53 billion over two months — is poised to amount to the largest foreign aid package to move through Congress in at least two decades.
The legislation is expected to head to the Senate within the coming days.
Market reaction
The US dollar index is easing slightly below 104.00, as traders brace for the critical inflation data. The spot is down 0.08% on the day.
- Gold prices manage to consolidate losses at three-month low ahead of the key US inflation data.
- Mixed sentiment, DXY pullback recall buyers but Fedspeak, growth fears weigh on prices.
- 12-day-old megaphone formation, weekly resistance line also keep sellers hopeful even as softer US CPI can extend price recovery.
Gold (XAU/USD) prices recover from the lowest since February as markets brace for the all-important US inflation data during early Wednesday. The metal’s latest run-up to refresh the intraday to $1,838 takes clues from the slightly positive stock futures and China’s ability to post upbeat CPI despite ongoing covid woes. Also supporting the yellow metal could be the pullback in the US Treasury yield and the greenback.
China’s Consumer Price Index (CPI) rose past 1.8% market consensus to 2.1% YoY whereas the Producer Price Index (PPI) crossed 7.7% expectations with the 8.0% yearly figures. As China is among the world’s top gold consumers, firmer inflation despite the coronavirus-led lockdowns underpins the hopes of the dragon nation’s future demand for the yellow metal.
Also favoring the prices could be headlines from Shanghai local authorities that mentioned no virus spread in eight districts.
On the same line were early Asian session comments from Atlanta Fed President Raphael Bostic who mentioned that the US economy is strong and demand is high while also expecting the neutral rate at 2.0-2.5%.
Even so, Cleveland Fed President and FOMC member Loretta Mester recalled the market bears as she said, “They don't rule out a 75 basis points rate hike forever”.
Also challenging the gold buyers is China’s “Zero Covid Tolerance” policy despite the World Health Organization’s (WHO) push to ease the rigid activity restrictions in Shanghai and Beijing. The lockdowns in the world’s largest industrial player pose a serious threat to global growth, especially at a time when inflation fears are high.
Elsewhere, the tales of the Russia-Ukraine war and its likely negative implications also keep gold sellers hopeful. As per the latest updates, Europe needs to divert its gas flow from Russia which previously used to arrive via Ukraine.
Amid these plays, the US 10-yer Treasury yields and the US Dollar Index (DXY) remain pressured around 2.99% whereas the S&P 500 Futures print mild gains near the 4,000 level after a mixed closing on Wall Street.
Looking forward, the US CPI is expected to ease to 8.1% from 8.5%, and will be important to watch for fresh impulses. However, a major focus will be on the US Consumer Price Index ex Food & Energy figures which are likely to ease to 6.0% YoY versus 6.5% prior. Should the inflation figures refrain from easing for April, the US dollar will witness magnified buying, which in turn will drag XAU/USD towards a fresh multi-month low.
Also read: Gold targets $1,830 regions
Technical analysis
Gold prices remain pressured inside a bearish megaphone chart formation, despite the latest rebound, suggesting a further widening of downside moves.
That said, the metal’s break of the $1,850 horizontal support eyes 61.8% Fibonacci Expansion (FE) of April 19 to May 05 moves, around $1,828. However, the RSI (14) approaches oversold territory, indicating that the bears are running out of steam.
Should gold prices drop below $1,828, the support line of the megaphone, around $1,810, will lure the sellers.
Meanwhile, the weekly resistance line limits immediate recovery around $1,858, a break of which could propel the bullion towards the $1,900 threshold, coinciding with the megaphone’s upper line.
It’s worth observing that the 200-SMA, around $1,923, appears a tough nut to crack for the gold buyers afterward.
Gold: Four-hour chart
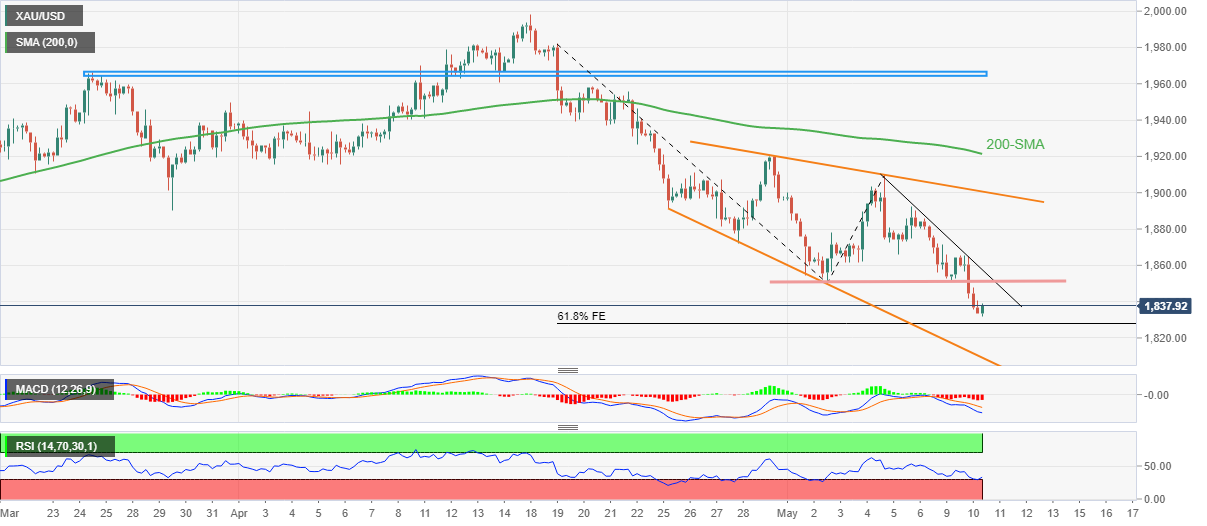
Trend: Bearish
South Korea's new president Yoon Suk-yeol expressed his concerns over higher inflation during his speech on Wednesday.
The new South Korean President said that “price growth is the biggest problem,” per Yonhap.
These comments come after the country’s exports jump 8.9% for the first 10 days of May.
Meanwhile, the nation’s Finance Minister Choo Kyung-ho said at the beginning of a meeting with the ruling party, "as for the funding, we have made all efforts to secure resources, including readjustment of existing spending plans and carried-over tax revenue surplus.”
Market reaction
USD/KRW is trading at 1,277.05, up 0.05% on the day, having spiked to two-year highs of 1,280.20 in an immediate reaction to the above comments.
- USD/CNH extends pullback from 19-month high on strong China inflation data.
- China CPI rose 2.1%, PPI grew 8.0%, both figures crossed market consensus.
- Sluggish RSI, a convergence of 100-HMA and short-term rising trend line challenge bears.
USD/CNH justifies strong-than-expected China inflation data by reversing from the intraday high during Wednesday’s Asian session. That said, the quote takes offers to renew daily low around 6.7400 by the press time.
China’s Consumer Price Index (CPI) rose past 1.8% market consensus to 2.1% YoY whereas the Producer Price Index (PPI) crossed 7.7% expectations with the 8.0% yearly figures.
It’s worth noting that the offshore Chinese currency (CNH) pair rallied to the highest since October 2020 before retreating from 6.7765 during the early week.
Considering the upbeat inflation numbers and the pair’s failures to refresh the multi-day high, the USD/CNH prices are likely to decline towards the immediate support, namely May 06 peak surrounding 6.7345.
However, the 100-HMA and ascending support line from May 05 portrays 6.7180 as a tough nut to crack for the pair sellers. Also acting as important support is the 200-HMA level, near 6.6880 by the press time.
Alternatively, recovery moves need to cross the immediate resistance line, at 6.7615, before challenging the multi-day high flashed on Monday around 6.7765.
In a case where USD/CNH bulls keep reins past 6.7765, the 61.8% Fibonacci Expansion (FE) of May 04-10 moves, near 6.8120, will be on their radars.
USD/CNH: Hourly chart
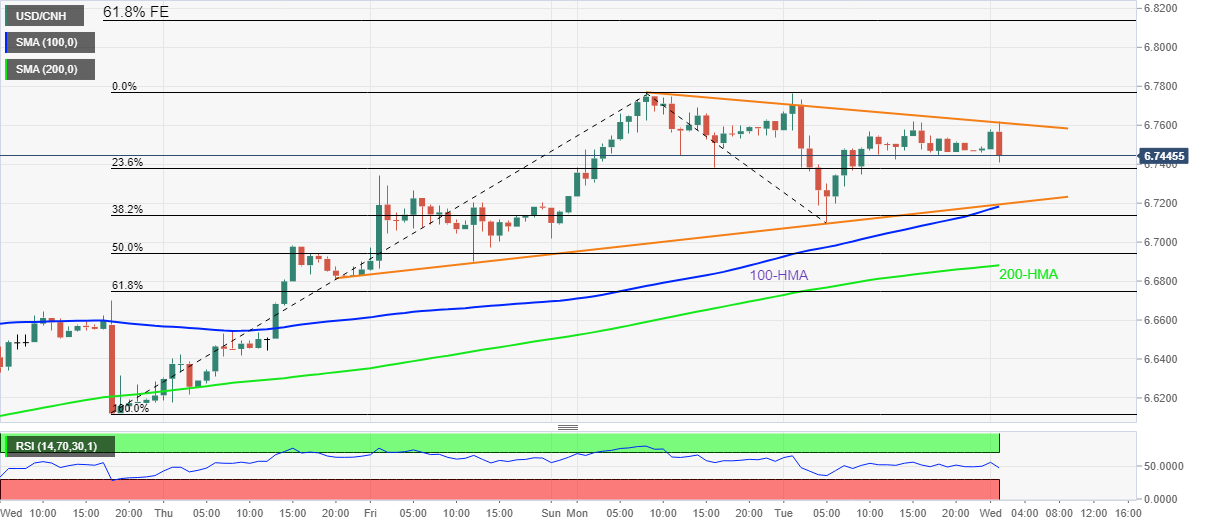
Trend: Pullback expected
- GBP/USD moves in on a weekly target at 1.2251.
- Speculative shorts eye 1.2075 but the bulls eye a daily M-formation and 1.2450s.
GBP/USD has been in the hands of the bears since breaking 1.3670 back in November 2021. The price is making its way into meeting a prior low of 1.2251 which guards a run to mitigate the imbalance of price between there and the 1.2075 May 18 2020 low:

From a daily perspective, the bulls are moving in, however, so there could be something of a correction underway at this juncture. The M-formation is compelling in this regard:
GBP/USD daily chart
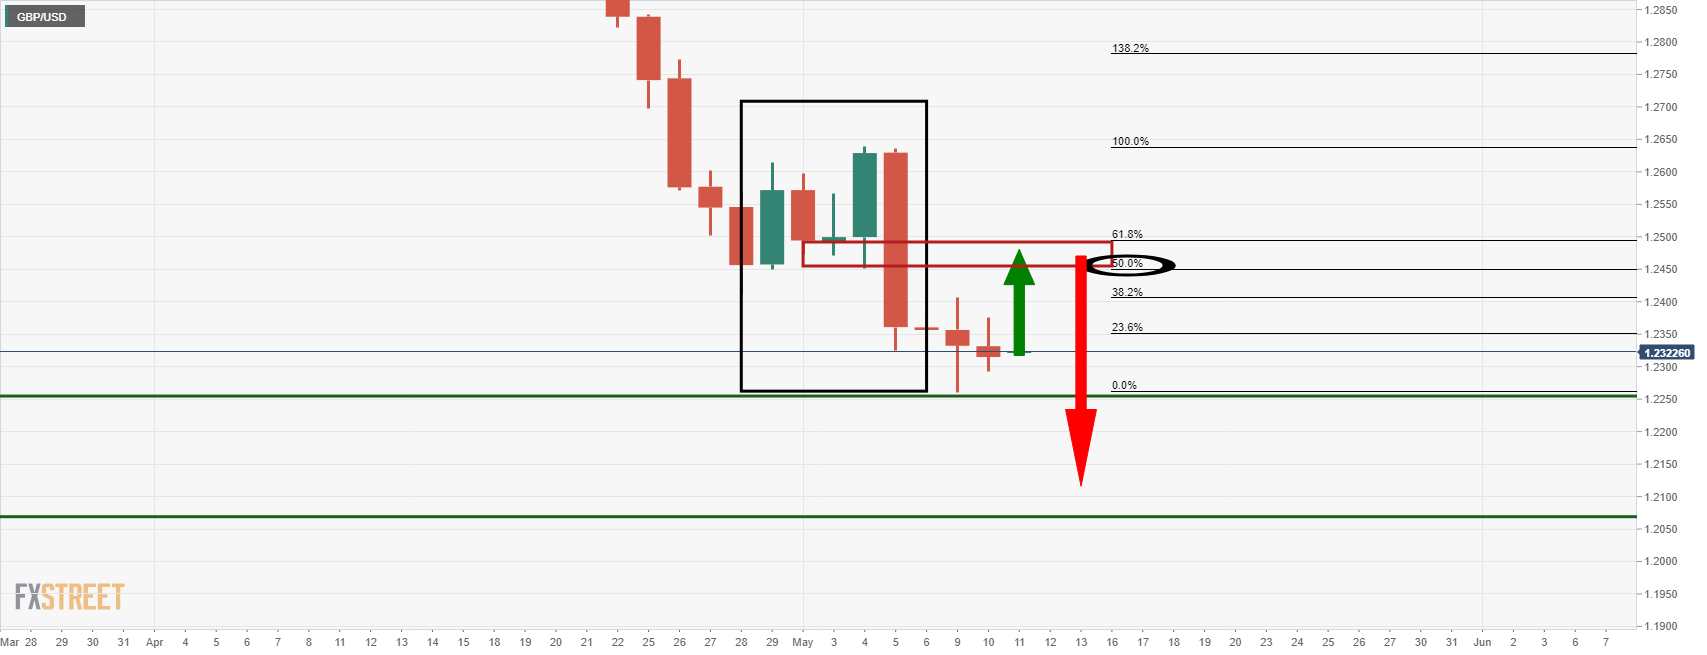
The 50% mean reversion aligns with the neckline at 1.2450.
Analysts at Societe Generale offer their expectations on the critical US Consumer Price Index (CPI) report due later this Wednesday.
Key quotes
“Seasonally-adjusted gasoline prices are expected to have dropped roughly 5% in April. Home heating and electrical costs should dampen the overall energy price boost to the CPI, but the energy component is key to the 0.2% MoM forecast increase.”
“If this is the case, the YoY measure would fall to 8% from 8.5% in March and raise hopes that the CPI peak pace was set last month.”
“The unknowns regarding energy price pressures linger, however, so we are calling the peak at 8.5%, noting that conviction rests on oil and gas price developments.”
“Core CPI is still expected up 0.4% MoM (5.9% YoY), as rent and shelter components contribute a large share of the index, and they are set for a 0.4% increase.”
- AUD/USD picks up bids to renew intraday high on firmer-than-expected China data.
- China CPI rose 2.1%, PPI grew 8.0% in April versus 1.8% and 7.7% respective forecasts.
- Risk appetite remains weak amid anxiety ahead of US inflation release, hawkish Fedspeak strengthens cautious mood.
- Headlines from China and Russia will join pre-CPI Fed policymakers’ comments to entertain traders.
AUD/USD holds onto the corrective pullback from the yearly low by crossing the 0.6950 level after China’s headline inflation was released during Wednesday’s Asian session. It’s worth noting, however, that the market’s anxiety ahead of the key US CPI data and mixed concerns over the key risk catalysts test the recovery moves.
That said, China’s Consumer Price Index (CPI) rose past 1.8% market consensus to 2.1% YoY whereas the Producer Price Index (PPI) crossed 7.7% expectations with the 8.0% yearly figures.
Read: Breaking: Chinese inflation data beats but does little to move the needle in an embattled AUD
Earlier in the day, Australia’s Westpac Consumer Confidence dropped for the sixth consecutive time while flashing -5.6% figures for May, versus -0.9% prior.
Also weighing on the AUD/USD prices, in addition to the aforementioned data, were comments from the Fed policymakers. Recently, Atlanta Fed President Raphael Bostic mentioned that the US economy is strong and demand is high while also expecting the neutral rate at 2.0-2.5%.
Before that, Cleveland Fed President and FOMC member Loretta Mester recalled the market bears as she said, “They don't rule out a 75 basis points rate hike forever”.
On a different page, China sticks to its “Zero Covid Tolerance” policy despite the World Health Organization’s (WHO) push to ease the rigid activity restrictions in Shanghai and Beijing. The lockdowns in the world’s largest industrial player and Australia’s biggest trading partner pose a serious threat to the AUD/USD prices.
Elsewhere, the tales of the Russia-Ukraine war and its likely negative implications also keep AUD/USD sellers hopeful. As per the latest updates, Europe needs to divert its gas flow from Russia which previously used to arrive via Ukraine.
Against this backdrop, the US 10-yer Treasury yields remain pressured around 2.99% whereas the S&P 500 Futures print mild losses near the 4,000 level after a mixed closing on Wall Street.
Given the mixed bag of data and recently cautious markets, AUD/USD traders will keep their eyes on the US CPI for fresh impulse. While the headline CPI is expected to ease to 8.1% from 8.5%, a major focus will be on the US Consumer Price Index ex Food & Energy figures which are likely to ease to 6.0% YoY versus 6.5% prior.
Should the inflation figures refrain from easing for May, the US dollar will witness magnified buying, which in turn will drag AUD/USD towards a fresh multi-month low.
Technical analysis
Although oversold RSI conditions challenge further downside of the AUD/USD prices, January 2022 low surrounding 0.6965-70 restricts any corrective pullback of the pair. On the downside, there prevails a smooth road to the mid-June 2020 low surrounding 0.6775.
China's inflation data has been released and the combination of lockdowns, a lower base in April last year and higher pork prices, suggested that April's CPI print would reveal a worsening in inflationary pressures.
Producer Prices, on the other hand, were expected to moderate as industrial commodities, bulks, steel and oil prices have dropped over the month.
The data has arrived as follows:
China CPI
China April CPI +2.1% YoY (Reuters poll +1.8% ) vs. prior 1.5%
China April CPI +0.4% MoM (Reuters poll +0.2%) vs. prior 0%.
China PPI
China April PPI +8.0 pct from a year ago (Reuters poll +7.7 pct) vs. prior 8.3%.
China April PPI +0.6 pct from previous month.
Market reaction
There was a 5 pip downside move in AUD/USD as the data came out.
However, AUD trades as a proxy for the performance of the Chinese economy and the following illustrates a near to longer-term outlook for the currency vs. the US dollar.
AUD/USD Price Analysis: Longer-term 'Shorts' eye a run to June 2020 lows, 0.6776
About China CPI
The Consumer Price Index is released by the National Bureau of Statistics of China. It is a measure of retail price variations within a representative basket of goods and services. The result is a comprehensive summary of the results extracted from the urban consumer price index and rural consumer price index. The purchase power of the CNY is dragged down by inflation.
The CPI is a key indicator to measure inflation and changes in purchasing trends. A substantial consumer price index increase would indicate that inflation has become a destabilizing factor in the economy, potentially prompting The People’s Bank of China to tighten monetary policy and fiscal policy risk. Generally speaking, a high reading is seen as positive (or bullish) for the CNY, while a low reading is seen as negative (or Bearish) for the CNY.
- The DXY is consolidating below 104.00 as investors demand the release of US inflation for further guidance.
- The Fed needs a compelling drop in inflation to shift to a less aggressive stance.
- Uncertainty could elevate further if the inflation figures shoot above 8.5%.
The US dollar index (DXY) is balancing below the round level mark of 104.00 as anxiety over the release of the US inflation has sidelined the market participants. The asset has been oscillating in a range of 102.35-104.20 from April 28 amid the spree of major economic events right from the interest rate decision by the Federal Reserve (Fed) and release of the US Nonfarm Payrolls (NFP) last week to the upcoming Consumer Price Index (CPI) numbers.
US CPI numbers
The US Bureau of Labor Statistics is expected to print the yearly inflation at 8.1% lower than the former figure of 8.5% while the core CPI that excludes food and energy is likely to land at 6%. Although inflation print is seen lower, that doesn’t guarantee a trim to the odds of one more jumbo rate hike by the Fed in June. Investors should brace for higher volatility if the yearly inflation shoots above the multi-decade high print of 8.5%.
Fed’s Mester speech
Cleveland Fed President Loretta Mester dictated that the Fed won’t soften its stance towards the interest rates till it finds a compelling slippage in the inflation numbers. Inflation numbers are on the rooftop and the current situation is demanding to firmer tackle to slow down the pace of soaring inflation.
Key events this week: Consumer Price Index (CPI), Initial Jobless Claims, Producers Price Index (PPI) Michigan Consumer Sentiment Index (CSI).
Eminent issues on the back boiler: Russia-Ukraine Peace Talks, China’s CPI, and European Central Bank (ECB) President Christine Lagarde’s speech.,
In recent trade today, the People’s Bank of China (PBOC) set the yuan (CNY) at 6.7290 vs. the estimate at 6.7339 and the last close of 6.7343.
About the fix
China maintains strict control of the yuan’s rate on the mainland.
The onshore yuan (CNY) differs from the offshore one (CNH) in trading restrictions, this last one is not as tightly controlled.
Each morning, the People’s Bank of China (PBOC) sets a so-called daily midpoint fix, based on the yuan’s previous day closing level and quotations taken from the inter-bank dealer.
US inflation expectations, as per the 10-year breakeven inflation rate per the St. Louis Federal Reserve (FRED) data, continue to disregard the reflation woes as it recently dropped to the lowest levels since March 01.
That said, the inflation gauge dropped the most in 10 months on Monday and extended the south-run for the fourth consecutive day by Tuesday’s end of the North American trading session as it flashed a 2.65% figure at the latest.
The mismatch between the market’s inflation chatters and the aforementioned FRED data adds to the pre-CPI anxiety and weighs on the risk appetite.
It’s worth noting that the headline US Consumer Price Index (CPI) is expected to ease to 8.1% from 8.5%. However, a major focus will be on the US Consumer Price Index ex Food & Energy figures which are likely to ease to 6.0% YoY versus 6.5% prior.
Read: US April CPI Preview: Has inflation peaked?
- USD/CAD remains sidelined after refreshing 18-month high, probes four-day uptrend.
- Overbought RSI, monthly resistance line challenge immediate upside.
- Weekly support holds the key to short-term pullback but bears remain cautious above 200-SMA.
USD/CAD bulls take a breather around the 18-month high, steady around 1.3030 during Wednesday’s Asian session.
The loonie pair’s latest inaction probes the four-day uptrend that propelled it to the highest levels since November 2020.
However, the overbought RSI (14) stops USD/CAD bulls from crossing a one-month-old rising trend line resistance, at 1.3045 by the press time.
Should the quote ignores technicals and rally beyond 1.3045, the odd of its challenge to the mid-November 2020 peak surrounding 1.3175 can’t be ruled out.
Meanwhile, a one-week-long rising trend line, close to 1.3015 at the latest, precedes the 1.3000 psychological magnet to restrict the immediate downside of USD/CAD prices.
Also acting as short-term key support is the 50-SMA and an upward sloping trend line from April 21, respectively around 1.2875 and 1.2815.
It’s worth noting that the 200-SMA level surrounding 1.2660 acts as the last defense of the USD/CAD bulls in case of the pair’s declines past 1.2815.
USD/CAD: Four-hour chart
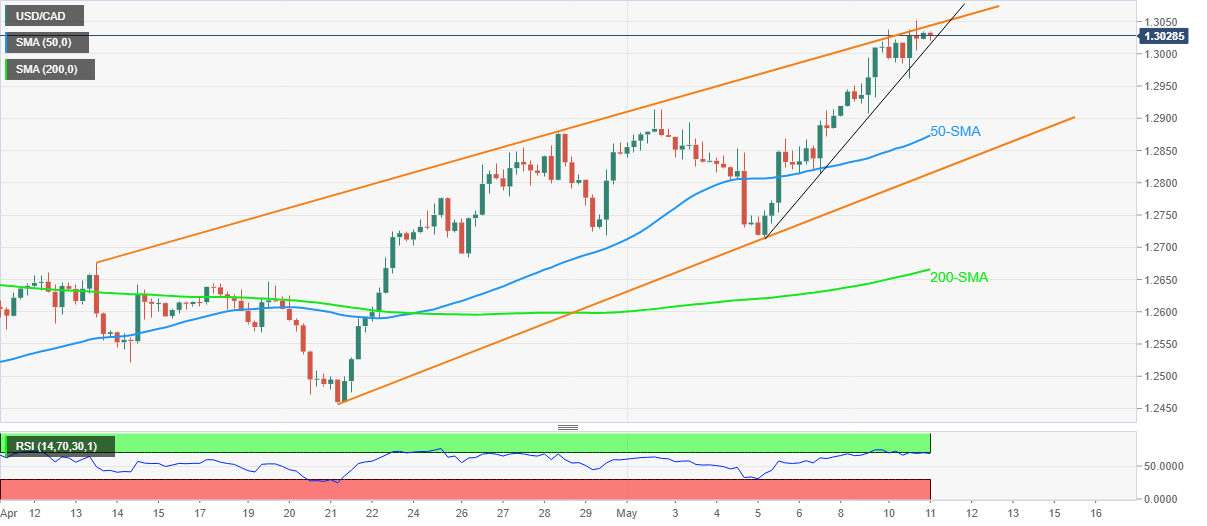
Trend: Pullback expected
- AUD/USD bulls have stepped in below a critical support area.
- However, bears are seeking a run to the June 2020 lows of 0.6776.
The daily chart is showing the price below key daily support, and prior lows, yet the prior day's doji means that there are prospects of a correction. The prior January daily lows are the first hurdle before the May 2 lows which guard a correction to the 38.2% Fibonacci level.
AUD/USD daily chart
With that being said, a bullish engulfing candle in the next day or two would be required to confirm the corrective bias.
AUD/USD weekly chart
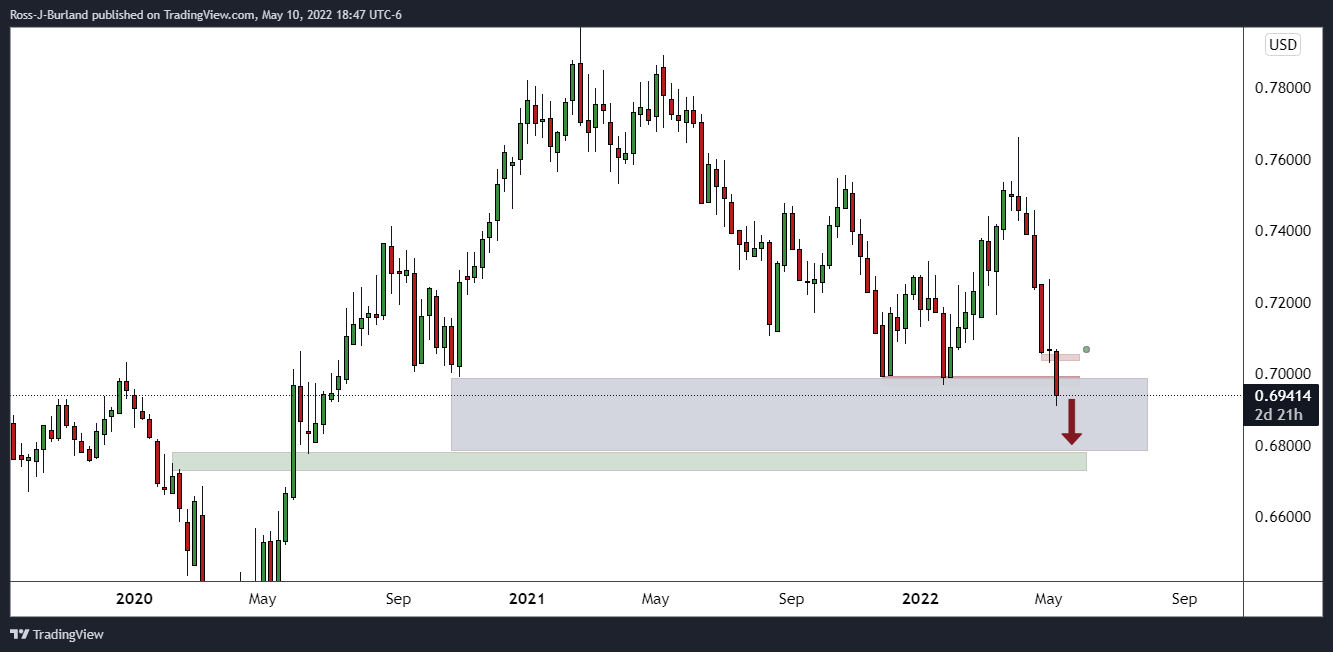
From a weekly perspective, however, the price is showing no signs of corrective behaviour and the focus is on mitigating the price imbalance between the 0.7000 figure all the way down to June 2020 lows of 0.6776.
- NZD/USD is balancing below 0.6300 as fears of a recession in the kiwi zone renew.
- Investors are on the sidelines ahead of the US inflation numbers.
- The BNZ sees NZ’s economic development to halt in 2023.
The NZD/USD pair is falling like a house of cards as risk-perceived securities are being dumped by the market participants as uncertainty over the US inflation release is looming in the FX domain. The asset has been dragged below 0.6300 on expectations of higher inflation figures that will force the Federal Reserve (Fed) to feature a jumbo rate hike consecutively.
The street is also expecting that the Fed could announce a 75 basis point (bps) interest rate hike in June. Although it seems contradictory to the dictation of Fed chair Jerome Powell that a 75 bps rate hike is not into consideration. No wonder the renewal of the multi-decade inflation could leave no other choice for the Fed than to soar the interest rates.
As per the market consensus, the yearly CPI figure is seen at 8.1% while the core CPI that doesn’t include food and energy is seen at 6%. Meanwhile, the comments from Cleveland Fed President Loretta Mester states that the Fed won’t step back from the interest rate elevation program until it finds any compelling drop in the inflation numbers.
On the kiwi front, the situation seems worsened as the Bank of New Zealand (BNZ) has claimed that “New Zealand's economic development will come to a halt in 2023. It looks like higher inflation has started showing its colors now. The BNZ also stated that the risk of a recession in the kiwi area is increasing day by day. This may dent the demand for the antipodean further.
- EUR/USD stays depressed inside a two-week-old trading range.
- Hawkish Fedspeak, risk-off mood underpins USD strength, Euro struggles on softer ECBspeak, Russia-Ukraine tussles.
- US CPI for April will be crucial amid hopes of an easy number, chatters surrounding Fed’s 75 bps rate hike.
- ECB’s Lagardge eyed for clarity over the widely-discussed July rate lift.
EUR/USD refreshes intraday low around 1.0525, extending the previous day’s downbeat performance during Wednesday’s Asian session, as global markets turn cautious ahead of the all-important US inflation data for April. Also favoring the pair sellers are the recently hawkish Fedspeak, as well as covid and geopolitical risks.
Recently, Atlanta Fed President Raphael Bostic mentioned that the US economy is strong and demand is high while also expecting the neutral rate at 2.0-2.5%.
Before that, multiple Fed policymakers crossed wires to convey their take on the US central bank’s next moves on Tuesday. Most of them, including Federal Reserve Bank of Richmond President Thomas Barkin and NY Fed President John Williams, backed a 50 bps rate hike. However, comments from Cleveland Fed President and FOMC member Loretta Mester recalled the bears as she said, “They don't rule out a 75 basis points rate hike forever”.
On a different page, China sticks to its “Zero Covid Tolerance” policy despite the World Health Organization’s (WHO) push to ease the rigid activity restrictions in Shanghai and Beijing. The lockdowns in the world’s largest industrial players pose a serious threat to the global supply chain and growth prospects.
Also weighing on the risk appetite, as well as on the EUR/USD prices, are the tales of the Russia-Ukraine war and its likely negative implications of the same. Recently, Europe has had to divert its gas flow from Russia which previously used to arrive via Ukraine.
Additionally, downbeat prints of Germany’s ZEW Survey details, suggesting the record low of market expectations, also contributed to the EUR/USD pair’s bearish trajectory.
Amid these plays, the US 10-yer Treasury yields remain pressured around 2.99% whereas the S&P 500 Futures seesaw around the 4,000 level after a mixed closing on Wall Street.
Moving on, the EUR/USD pair traders will initially pay attention to Germany’s Harmonized Index of Consumer Prices for April, expected to remain unchanged at 7.8% YoY, ahead of observing ECB President Christine Lagarde’s say on the July rate hike. However, a major focus will be on the US Consumer Price Index ex Food & Energy figures which are likely to ease to 6.0% YoY versus 6.5% prior.
Should the inflation data fail to match the anticipated softness, the US dollar could extend the latest bullish trajectory towards a refreshing multi-year high on the Fed policymakers’ recently hawkish comments.
Read: US April CPI Preview: Has inflation peaked?
Technical analysis
A fortnight-old range between 1.0470 and 1.0640 restricts short-term EUR/USD moves. However, recently downbeat MACD and RSI signals join brighter chances of disappointment from scheduled data/events to keep bears hopeful.
| Index | Change, points | Closed | Change, % |
|---|---|---|---|
| NIKKEI 225 | -152.24 | 26167.1 | -0.58 |
| Hang Seng | -368.27 | 19633.69 | -1.84 |
| KOSPI | -14.25 | 2596.56 | -0.55 |
| ASX 200 | -70.4 | 7033.9 | -0.99 |
| FTSE 100 | 26.62 | 7243.22 | 0.37 |
| DAX | 154.07 | 13534.74 | 1.15 |
| CAC 40 | 30.89 | 6116.91 | 0.51 |
| Dow Jones | -84.96 | 32160.74 | -0.26 |
| S&P 500 | 9.81 | 4001.05 | 0.25 |
| NASDAQ Composite | 114.42 | 11737.67 | 0.98 |
| Pare | Closed | Change, % |
|---|---|---|
| AUDUSD | 0.69368 | -0.21 |
| EURJPY | 137.326 | -0.24 |
| EURUSD | 1.05285 | -0.26 |
| GBPJPY | 160.578 | -0.12 |
| GBPUSD | 1.23119 | -0.13 |
| NZDUSD | 0.62894 | -0.49 |
| USDCAD | 1.30258 | 0.13 |
| USDCHF | 0.9952 | 0.17 |
| USDJPY | 130.43 | 0.01 |
- Gold price sees a downside to near $1,800.00 amid a tight liquidity environment.
- Investors are dumping gold ahead of the release of the US CPI.
- Fed’s Mester believes that the Fed needs a compelling slippage in CPI to pause quantitative measures.
Gold price (XAU/USD) has plunged below $1,840.00 as investors are jittering over the disclosure of the US Consumer Price Index (CPI) in the New York session. The gold prices shifted into a negative trajectory after slipping below the previous week’s low at $1,854.48. The sheer downside move after surrendering the previous week’s low support has prepared the bright metal for a downside journey towards the psychological support of $1,800.00.
Investors see the yearly US CPI at 8.1% while the core CPI, excluding food and energy, at 6%. The expected figures are lower than the former ones but the odds of a 75 basis point (bps) by the Federal Reserve (Fed) in its monetary policy meeting in June are rock solid. Meanwhile, comments from Cleveland Fed President Loretta Mester have bolstered the fact that the Fed won’t get softer on interest rates sooner. Fed policymaker believes that the central bank won’t stop until it finds a ‘compelling’ slippage in inflation numbers. Currently, the situation is pointing to a tougher fight to slow down the pace of inflation.
Gold technical analysis
The gold price has surrendered the cushion of the 200-Exponential Moving Average (EMA), which is trading at $1,859.22 on the daily scale. The precious metal has tumbled to near the trendline placed from 9 August 2021 low at $1,687.78. Meanwhile, the Relative Strength Index (RSI) (14) has shifted into a bearish range of 20.00-40.00 for the very first time this year and is pointing to more downside ahead.
Gold daily chart
-637878240970025390.png)


© 2000-2026. All rights reserved.
This site is managed by Teletrade D.J. LLC 2351 LLC 2022 (Euro House, Richmond Hill Road, Kingstown, VC0100, St. Vincent and the Grenadines).
The information on this website is for informational purposes only and does not constitute any investment advice.
The company does not serve or provide services to customers who are residents of the US, Canada, Iran, The Democratic People's Republic of Korea, Yemen and FATF blacklisted countries.
Making transactions on financial markets with marginal financial instruments opens up wide possibilities and allows investors who are willing to take risks to earn high profits, carrying a potentially high risk of losses at the same time. Therefore you should responsibly approach the issue of choosing the appropriate investment strategy, taking the available resources into account, before starting trading.
Use of the information: full or partial use of materials from this website must always be referenced to TeleTrade as the source of information. Use of the materials on the Internet must be accompanied by a hyperlink to teletrade.org. Automatic import of materials and information from this website is prohibited.
Please contact our PR department if you have any questions or need assistance at pr@teletrade.global.
transfers