- Analytics
- News and Tools
- Market News
CFD Markets News and Forecasts — 09-05-2022
- Silver licks its wounds at 2022 bottom after posting the biggest daily fall in three weeks.
- Oversold RSI conditions test sellers but recovery remains elusive until staying below previous support line from January.
- Double bottoms around $21.42 become crucial support, descending trend line from April 18 adds to the upside filters.
Silver (XAG/USD) prices consolidate the latest losses around $21.80 during the quiet Asian session on Tuesday. In doing so, the bright metal justifies oversold RSI conditions to portray a bounce off the yearly low flashed the previous day.
However, the support-turned-resistance line from January, around $22.15, guards the quote’s immediate rebound. Following that, a downward sloping resistance line from April 18, close to $22.70, will challenge the XAG/USD bulls.
If silver prices manage to cross the $22.70 hurdle, the odds of witnessing further recovery towards the previous week’s top surrounding $23.30 can’t be ruled out.
Meanwhile, the lows marked in September and December of 2021 portray a double-bottom around $21.42, making it a tough nut to crack for the bears.
Should the silver sellers ignore oversold RSI conditions and conquer the $21.42 mark, $21.00 and $20.00 levels may act as an intermediate halt before directing the quote towards the 2019 peak surrounding $19.65.
Overall, silver is likely to witness a corrective pullback but the trend reversal is far from here.
Silver: Daily chart
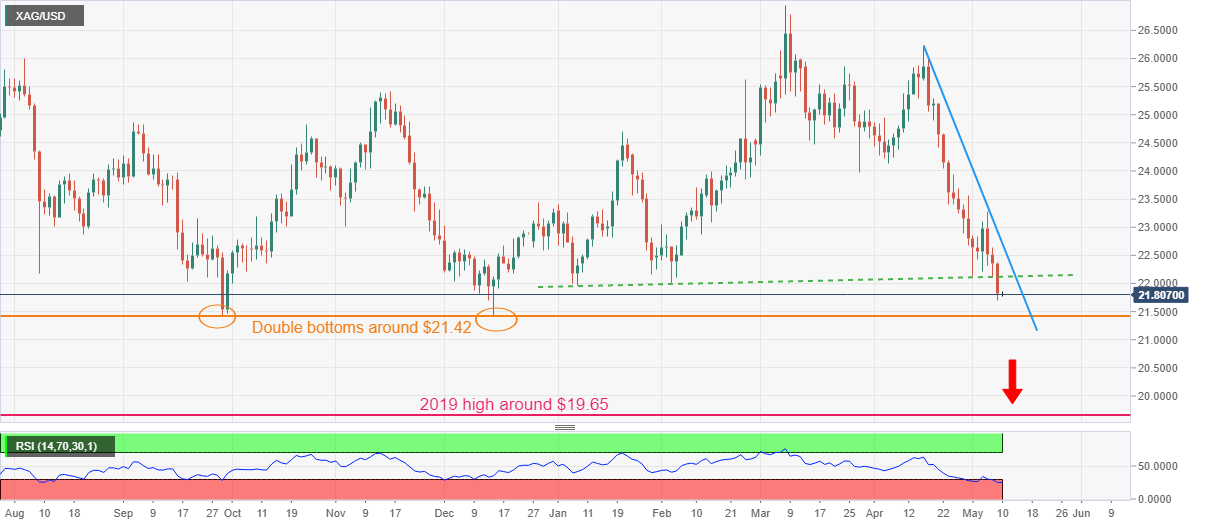
Trend: Corrective pullback expected
Even as inflation and growth concerns are the main catalysts behind the latest risk-aversion in the global markets, the US inflation expectations refreshed multi-day low by the end of Monday’s North American trading session.
Not only that but the 10-year breakeven inflation rate per the St. Louis Federal Reserve (FRED) data also dropped the most since July 2021 while flashing a 2.75% rate at the latest, the lowest levels since March 04.
This could help trigger the much-awaited consolidation in the markets ahead of the US Consumer Price Index (CPI) data for April, scheduled for release on Wednesday, which in turn might ease the pressure on the riskier assets like commodities and Antipodeans.
However, fears emanating from China’s covid conditions and Russia’s rejection to ease pressure in Ukraine may keep the market’s risk-aversion alive.
Read: Forex Today: Fear dominates financial markets
- EUR/JPY is hovering above 137.00 as investors await EURO ZEW Survey-Economic Sentiment.
- The release of BOJ’s monetary policy minutes failed to trigger the yen bulls.
- The mega event of this week will be the speech from ECB’s Christine Lagarde.
The EUR/JPY pair is consolidating in a narrow range of 137.46-137.80 as investors are awaiting the release of Europe’s ZEW Survey-Economic Sentiment, which dictates the deviation between the number of optimistic and pessimistic institutional investors. The ZEW Survey is seen at -41 against the former print of -43. Generally, a negative figure results in more weakness for the shared currency.
On a broader note, the cross has delivered a flat-to-positive performance over the past few weeks. The euro bulls are expecting the phase of stagflation amid galloping inflation numbers due to higher energy bills and other commodity prices. Meanwhile, the inability of the administration in creating jobs has raised concerns over the employment figures. The European Central Bank (ECB) doesn’t seem to paddle its interest rates until the end of the Asset Purchase Program (APP), which is expected to conclude in the third quarter of this year.
Meanwhile, the Japanese yen has failed to bring any actionable move despite the release of the Bank of Japan (BOJ)’s monetary policy minutes on Monday. It is worth noting that the BOJ continued its prolonged ‘neutral’ stance on its monetary policy announced in the last week of April.
This week the mega event will be the speech from ECB’s President Christine Lagarde which is due on Wednesday. The speech from ECB’s Lagarde will provide insights on the likely monetary policy action by the ECB in June.
- USD/CAD bulls take a breather after rising to the highest since November 2020.
- Overbought RSI, monthly resistance line test further upside.
- Pullback remains elusive until staying beyond support-turned-resistance from August.
USD/CAD dribbles around an 18-month high as the bulls battle monthly hurdle during the initial Asian session on Tuesday.
The Loonie pair refreshed the multi-day top on Monday after crossing an upward sloping resistance line from August 2021. The upside momentum, however, failed to cross the one-month-old rising trend line amid nearly overbought RSI conditions.
Hence, the quote is likely to witness a pullback move towards the previous resistance line, around 1.2980, Though, any further downside won’t hesitate to drag the quote towards March’s high of 1.2909.
Even so, 10-DMA and an upward sloping support line from April 21, respectively around 1.2870 and 1.2790, could defend the USD/CAD bulls.
Meanwhile, the pair’s further upside needs a sustained run-up beyond the immediate resistance line, around 1.3030, to approach the 1.3100 threshold.
Following that, the late November 2020 tops near 1.3175 will lure the USD/CAD buyers.
USD/CAD: Daily chart
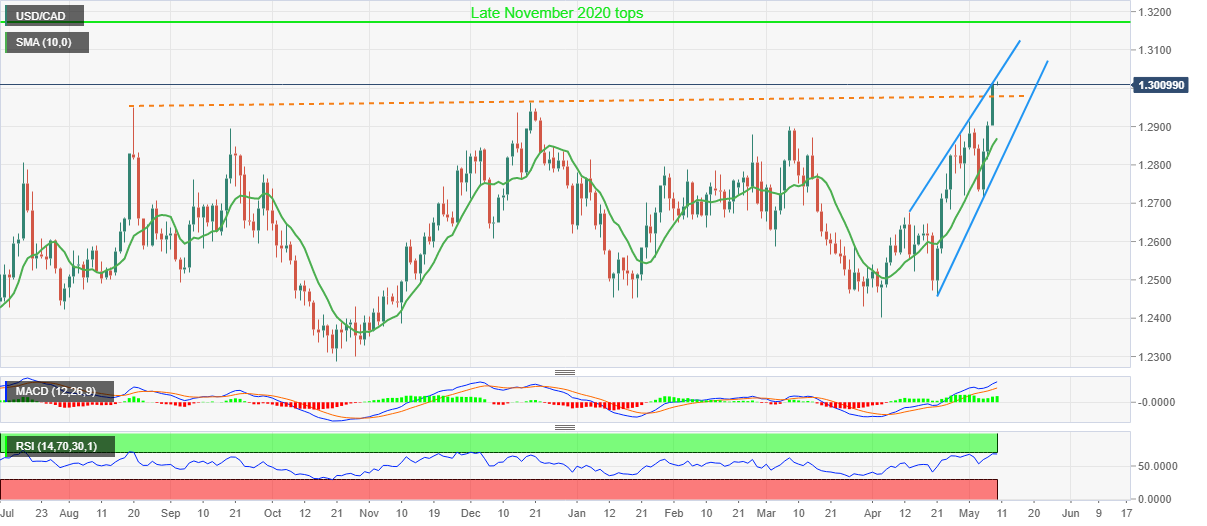
Trend: Pullback expected
- Oil prices have plummeted to near $101.00 on renewed demand worries.
- Investors are ignoring the dubious promise of the OPEC to pump more oil.
- Rising Covid-19 curbs in China has dented the oil demand.
West Texas Intermediate (WTI), futures on NYMEX, has plunged around 7.50% after printing a high of $110.33 last week. Oil prices have faced the heat of strengthening odds of a 75 basis point (bps) interest rate hike by the Federal Reserve (Fed) in June.
The multiplier effects of tight monetary policy have started spreading from risk-perceived currencies to global equities and now to fossil fuel prices. An extremely tight liquidity environment will not only absorb funds from the market but will also trim the growth forecasts. Unavailability of easy money will force the corporate to invest wisely, which will spurt the jobless rate and reduce the aggregate demand, whose effect will be visible on oil prices.
Meanwhile, rising curbs in China to contain the epidemic of the Covid-19 have raised concerns over the current demand for oil. The extreme lockdown measures in Beijing and Shanghai have paused the movement of men, materials, and machines, which have reduced the oil demand vigorously.
Apart from that, investors have shrugged off the oil supply worries after the OPEC+ promised to pump more oil into the global supply. The OPEC cartel has promised to add 432,000 barrels per day (bps), which seems quite dubious as a few nations are unable to produce the desired output while some are near to exhaustion of their production capacities.
- GBP/USD remains sidelined, pressured of late, after dropping to the lowest since June 2020.
- UK’s Truss prepares to drop the Northern Ireland protocol on failed talks with EU.
- Broad risk-off mood, light calendar add strength to the bearish bias.
- UK PM Johnson’s speech will be important to watch along with other qualitative catalysts.
GBP/USD remains on the back foot at around 1.2330, the lowest level since June 2020, despite the latest inaction ahead of the key speech from UK PM Boris Johnson on Tuesday. In doing so, the quote portrays the USD’s strength amid a risk-off mood but fails to respect the latest Brexit headlines suggesting further pessimism at home.
Having witnessed Sinn Fein’s victory in Northern Ireland’s (NI) elections, considered to be a major negative for Brexit as the party aims to rejoin the Irish nation with the old continent, UK Foreign Secretary Liz Truss gave up on Brexit talks with the European Union (EU). The British diplomat is also cited by The Times to brace for dumping a major part of the NI protocol. “Officials working for Truss have drawn up draft legislation that would unilaterally remove the need for all checks on goods being sent from Britain for use in Northern Ireland, the report added,” said Reuters.
Elsewhere, growing concerns over the economic growth, as rallying inflation pushes central bankers towards tighter monetary policies, seemed to have portrayed a stellar show of risk-aversion on Monday. Adding to the sour sentiment were worsening covid conditions in China and Russia’s ignorance of global ire over the invasion of Ukraine.
At home, Bank of England (BOE) external Monetary Policy Committee member Michael Saunders bolstered the rate-hike concerns by suggesting that a neutral rate might be in the 1.25%-2.5% range. The policymaker also added that the UK rates might need to go above neutral if inflation expectations go higher.
Against this backdrop, Wall Street saw the red but the US Treasury yields failed to cheer the risk-off mood, despite refreshing multi-day high earlier on Monday. Further, the US Dollar Index (DXY) rose to the highest in 20-year amid a flight to safety. That said, the S&P 500 Futures lick its wounds with 0.30% gains by the press time.
Moving on, UK PM Boris Johnson’s address to the House of Commons will be crucial to watch as the national leader will unveil Brexit benefits and may touch upon the latest difficulties in talks with the bloc. “The Prime Minister will tell MPs in a Commons debate on the speech that creating ‘high-wage, high-skilled jobs’ is the best way to solve the cost-of-living crisis, saying: ‘That is the long-term, sustainable solution to ease the burden on families and businesses,’” mentioned iNews.
Technical analysis
A bearish spinning top candlestick directs GBP/USD prices towards June 2020 low surrounding 1.2250 while capping the immediate recovery around 1.2410. Also acting as a nearby resistance is the fortnight-long descending trend line around 1.2515.
- Inventory distribution at higher levels advocates a bearish reversal in the asset.
- A bear cross, displayed by the 20- and 50-EMAs reinforces downside filters.
- The RSI (14) has shifted into a bearish range of 20.00-40.00.
The AUD/JPY pair is consolidating around its critical support of 90.43 printed in the last week of April. The cross is falling sharply after printing a high of 94.03 last week. Failing to kiss the round level resistance of 95.00 triggered the Japanese bulls, which dragged the asset lower firmly.
The formation of a Head and Shoulder chart pattern on a four-hour scale has activated a broader weakness in the pair. Usually, the formation of the above-mentioned chart pattern signals a prolonged inventory distribution in which institutional investors shift their inventories to the retail participants.
A bear cross, represented by the 20- and 50-period Exponential Moving Averages (EMAs) at 92.60 adds to the downside filters.
Also, the momentum oscillator, Relative Strength Index (RSI) (14) has shifted from a consolidation range of 40.00-60.00 to a bearish range of 20.00-40.00, which indicates a fresh bearish impulsive wave going forward.
A decisive drop of the asset below the April 26 low at 90.45 will drag the cross towards April 22 low at 88.40, followed by March 11 high at 85.89.
On the flip side, aussie bulls could regain strength if the asset oversteps previous week’s high at 94.03. The occurrence of the same will send the cross towards April’s high and round level resistance at 95.75 and 97.00 respectively.
AUD/JPY four-hour chart
-637877327150094170.png)
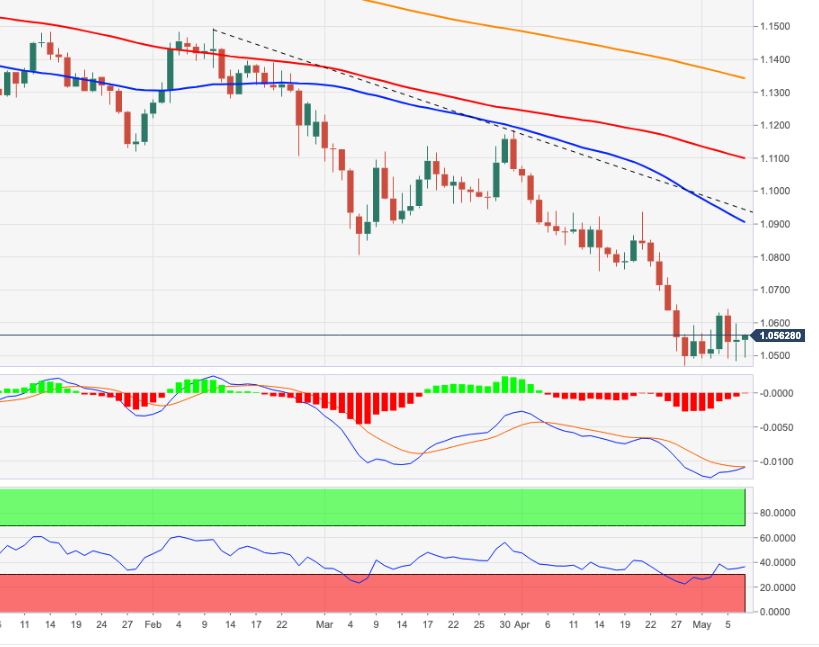
- EUR/USD holds onto the one-week-old bearish consolidation below six-week-long resistance line.
- Steady RSI sustained trading below 100-SMA adds strength to the downside bias.
- Clear break of 1.0490 acts as a trigger for notable declines, 1.0650 may lure intraday buyers.
EUR/USD remains sidelined at around 1.0550, keeping the weekly bear flag intact during Tuesday’s initial Asian session.
Unlike other major currency pairs that lost heavily against the US dollar in the recent risk-off play, the EUR/USD stayed inside a one-week-old rising trend channel after dropping over 450 pips during late April. In doing so, the quote portrays a bear flag chart pattern suggesting the further downside.
Other than the bearish formation, steady RSI and sustained trading below the key resistances, namely 100-SMA and a downward sloping trend line from March 31, keep EUR/USD bears hopeful.
However, a clear downside break of the flag’s support, around 1.0490 by the press time, becomes necessary for the show of south-run targeting the theoretical point around 1.0000. During the fall, lows marked in 2017 near 1.0340 may act as a buffer.
Alternatively, recovery moves may initially aim for the confluence of the stated flag and the 100-SMA, around 1.0650.
Following that, the aforementioned resistance line from March 31, close to 1.0730, will be in focus.
EUR/USD: Four-hour chart
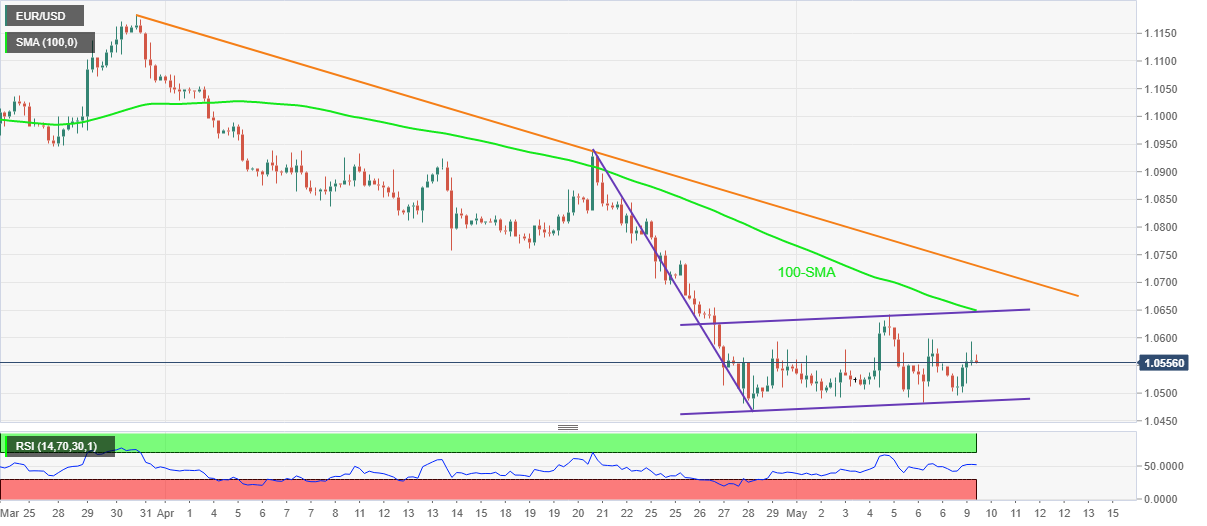
Trend: Further weakness expected
- AUD/USD remains pressured at the lowest levels in nearly two years as risk-aversion dominates.
- Growing concerns that higher inflation and tighter monetary policies will weigh on economic growth favored bears.
- Headlines from China, Russia offered additional clues to spread the pessimism.
- Aussie NAB Sentiment data, Fedspeak may entertain traders but risk catalysts are the key ahead of Wednesday’s US CPI.
AUD/USD bears keep reins around 0.6950, the lowest levels since July 2020, after heavy risk-off mood pressured the pair towards printing a three-day downtrend to test a multi-month low. That said, the Aussie pair trades sideways during the initial hours of Tuesday, following the notable downside portrayed on Monday.
Boosting the market’s fear were growing concerns over the economic growth as inflation pushes central bankers towards tighter monetary policies. Also contributing to the sour sentiment, as well as weighing on the risk-barometer pair, were worsening covid conditions in China and Russia’s ignorance of global ire over the invasion of Ukraine.
A softer import of metals by China and further tightening of activity restrictions in Shanghai, as well as Beijing, due to the faster spreading coronavirus variant, signaled further challenges for the global supply chain and the hardships for commodity prices. Iron ore, Australia’s key export dropped more than 6.0% and contributed to the AUD/USD pair’s slump the previous day.
Elsewhere, Russia’s victory parade pushed traders towards expecting further geopolitical hardships in Ukraine as Moscow expects “results of special operations”, showing no readiness to curtail the military operations despite Western sanctions.
Also adding its part to the AUD/USD pair’s declines were mostly hawkish comments from the Fed policymakers. Richmond Fed President Thomas Barkin kept the 75 bps rate hike on the table while Atlanta Fed’s Robert Bostic promoted a series of 50bps rate lifts.
Amid these plays, Wall Street saw the red but the US Treasury yields failed to cheer the risk-off mood, despite refreshing multi-day high earlier on Monday. Further, the US Dollar Index (DXY) rose to the highest in 20-year amid a flight to safety.
Moving on, the National Australia Bank’s (NAB) Business Confidence and Business Conditions for May will direct short-term AUD/USD moves ahead of the comments from the scheduled Fed speakers. However, major attention will be given to how the traders react to the fears of rising inflation and growth, as well as headlines from China and Russia. That said, the NAB Business Confidence is expected to ease to 14 from 16 whereas the Business Conditions may rise from 18 to 23.
Technical analysis
With a clear downside break of the yearly low surrounding 0.6965, AUD/USD becomes vulnerable to testing June 2020 bottom near 0.6775. During the fall, the 0.6900 and 0.6800 round figures may offer intermediate halts.
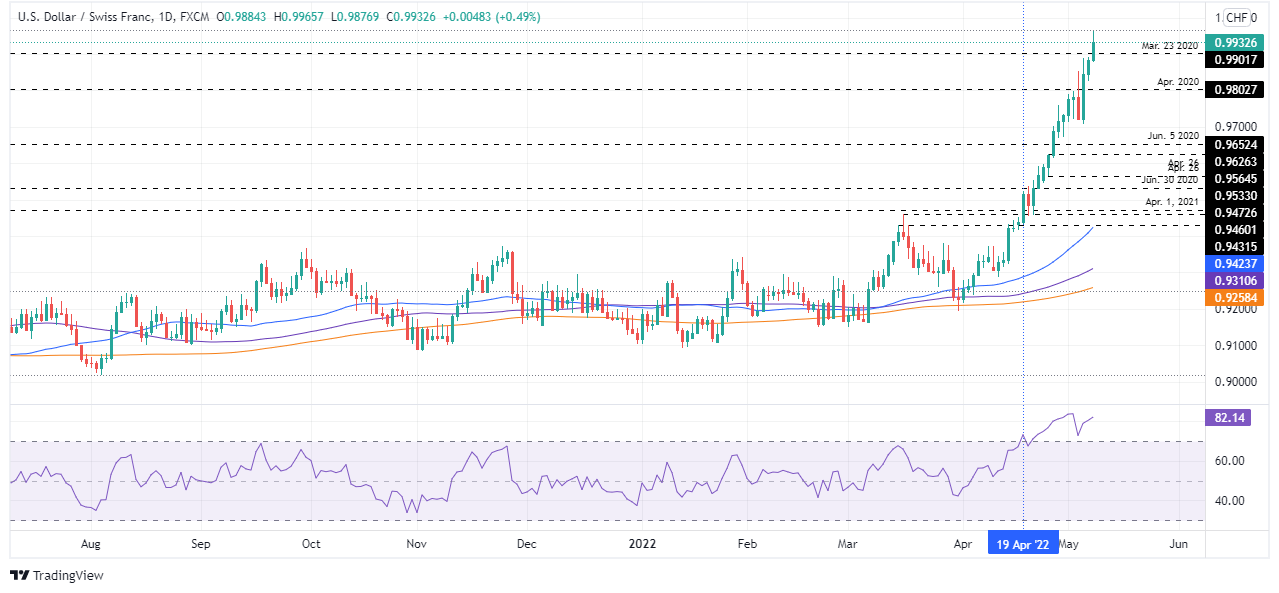
- USD/CHF is hovering around 0.9335 as the chances of a 75 bps rate hike have trimmed.
- The Swiss franc is underperforming on flat jobless rate and CPI numbers.
- The Fed has already hiked its rates by 75 bps in the last two monetary policies.
The greenback bulls are taking some rest after a juggernaut rally from a low of 0.9709, recorded last week. The USD/CHF pair has witnessed a sheer upside move right from the initial trading session of April. The momentum remained continued in the asset amid broader strength in the US dollar index (DXY) backed by a shift in the focus from releasing helicopter money to liquidity tightening policy.
The Federal Reserve (FED) has chosen the path of liquidity contraction from the economy to tame the galloping inflation. To address the same, the Fed has already hiked its interest rates by 75 basis points (bps) in the last two monetary policy announcements. Recently, investors were expecting a 75 bps rate hike in one go by the Fed in June’s policy. This triggered a negative market sentiment and investors were dumping the risk-sensitive currencies.
However, Atlanta Fed President Raphael Bostic has shrugged off the expectations of a 75 bps rate hike after stating that the Fed's most recent 50 bps rate hike was an "aggressive" move and that the Fed can stay at this pace.
Meanwhile, the demand for the Swiss franc has been dented after the economy reported flat Unemployment Rate and Inflation numbers last week. The former landed at 2.2% while the latter printed at 2.5%, both in line with the market consensus.
- The US dollar sits just below its 20-year high.
- The Fed sentiment and global growth concerns are underpinning safe-haven US dollars.
The US dollar reached a new 20-year high as traders moved out of risk assets due to ongoing worries over global growth following further poor Chinese data.
The concerns over the Federal Reserve's ability to combat high inflation boosted the greenback's safe-haven appeal as well. Also contributing to the defensive tone was the ongoing war in Ukraine and concerns about rising COVID-19 cases in China.
The dollar index (DXY) slipped to a low of 103.392 after touching 104.19, its highest level since December 2002 as equities remained under heavy selling pressure as concern about inflation and the demand outlook weighed.
US equities did not perform well with the S&P 500 ending below 4,000 for the first time since March 2021 and the Nasdaq dropped more than 4% in a selloff led by mega-cap growth shares as investors grew more concerned about rising interest rates. The yield on the US 10-year note eased 6.3bps to 3.063% despite the expectations the Fed will be aggressive in attempting to tamp down inflation.
On Monday, Minneapolis Fed President Neel Kashkari said the US central bank may not get as much aid from easing supply chains as it is hoping for in helping to cool inflation.
Atlanta Fed President Raphael Bostic said he already sees signs of peaking supply pressures and that should give the Fed room to hike at half-percentage-point interest rate increments for the next two to three policy meetings, but nothing bigger.
US dollar technical analysis
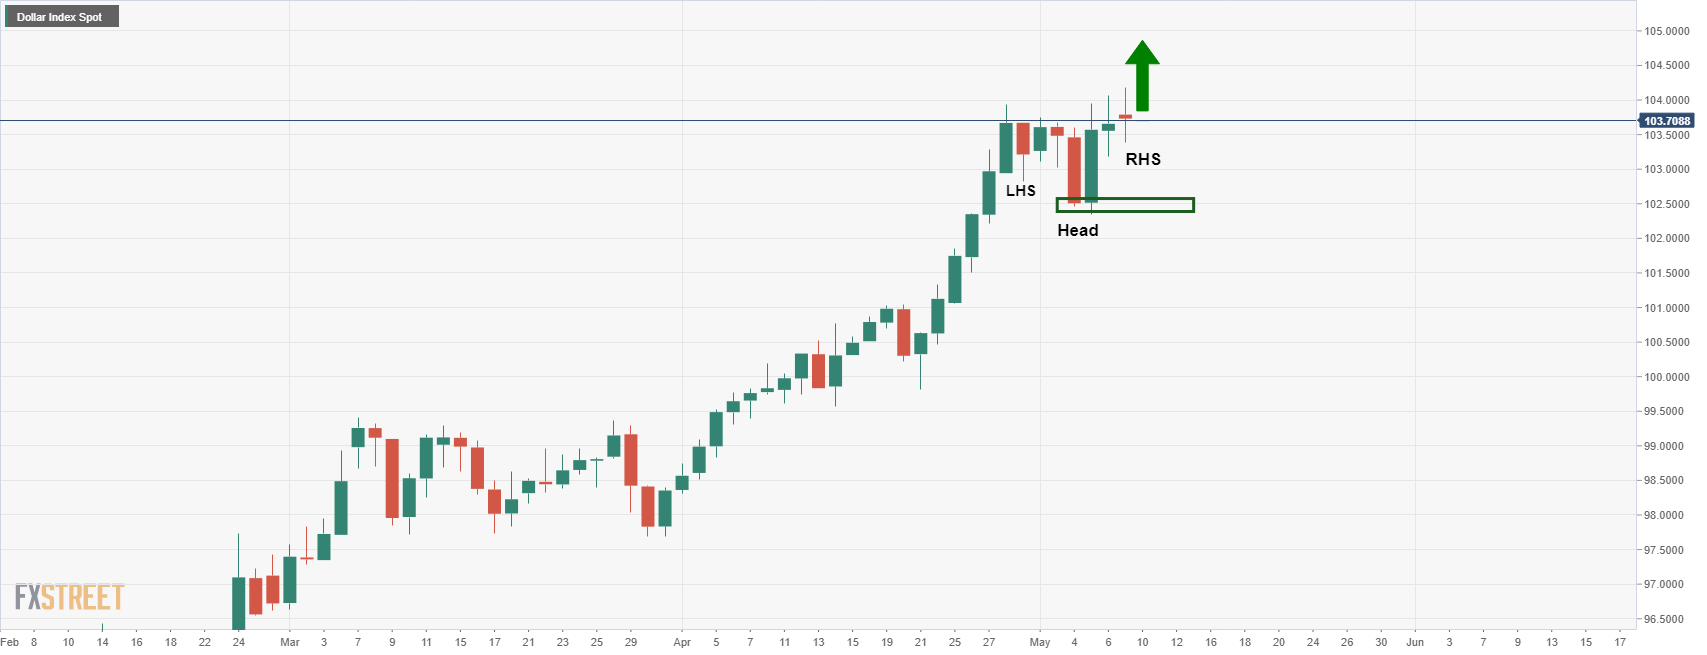
The price is forming a bullish inverse head and shoulders on the daily chart.
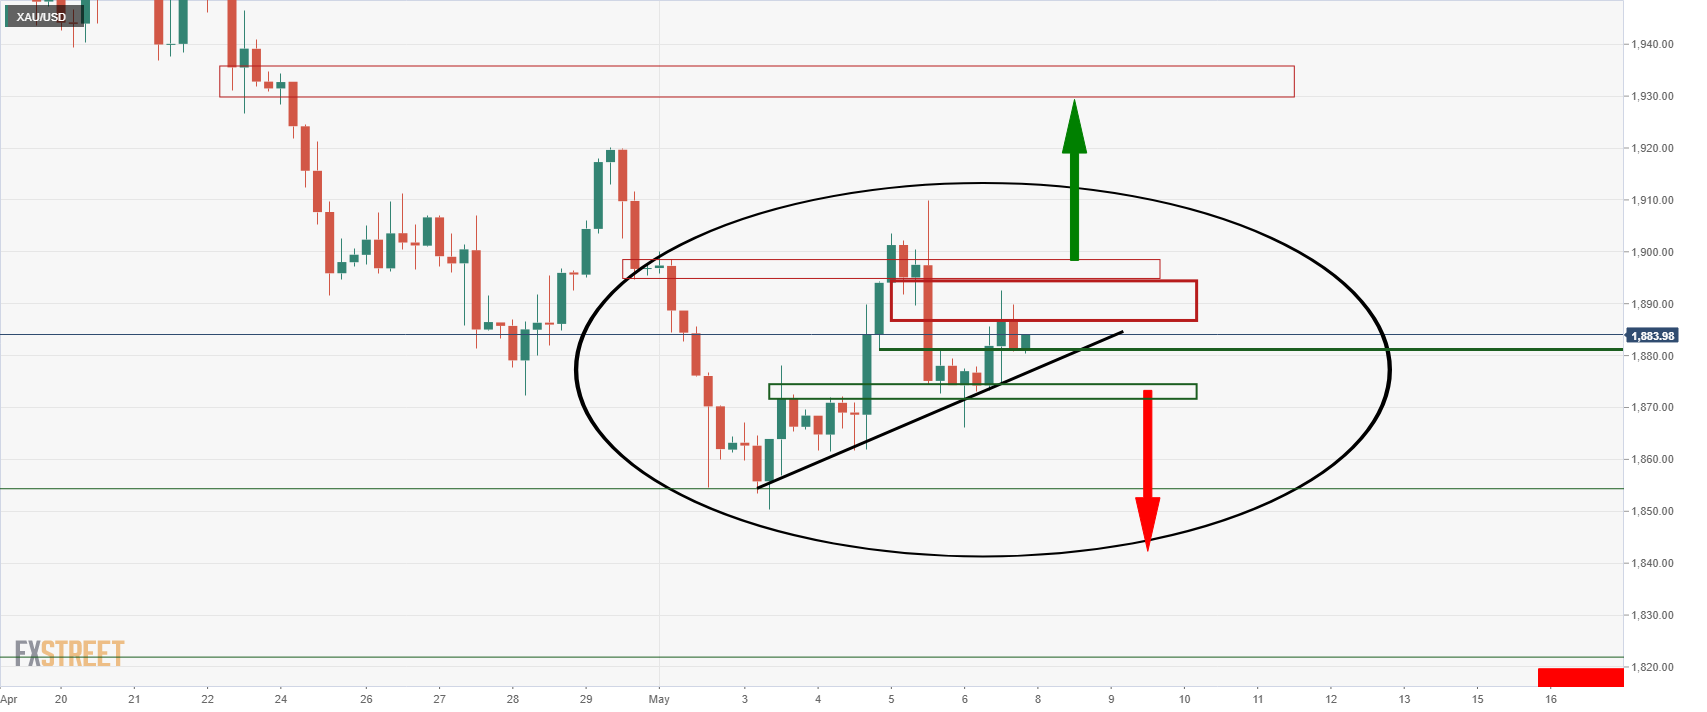
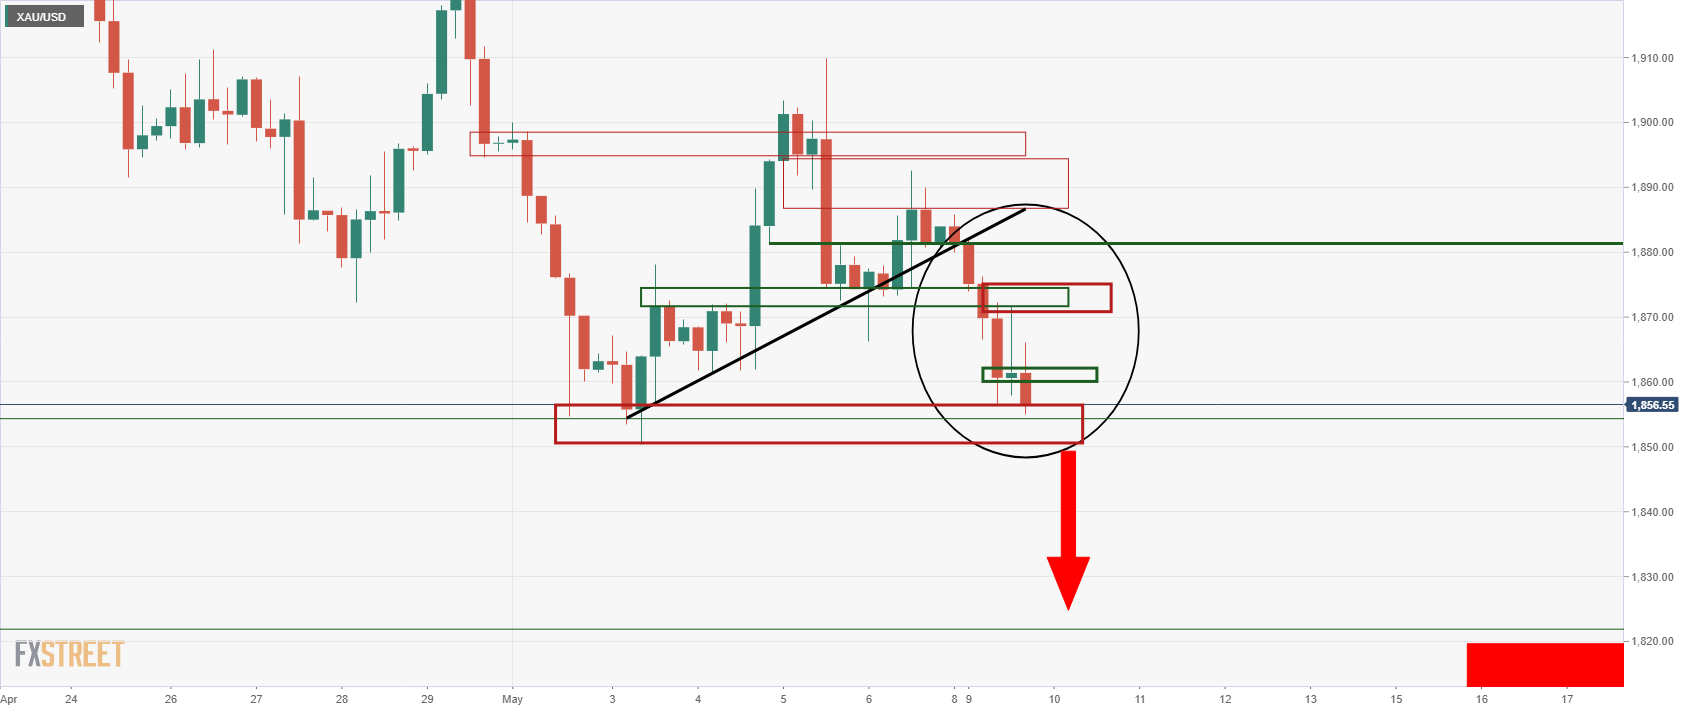
- Gold price has tumbled to near $1,850.00 on rising odds of a jumbo rate hike by the Fed.
- The market participants may get divided on upbeat NFP and lower inflation forecasts.
- Descending EMAs and weak RSI (14) are indicating more downside for the yellow metal.
Gold Price (XAU/USD) has witnessed a minor bounce after slipping near the previous week’s low at $1,850.47. A minor responsive buying has been observed yet but value buying can drive the asset higher. The bright metal has displayed a sheer downside on Monday amid broader strength in the US dollar index (DXY).
Investors are aware of the fact that upbeat US Nonfarm Payrolls (NFP) has bolstered the odds of a rate hike by the Federal Reserve (Fed) in June. The US Bureau of Labor Statistics disclosed 428k job additions in the labor force against the expectations of 391k. Higher job creation has signaled a tight labor market that may compel the Fed to come forward with one more 50 basis points (bps) interest rate hike. On the other hand, US inflation is seen lower at 8.1% against the multi-decade high of 8.5%. A lower US inflation print could dictate not so aggressive monetary policy by the Fed.
Considering the rally in the DXY, it is very much clear that investors are underpinning an upbeat NFP rather than a softer Consumer Price Index (CPI).
Gold technical analysis
The precious metal is hovering near its critical support which coincides with January’s high and the previous week’s low at $1,854.20. The 20- and 50-period Exponential Moving Averages (EMAs) at $1,872.84 and $1,883.61 respectively are sloping downwards, which adds to the downside filters. Meanwhile, the Relative Strength Index (RSI (14) has slipped below 40.00, which signals a firmer downside move ahead.
Gold four-hour chart
-637877291605024438.png)
- NZD/USD pressured to test 0.6320 support as US dollar firms.
- US stocks close in a sea of red on global growth fears.
NZD/USD is ending on Wall Street in the red, a touch below flat but making a fresh low for the day following a fresh surge in the greenback. The bird is on the verge of a break of 0.6320 support at the time of writing to open the way for a run to test 0.63 the figure.
Bears have moved in as US yields attempt to establish a floor following a slide at the start of New York's day. However, equities did not perform well with the S&P 500 ending below 4,000 for the first time since March 2021 and the Nasdaq dropped more than 4% in a selloff led by mega-cap growth shares as investors grew more concerned about rising interest rates.
''Weaker growth and high inflation remain the primary concerns and their impact has been bluntly but savagely felt across asset markets and commodities, with oil prices sinking despite Russia not backing down on its invasion of Ukraine thanks to softening resolve on sanctions by the European Union, and Saudi Arabia cutting prices,'' analysts at ANZ Bank explained.
''So it’s all still very global and local factors are only playing a role at the fringes. As time goes on, market fears of a deeper correction lower continue to percolate; that’s weighing on sentiment. A move to 0.6230 (61.8% Fibo of the 2020/21 0.5470/0.7465 rally) would be a disaster.''
Meanwhile, an ear is being kept to the ground for Federal Reserve speakers as well. On Monday, Minneapolis Fed President Neel Kashkari said the US central bank may not get as much aid from easing supply chains as it is hoping for in helping to cool inflation.
Atlanta Fed President Raphael Bostic said he doesn't see the case for 75bps hikes yet. He already sees signs of peaking supply pressures and that should give the Fed room to hike at half-percentage-point interest rate increments for the next two to three policy meetings.
- USD/CAD is 0.8% higher as the US dollar firms into the close on Wall Street.
- CAD is at the lowest level since Nov 2020 amid rising worries about the global economic outlook.
USD/CAD is ending on Wall Street in the green by some 0.8% following a final thrust to the upside in the US dollar. This has taken the Canadian dollar to its lowest level since November 2020 amid rising worries about the global economic outlook that has weighed particularly heavily on commodity-linked currencies.
The price of oil, one of Canada's major exports, settled 6.1% lower at $103.09bbls following yet further poor economic data out of the Middle Kingdom and considering that China's two largest cities tightened COVID-19 curbs.
Meanwhile, the Bank of Canada Deputy Governor Toni Gravelle is due to speak on Thursday and there will be ears to the ground for Federal Reserve speakers as well. On Monday, Minneapolis Fed President Neel Kashkari said the US central bank may not get as much aid from easing supply chains as it is hoping for in helping to cool inflation.
Atlanta Fed President Raphael Bostic said he doesn't see the case for 75bps hikes yet. He already sees signs of peaking supply pressures and that should give the Fed room to hike at half-percentage-point interest rate increments for the next two to three policy meetings.
As for the Bank of Canada, money markets expect the central bank to raise its benchmark rate by half a percentage point for a second straight policy meeting on June 1. Meanwhile, Canadian government bond yields have pulled back from fresh multi-year highs, tracking the move in US Treasuries. The 10-year touched its highest since May 2011 at 3.173% before sliding to 3.028%, down 9.7 basis points on the day.
What you need to take care of on Tuesday, May 10:
Risk aversion took over financial markets at the beginning of the week. Global stocks edged lower, while government bond yields soared during European trading hours, giving up some ground ahead of Wall Street’s close.
The dismal mood came from the usual suspects. High inflation levels, increasing coronavirus cases, and tensions in Eastern Europe all contributed to the run to safety.
The American dollar ended the day mixed but generally stronger. The worst performers were commodity-linked currencies, as gold and oil prices were sharply down. The AUD/USD pair fell to a fresh multi-year low of 0.6974, while USD/CAD approaches 1.3000, trading at levels last seen in December 2020. Meanwhile, spot gold trades around $1,854 a troy ounce while WTI settled at $102.70 a barrel.
The EUR/USD pair fell to 1.0494 but managed to trim losses, ending the day with modest gains in the 1.0560 price zone.
GBP/USD is unchanged at 1.2340. Bank of England external Monetary Policy Committee member Michael Saunders said a neutral rate might be in the 1.25%-2.5% range, adding that UK rates might need to go above neutral if inflation expectations go higher.
In the US, Federal Reserve member Raphael Bostic said that a 75 bps rate hike has a low probability, but added that he is not taking anything off the table. Anyway, he said that he sees two or three 50 bps rate hikes as a baseline.
Across the Pond, European Commission President Ursula von der Leyen noted that they keep making progress on a Russian oil embargo but still need to secure energy resources for the region.
Solana price continues to tank despite Instagram NFT support for NFTs
Like this article? Help us with some feedback by answering this survey:
- Bullish tones emerging on the EUR/USD daily and weekly charts.
- Bulls on the lookout for a bullish engulfing close in the week that follows the Doji close of last week.
EUR/USD is back on the bid in late midday afternoon on Wall Street, trading 0.23% higher to 1.0570 at the time of writing. The pair was under pressure from the peak of the day at 1.0592 but it held above the 1.0495 lows.
There is little in the way that is driving the price other than ebbs and flows within an hourly consolidation between a 200 pip range, or thereabouts. More broadly, risk sentiment has weighed heavily on the euro stemming from the Ukraine crisis and now with the Chinese COVID risks and negative contagion ramifications for global growth.
Overnight, APAC stocks declined amid recent upside in yields and as participants digested a slowdown in Chinese trade data. ''Activity is grinding to a halt under Xi’s COVID Zero policy. Despite pledges to stimulate the economy, the measures announced so far have been minimal,'' analysts at Brown Brothers Harriman explained.
In the currency space, DXY remained firm against G10s across the board as equity futures pointed to soft open in European markets. The Federal Reserve's path to a series of interest rate increases has weighed on sentiment in the face of a potential global recession and given the proximity to the Ukraine crisis, the eurozone's economy is under scrutiny. Additionally, pressure on the EU to announce an energy embargo on Russia has raised questions about the economic cost to the region.
Consequently, EUR/USD sank to 1.04955 in Europe but US yields came under pressure after the benchmark 10-year note hit fresh 3-1/2 year highs as traders awaited consumer price data and the auction of $103 billion in new government debt later this week.
Ten-year Treasury yields fell 4.1 basis points to 3.083%, after hitting 3.203%, a level last seen in November 2018. The short-covering in the bond market has consequently seen the early EUR/USD dip below 1.0520 was bought and the single currency neared 1.0600.
EUR/USD technical analysis
Technically, upside risks could be emerging with the daily dojis at weekly support.
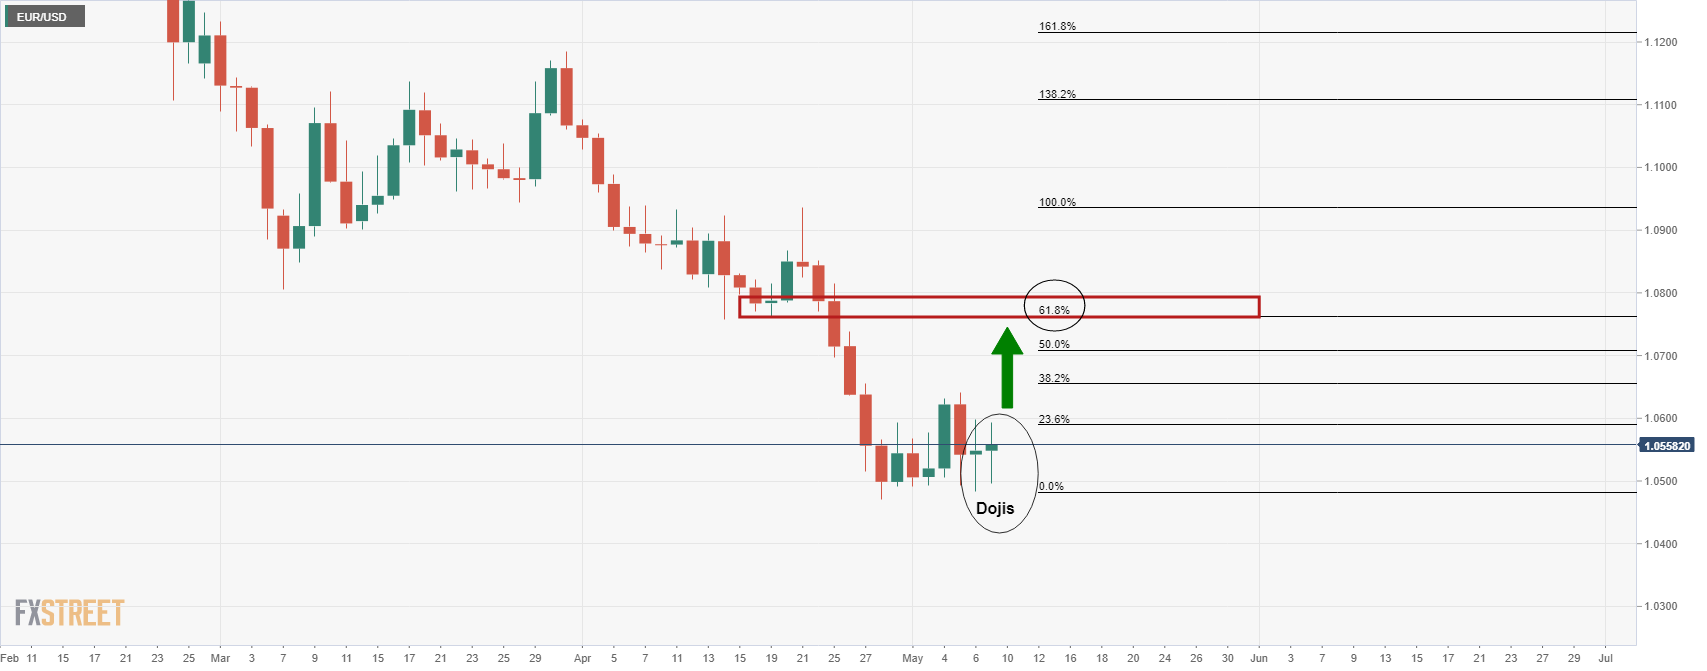
EUR/USD weekly chart
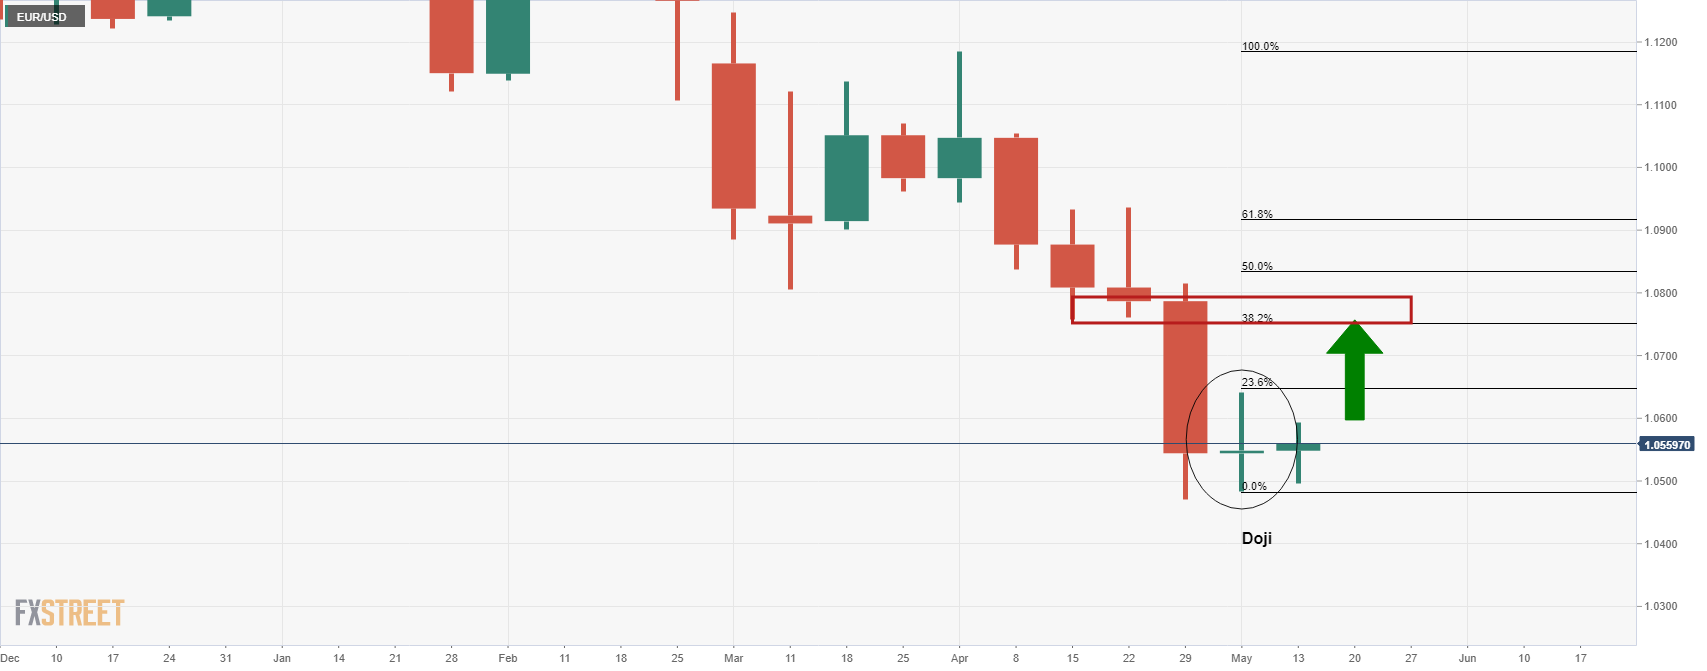
However, for a convincing bullish outcome, bulls will be on the lookout for a bullish engulfing close in the week that follows the Doji close of last week.
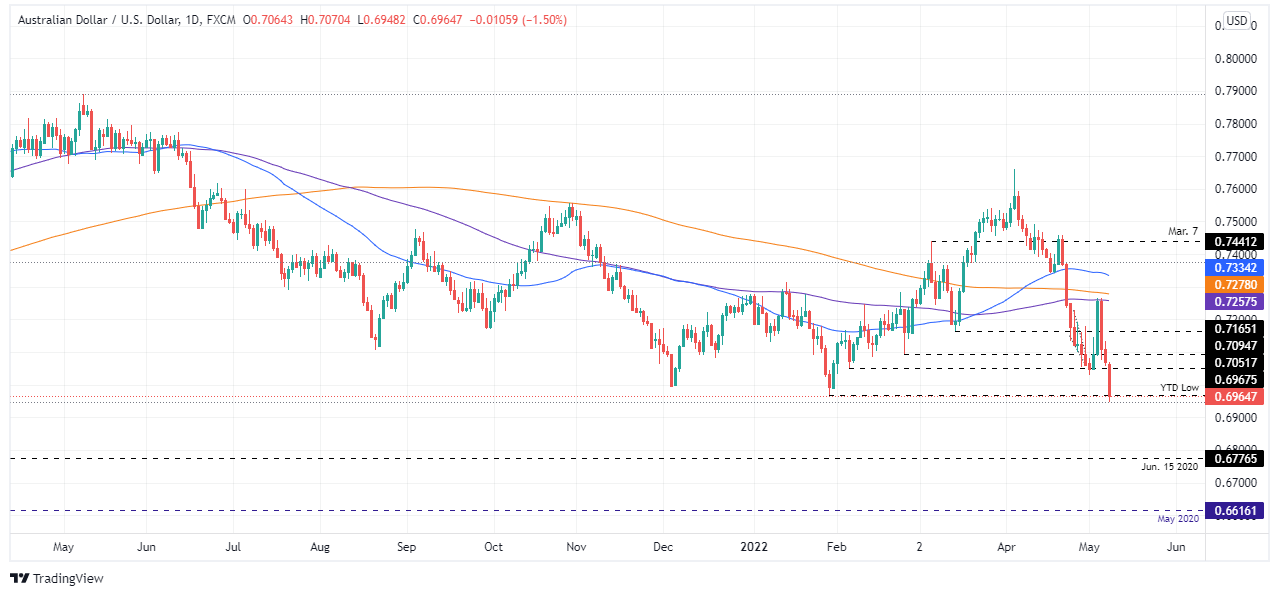
- On Monday, the AUD/USD recorded losses for the third straight trading session of 1.50%.
- A dismal market mood and China’s Covid-19 zero-tolerance policy are a headwind for the AUD/USD.
- AUD/USD Price Forecast: To aim towards 0.6500, once AUD/USD bears break the 0.7000 figure.
The Australian dollar slumps towards near two-year lows levels, which were last seen in July 2020, below the 0.7000 threshold, amidst a dismal market mood. At the time of writing, the AUD/USD is trading at 0.6964.
The market mood remains negative, as shown by US equities recording substantial losses amidst a high US bond yield Treasury environment as traders question whether the Fed would be able to tackle inflation without spurring a recession. Alongside China’s continuing Covid0-19 crisis, which already hurt PMIs, and its exports added a pinch of salt to the already battered global economic slowdown. Also, the Ukraine-Russia jitters remained in the backdrop as market players await a resolution of the conflict.
Meanwhile, since the end of the last week, Fed speakers began to cross wires. On Monday, Atlanta’s Fed President Raphael Bostic said that he sees two or three 50-bps increases as a baseline but reiterated that he is open to adjusting. Bostic added that risks are two-sided, and the economy could go multiple ways. He said 75-bps rate hikes are not his baseline, but he’s not taking anything off the table. The Atlanta Fed Q2 GDPNow tracker reduced the expectations of US growth from 2.0% to 1.8%.
On the Australian side, Business and Consumer Confidence, Retail Sales, and RBA’s Bullock speech could shed some light regarding the Australian economy.
In the week ahead, the US economic docket would reveal on Tuesday, Retail Sales, followed by Wednesday’s inflation figures and Friday’s Consumer Sentiment. As global economic growth threatens to be disrupted by China’s Covid-19 zero-tolerance policy and central bank tightening, AUD/USD traders need to be aware of the previous-mentioned data.
AUD/USD Price Forecast: Technical outlook
The AUD/USD is severely downward pressured and once broke below the 0.7000 figure, opened the door for further losses. In the MACD-histogram, albeit showing a positive divergence, the MACD-line aims lower, widening its distance from the signal line, further cementing the downward bias.
The AUD/USD first support would be June 2020 swing low at around 0.6776. Break below would expose the May 2020 swing highs around 0.6616. Once cleared, the next support would be 0.6500.
Key Technical Levels
- Gold is under pressure at the start of the week, heading towards last week's low with 200 DMA eyed.
- The US dollar made a fresh 20-year high at the start of the week in a risk-off setting.
- The Fed, Ukraine and China COVID crisis is weighing on risk sentiment.
The price of gold remain in the hands of the bears as the US dollar surged to print a new 20-year high at the start of the week. At $1,857, XAU/USD is lower by some 1.38% at the time of writing. The US dollar is off the highs for the day, as per DXY 104.187, but is finding some support in mid-day New York trade, currently climbing from the 103.392 lows and back to being flat for the day so far.
The nuts and bolts of the market sentiment stem from the risks associated with China's COVID crisis, the Ukraine crisis, supply chain risks and what this all now means for commodity prices and the central bank reaction function in global monetary policy.
Markets are anticipating a series of interest rate hikes from the US Federal Reserve and a global economic growth slowdown which has been supporting the US dollar. The dollar has risen for five straight weeks as US Treasury yields have climbed on expectations the Fed will be aggressive in attempting to tamp down inflation with no Fed pivot in sight which is a negative risk for the medium term.
The Fed last week raised rates by 50 basis points as it seeks to lower inflation without tilting the economy into a recession. 75 bps expectations were dialled down by the Fed chairman, Jerome Powell, which initially hurt the greenback. However, the market pivoted the very next day and the greenback soared to what was at the time, a fresh 20-year high in anticipation of a solid labour market report.
Indeed, on Friday, a solid jobs report cemented expectations for more rate hikes although due to lower wage inflation vs expectations, the prospect of 75bps rate hikes remains off the table. With that being said, the US inflation data will now be the next key data event.
''Core prices likely stayed strong in April, regaining momentum to 0.5% MoM after recording 0.3% in March,'' analysts at TD Securities said. ''While used vehicles prices likely declined again, they probably fell less sharply than in the last report. We also look for renewed strength in shelter inflation. Our MoM forecasts imply 8.1%/6.1% YoY for total/core prices, likely confirming March was the peak of the cycle.''
Yields on most US Treasury notes have actually pared early gains to trade lower on Monday after the benchmark 10-year yield hit fresh 3-1/2-year highs as inflation fears continue to weigh on risk sentiment. The S&P 500 index down more than 2.7% as growth stocks were again pulled lower by climbing Treasury yields also.
Nevertheless, there is an exodus in gold taking shape and analysts at TD Securities argue that ''gold prices need only close below $1,875/oz to catalyze a substantial selling program that could send the yellow metal below the psychologically important 200dma range.''
Gold technical analysis
As per the pre-open analysis, Gold, Chart of the Week: Bears eye a break of critical $1,875, the level has been well and truly compromised and the bears are moving in on last week's low of $1,850.
From a 4-hour perspective, the price has broken the first layers of support which opens risk of significantly lower prices for longer:
(Above, Pre-open analysis)
Gold, live H4 chart
As illustrated, the price has respected the pre-open analysis of the resistance and support structures while it melts away to the downside towards the prior week's low. The market is currently around $5.00 short of the $1,850 week low.
The price action has also left behind a bearish head & shoulders chart pattern and a restest of the counter trendline would be expected to be met with supply. The near-term resistance, $1,861 is proving resilient so far. The 200 dma is located at $1,835.
- The USD/CHF consolidates around 0.9930s, up 0.47% in the day as traders prepare to attack the parity.
- Elevated US Treasury yields and a risk-off mood boost the greenback.
- USD/CHF Price Forecast: Negative divergence between RSI’s and price action might open the door for a dip towards 0.9700.
The USD/CHF retreated from YTD highs around 0.9960s as traders got ready to launch an assault toward the parity, but a negative market mood and USD traders booking profits were the main reason that kept the USD/CHF around the 0.9900 mark. At the time of writing, the USD/CHF is trading at 0.9932.
Monday’s headline lies in high US Treasury yields, as the 10-year benchmark note struck a four-year high in the last week, though as of writing sits at 3.075%. Furthermore, China’s exports slowed to single digits, the weakest in almost two years, as tighter and wider coronavirus curbs halted factory production and crimped domestic demand, adding to broader economic woes.
On Monday, the USD/CHF opened in the Asian session below the 0.9900 mark, but market sentiment increased appetite for the greenback, which pushed above the R2 daily pivot at 0.9930, just shy of the R3 pivot point at around 0.9970.
USD/CHF Price Forecast: Technical outlook
The USD/CHF daily graph maintains the pair as upward biased, though USD/CHF traders taking profits caused a slight dip toward 0.99030s. The Relative Strength Index (RSI), around 82.29, aims slightly down, meaning that a negative divergence between RSI and price action will happen.
The USD/CHF first support would be 0.9900. Break below would expose essential demand levels, like April 2020 swing high at around 0.9802, followed by 0.9700. Upwards, the major’s first resistance would be, May 9 daily high at 0.9965. A breach of the latter would expose the parity.
Federal Reserve Raphael Bostic has crossed the wires with some important insight for monetary policy in the US and has stated that a 75 bp rate hike is not his baseline although he is not taking anything off the table.
He stated that a 75 bp rate hike is a low probability but if things turn that may be needed. Currently he is looking month to monthly moves on inflation and argues that there are some recent signs that inflation is not accelerating, ''that's a good thing.''
Key quotes
- Business leaders are grappling with uncertainty.
- Business leaders see strong demand.
- Business leaders are worried that prices will get so high people will stop buying.
- So far they have been able to pass through prices.
- Businesses are having a hard time finding workers.
- We will be watching what fraction of businesses go to plan b to transition to a new approach.
- See 2 -3 50 bps rate hikes as baseline.
- While that's what i expect, will be open to adjusting.
- Supply chain challenges are starting to show signs of easing.
- Trucking companies no longer turning down requests because of capacity issues.
- See hope that supply chain problems may be unwinding.
- If easing in supply chain continue, that should reduce upward pressure on prices.
- The pandemic has triggered some significant structural changes in economy.
- There is still a lot of uncertainty to the downside as far as demand.
- We don't know how people will respond to high inflation envt; they could retrench.
- I am going to stay open to possibility that inflation will be approaching policy target at a faster pace than other colleagues project.
- If so we would not need to do as much.
- I think Fed chair was trying to say that inflation is too high, need to remove accommodation in purposeful, intentional way.
- Our policy rate has to respond more aggressively than historically.
- 50 bps rate hikes in successive meetings is aggressive by historical standards.
- Hopeful that will do the job in getting inflation closer to target.
- The goal is to get on steady course back to 2% inflation.
- Businesses feel pressures are not getting worse, and possibly better, on inflation.
- It's not necessary for wages to stop growing.
- Wage growth is in part a reset to catch up to past inflation.
- If inflation slows, wage growth should slow.
- There's a lot of momentum in labor market; I am not hearing contacts are even close to laying people off.
- If we start to see signs that businesses are thinking about reducing forces, that would be quite meaningful.
Market implications
Meanwhile, the US dollar was higher on Monday and was reaching a twenty-year high as US Treasury yields have climbed on expectations the Fed will be aggressive in attempting to tamp down inflation.
- US dollar losses strength as US yields drop from multi-year highs.
- DXY hits fresh lows on American hours, backs away from the fresh multi-year high.
The USD/JPY rose earlier on Monday to 131.34, reaching the highest level since 2002 and then lost strength. During the American session, it turned to the downside and recently accelerated falling to 130.09, the lowest since early Friday.
The pair is hovering around 130.35, modestly lower for the day. It moved far from the peak after suffering another failure holding above 131.00 showing difficulties extending the rally. A sign that could be suggesting some consolidation or a correction ahead. So far the downside has been limited to 130.10. The next support stands at 129.70 and then 129.30. A daily close bell above 131.00 should open the doors to more gains.
When USD/JPY peaked on Monday US yields reached fresh multi-year highs. As the decline in stock markets continue, demand for Treasuries improved, sending yields lower. The US 10-year fell from 3.20% to 3.07%. The moved weighed on the dollar that lost momentum.
The Dow Jones is falling by 1.39% and the Nasdaq by 3.12%. In Europe, the CAC 40 lost 52.75% and the DAX 2.15%. The risk aversion environment helped the dollar more than the yen during most of the trading hours, but as US yields pull back, the scenario is changing, favoring the yen.
Technical levels
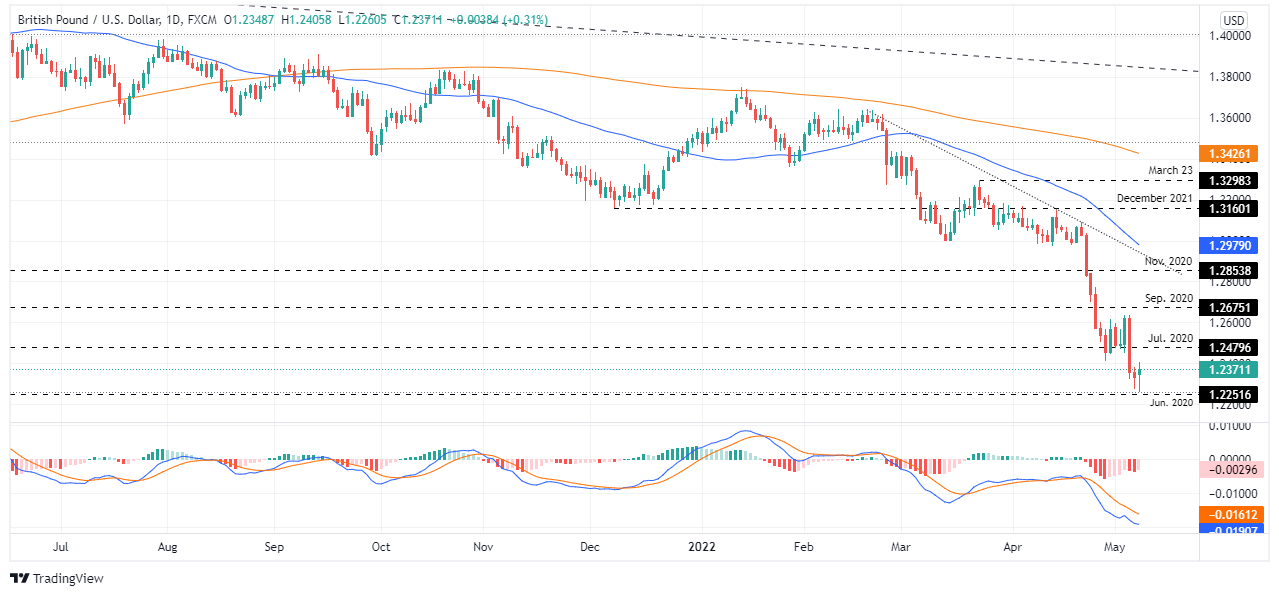
- The GBP/USD is rising some 0.33% on Monday, snapping three consecutive days of losses.
- Headwind for the GBP/USD, a dampened market mood, and high US Treasury yields.
- GBP/USD Price Forecast: It is still downward biased but could shift to neutral-downwards.
The British pound recovered some ground despite a risk-off environment in the financial markets, while the greenback reached a 20-year high around 104.187 as market players flew towards safe-haven peers. At the time of writing, the GBP/USD is trading at 1.2373.
Risk-sentiment and elevated US Treasury yields boost the greenback
Global equities are trading on the backfoot while rising US Treasury yields underpin the greenback. The sentiment dampened courtesy of China’s slowest exports report in almost two years, a consequence of the Covid-19 zero-tolerance restrictions. The GBP/USD traded at a new YTD low at 1.2260 but bounced off those levels and pushed above the 1.2300 figure, towards current levels. Meanwhile, the US Dollar Index, a gauge of the buck’s value against a basket of its rivals, gains 0.49%, currently at 103.706.
Higher US Treasury yields reaffirm that market players are convinced that the Fed would bring inflation to its target and have priced at least 200-bps rate hikes by 2022. Additionally, the US docket would feature Retail Sales, inflation figures, and consumer sentiment late in the week, which could shed some light on Q2 after Q1 GDP contracted to 1.4%.
Some Fed speaking also added some downward pressure to the major. Atlanta’s Fed President Raphael Bostic expressed that the Fed might go for two, “maybe three” half-point hikes, and then the Fed would assess the economy.
On the UK side, the Bank of England Michael Saunders, one of the three 50-bps dissenters, emphasized his preference to move relatively quickly, and some further tightening may be. However, he added that he might not vote for a half move in the next meetings.
GBP/USD Price Forecast: Technical outlook
The GBP/USD remains downward biased, but Monday’s price action might be a prelude to a lateral move before resuming the downtrend or shifting upwards. It is worth noting that the MACD’s histogram prints a positive divergence compared to lower lows in the major’s price action, which means that the GBP/USD might record another leg-up before recording lower price levels.
Upwards, the GBP/USD first resistance would be 1.2400. Break above would expose July 2020 cycle low at 1.2479, followed by the 1.2500 figure. On the other hand, the GBP/USD first support would be the 1.2300 mark. A breach of the latter would expose the YTD low at 1.2260, followed by May 2020 cycle low at 1.2075.
- US dollar rises sharply versus emerging market currencies on risk aversion.
- USD/MXN back above 20.30, eyes again the 20.50 zone.
- Mexico: inflation remains well above Banxico’s target.
The USD/MXN is rising on Monday boosted by a stronger US dollar amid risk aversion. The pair claimed to 20.39, reaching the highest level in six days. It is hovering around 20.31, as Wall Street tumbles.
The S&P 500 is falling by 2.35% and the Nasdaq by 3.23%, adding to last week’s losses. The negative sentiment weighs on emerging market currencies, including the Mexican peso. Also, risk aversion boosted the demand for Treasuries. Earlier US yields reached fresh multi-year highs.
Data released on Monday showed the Consumer Price Index in Mexico rose 0.54% in April and a 7.68% annual rate. Inflation remains well above Banxico’s target. The Mexican central bank will announce its decision on Thursday and a 50 basis point rate hike is expected, from 6.50% to 7.00%.
In the US, inflation data is due on Wednesday. Market participants will also focus on many FOMC members due to speak in public after last week's FOMC meeting, when the Fed rose interest rates by 50bps.
Technical outlook
The USD/MXN is testing the 200-day Simple Moving Average at 20.40. Above the next key level stands at 20.50 and a daily close above should clear the way toward 20.70.
The Mexican peso will likely gain momentum if USD/MXN drops and holds under 20.15; such a scenario could favor a new test of the May low at 19.99.
Technical levels
The New Zealand dollar has been the worst-performing G10 currency in the past month. However, economists at ING expect NZD/USD to climb back toward 0.70 by early 2023 as the Reserve Bank of New Zealand (RBNZ) is set to deliver 200bp of additional tightening by year-end.
Many negatives in the price
“The impact of lockdowns in China may end up being less severe than expected, thanks to Beijing’s fiscal and economic support, and some negatives may be priced out of NZD later in the year.”
“The RBNZ may deliver another 50bp in hikes given a tight labour market and inflation at 6.9%.”
“We expect 200bp of additional tightening by year-end, which should help NZD/USD move back to 0.70 by early 2023.”
- NZD/USD was hammered on Monday in tandem with further downside in global risk assets and commodities.
- The pair dropped to fresh lows since June 2020 in the mid-0.6300s.
- Focus is on US CPI and NZ inflation expectations data later in the week which could impact central bank expectations.
NZD/USD was hammered on Monday in tandem with further downside in global risk assets and commodities as investors fretted about central bank tightening, sky-high inflation, slowing global growth, and developments that continue to worsen these economic themes, such as the ongoing Russo-Ukraine war and lockdowns in China.
The pair was last trading lower by more than 1.0% in the 0.6330s, its lowest levels since June 2020 and more than 3.5% below last Thursday’s highs in the upper 0.6500s. Since hitting multi-month highs just over one month ago to the north of the 0.7000 level, the kiwi has depreciated by nearly 10%.
Expectations that the RBNZ will lift rates much more aggressively and maintain a yield advantage over the Fed have done little to help shield the kiwi from the negative impact of deteriorating global macro conditions in recent weeks. The RBNZ is expected to lift interest rates by 50 bps to 2.0% later this month and money markets are pricing for a 4.4% terminal rate from the RBNZ, well above the market’s current terminal rate pricing for the Fed around 3.5%.
Some analysts think this RBNZ pricing is excessive, which explains why it is failing to support the kiwi to a degree. “We believe the Kiwi (money) market has gone too far, and rates will most likely fall following the RBNZ's decision in a few weeks,” said Jarrod Kerr, chief economist at Kiwibank. That suggests further downside risks to the kiwi beyond global macro factors.
The main event being watched by FX markets this week is Wednesday’s release of US Consumer Price Inflation data, which should show a modest easing of price pressures. Whether this will be enough to ease the downbeat tone to broader risk appetite remains to be seen. NZD/USD traders will also be watching the release of an RBNZ survey of inflation expectations on Thursday.
“Inflation expectations running well above the targeted 2% is a threat to the RBNZ's credibility as an inflation-fighting central bank… said Kerr, who concluded that “any further push higher in expectations will only fuel the RBNZ's resolve to tighten aggressively”. If the data is interpreted as having a hawkish read across to RBNZ policy, that could offer NZD/USD some momentary support. But any rallies back to resistance in the 0.6400 area may be tempting for sellers to jump back in.
- WTI has fallen nearly $4.0 per barrel to the mid-$106.00s on Monday amid risk-off flows and China demand woes.
- But technicians say WTI remains in a short-term uptrend for now.
Steep losses in the global equity space as investors continue to fret about central bank tightening, sky-high inflation and slowing global growth weighed on crude oil markets on Monday. WTI was last trading just over 3.5% lower on the day in the upper $106.00s per barrel, after reaching as high as the mid-$111.00s last week. But technicians noted that, as long as WTI can remain above its 50 and 21-Day Moving Averages in the $103.40 and $105.10 areas respectively, the recent uptrend that has been in play since the last week of April should remain in play.
New evidence of demand weakness in China is another factor cited by analysts as weighing on crude oil prices on Monday. Chinese trade data released during the Asia Pacific session showed that, while imports were up 7.0% MoM in April, they were still down 4.8% YoY for the first four months of the year. Meanwhile, Saudi Arabia lowered its Official Selling Price for its Arab Light grade for delivery in June, which markets typically interpret as a sign of weaker demand. The country’s two largest cities, Shanghai and Beijing, continue to face varying degrees of lockdown as Chinese authorities continue the struggle to adhere to their zero-Covid-19 strategy.
Crude oil traders also remain focused on geopolitics as the EU nears a deal on an embargo on Russian oil imports. Such an embargo, the current proposal for which would end nearly all EU purchases of Russian crude within a few months, is likely to cause a further decline in Russian output, strategists have noted, which is likely to keep WTI supported above $100 for now. EU 27 nations need to agree unanimously on any such oil embargo deal and it may take a few more days to get reluctant countries such as Hungary to sign up.
- DXY’s bears meets initial contention around 103.50.
- US yields now reverse initial gains and trade on the defensive.
- US Wholesale Inventories, short-term Bill Auctions come next.
The US Dollar Index (DXY), which tracks the greenback vs. a basket of its main competitors, gives away part of the earlier spike above the 104.00 mark on Monday.
US Dollar Index looks to risk trends
The index manages well to cling to weekly gains after facing a wave of selling orders in the wake of new 19-year high around 104.20.
The corrective pullback in the dollar comes against the backdrop of an equally tepid move in US yields, which leave behind earlier peaks following the opening bell in Wall St.
In the US data space, Wholesale Inventories expanded 2.3% MoM in March ahead of a 3-month/6-month Bill Auctions.
What to look for around USD
The dollar regained its solid appeal and managed to record new highs beyond the 104.00 mark, as investors’ expectations for a tighter rate path by the Federal Reserve have been nothing but reinforced by the FOMC event on Wednesday. The constructive stance in the dollar is also underpinned by the current elevated inflation narrative and the solid health of the labour market as well as bouts of geopolitical tensions and higher US yields.
Key events in the US this week: Wholesale Inventories (Monday) – MBA Mortgage Applications, Inflation/Core Inflation Rate (Wednesday) – Producer Prices, Initial Claims (Thursday) – Flash Consumer Sentiment (Friday).
Eminent issues on the back boiler: Escalating geopolitical effervescence vs. Russia and China. Fed’s rate path this year. US-China trade conflict. Future of Biden’s Build Back Better plan.
US Dollar Index relevant levels
Now, the index is gaining 0.21% at 103.87 and the breakout of 104.18 (2022 high May 9) would open the door to 105.00 (round level) and finally 105.63 (high December 11 2002). On the other hand, the next support emerges at 102.35 (low May 5) seconded by 99.81 (weekly low April 21) and then 99.57 (weekly low April 14).
Bank of England external Monetary Policy Committee member Michael Saunders said on Monday that he is uncomfortable with where inflation expectations currently are and that interest rates below 1.0% are clearly below the neutral rate in the UK, reported Reuters.
Interest rates in the UK might need to go above neutral if inflation expectations go higher, Saunders added, though he said this was not his base case and didn't outline exactly where he thinks the neutral rate of interest is. Saunders added that there is good reason to expect the effect on the economy from selling gilts will be smaller than from their initial purchase. That is because the sale of gilts does not contain a policy signal from the BoE, unlike purchases, he noted.
The BoE's benchmark interest rate is the bank's primary tool for tightening policy, Saunders continued, adding that gilt sales are complimentary, but not a substitute.
- USD/CAD shot to a fresh YTD high on Monday, albeit struggled to capitalize on the move.
- Last week’s breakout through a descending trend-line supports prospects for further gains.
- Any meaningful pullback could still be seen as a buying opportunity and remain limited.
The USD/CAD pair gained positive traction for the third successive session and climbed to a fresh YTD peak, around the 1.2950-1.2955 region on the first day of a new week.
Retreating crude oil prices undermined the commodity-linked loonie and turned out to be a key factor that acted as a tailwind for the USD/CAD pair. That said, modest US dollar pullback from a two-decade high touched earlier this Monday capped gains and forced spot prices to retreat around 30 pips from the daily high.
From a technical perspective, last week's strong move up assisted the USD/CAD pair to confirm a bullish breakout through a downward sloping trend-line extending from December 2021. A subsequent move beyond the 1.2900 mark validated the constructive outlook and supports prospects for a further near-term appreciating move.
Hence, some follow-through strength, towards reclaiming the key 1.3000 psychological mark, remains a distinct possibility amid expectations for a more aggressive policy tightening by the Fed. The momentum could further get extended and pushed the USD/CAD pair towards the next relevant resistance near the 1.3045-1.3050 region.
On the flip side, the 1.2910-1.2900 area now seems to protect the immediate downside ahead of the ascending trend-line resistance breakpoint, currently around mid-1.2800s. Any further pullback might still be seen as a buying opportunity near the 1.2800 round-figure mark, which should now act as a strong base for the USD/CAD pair.
A convincing break below would negate the near-term bullish bias and prompt some technical selling. The USD/CAD pair might then turn vulnerable to accelerate the downfall back towards testing last week's swing low, around the 1.2715-1.2710 region.
USD/CAD daily chart
-637877008982092335.png)
Key levels to watch
The Norwegian krone weakening continues. In the view of economists at Nordea, the NOK will continue to face headwinds so long as the risk-off continues. However, eventually, the dust will settle and the krone should strengthen somewhat again.
If markets calm down, the latest movements in both EUR/NOK and USD/NOK could start to reverse
“The NOK could easily weaken further if things get worse. EUR/NOK up to 10.50 and USD/NOK up to 10.00 are levels which could be if equity markets continue down and bond yields up.”
“If markets calm down – potentially on the back of a peaking US CPI reading this week which is expected to fall to 8.1% YoY from 8.5% YoY – then the latest movements in both EUR/NOK and USD/NOK could start to reverse.”
- EUR/USD is holding up fairly well despite risk-off conditions and weak EZ data in the mid-1.0500s.
- The main risk event of the week will be Wednesday’s US CPI.
- Fed/ECB policy divergence should keep the pair a sell on rallies, for now, many strategists think.
EUR/USD has held up surprisingly well on Monday in the face of further sharp downside in the global equity space that would typically lend support to the safe-haven US dollar plus soft Eurozone Sentix survey data for May. The pair is for now moving sideways in the mid-1.0500s, having found support earlier in the session following a brief dip under the 1.0500 mark.
Traders are citing concerns about central bank tightening, which is also reflected in further upside in US, European and global yields on Monday, as one factor weighing on risk appetite at the start of the week. Meanwhile, the familiar themes of slowing global growth amid continued global supply chain difficulties plus the disruptive impact of the Russo-Ukraine war and Chinese lockdowns are all also being cited as weighing on sentiment.
Should risk assets continue to trade on the ropes this week, then that would suggest further EUR/USD downside. The key event of the week will be US Consumer Price Inflation data out on Friday, which is expected to show the YoY pace of headline price growth easing to 8.1% in April from 8.5% in March.
Whilst this will come as a welcome decline that could give EUR/USD a short-term lift, with the headline rate of CPI still so high above the Fed’s 2.0% target, no dovish Fed policy shift is expected any time soon. Last week’s policy announcement and subsequent rhetoric suggest the Fed remains intent on getting interest rates back to neutral (around 2.5%) by the end of the year and then probably substantially above in 2023, as the bank seeks to cool demand and ease inflation.
The ECB, meanwhile, though expected to take interest rates back to positive later this year (also a big hawkish shift versus the bank’s policy stance just a few months ago), isn't expected to tighten monetary policy anywhere near as fast. Many traders may continue to view EUR/USD as a “sell on rallies” for now, with resistance in the form of the 2020 lows in the 1.0630 area likely to prove formidable.
In the longer term, a drop in EUR/USD to 2016 lows in the mid-1.0300s still seems likely. Many banks have been calling for the pair to fall back to parity by the end of the year if US inflation doesn’t ease as much as the Fed hopes, forcing them to signal an intent to raise interest rates well above neutral (say to 4.0% or higher) by the end of 2023.
USD/CAD has ended the correction and is challenging the 2021 high at 1.2947/63. However, only above 1.3020/41 would open up a medium-term move higher, economists at Credit Suisse report.
Significant support is seen at 1.2716/2675
“Though a more severe pullback cannot be ruled out completely, with the medium-term MACD now shifting higher, we look for 1.2947/63 to eventually break and open the door to test the 38.2% retracement of the 2020/21 downtrend and the 200-week moving average at 1.3020/41.”
“Only a sustained break above 1.3020/41 would confirm that a new medium-term uptrend has emerged and see scope to challenge the mid-November 2020 high at 1.3172.”
“Significant support is seen at 1.2716/2675. A break below here would shift the near-term risk back lower again and warn of weakness back toward the lower end of the long-term range.”
Gold Price has dropped below the $1,875 mark. If the yellow metal sees a daily close below this level, XAUUSD could suffer a substantial drop, strategists at TD Securities report.
CTA trend followers are about to join the liquidation vacuum in gold
“Momentum signals are quickly deteriorating in the yellow metal, lowering the bar for systematic trend follower liquidations to razor-thin levels.”
“We estimate that gold prices need only close below $1,875/oz to catalyze a substantial selling program that could send the yellow metal below the psychologically important 200-DMA range.”
“For now, we still see room for length to subside further, and trend follower liquidations could provide the fuel to kick off a liquidation event with another leg lower.”
NZD/USD has turned lower again. Economists at Credit Suisse stay biased for further weakness, with scope to reach 0.6230.
Resistance moves to 0.6510/20
“The daily MACD and RSI momentum indicators remain near to ‘oversold’ levels, which warns that a potentially lengthier recovery might take place. Nonetheless, our bias remains lower, with support seen at 0.63 initially, next at 0.6283 and eventually at the 61.8% retracement of the 2020/21 uptrend at 0.6231/30.”
“Immediate resistance moves to 0.6412/20, next to 0.6448/57 and eventually to the 13-day exponential moving average at 0.6510/20. Above here would open up the last week’s high at 0.6556/68, which we would look to hold to keep the strong downside pressure intact.”
By the end of April, copper had given up all its gains since the beginning of the year. Nonetheless, strategists at Commerzbank expect the base metal to recoup its losses and trade at $9,500 by year-end.
Copper to move back higher
“After the end of the current correction – at the beginning of May the copper price had slipped to its lowest level since mid-December – we expect higher copper prices again.”
“At the end of the year, we see copper at $9,500 per ton.”
- USD/JPY shot to a fresh two-decade high on Monday, though struggled to capitalize on the move.
- The risk-off mood underpinned the safe-haven JPY and capped the pair amid modest USD pullback.
- The Fed-BoJ policy divergence favours bullish traders and supports prospects for additional gains.
The USD/JPY pair surrendered a major part of its intraday gains and dropped to the lower end of its daily trading range, around the 130.75-130.70 area during the early North American session.
The pair struggled to capitalize on its early positive move and witnessed modest pullback from the 131.35 area, or the highest level since April 2002 touched earlier this Monday. The prevalent risk-off mood - as depicted by a weaker tone around the equity markets - underpinned the safe-haven Japanese yen. On the other hand, the US dollar eased a bit from a two-decade high, which was seen as another factor that exerted some pressure on the USD/JPY pair. The downside, however, remains cushioned amid a big divergence in the monetary policy stance adopted by the Bank of Japan and the Fed.
The Japanese central bank has vowed to keep its existing ultra-loose policy settings and promised to conduct unlimited bond purchase operations to defend its “near-zero” target for 10-year yields. In contrast, Fed Chair Jerome Powell said last week that policymakers were ready to approve a 50 bps increase at upcoming meetings. Moreover, the markets are pricing in a further 200 bps rate hike by the Fed for the rest of 2022. This, along with concerns about rapidly rising consumer prices, pushed the yield on the benchmark 10-year US government bond to its highest level in more than a decade.
Hence, the focus now shifts to the release of the latest US consumer inflation figures on Wednesday. Nevertheless, the fundamental backdrop remains tilted firmly in favour of the USD bulls and supports prospects for the emergence of some dip-buying around the USD/JPY pair. That said, slightly overbought conditions make it prudent to wait for some near-term consolidation before positioning for any further appreciating move amid absent relevant market moving economic releases from the US.
Technical levels to watch
USD/CAD advances to mid-1.29s. Economists at Scotiabank note that the pair needs to see a sustained break above 1.2965 to enjoy further gains.
Minor support aligns at 1.2915
“USD resistance at 1.2950/65 (the latter being the Dec 2021 high) looks vulnerable but the range ceiling has been consistent and we think the USD will have to advance well beyond this point to signal a range break.”
“We note resistance at 1.3045/50.”
“Minor support is 1.2915 and 1.2865.”
USD/JPY continues to hold support from its 13-day exponential average at 129.32. Analysts at Credit Suisse stay directly bullish for next resistance at 132.20 – the 78.6% retracement of the 2002/2011 fall.
Support at 128.65/60 set to hold
“Above the 131.25/35 highs should see resistance next at 132.19/20 ahead of 133.09/13 and then the top of the short-term uptrend channel, today seen at 133.41. Whilst we would look for this to cap at first, above in due course should see a move to our next objective of the 78.6% retracement of the 2002/2011 fall at 132.20. Our bias would then be for a consolidation phase to unfold here.”
“Big picture, with a multi-year base in place, we stay bullish for the 135.20 high of 2002 and eventually into the 147/153 zone.”
“Support is seen at 130.38 initially, then 130.17, with 129.42/32 now ideally holding to keep the immediate risk higher.”
“Only below 128.65/60 would warn of a near-term top.”
This week’s GDP print is the highlight in the United Kingdom. As the Bank of England (BoE) is set to fail to meet market expectations for hikes, economists at Scotiabank expect the GBP/USD pair to test the 1.20 mark.
BoE will fail to meet expectations for hikes at each of the four remaining meetings of 2022
“A quiet domestic backdrop means the GBP will have to wait until Thursday’s Q1/Mar GDP release to stand out from the pack (not necessarily positively) while we maintain that it continues to face downside risks from overpriced BoE expectations.”
“A 25bps hike at the mid-June meeting seems likely, but beyond that we think the bank will fail to meet expectations for hikes at each of the four remaining meetings of the year and it may even choose to pause as soon as August.”
“There’s a significant chance that the GBP trades to a test of 1.20 in the coming weeks.”
Bank of England Monetary Policy Committee member Michael Saunders said on Monday that inflation and key measures of longer-term inflation expectations are uncomfortably high, reported Reuters. External cost increases may exacerbate the recent rise in inflation expectations, Saunders added.
"I put considerable weight on risks that, unless checked by monetary policy, domestic capacity and inflation pressures would probably be greater and more persistent than the central forecast," Saunders said in a speech at the Resolution Foundation think tank. "As a result, my preference has been to move relatively quickly to a more neutral monetary policy stance."
- EUR/USD reverses the initial pessimism and targets 1.0600.
- Immediate up barrier emerges at the weekly high at 1.0641.
EUR/USD bounces off daily lows in the sub-1.0500 region on Monday.
If the rebound picks up extra pace, then the pair should initially target the round level at 1.0600 prior to the more relevant weekly high at 1.0641 (May 5).
Above the 3-month line near 1.0940, the selling pressure is expected to alleviate somewhat.
EUR/USD daily chart
Economist at UOB Group Ho Woei Chen, CFA, comments on the potential move on rates by the Bank of Korea later in the month.
Key Takeaways
“South Korea’s headline and core inflation continued to climb in Apr. The headline CPI was above 4% for the second straight month at 4.8% y/y, 0.7% m/m (Bloomberg est: 4.4% y/y, 0.4% m/m) from 4.1y/y, 0.7% m/m in Mar, the highest since Oct 2008.”
“A back-to-back 25 bps interest rate hike to 1.75% on 26 May is fairly likely given the near-term inflationary pressures since there will not be an MPC meeting in June and the following meeting will only be in July. Minutes of the Apr meeting highlighted concerns over wage-price spiral and the near-term focus on taming runaway inflation risks versus supporting growth.”
“BoK will be updating its growth and inflation forecasts at the May meeting. Despite the high level of external uncertainty, South Korea’s economy is likely to remain on track to reach a 2.7% GDP growth this year.”
- AUD/USD is holding above support in the 0.7000 area for now, though is still substantially lower on the day.
- Global equities and economic growth-sensitive commodities are under pressure on Monday, weighing on the risk/commodity-sensitive Aussie.
- US CPI will be the key moment of the week for the pair.
Slightly better than expected Chinese trade figures for the month of April have done very little to offer the Australian dollar support this Monday, with the currency momentarily sliding below the $0.7000 level earlier in the day. In doing so, AUD/USD hit fresh lows since late January, though, for now, support in the form of the earlier annual lows is holding up.
Still, at current levels in the 0.7010s, the pair is still trading with on the day losses of about 0.8% on the day and down about 3.5% versus last week’s highs in the mid-0.7200s. The pair has been weighed heavily in recent days by a combination of factors. Firstly, the US dollar has been robust amid rising US yields as traders brace for a more aggressive Fed tightening cycle in wake of last week’s hawkish Fed policy meeting.
Secondly, global risk assets (including equities and growth-sensitive commodities) have been taking a battering as financial conditions tighten (i.e. yields rise), and as market participants fret about central bank tightening amid high inflation and slowing global growth amid the ongoing Russo-Ukraine war and lockdowns in China. This has, not surprisingly, hit the risk/commodity-sensitive Aussie hard in recent sessions.
So long as the above trends continue, it is likely that the RBA’s recent shift to monetary tightening (they surprised markets with a 25 bps rate hike last week and rates are seen reaching 3.0% by the year’s end) will be unable to prevent further losses. A break below sub-0.7000 annual lows would open the door to a move lower to the next key area of long-term support around 0.6800.
AUD/USD traders will need to keep an eye on a barrage of commentary from Fed policymakers this week that could help further shape expectations for US monetary policy. But the main event of the week will be the release of US Consumer Price Inflation (CPI) data on Wednesday. Sky-high inflation has been the key motivator of the Fed’s recent hawkish shift. If the recent rally in US yields and the US dollar is to ease, traders will want to see evidence of an easing of inflationary pressures.
- GBP/USD staged a solid intraday recovery from a fresh YTD low touched earlier this Monday.
- Modest USD pullback from a two-decade high prompted some short-covering around the pair.
- The diverging Fed-BoE policy outlooks warrant caution before placing aggressive bullish bets.
The GBP/USD pair witnessed a dramatic intraday turnaround and rallied over 140 pips from its lowest level since June 2020 touched earlier this Monday. The recovery momentum pushed the spot prices to a fresh daily high, around the 1.2400 round-figure mark during the mid-European session.
The US dollar eased a bit from a two-decade high as investors opted to take some profits off the table. This, in turn, was seen as a key factor that assisted the GBP/USD pair to find some support ahead of the mid-1.2200s and stall its dovish Bank of England (BoE)-inspired downward momentum. That said, any meaningful recovery still seems elusive amid the prospects for a more aggressive policy tightening by the Fed, which should help limit any deeper USD losses.
The markets seem convinced that the Fed would need to take more drastic action to bring inflation under control and have been pricing in a further 200 bps rate hike for the rest of 2022. Apart from this, concerns about rapidly rising consumer prices held the yield on the benchmark 10-year US government bond near its highest level in more than a decade. This, along with the prevalent risk-off environment, favours the USD bulls and should cap the GBP/USD pair.
Moreover, the BoE's gloomy economic outlook, saying that the economy was at the risk of a recession, suggested that the current rate hike cycle could be nearing a pause. The resultant policy outlooks between the Fed and the BoE might further hold back traders from placing aggressive bullish bets around the GBP/USD pair. Hence, any subsequent move up might still be seen as a selling opportunity and runs the risk of fizzling out rather quickly.
In the absence of any major moving economic releases, either from the UK or the US, the US bond yields and the broader market risk sentiment would drive the USD demand. Traders will further take cues from a scheduled speech by the BoE MPC member, Michael Saunders, which should influence the GBP and produce some trading opportunities around the GBP/USD pair. The focus, however, will remain on the release of the latest US consumer inflation figures on Wednesday.
Technical levels to watch
French President Emmanuel Macron said on Monday that he wants more majority votes for certain EU policy areas and called to reform EU texts so that the bloc can gain more effectiveness, reported Reuters. There will be conflicts on reforming the EU, but we must not shy away, he stated, adding that a Europe of different speeds already exists, but that differentiation is needed to make the EU more effective.
His remarks come after European Commission President Ursula von der Leyen said earlier in the day that unanimity voting on key EU policy areas no longer makes sense if the EU wants to be able to move faster.
A recent EU report showed that there is support amongst EU citizens for scrapping unanimity voting on some issues if it means the 27-nation bloc will become fairer and better able to make swift decisions.
Aggressive monetary tightening, rising yields and a stronger dollar are key drags for the gold prices. Meanwhile, sustained inflation and heightened geopolitical risks should protect the yellow metal somewhat. Technically, economists at ANZ Bank expect XAUUSD to confirm a bullish move on a break above $1,930.
Gold looks well supported at $1,850 in the short term
“Aggressive Fed rate hikes, faster quantitative tightening, the stronger US dollar and any possible easing of Russia’s invasion of Ukraine are the main possible headwinds for the gold prices. Higher inflation risks and lingering geopolitical tension are likely to offset some of these risks. The key development to watch is the Fed’s reaction to any upside surprise in inflation, which could impact real interest rate.”
“We see the short-term key support level being $1,850. Should it break below this, prices could easily retreat to $1,800.”
“We expect a trading range of $1,850-1,930 in days ahead.”
“A convincing break of above the upper trend line of $1,930 would confirm a bullish move. Once this level breaks, prices could touch the previous highs of $2,000 and $2,050.”
Atlanta Fed President Raphael Bostic said on Monday during an interview on Bloomberg that the Fed's most recent 50 bps rate hike was an "aggressive" move and that the Fed can stay at this pace. By the end of 2023, Bostic said he thinks the Fed needs to be somewhere in the neutral range, defined as between 2.0-2.5%.
All options are on the table at every meeting, he continued, noting that it will depend on how the economy responds. The hope is that some of the inflationary things that are out of the Fed's control, like supply chains, start to get into better shape, he said. There remains a lot of momentum in the economy, Bostic said.
Speaking in an interview on CNBC, Minneapolis Fed President Niel Kashkari said on Monday that he remains confident that inflation is going to come back to the Fed's 2.0% target. Bad news is weighing on supply chains and inflation, he continued, noting that as energy prices stay higher for longer, investors will see a good place to deploy capital.
Kashkari said that the Fed will change its approach if the data comes in differently versus expectations and noted that the Fed is not focused on the stock market, rather they are focused on their dual mandate, which includes a strong labour market.
- Gold is sharply lower on Monday and trading near $1860, as US yields rally on further hawkish Fed pricing.
- XAU/USD is for now holding above last week’s $1850 lows amid safe-haven demand as global equities crater.
Spot gold (XAU/USD) prices were last trading lower by about $25 or around 1.3% near the $1860 per troy ounce mark on Monday, as a continued push higher in US bond yields weighed heavily on precious metals. The US 10-year yield hit 3.20% for the first time since December 2018 earlier on Monday, taking its gains since last week’s Fed meeting to over 25 bps at the time. At current levels around 3.17%, the 10-year yield is up a staggering 1.3% since the end of February.
For now, XAU/USD is holding up above last week’s lows just above $1850. The steep recent sell-off in global equities on central bank tightening, inflation and global growth fears, that has extended on Monday, seems to be offering safe-haven gold a modicum of support. The buck has been struggling to break higher at the start of the week, despite higher yields and weakness in risk assets.
Should the DXY break convincingly to the north of the 104.00 level and yields retain their current bid, it seems very likely XAU/USD would break lower. The first area of support to the downside beyond $1850 mark to note is the 200-Day Moving Average in the mid-$1830s. A break below here could open the door to a run lower to the 2022 lows around $1780.
Gold traders will need to keep an eye on a barrage of commentary from Fed policymakers this week that could help further shape expectations for US monetary policy. But the main event of the week will be the release of US Consumer Price Inflation (CPI) data on Wednesday. Sky-high inflation has been the key motivator of the Fed’s recent hawkish shift. If the recent rally in US yields and the US dollar is to ease, traders will want to see evidence of an easing of inflationary pressures.
Russian President Vladimir Putin on Monday said that there is no doubt that Russia's "special military operation" in Ukraine will achieve a result, reported Reuters citing Russian news agency Tass.
His comments on Russia's "Victory Day" (the day the Soviets defeated the Nazis) and following a large military parade in Moscow which displayed troops and heavy weapons. In an earlier speech, Putin said that the "special military operation" in Ukraine was the right decision. "You're fighting for our people in Donbas, for the safety of our motherland in Russia,” he said.
The Russian leader linked his war in Ukraine with that historic struggle in a speech that blamed the West for the conflict but contained no new escalations, per NBC News.
Earlier in the day, Russian Chief Negotiator Vladimir Medinsky said that peace talks with Ukraine have not stopped but are being held remotely.
- DXY records new cycle tops near 104.20 on Monday.
- The continuation of the bullish stance could reach 105.00.
DXY extends the move higher and clinches fresh peaks in the vicinity of 104.20 at the beginning of the week.
That said, if the rebound picks up further pace, then the index could challenge the round level at 105 prior to 105.63 (December 11 2002 high).
The current bullish stance in the index remains supported by the 8-month line in the boundaries of 97.00, while the longer-term outlook for the dollar is seen constructive while above the 200-day SMA at 96.04.
DXY daily chart
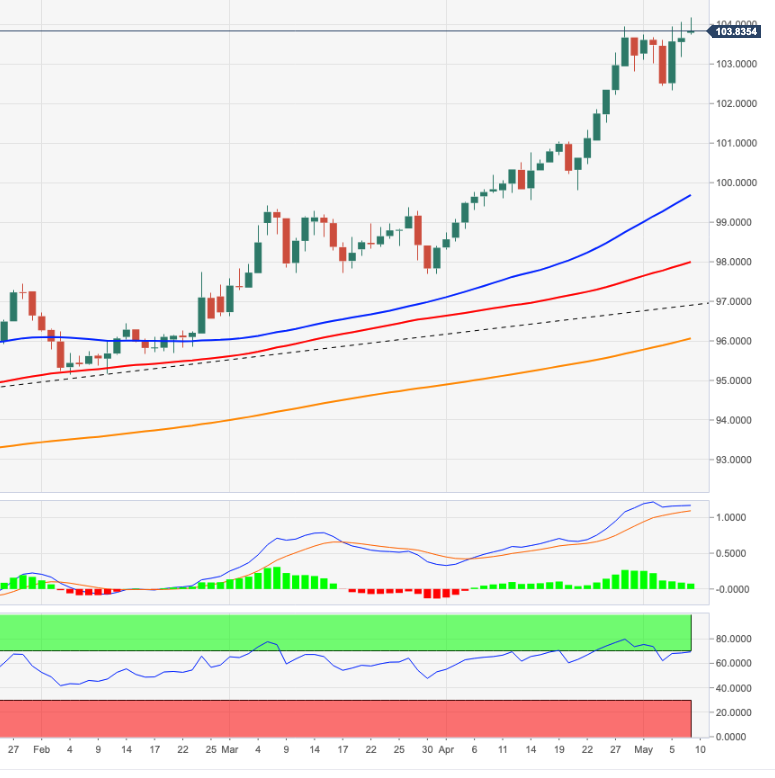
The continuation of the uptrend could lift USD/IDR to retest 14,565 ahead of 14,620, suggested Quek Ser Leang at UOB Group’s Global Economics & Markets Research.
Key Quotes
“USD/IDR jumped higher at the start of trading today. The rapid increase in momentum is likely to lead to a break of the Jul 2021 high at 14,565.”
“The next resistance is at 14,620. Support is at 14,490.”
- EUR/JPY adds to the ongoing recovery north of 138.00.
- Next on the upside comes the 139.00 hurdle ahead of 140.00.
EUR/JPY extends the upside momentum and trades in multi-day highs past 138.00 at the beginning of the week.
Extra gains now appear on the cards in the very near tern with the next target at the round level at 139.00 ahead of the 2022 high around 140.00 (April 21). Further up is seen the June 2015 peak at 141.05.
In the meantime, while above the 200-day SMA at 130.91, the outlook for the cross is expected to remain constructive.
EUR/JPY daily chart
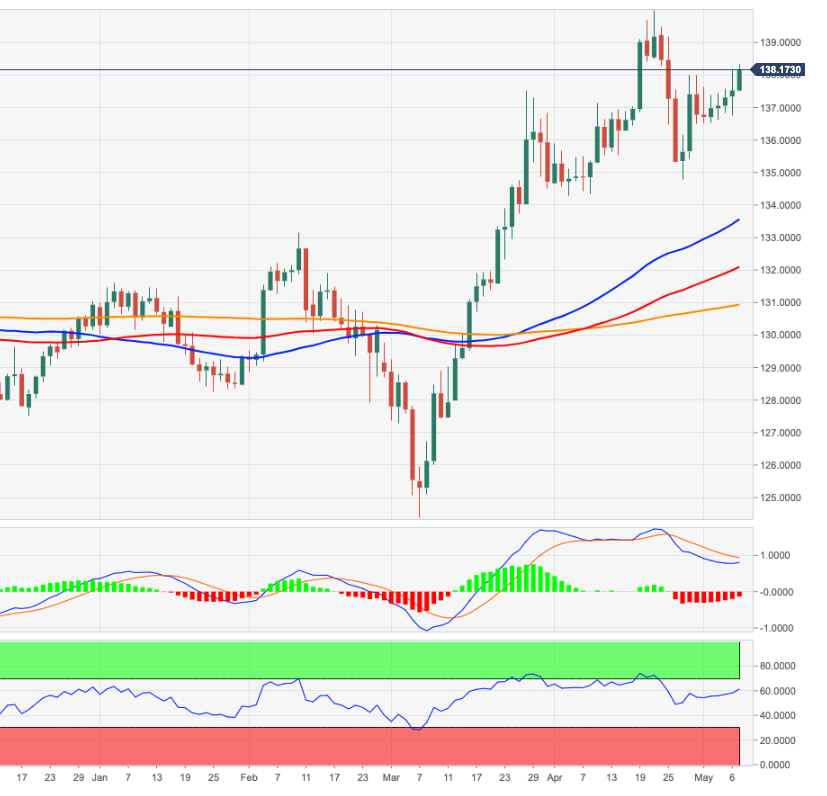
- Silver prolonged its recent bearish trend and dropped to a fresh YTD low on Monday.
- A break below the $22.00 mark could now be seen as a fresh trigger for bearish traders.
- Oversold RSI (14) on the daily chart warrants some caution before placing fresh bets.
Silver witnessed selling for the third successive day on Monday and dropped to a fresh YTD low, further below the $22.00 mark during the first half of the European session.
Given that last week's post-FOMC recovery move faltered near a resistance marked by an ascending trend-line support breakpoint, sustained break below the $22.00 mark has set the stage for further losses. That said, RSI (14) on the daily chart is already flashing oversold conditions and warrants some caution.
Nevertheless, the XAG/USD seems vulnerable to prolonging a four-week-old bearish trajectory and slide to retest the December 2021 low, around the $21.40 region. Some follow-through selling has the potential to drag spot prices further towards the next relevant support near the $21.00 round-figure mark.
On the flip side, any attempted recovery might now confront stiff resistance near the $22.40-$22.50 horizontal zone. Sustained strength beyond might trigger a short-covering move and allow the XAG/USD to reclaim the $23.00 mark and test last week's swing high, around the $23.25-$23.30 region.
The latter should act as a pivotal point for traders, which if cleared decisively would suggest that the XAG/USD has formed a near-term bottom and pave the way for further gains. Bulls might then aim to challenge the very important 200-day SMA, currently around the $23.70-$23.75 area, and reclaim the $24.00 mark.
Silver daily chart
-637876889791024609.png)
Key levels to watch
According to Quek Ser Leang at UOB Group’s Global Economics & Markets Research, further upside in USD/MYR could see the 4.40 level retested in the near term.
Key Quotes
“At the time of writing, USD/MYR just edged above 4.3800. Strong upward momentum suggests a break of 4.4000 would not be surprising.”
“However, the 2020 high of 4.4410 is likely out of reach for now. Support is at 4.3350 followed by 4.3200.”
- EUR/GBP attracted some dip-buying on Monday amid sustained selling around the GBP.
- The BoE’s gloomy economic outlook turned out to be a key factor weighing on sterling.
- A combination of factors undermined the euro and kept a lid on any meaningful upside.
The EUR/GBP cross held on to its modest intraday gains through the first half of the European session and was last seen trading near the top end of its daily range, just above the mid-0.8500s.
Following the previous session's pullback from the YTD peak, the EUR/GBP cross attracted fresh buying near the 0.8530 region on Monday, though the uptick lacked bullish conviction. The Bank of England's warning last week, saying that the economy was at the risk of a recession, suggested that the current rate hike cycle could be nearing a pause. This, in turn, was seen as a key factor behind the British pound's relative outperformance and acted as a tailwind for the cross.
That said, a combination of factors held back traders from placing aggressive bullish bets around the shared currency and kept a lid on any meaningful gains for the EUR/GBP cross, at least for now. Investors remain concerned that the European economy will suffer the most from the Ukraine crisis. Apart from this, the relentless US dollar buying interest and disappointing Eurozone Sentix Investor Confidence Index turned out to be key factors that weighed on the euro.
From a technical perspective, the post-BoE strong move up beyond the very important 200-day SMA and a descending trend-line extending from April 2021 support prospects for additional gains. Hence, some follow-through strength, towards reclaiming the 0.8600 mark for the first time since October 2021, remains a distinct possibility. In the absence of any relevant market-moving economic releases, traders will take cues from a scheduled speech by the BoE MPC member, Michael Saunders.
Technical levels to watch
Quek Ser Leang at UOB Group’s Global Economics & Markets Research noted USD/THB still faces a tough up barrier at 34.75 prior to the round level at 35.00.
Key Quotes
“USD/THB dipped to 34.01 late last week, just one pip above the major support at 34.00 before rebounding. At the time writing, USD/THB just moved above last week’s high of 34.54. While overbought, the rapid improvement in momentum suggests there is room for the current USD/THB strength to extend.”
“Resistance is at 34.75. The round-number level of 35.00 is unlikely to come into the picture this week. Support is at 34.35 followed by the still very solid level of 34.00.”
In its latest Q1 monetary policy implementation report, the People’s Bank of China (PBOC) said that it will keep economic operations within a reasonable range.
Additional takeaways
Will not resort to flood-like stimulus.
Will keep liquidity reasonably ample.
Will keep macro leverage ratio basically stable.
Will closely watch inflation trend, keep prices stable.
Will closely monitor monetary policy adjustments by developed economies.
Prudent monetary policy will step up support for real economy.
Will not use property as short-term stimulus for economy.
Will prioritize stability, take steps to boost confidence.
Will support rigid housing demand, step up support for housing lease financing.
Related reads
- USD/CNH Price Analysis: Bulls pierce 200-week SMA to renew 18-month high
- China’s April Trade Balance: Mixed data fails to lift the aussie
Former Bank of England (BOE) Chief Economist Andy Haldane warned in an LBC interview on Monday that inflation could go even higher than the 10% predicted and could persist for years.
Additional comments
"Things have passed my worst expectations.”
"I think it is certainly going to last the duration of the year, and into next or even the year beyond."
"Had we done that, we probably wouldn't be talking about rate rises as big or as rapid as we are now.”
“We have a whole generation of mortgage holders who have scarcely seen a rise in interest rates. It will be a massive shock to the system not only financially, but psychologically."
His comments come as the UK businesses called for an immediate emergency budget to deal with soaring costs, including the reversal of the recent National Insurance increase.
Market reaction
GBP/USD was last seen trading at 1.2278, down 0.44% on the day.
- GBP/USD recovers a bit after hitting fresh YTD low, keeps the red below 1.2300 mark
- EUR/USD keeps the offered stance well and sound on Monday.
- German 10y bund yields surpassed the 1.15% region, fresh tops.
- EMU Investor Confidence sank to -22.6 in May.
The single currency sees its selling pressure accelerated and drags EUR/USD back to the 1.0500 neighbourhood on Monday.
EUR/USD weaker on USD-buying
EUR/USD resumes the downside following Friday’s inconclusive price action and in response to the firmer note in the greenback, which pushed the US Dollar Index (DXY) to print fresh 19-year highs around 104.20 earlier in the session.
Extra weakness in the pair comes amidst a knee-jerk in the German 10y bund yields after hitting fresh tops past 1.16% for the first time since August 2014, while US yields so far perform in a mixed tone.
In the domestic calendar the EMU Investor Confidence tracked by the Sentix Index deteriorated to -22.6 for the month of May. Across the pond, the only release of note will be the Wholesale Inventories, short-term Bill Auctions and the speech by FOMC’s Bostic.
What to look for around EUR
EUR/USD remains under pressure in the 1.0500 region so far. The outlook for the pair still points to the bearish side, always in response to dollar dynamics, geopolitical concerns and the Fed-ECB divergence. Occasional pockets of strength in the single currency, in the meantime, should appear reinforced by speculation the ECB could raise rates at some point around June/July, while higher German yields, elevated inflation and a decent pace of the economic recovery in the region are also supportive of an improvement in the mood around the euro.
Key events in the euro area this week: Sentix Index (Monday) – Germany, EMU Economic Sentiment (Tuesday) – Final Germany Inflation Rate, ECB Lagarde (Wednesday) – EMU Industrial Production (Friday).
Eminent issues on the back boiler: Asymmetric economic recovery post-pandemic in the euro area. Speculation of ECB tightening/tapering later in the year. Impact on the region’s economic growth prospects of the war in Ukraine.
EUR/USD levels to watch
So far, spot is retreating 0.36% at 1.0507 and a breach of 1.0470 (2022 low April 28) would target 1.0453 (low January 11 2017) en route to 1.0340 (2017 low January 3 2017). On the upside, the next hurdle comes at 1.0641 (weekly high May 5) followed by 1.0936 (weekly high April 21) and finally 1.1000 (round level).
- USD/CAD gained traction for the third straight day and climbed to a fresh YTD high on Monday.
- Sliding crude oil prices undermined the loonie and extended support amid sustained USD buying.
- Bets for aggressive Fed rate hikes and the prevalent risk-off mood benefitted the safe-haven buck.
The USD/CAD pair maintained its bid tone through the first half of the European session and was last seen trading around the 1.2925 region, just a few pips below the YTD peak.
A combination of factors assisted the USD/CAD pair to build on its recent strong bullish trajectory witnessed over the past one month or so and gain traction for the third successive day on Monday. The US dollar stood tall near a two-decade high amid the prospects for a more aggressive policy tightening by the Fed. Apart from this, sliding crude oil prices undermined the commodity-linked loonie and acted as a tailwind for the major.
Fed Chair Jerome Powell said last week that a 75 bps rate hike is not under active consideration. The markets, however, seem convinced that the US central bank would need to take a more drastic action to curb soaring inflation and are still pricing in a further 200 bps rate hike for the rest of 2022. This, in turn, pushed the yield on the benchmark 10-year US government bond to its highest level in more than a decade and benefitted the buck.
Expectations for rapid rate hikes in the US, along with strict COVID-19 lockdowns in China, have been fueling concerns about global economic growth and a possible recession. This, in turn, tempered investors' appetite for riskier assets and also acted as a headwind for crude oil, despite worries over tightening supply. Adding to this, Friday's rather unimpressive Canadian jobs report, weighed on the domestic currency and extended support to the USD/CAD pair.
Moving ahead, there isn't any major market-moving economic data due for release on Monday, either from the US or Canada. Hence, the US bond yields and the broader market risk sentiment will continue to play a key role in driving the USD demand. Traders will further take cues from oil price dynamics to grab some short-term opportunities around the USD/CAD pair.
Technical levels to watch
GBP/USD has extended its slide following last week's slump. As FXStreet’s Eren Sengezer notes, cable eyes fresh multi-year lows amid risk aversion.
Pound to stay on the back foot amid risk-averse market environment
“Although the RSI suggests that GBP/USD is about to turn technically oversold, the pair could continue to push lower without needing to make a technical correction if the risk sentiment remains the primary market driver.”
“On the downside, 1.2250 (static level from June 2020) aligns as the next bearish target. With a drop below that level, additional losses toward 1.22 (psychological level) could be witnessed.”
“The descending line coming from May 5 forms the first resistance at around 1.2320, which is reinforced by a static level as well. A four-hour close above that line could be seen as a bullish sign and open the door for a rebound toward 1.2370 (static level) and 1.24 (psychological level, 20-period SMA).”
- Gold Price gets hammered amid ‘sell everything’ mode amid risk-aversion.
- Flight to safety, US dollar dominate while Treasury yields keep rallying.
- XAU/USD remains poised to test the $1,850 barrier, awaits US inflation.
Gold Price is tumbling alongside the US government bonds and global stocks, as investors seek refuge in only the US dollar, with risk-aversion at full steam at the start of the fresh week.
After a turbulent last week, dominated by the central banks, global growth fears are back to the fore amid extended Chinese covid curbs and fears over interest rate hikes. In times of market panic and uncertainty, the dollar remains in cruise control, courtesy of its appeal as an ultimate safe haven.
The buck also finds demand as the Fed remains ahead of the curve when compared to all the other major central banks worldwide. Despite a less hawkish stance last Wednesday, the Fed remains on track for 50 bps rate hikes at the next two meetings while beginning the balance sheet reduction process.
Also read: Gold Price Forecast: XAU/USD eyes $1,850 yet again amid a potential bear flag
A stronger dollar weighs heavily on the USD-price Gold while the rally in the Treasury yields exacerbates the pain in the non-yielding yellow metal. The benchmark 10-year US rates are currently trading at 3.185%, the highest level since November 2018, on Fed rate hike bets.
Adding to the downside in Gold Price, the speculative net shorts on the metal have grown last week, as investors flock to the dollar instead ahead of the all-important US inflation data due later this Thursday.
Looking ahead, Gold Price will remain at mercy of the sentiment around the yields and the dollar. Any rebound in Wall Street stocks could pause the dollar upsurge, offering some reprieve to gold bulls.
Gold Price technical levels to consider
Economist at UOB Group Lee Sue Ann assesses the lates BoE monetary policy meeting.
Key Takeaways
“The Bank of England (BOE)’s Monetary Policy Committee (MPC), at its meeting in May, voted by a majority of 6-3 to increase the Bank Rate by 25bps to 1.00%. This is the fourth consecutive policy meeting since Dec that the BOE has raised its key interest rate. There are, however, signs that members are increasingly more divided.”
“Previously, we had held a cautious view of the BOE pausing once the policy rate reaches 1.00%. However, the latest voting outcome by the MPC has turned out a little less dovish than our expectations, and we thus now look for another 25bps hike in Jun.”
“As for asset sales, given that Bank staff were asked to work on a plan to sell gilts and present it at the Aug meeting, we will likely have to wait until at least then for some guidance, though we expect sales to begin in 4Q22 at GBP5bn a month.”
Gold is already under pressure again as the new week gets underway. As economists at Commerzbank note, investors are retreating not only from gold but also from silver.
Unrelenting strength in the US dollar weighs negatively on gold
“The same factors as in recent weeks are weighing on gold price: the US dollar is firm and bond yields are rising further.”
“ETF investors have been withdrawing from gold over the past two weeks. The gold ETFs tracked by Bloomberg registered 12 tons of outflows again last week. The CFTC’s statistics show that speculative financial investors are further turning their backs on gold, too.
“153 tons of gold have thus been sold via the futures markets in the past three weeks. This is presumably one reason why the gold price has shed $100 or 5% during this time.”
“Speculative financial investors have also retreated noticeably from silver: in the last three weeks, they have even slashed their net long positions by 64%, around 4,180 tons of silver being sold via the futures market. The silver price has dropped by nearly $3 or 11% over this period – i.e. significantly more steeply than the gold price.”
- A combination of factors dragged GBP/USD lower for the third successive day on Monday.
- The BoE’s dovish outlook continued weighing on the GBP and exerted downward pressure.
- Aggressive Fed rate hike bets and the risk-off environment underpinned the safe-haven USD.
- Oversold conditions helped limit further losses, though any meaningful recovery seems elusive.
The GBP/USD pair managed to rebound a few pips from its lowest level since June 2020 touched during the early European session and was last seen trading just below the 1.2300 mark, still down over 0.40% for the day.
The pair added to last week's heavy losses that followed the Bank of England's dovish rate hike and witnessed some follow-through selling for the third successive day on Monday. It is worth recalling that the UK central bank raised interest rates to their highest level since 2009 but warned that the economy was at the risk of a recession. The gloomy outlook suggested that the current rate hike cycle could be nearing a pause, which, in turn, was seen as a key factor that undermined the British pound.
On the other hand, the US dollar stood tall near a two-decade high and continued drawing support from expectations that the Fed would tighten its monetary policy at a faster pace to curb soaring inflation. The markets are still pricing in a further 200 bps Fed rate hike move for the rest of 2022. This, in turn, pushed the yield on the benchmark 10-year US government bond to its highest level in more than a decade, which, along with the prevalent risk-off mood, further underpinned the safe-haven greenback.
Firming expectations for rapid interest rate hikes in the US, along with strict COVID-19 lockdowns in China, have raised concerns about slowing global growth and a possible recession. This, in turn, took its toll on the global risk sentiment and tempered investors' appetite for riskier assets. The anti-risk flow and the Fed-BoE policy divergence support prospects for additional losses. That said, oversold conditions assisted the GBP/USD pair to find some support just ahead of the mid-1.2200s.
Spot prices quickly recovered around 35-40 pips from the daily low, though any meaningful upside still seems elusive. Hence, any further move up is more likely to attract fresh sellers and runs the risk of fizzling out rather quickly. In the absence of any major market-moving economic releases, either from the UK or the US, traders will take cues from the USD price dynamics. Apart from this, a scheduled speech by the BoE MPC member, Michael Saunders, could provide some impetus to the GBP/USD pair.
Technical levels to watch
Russian Chief Negotiator Vladimir Medinsky said that peace talks with Ukraine have not stopped but are being held remotely.
His comments come as the Victory Day parade began in Moscow, with troops and heavy weapons.
In his victory speech, Russian President Vladimir Putin said that the "special military operation" in Ukraine was the right decision.
"You're fighting for our people in Donbas, for the safety of our motherland in Russia,” Putin added.
The Russian leader linked his war in Ukraine with that historic struggle in a speech that blamed the West for the conflict but contained no new escalations, per NBC News.
On the other side, Ukrainian President Volodymyr Zelenskyy reportedly said that “very soon there will be two Victory Days in Ukraine. “
“We won then. We will win now,” Zelenskyy said.
Market reaction
The market is paying little heed to the Victory Day event in Russia and Putin’s speech, as risk-off flows remain in play amid global growth concerns.
S&P 500 futures are down 1.60% on the day while the US dollar index is trading at 104.03, higher by 0.35%, as of writing.
Considering advanced prints from CME Group for natural gas futures markets, open interest shrank for the second session in a row on Friday, now by more than 17K contracts. In the other direction, volume went up for the second straight session, this time by around 8.5K contracts.
Natural Gas now looks to $10.00
Friday’s uptick in prices of natural gas reached fresh highs around the $9.00 mark per MMBtu. The uptick, however, was in tandem with shrinking open interest and is indicative that a deeper pullback remains out of favour for the time being. The next target of note for the commodity now emerges at the $10.00 mark.
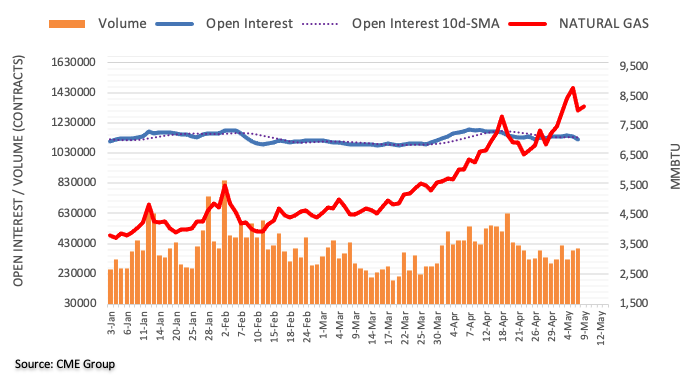
Eurozone’s investor sentiment tumbled sharply in the fifth month of 2022; the latest data published by the Sentix research group showed on Monday.
The gauge slumped to -22.6 in May from -18 in April vs. -20.8 expected. The index fell to its lowest level since June 2020, as signs of recession become clearer. The gauge tumbled for the third month in a row.
A current conditions index fell to -10.5 in May from -5.5 seen in April.
An expectations index crashed to -34.0 from -29.8, its lowest level since December 2008.
Key takeaways
"The global economy is facing a 'perfect storm.”
"The traces of the Ukraine conflict are also becoming increasingly visible in the economy.”
"The recession is becoming visible."
EUR/USD reaction
The shared currency shows little reaction to the disappointing Eurozone Sentix data. EUR/USD is losing 0.38% on the day, currently trading at 1.0511.
About Eurozone Sentix Investor Confidence
Among 1600 financial analysts and institutional investors, the Sentix Investor Confidence is a monthly survey that shows the market opinion about the current economic situation and the expectations for the next semester. The index, released by Sentix GmbH, is composed by 36 different indicators. Usually, a higher reading is seen as positive for the Eurozone, which means positive, or bullish, for the Euro, while a lower number is seen as negative or bearish for the unique currency.
EUR/USD has started the new week on the back foot. For how long can 1.05 support hold? The pair is likely to continue to face bearish pressure unless the market mood improves, FXStreet’s Eren Sengezer reports.
EUR/USD has more room on the downside
“In case Wall Street's main indexes open sharply lower and continue to suffer heavy losses, EUR/USD is likely to continue to push lower in the second half of the day.”
“In case the 1.05 level turns into resistance, 1.0470 (multi-year low set on April April 26) aligns as the next bearish target before 1.04 (psychological level, static level from December 2016).”
“On the upside, the 1.0540/1.0550 area (50-period SMA, 20-period SMA) forms dynamic resistance before 1.06 (psychological level, Fibonacci 23.6% retracement of the latest downtrend) and 1.0660 (Fibonacci 38.2% retracement, 100-period SMA).”
See: EUR/USD to extend its slide toward 1.0350 on a break below 1.05 – ING
- DXY starts the week on a strong footing north of 104.00.
- Yields in the belly and the long end of the curve extend the upside.
- Wholesale Inventories, short-term Bill Auctions next on tap.
The greenback, when tracked by the US Dollar Index (DXY), adds to the recent strength and print new cycle peaks in the 104.15/20 band on Monday.
US Dollar Index looks to yields, data
The index advances for the third session in a row on Monday and extend the uptrend to an area last visited back in December 2002 near 104.20, as market participants continue to digest Friday’s Nonfarm Payrolls figures (+428K jobs) amidst the continuation of the march north in US yields.
On the latter, the key 10y benchmark note creeps higher and approaches the 3.20% area, while the 30y bond now targets the 3.30% region.
Later in the NA session, the only release of note will be the Wholesale Inventories for the month of March ahead of a 3-month and 6-month Bill Auctions. In addition, Atlanta Fed R.Bostic (2024 voter, centrist) is also due to speak.
What to look for around USD
The dollar regained its solid appeal and managed to record new highs beyond the 104.00 mark, as investors’ expectations for a tighter rate path by the Federal Reserve have been nothing but reinforced by the FOMC event on Wednesday. The constructive stance in the dollar is also underpinned by the current elevated inflation narrative and the solid health of the labour market as well as bouts of geopolitical tensions and higher US yields.
Key events in the US this week: Wholesale Inventories (Monday) – MBA Mortgage Applications, Inflation/Core Inflation Rate (Wednesday) – Producer Prices, Initial Claims (Thursday) – Flash Consumer Sentiment (Friday).
Eminent issues on the back boiler: Escalating geopolitical effervescence vs. Russia and China. Fed’s rate path this year. US-China trade conflict. Future of Biden’s Build Back Better plan.
US Dollar Index relevant levels
Now, the index is gaining 0.36% at 104.02 and the breakout of 104.18 (2022 high May 9) would open the door to 105.00 (round level) and finally 105.63 (high December 11 2002). On the other hand, the next support emerges at 102.35 (low May 5) seconded by 99.81 (weekly low April 21) and then 99.57 (weekly low April 14).
In opinion of UOB Group’s FX Strategists Lee Sue Ann and Quek Ser Leang, further upside could now see USD/JPY revisit the 131.65 level in the next weeks.
Key Quotes
24-hour view: “We expected USD to strengthen last Friday but we were of the view that ‘131.25 is unlikely to come under threat’. USD subsequently rose to 130.80 before extending its advance during early Asian hours. The improved upward momentum suggests that USD could edge above 131.25. The next resistance at 131.60 is not expected to come into the picture. Support is at 130.55 followed by 130.30.”
Next 1-3 weeks: “Last Friday (06 May, spot at 130.40), we highlighted that there is room for USD to retest the 131.25. There is no change in our view for now. That said, momentum has improved further and a clear break of 131.25 would open up the way for USD to advance further to 131.65. Overall, only a breach of 130.00 (‘strong support’ level was at 129.60 last Friday) would indicate that upward momentum has eased.”
- USD/JPY gained traction for the third straight day and climbed to a fresh two-decade high.
- The divergent Fed-BoJ policy stance remained supportive of the ongoing positive move.
- The risk-off mood could underpin the safe-haven JPY and cap gains, only for the time being.
The USD/JPY pair maintained its bid tone through the early European session and was last seen trading around the 131.15-131.20 region, just a few pips below a fresh two-decade high.
A big divergence in the monetary policy adopted by the Fed and the Bank of Japan turned out to be a key factor that assisted the USD/JPY pair to gain traction for the third successive day on Monday. The markets seem convinced that the Fed would need to take more drastic action to bring inflation under control and have been pricing in a further 200 bps rate hike for the rest of 2022.
The prospects for a more aggressive policy tightening by the Fed remained supportive of elevated US Treasury bond yields. In fact, the yield on the benchmark 10-year US government bond rose to its highest level since November 2018, which assisted the US dollar to stand tall near a 20-year high. This further impressed bullish traders and acted as a tailwind for the USD/JPY pair.
In contrast, the BoJ has promised to conduct unlimited bond purchase operations to defend its “near-zero” target for 10-year yields and vowed to keep its existing ultra-loose policy settings. That said, the prevalent risk-off environment extended some support to the safe-haven Japanese yen and kept a lid on any further gains for the USD/JPY pair, at least for the time being.
Nevertheless, the fundamental backdrop supports prospects for a further near-term appreciating move. Hence, any meaningful dip might still be seen as a buying opportunity and remain limited. Meanwhile, Economists at Nordea expect spot prices to advance towards the 135 level by year-end: “Back in 2002, USD/JPY topped at 135 and we expect USD/JPY to move towards this level by end-2022.”
There isn't any major market-moving economic data due for release from the US, leaving the USD/JPY pair at the mercy of the USD price dynamics/US bond yields. Apart from this, traders will take cues from the broader market risk sentiment to grab short-term opportunities. The focus, however, would remain glued to the release of the latest US consumer inflation figures on Wednesday.
Technical levels to watch
The US Dollar Index (DXY) is now trading at the highest levels since 2002. This week, the US April CPI data is released on Wednesday. Barring a much weaker than expected inflation figure, the DXY should grind higher, economists at ING report.
We should see slightly softer US inflation
“Lower gasoline and used car prices should knock headline and core CPI off its highs. Any larger than expected falls can perhaps suggest that the Fed need not be as aggressive in its hiking plans.”
“Barring a much weaker than expected US inflation figure on Wednesday, we should expect DXY to grind higher still.”
“There are plenty of Fed speakers this week too. But some softening of the Fed tightening profile looks wishful thinking at this stage and it looks dangerous to position against further dollar strength.”
Are commodity currencies starting to lose some of their shine? Economists at MUFG Bank are adopting a more cautious outlook for commodity-related currencies in the near-term.
Building fears over a sharper slowdown in global growth
“We could be at a tipping point where a further move higher in prices could now be viewed as less supportive for commodity-related currencies in so far as they serve to reinforce fears over a sharper slowdown in global growth ahead.”
“USD/CAD breaking above 1.3000 and AUD/USD below 0.7000 would provide further bearish technical signals.”
Having suffered heavily last week, this week looks to be an equally formidable one for sterling. Economists at ING expect GBP/USD to slump toward 1.20 while EUR/GBP is set to hit the 0.86 mark.
Plenty of challenges this week
“1Q22 GDP is released on Thursday which may start to show the slowdown emerging in March, ahead of what could be a negative quarterly reading in 2Q22. The market still prices the Bank Rate at 2.15% by the end of the year – pricing which looks vulnerable. However, we do have a hawkish MPC member, Michael Saunders, speaking today. Tomorrow sees the Queen's speech at the opening of parliament.”
“Political commentators have been discussing the risk that the UK government will look to push ahead with a legislative agenda that could be more combative on Northern Ireland trade. The current UK trade deal is not that much better than a no-deal – yet UK government threats to tear up the N. Ireland protocol will likely weigh on a vulnerable pound.”
“Cable looks headed to 1.20 and EUR/GBP to 0.86.”
Economists at MUFG Bank believe that is too soon for US dollar sell-off but the upside scope could be more limited now.
A peak in short-term rates could be approaching
“With the Fed communication on Wednesday offering up the possibility that short-term rates are approaching a peak, incoming economic data will be crucial in determining that but we see the scope for US dollar to remain well supported for now.”
“Our DXY forecast for end-June of 104.10 is likely to be breached soon.”
Amidst the latest Brexit news, the European Union (EU) envoy said Monday, they are open to starting talks again on Northern Ireland protocol.
The EU ambassador said, “we are not ready to renegotiate protocol, we need to find jointly agreed solutions in a serene way.”
Also read: GBP/USD Weekly Forecast: The worst seems far from over, focus shifts to US inflation, UK GDP
Market reaction
GBP/USD is off the highs on the above headlines, currently trading at 1.2273, still down 0.51% on the day.
EUR/USD remains very soft. Economists at ING expect high volatility again this week, with a break under 1.05 opening up the 1.0350 mark.
ECB concern against the weak euro offers little help
“EUR/USD has derived little or no support from European Central Bank comments in effect that any further euro weakness is undesirable. And equally, ECB remarks that it could hike three times this year has had little effect on EUR/USD – faced with a 300bp tightening cycle from the Fed.”
“Expect EUR/USD volatility to stay high and a break below 1.0500 could easily be seen this week towards the next major support at 1.0350.”
“Asian FX intervention to support local currencies may also be depressing EUR/USD – as reserve managers reduce euro holdings in reserves to rebalance portfolios after dollar intervention in Asia.
- A combination of factors prompted fresh selling around gold on Monday.
- Aggressive Fed rate hike bets, elevated US bond yields acted as a headwind.
- Sustained USD buying exerted additional downward pressure on the metal.
- The risk-off environment could help limit losses for the safe-haven XAUUSD.
Gold continued with its struggle to find acceptance above the very important 200-day SMA and met with a fresh supply on the first day of a new week. The XAUUSD remained depressed through the early European session and dropped to a fresh daily low, just below the $1,870 level in the last hour amid the prospects for a more aggressive policy tightening by the Fed.
Fed Chair Jerome Powell said last week that a 75 bps rate hike is not under active consideration. The markets, however, seem convinced that the US central bank would need to take a more drastic action to curb soaring inflation and are still pricing in a further 200 bps rate hike for the rest of 2022. This remained supportive of elevated US Treasury bond yields, which, in turn, undermined the non-yielding gold.
In fact, the yield on the benchmark 10-year US government bond climbed to its highest level in more than a decade and assisted the US dollar to stand tall near a two-decade high. This was seen as another factor that weighed on the dollar-denominated gold. That said, the prevalent risk-off environment could lend some support to the safe-haven precious metal and help limit any further losses, at least for the time being.
Firming expectations for rapid interest rate hikes in the US, along with strict COVID-19 lockdowns in China, have raised concerns about slowing global growth and a possible recession. This, in turn, tempered investors' appetite for riskier assets, which was evident from a generally weaker tone around the equity markets. The anti-risk flow warrants caution for bearish traders and before positioning for any further decline.
There isn't any major market-moving economic data due for release from the US, leaving the XAUUSD at the mercy of the USD price dynamics/US bond yields. Apart from this, traders will take cues from the broader market risk sentiment to grab short-term opportunities. The focus, however, would remain on the latest US consumer inflation figures on Wednesday. This would help determine the near-term trajectory for gold.
Technical levels to watch
It is true that Russia’s economy has held up better than initially thought say in early March. Nonetheless, the outlook for Russia’s economy remains grim with the country likely to experience a deep, multi-year recession, economists at the Bank of Montreal report.
Russian economy's long-term picture does not look pretty at all
“The Russian economy may not be imploding but its long-term picture does not look pretty at all, even if a mutually acceptable peace agreement is unexpectedly brokered.”
“For now, we are forecasting real GDP to contract around 10% this year and another 2.5% in 2023.”
- USD/CHF rises to the highest levels since December 2019, up three consecutive days.
- Overbought RSI conditions can test bulls ahead of 1.0015-30 area.
- Bears remain cautious until witnessing a clear break of 200-week SMA.
Alike other major currency pair, USD/CHF also portrays the US dollar’s stellar run-up during Monday’s initial European session. In doing so, the Swiss currency (CHF) pair rises for the third consecutive day to print the highest level in more than two years.
The upside momentum breaks the 78.6% Fibonacci retracement (Fibo.) of April 2019 to January 2021 fall. However, overbought RSI conditions challenge the quote’s further upside.
Should the USD/CHF prices remain firmer beyond the 0.9920 key Fibo level, multiple tops marked between June and November of 2019, around 1.0015-30, will be a tough nut to crack for the pair buyers.
Alternatively, a daily closing below 0.9920 will need validation from the 0.9900 round figure ahead of directing bears towards the May 2020 peak surrounding 0.9800.
In a case where USD/CHF remains bearish past 0.9800, the 61.8% Fibonacci retracement and the 200-week SMA, respectively around 0.9675 and 0.9525, will be crucial for the bears to track.
Overall, USD/CHF bulls are likely to face headwinds but the overall trend remains positive.
USD/CHF: Weekly chart

Trend: Pullback expected
Unrelenting strength in the US dollar as the Federal Reserve hikes rates weighs on gold. Nevertheless, strategists at ANZ bank expect the yellow metal to remain resilient throughout the next six months around the $1,900 level.
Gold prices well supported
“Investor appetite for gold is losing its shine a bit, as the Fed raises interest rates. A stronger US dollar has surfaced as another drag for the gold prices recently.”
“We see geopolitical risks and sustained inflation protecting the downside and gold should be well supported at $1,900/oz over the next six months.”
Here is what you need to know on Monday, May 9:
The risk-averse market atmosphere is helping the dollar find demand as a safe haven at the start of the new week and the US Dollar Index is sitting at its highest level since November 2002 above 104.00. The Sentix Investors Confidence data will be featured in the European economic docket. There won't be any high-impact data releases from the US on Monday, suggesting that the market sentiment is likely to continue to drive the financial markets.
Reflecting the souring market mood, US stock index futures are down between 0.85% and 1% in the early European session. In the meantime, the benchmark 10-year US Treasury bond yield, which rose nearly 7% last week, is moving sideways above 3.1%. In the Asian session, the data from China revealed that the trade surplus widened to $51.12 billion in April. On a yearly basis, Imports declined by 2% and Exports increased by 3.9% in the same period.
In a report published over the weekend, the International Monetary Fund said that they were expecting the global growth to be close to the pre-pandemic average of 3.5%. "It still could slow more than forecast, and inflation could turn out higher than expected," the IMF further added in its publication. “This may be most salient for parts of Europe, given their relatively higher reliance on Russian energy imports.”
EUR/USD is edging lower toward 1.0500 in the early European morning on Monday. European Union (EU) Foreign Policy Chief Josep Borrell told the Financial Times on Monday that the EU should consider seizing frozen Russian foreign exchange reserves to help pay for the cost of rebuilding Ukraine after the war. Meanwhile, European Central Bank Governing Council member Olli Rehn reiterated that they may start raising rates in July but this comment failed to help the shared currency find demand.
Following last week's sharp decline, GBP/USD stays on the back foot to start the new week and was last seen trading at its lowest level since June 2020 at around 1.2270.
Supported by the broad-based dollar strength, USD/JPY holds above 131.00 and closes in on the multi-decade high it set at 131.25 in late April.
Gold registered losses for the third straight week and trades in negative territory near $1,870 early Monday. Although the risk-averse environment helps the precious metal limit its losses for the time being, another leg higher in US yields could force the pair to continue to push lower.
Bitcoin fell sharply over the weekend and extended its slide early Monday. BTC/USD was last seen trading at its lowest level since late January at $33,5000, where it was down 1.7% on a daily basis. Ethereum closed the previous four days in negative territory and failed to shake off the bearish pressure. At the time of press, ETH/USD was down 3% on the day at $2,430.
AUD’s near-term outlook remains bearish. However, economists at Westpac expect the AUD/USD pair to recoup its losses and rise above the 0.74 level.
0.7030 vulnerable
“With global growth weakening, stagflation risks rising and Chinese lockdowns extending, the AUD/USD should remain on the back foot in coming weeks, with near-term risks to support at 0.7030, then 0.6985.”
“The aussie is somewhat fragile against a US dollar bolstered by the Fed’s accelerated tightening cycle. Turbulent equity markets are also keeping a lid on AUD, so near-term trade below 0.70 is plausible.”
“Multi-week/month, a recovery to 0.74 and then higher remains likely.”
USD/CNY has breached above 6.70 mark. The Shanghai lockdown weighs on confidence regarding the economic prospects of China, economists at Commerzbank report.
Weak April trade
China's trade data for April came in roughly in line with market expectations. On one hand, the export growth slowed to small single digit, from 14.7% in the prior month. On the other hand, the import halted growth for two consecutive months, reflecting the soft domestic demand due to the virus restrictions. The overall trade sector is therefore facing strong headwinds.”
“The Shanghai lockdown implies a further disruption to global supply chains as well as a negative impact on Chinese domestic demand. Clearly, the market is pricing in economic weakness and risk of capital outflows, on the back of continued Shanghai lockdown.”
Amid depleted inventories and supply-side concerns, economists at ANZ bank expect copper to trade comfortably above the $10,000 mark.
Copper price well supported
“Copper looks well supported amid depleted inventories and supply-side concerns. Russia is the fourth-largest global producer of copper concentrate behind Chile, Peru and China, producing around 5% of the world’s copper concentrate. Supply disruptions are also emerging in South American countries, putting a floor under the price.”
“We expect prices to remain supported above $10,000/t level.”
- EUR/USD set off the week on the wrong footing, battling 1.0500.
- EUR sellers eye 1.0410 should 1.0470 support area cave in.
- 1.0600 is the level to beat for bulls, as the downside appears favored.
EUR/USD is challenging the bullish commitments at 1.0500, as the safe-haven appeal of the US dollar outshines amid roiled markets, as global growth concerns keep lurking.
Meanwhile, Fed-ECB monetary policy and economic divergence remain in play, despite the ECB policymakers making a case for a July rate hike. This central bank imbalance keeps adding to the upside in the US dollar.
China remains a key concern for markets, as of now, with stringent and extended covid lockdowns hurting the recovery in the world’s second-largest economy. Meanwhile, investors also remain wary ahead of Russian President Vladimir Putin’s Victory Day speech later this Monday. Putin is widely expected to use Victory Day to declare a military victory in the conflict. The Eurozone Sentix Investor Confidence data will be also awaited.
As observed on the daily chart, EUR/USD is extending its latest leg down towards the last week’s demand area just above 1.0470.
If that support cracks, then a fresh downswing towards the falling trendline support of 1.0410 will be inevitable.
The 14-day Relative Strength Index (RSI) is inching lower below the midline, currently sitting just above the oversold territory, allowing room for more declines.
EUR/USD: Daily chart
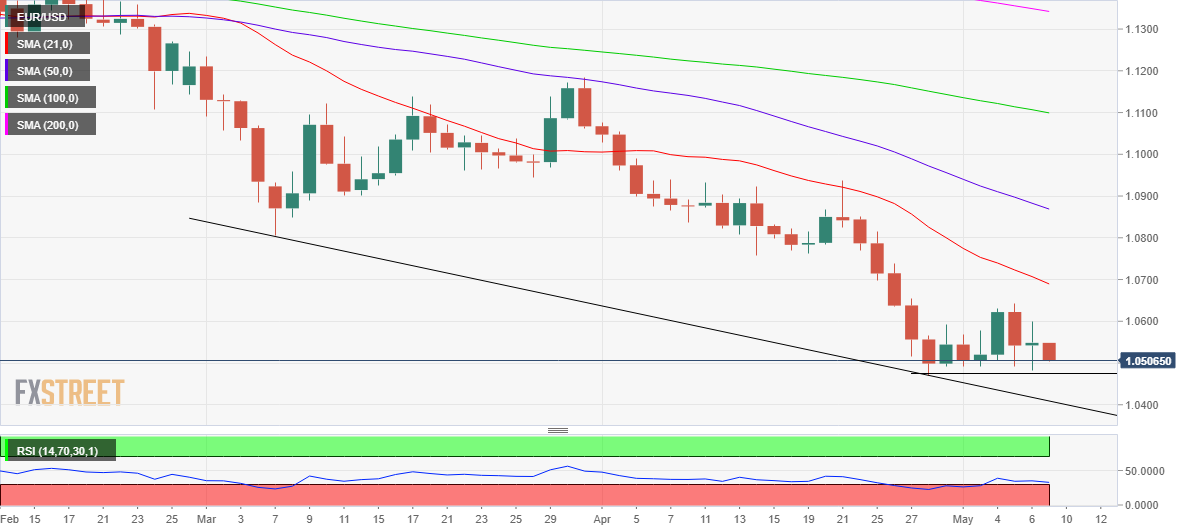
On the upside, any recovery attempts will meet stiff resistance at 1.0600, which is the round figure, as well as, Friday’s high.
The next critical resistance is aligned at 1.0641, May 5 top, above which bulls could flex their muscles towards the bearish 21-Daily Moving Average (DMA) at 1.0689.
EUR/USD: Additional levels to consider
- AUD/USD remains on the back foot for third consecutive day as sellers approach 2022 bottom.
- DXY rises to the fresh high since 2002 as market’s rush to risk-safety escalates ahead of the European open.
- China, Russia and inflation are the key challenges for global markets.
- Mixed data from Beijing, downbeat iron ore prices also strengthen the bearish bias.
AUD/USD bears are in full steam as the risk-aversion wave directs the quote towards the yearly low of 0.6966, down 1.10% around 0.6995 by the press time of early Monday morning in Europe.
The risk barometer pair’s latest fall could be linked to the US dollar’s run-up, mainly due to the safe-haven appeal and increasing chatters that the Fed won’t be able to defend “only 50 bps” rate hikes for long. That said, the US Dollar Index (DXY) refreshes the highest level since November 2002, up 0.38% to 104.10 at the latest.
Also weighing the AUD/USD prices towards the south are the mixed trade numbers from China, as well as a slump in the prices of Australia’s key export item namely iron ore.
Although China’s Trade Balance improved in the USD terms, to +51.12B versus +50.65B expected and +47.38B previous, the figures in CNY terms aren’t impressive as the trade surplus eased to CNY325.08 billion versus CNY441.88 expected and CNY300.58 billion last.
It’s worth noting that iron ore prices slump 6.0% as activity restrictions in the world’s largest metal consumer, namely China, weigh on the AUD/USD prices.
Elsewhere, fears that Russia won’t bend the knee and can keep marching its approach to invade Ukraine also exert downside pressure on the pair. Recently, the Group of Seven (G7) nations levied various sanctions on Russia but Moscow stays ready to celebrate World Wall II victory with an extravagant military parade, as well as to formally announce a declaration of war against Ukraine.
More importantly, rising fears of global stagflation, due to the surge in inflation and tighter monetary policy, act as an extra catalyst to drown the AUD/USD pair.
Amid these plays, the US 10-year Treasury yields remain firmer around the highest levels since late 2018 while stock futures drop over 1.0% by the press time.
Moving on, risk catalysts can keep the AUD/USD prices pressured towards the yearly low ahead of Tuesday’s National Australia Bank’s (NAB) sentiment data. More important will be Wednesday’s inflation numbers for China and the US, as well as Australia’s Westpac Consumer Confidence.
Technical analysis
A clear downside break of the 0.7000 threshold, comprising the support line of a two-month-old falling wedge chart pattern, directs AUD/USD prices towards the yearly low surrounding 0.6965.
- NZD/USD has plunged on heightened risk-off impulse in the market.
- The DXY has printed a fresh 19-year high at 104.11 on consecutive jumbo rate hike expectations.
- This week, the kiwi zone is expected to report Business NZ PMI at 52.8.
The NZD/USD pair is falling like a house of cards in the Asian session. The asset has been dragged lower to a low of 0.6338, till the press time, down 1% from Friday’s close. An elevation in the negative market sentiment has brought an intense sell-off in the risk-perceived assets. Eventually, investors are channelizing their funds into the US dollar index (DXY), which has recorded a fresh 19-week high at 104.11.
The DXY has displayed a sheer upside as the odds of a consecutive rate hike by the Federal Reserve (Fed) have strengthened. The disclosure of an upbeat Nonfarm Payrolls (NFP) by the US Bureau of Labor Statistics has triggered the chances of one more rate hike by 50 basis points (bps) in June. The US agency reported the additional jobs in the labor force at 428k, much higher than the preliminary estimate of 391k but a little lower than the prior print of 431k. An extremely tight labor market is signaling an extremely hawkish stance from the Fed.
Going forward, the mega event of US inflation will keep investors on the sidelines. The US inflation is likely to print at 8.1% lower than the prior print of 8.5%. A lower inflation print will be a sign of smooth execution of the policy rates by the US administration. This may trim the odds of a jumbo rate hike and will provide a sigh of relief to the market participants.
On the kiwi front, investors are awaiting the release of the Business NZ PMI, which is due on Friday. The PMI is expected to fall to 52.8 against the prior print of 53.8. A lower than expected NZ PMI print will extend weakness for the kiwi dollar.
- Platinum prices drop for the third consecutive day to refresh one-week low.
- Risk-aversion, Fed expectations underpin USD’s safe-haven appeal.
- Wednesday’s US inflation data, qualitative catalysts to direct short-term moves.
Platinum (XPT/USD) takes offers around $950 to print a three-day downtrend heading into Monday’s European session. The metal bears the burden of a broad risk-off mood, as well as a strong US dollar, as it dropped to the lowest levels in a week.
Coronavirus resurgence in China joins the global ire towards Russia, due to its invasion of Ukraine, act as the key risk catalysts of late. Also weighing on the market sentiment are chatters surrounding fears of faster monetary policy tightening, mainly due to a jump in inflation that challenges global economic growth.
Worsening covid conditions in China recently pushed Shanghai and Beijing, the key cities, to take more strict actions and announce widespread virus testing to tame the COVID-19. The resulted pause in the activities challenges the global supply chain due to China’s key place in the macroeconomic cycle.
Elsewhere, the Group of Seven (G7) nations’ sanctions on Russia, as well as Moscow’s military aggression in Eastern Ukraine, add strength to the risk-off mood.
Furthermore, the US Dollar Index (DXY) rallies to the fresh high in two decades around 104.10 by the press time, as markets keep the odds of a 75 basis points rate hike from the Fed on the table following the strong US jobs report. That said, the US Nonfarm Payrolls (NFP) reprinted the 428K figures, if compared to the revised figures for March, by surpassing the 391K forecasts. On the same line, the Unemployment Rate also remained intact at 3.6%.
Looking forward, the risk-aversion wave can keep XPT/USD pressured but Wednesday’s US Consumer Price Index (CPI) data will be important to watch.
Technical analysis
Unless crossing a seven-week-old descending resistance line, around $996.00, platinum prices stay directed towards the yearly low surrounding $908.00. Also acting as the short-term key resistance is the 200-DMA level near $1005.00.
Gold Price is back in the red zone on Monday after facing rejection below the $1,900-mark last Friday. XAU/USD eyes $1,850 yet again amid a potential bear flag, FXStreet’s Dhwani Mehta reports.
Potential bearish flag keeps XAU/USD’s downside favored
“Investors remain concerned about the global growth prospects, in the face of the central banks’ tightening, China’s extended lockdowns and fresh G7 sanctions on Russian oil. So long as the Treasury yields hold near multi-year highs, the odds for a sustained Gold Price recovery remain weak.”
“XAU/USD has carved out a bear flag on the daily chart. Daily closing below the rising trendline support at $1,868 will confirm the bearish continuation formation, opening floors for a fresh sell-off towards the $1,850 psychological barrier. The next key support awaits at $1,836, the horizontal 200-Daily Moving Average (DMA), below which a test of the $1,800 threshold will be inevitable.
“Acceptance above the rising trendline resistance at $1,895 on a daily closing basis is needed for any meaningful recovery. A sustained move above the latter will invalidate the bearish thesis for the time being. Gold bulls will then look to retest the intermittent tops around the $1,910 region, above which the critical $1,920 hurdle will come into play.”
The International Monetary Fund (IMF) released a report on Sunday, citing the impact of rising oil prices might on inflation global inflation and growth outlook.
Key takeaways
“For some, rising oil prices may echo the 1970s when geopolitical tensions also caused fossil fuel prices to spike.”
“Memories of the high inflation and slow growth that followed—known as stagflation—have fueled concerns about a possible repeat. Importantly, though, times have changed.”
“Central banks, too, have changed since the 1970s. More are independent today, and the credibility of monetary policy has broadly strengthened over the intervening decades.”
“We expect global growth to be close to the pre-pandemic average of 3.5 percent, even after our April World Economic Outlook lowered projections, but it still could slow more than forecast, and inflation could turn out higher than expected.”
“This may be most salient for parts of Europe, given their relatively higher reliance on Russian energy imports.”
Related reads
- WTI recovers intraday losses on the dubious promise of more oil by the OPEC
- Crude Oil Futures: Further upside seems contained
CME Group’s flash data for crude oil futures markets noted traders scaled back their open interest positions by around 54.2K contracts on Friday. Volume, instead. Increased for the third session in a row, this time by around 13.5K contracts.
WTI: Bulls keep targeting $116.60
Prices of the WTI extended the weekly recovery on Friday. The move, however, was amidst shrinking open interest and leaves the prospects for further uptrend somewhat curtailed. The commodity, in the meantime, continues to aim at another test of the late March high at $116.60 (March 24).
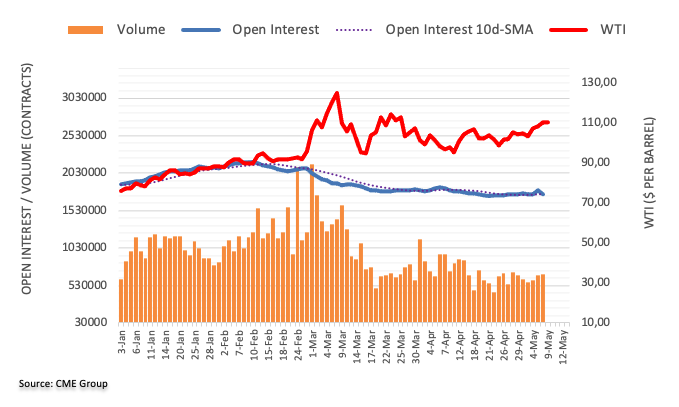
The kiwi is at 2022 lows as the USD extended its winning streak ahead of key US CPI data this week. Stronger-than-expected inflation would lift the greenback, economists at ANZ Bank report.
The reality of volatility bites
“It is hard to anticipate any let-up in generalised volatility given this week’s data schedule, with US CPI topping the list, and NZ inflation expectations data also due. Risks around US CPI feel binary; a moderation from 8.5% (to 8.1% as markets expect) would be mildly comforting, but a lift would doubtless revive expectations for 75bp Fed hikes, and probably give the USD a boost.”
“The idea that synchronised global tightening might proceed gently now feels like a forgotten dream as the reality of volatility bites.”
“Support 0.5940/0.6230 Resistance 0.6465/0.6545/0.6700”
- Oil prices are expected to extend their gains on open rejection-reverse formation.
- The OPEC’s promise to pump more oil seems doubtful.
- More Covid-19 contain measures in China are underpinning demand worries.
West Texas Intermediate (WTI), futures on NYMEX, is displaying back and forth moves in a narrow range of 108.63-108.90. The oil prices have recovered their entire intraday losses on firmer responsive buying action. As the asset has recuperated after a downside move, the oil prices have triggered a bullish open rejection-reverse in which the asset could extend its gains after overstepping the opening price at $109.21 decisively.
Oil prices are expected to remain in the grip of bulls as the biasness of the market participants over the oil counter is intact. Despite the promise of more oil by the OPEC last week, oil prices are flexing their muscles. The OPEC promise to pump more oil seems dubious as a few OPEC members including Nigeria and Angola are failing to meet their desired quotas. Two major oil producers UAE and Saudi Arabia carry the potential to increase their output but they are currently producing around 10.5 million barrels per day (bpd). So elevation of oil output further in an already higher supply environment looks difficult to achieve.
Meanwhile, rising curbs in two major cities of China: Shanghai and Beijing are denting the aggregate demand. It is worth noting that China is the biggest importer of oil in the world and slippage in demand for oil by the giant elevates concerns over the oil demand.
AUD/USD remains under pressure and could retest the 0.6995 level in the near term, commented UOB Group’s FX Strategists Lee Sue Ann and Quek Ser Leang.
Key Quotes
24-hour view: “We expected AUD to ‘trade between 0.7060 and 0.7160’ last Friday. AUD subsequently traded between 0.7059 and 0.7135 before dropping below 0.7060 during early Asian hours. Downward momentum has improved and AUD could decline further. That said, the major support at support at 0.6965 is unlikely to come under threat (0.6995 is already a strong support). Resistance is at 0.7070 followed by 0.7100.”
Next 1-3 weeks: “Our latest narrative was from last Friday (06 May, spot at 0.7125) where AUD could trade between 0.7030 and 0.7210. We highlighted that ‘looking ahead, AUD has to close below 0.7030 before a sustained decline is likely’. AUD closed at 0.7074 (-0.56%) before dropping sharply during early Asian. The rapid improvement in downward momentum suggests that AUD is likely to challenge the major support at 0.6995, possibly 0.6965 as well. Only a breach of 0.7140 (‘strong resistance’ level) would indicate that AUD is not ready to head lower.”
Oil usually rises and falls with the overall stock market because the prices of both are seen as proxies for economic activity. But that relationship has broken down recently. In the opinion of Andrew Sheets, Chief Cross-Asset Strategist at Morgan Stanley, oil may continue to outperform on a cross-asset basis.
Are oil and stock prices now disconnected?
“As stock markets have fallen, oil prices have held up. We think that oil will continue to outperform on a cross-asset basis. If you're in an environment where economic activity is strong right now, but also might slow in coming years, equity and credit markets can start to weaken even as energy prices hold up. I think that's a pretty decent description of the current backdrop.”
“Oil prices could rise further if the war in Ukraine escalates, a scenario that would likely push prices down in other asset classes. But if geopolitical risk declines, there could be better growth, more economic confidence, and more energy demand, meaning oil might not fall much relative to forward expectations. That positive skew of outcomes should be supportive of oil.”
“We forecast higher prices for oil, and for oil-linked currencies like the Norwegian krone.”
Open interest in gold futures markets reversed three consecutive daily builds and shrank by around 18.8K contracts on Friday, according to preliminary readings from CME Group. On the other hand, volume rose for the second session in a row, this time by around 4.3K contracts.
Gold remains supported by $1850
Friday’s uptick in gold prices was amidst shrinking open interest, hinting at the idea that further upside appears somewhat capped, while occasional bearish moves are expected to meet contention around $1850 for the time being.
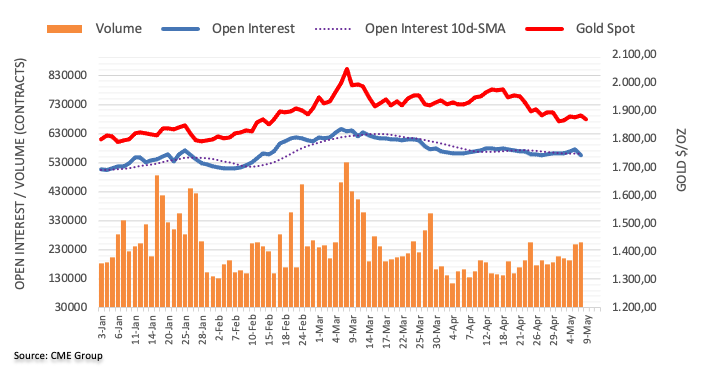
- Iron ore Futures in China dropped 6.0% as demand from the largest user deteriorates in April.
- Global growth fears, a firmer USD also weighs on the commodity’s prices.
Iron ore prices on the Dalian Commodity Exchange not only fail to extend Friday’s corrective pullback but also drops more 6.0% while taking offers towards $124.00 heading into Monday’s European session.
The metal’s latest weakness takes clues from the downbeat China trade numbers. “China's April iron ore imports fell 1.4% from a month earlier, official customs data showed on Monday, as overall purchases were impaired by lean demand at mills while the pandemic situation still disrupted shipments,” said Reuters.
Worsening covid conditions in China drown commodity demand from the world’s biggest customer. The latest activity restrictions in Beijing and Shanghai, the dragon nation’s major cities, weigh on investor sentiment and commodity prices.
Other than China-linked demand fears, the broad strength of the US dollar and global economic woes, mainly due to the spiraling inflation and geopolitical tussles between Russia and Ukraine, also weigh on the Iron ore prices. Furthermore, increasing odds of the Fed’s faster/heavier rate hikes also underpins the US dollar, which in turn has an inverse relationship with the iron ore prices.
To sum up, the short-term outlook for the metal remains bearish considering pessimism for China and the global economy, as well as hopes of faster monetary policy normalization. It should be noted, however, that Friday’s US Consumer Price Index (CPI) for April will be crucial data to watch as the Fed has recently rejected odds of heavier rate hikes.
Further downside momentum could drag cable to the mid-1.2200s in the near term, suggested UOB Group’s FX Strategists Lee Sue Ann and Quek Ser Leang.
Key Quotes
24-hour view: “We highlighted last Friday that ‘the oversold weakness in GBP has scope to extend to 1.2300 before stabilization is likely’. We added, ‘the next support at 1.2250 is unlikely to come under threat’. GBP subsequently dropped to 1.2276 before rebounding. The weakness in GBP appears to have stabilized somewhat and this coupled with oversold conditions suggests that GBP is unlikely to weaken much further. For today, GBP is more likely to trade between 1.2270 and 1.2370.”
Next 1-3 weeks: “Last Friday (06 May, spot at 1.2370), we highlighted that the rapid and strong build-up in momentum suggests GBP could weaken further. We added, ‘the next support is at 1.2250’. GBP subsequently dropped to 1.2276. Further weakness still appears likely even though oversold shorter-term conditions could lead to a couple of days of consolidation first. Looking ahead, the next support below 1.2250 is at 1.2200. On the upside, a breach of 1.2450 (‘strong resistance’ level was at 1.2500 last Friday) would indicate that the current downward pressure has eased.”
On Wednesday, the US Bureau of Labor Statistics will publish the April Consumer Price Index (CPI) data. Gold could test 200-day SMA on a hot print, FXStreet’s Eren Sengezer reports.
US inflation report could impact the dollar's market valuation significantly
“If CPI figures confirm the view that inflation may have already peaked in March, the dollar could face renewed selling pressure with investors reassessing the Fed’s rate decision in June. In such a scenario, US T-bond yields are likely to decline and fuel a leg higher in gold. On the flip side, markets should stick to the view of a 75 bps hike in June if CPI data surprises to the upside.”
“A relaxation of coronavirus restrictions in China could help the yellow metal gain traction on improving demand outlook and vice versa.”
“In case XAU/USD starts using $1,880 as support, it could extend its recovery toward $1,900. Only a daily close above the latter could open the door for additional gains toward the $1,920/$1,930 area (Fibonacci 50% retracement of the latest uptrend, 20-day SMA, 50-day SMA).”
“On the downside, key support seems to have formed at $1,860 (static level). In case this level fails, gold is likely to test the 200-day SMA at $1,840.”
European Union (EU) Foreign Policy Chief Josep Borrell said in a Financial Times (FT) interview on Monday, the bloc should consider seizing frozen Russian foreign exchange reserves to help pay for the cost of rebuilding Ukraine after the war.
Key quotes
“It would be logical for the EU to do what the United States did with Afghan central bank assets after the Taliban took over the Asian nation.”
"We have the money in our pockets, and someone has to explain to me why it is good for the Afghan money and not good for the Russian money.”
Market reaction
EUR/USD remains vulnerable just a few pips above 1.0500, shedding 0.41% on the day.
- Gold reverses Friday’s corrective pullback, takes offers to renew daily lows.
- Market sentiment sours as China’s covid conditions, G7 sanctions on Russia join fears of Fed’s faster rate hikes.
- US inflation becomes the key event, risk catalysts may entertain traders.
- Gold and silver outperform stocks and bonds during stagflation
Gold (XAU/USD) portrays the risk-aversion wave during early Monday morning in Europe as it drops below the short-term key support, now resistance around $1,875.
The yellow metal’s latest weakness could be linked to the broad US dollar strength due to the market’s rush for risk-safety, as well as hopes that the Fed won’t be able to reject 75 basis points (bps) rate hikes for long.
Surging covid cases and the resulting lockdowns in China, one of the world’s biggest gold customers, join the Group of Seven (G7) nations’ sanctions on Russia to weigh on the market sentiment. Also weighing on the gold prices are the growing fears of economic stagnation as the supply crunch propels inflation worries.
Fed Chair Jerome Powell’s rejection of 75 basis points (bps) of a rate hike couldn’t keep gold buyers happy for long as Friday’s mostly firmer US jobs report renew concerns that the Fed has room for faster/heavier tightening.
The US Nonfarm Payrolls (NFP) reprinted the 428K figures, if compared to the revised figures for March, by surpassing the 391K forecasts. On the same line, the Unemployment Rate also remained intact at 3.6%.
Following the data, Minneapolis Fed President and FOMC member Neel Kashkari said in a blog post on Medium, “Given that long-term real rates have the greatest influence on the demand for credit, financial conditions are already nearly back to neutral levels.” The policymaker also said his assessment of the nominal neutral rate of interest is still that it is around 2.0%. It’s worth noting that the President of the Federal Reserve Bank of St. Louis James Bullard reiterated his bullish bias and pushed the Fed towards a 3.5% rate.
With the Fed policymakers’ almost hawkish comments and firmer jobs report from the US, Wednesday’s US Consumer Price Index (CPI) for April will be crucial for gold traders to watch as the same propels the US dollar’s run-up at the 20-year high.
Technical analysis
Gold extends the previous week’s bearish grind for the fourth consecutive time by breaking a one-week-old symmetrical triangle to the downside, previously between $1,892 and $1,875. The metal moves are also backed by steady RSI and non-eye-catching MACD signals, suggesting further weakness.
That said, the odds are against buyers as a downward sloping trend line from April 22 and the 200-SMA, respectively around $1,905 and $1,930, act as additional filters to the north. Even if the gold prices manage to cross the $1,930 hurdle, a horizontal area from late March, surrounding $1,965, will be the key hurdle to watch.
Meanwhile, a clear downside break of the $1,875 becomes necessary for the XAU/USD bears to keep reins. Following that, they won’t hesitate in refreshing the monthly low, currently around $1,850.
Though, an upward sloping trend line from August 2021, close to $1,830 by the press time, will be a crucial support to follow afterward.
Gold: Four-hour chart
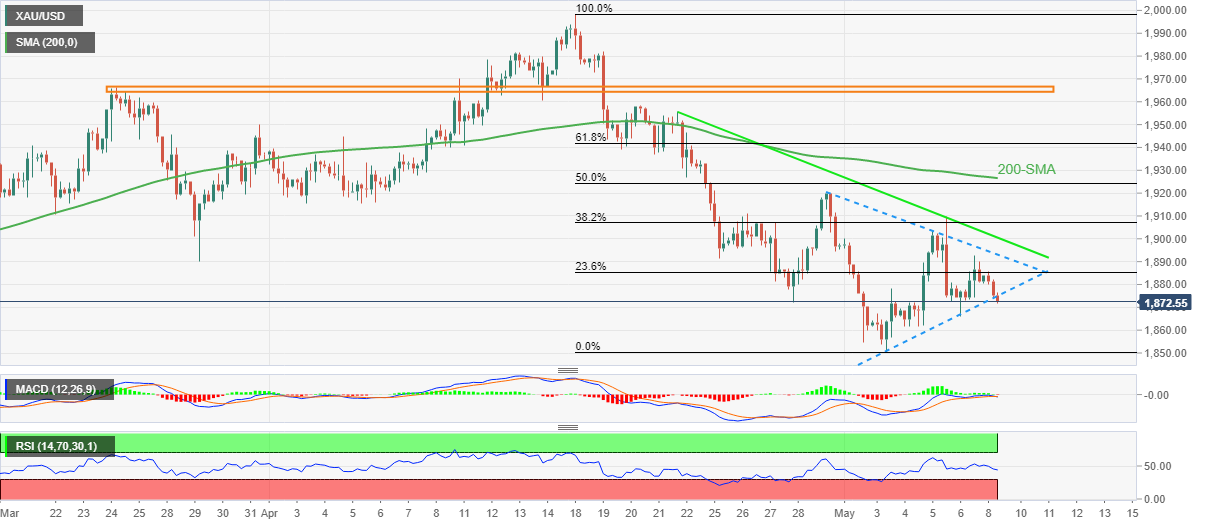
Trend: Further weakness expected
- Cable sees more downside on Inverted Flag formation.
- The RSI (14) has tumbled below 40.00, which favors the downside.
- The 20-EMA has acted as a major barricade for the asset.
The GBP/USD pair is oscillating in a range of 1.2280-1.2376 after a sheer downside from last week’s high at 1.2638. The cable is inching lower right from the first order placed in the Asian session at 1.2349. The asset is likely to touch the previous week’s low at 1.2276.
The formation of an Inverted Flag chart pattern on an hourly scale is indicating the continuation of a bearish momentum after a consolidation phase. Usually, a consolidation phase after a downside move denotes the placement of offers by the initiative sellers, which prefer to enter after an establishment of a downside move.
The asset is facing headwinds from the 20-period Exponential Moving Average (EMA), which is trading at 1.2328. Meanwhile, the 50-EMA at 1.2372 is scaling firmly lower, which adds to the downside filters.
The Relative Strength Index (RSI) (14) has slipped below 40.00 from its oscillation range of 40.00-60.00, which signals a fresh impulsive downside wave going forward.
A decisive drop below the previous week’s low at 1.2276 will push the asset towards the 7 April 2020 low of 1.2164. Breach of the latter will drag the asset towards the 18 May 2020 low at 1.2075.
On the flip side, pound bulls could regain strength if the asset oversteps April 28 low at 1.2411. This will send the asset towards the psychological resistance at 1.2500, followed by the previous week’s high at 1.2638.
GBP/USD hourly chart
-637876689575031023.png)
- USD/IDR rises to one-week high on softer Q1 2022 Indonesia GDP, firmer inflation for April.
- Broad risk-off mood underpins US dollar, China’s mixed trade numbers also favored buyers.
USD/IDR remains on the front foot at around $14,550 even after Indonesia reports a minimal change in the Q1 2022 GDP during early Monday. The pair’s weakness could be linked to the broad risk-off mood and the firmer Treasury yields that propel the US dollar.
That said, Indonesia’s Gross Domestic Product (GDP) for the first quarter (Q1) of 2022 rose 5.01% YoY versus market expectations of 5.00% and 5.02% prior. The QoQ figures dropped more than -0.89% expected to -0.96%, versus 1.06% prior.
While the growth numbers dwindles in the first quarter, the Consumer Price Index (CPI) for April rose past 0.83% MoM forecast to 0.95%. Further, the YoY prints also crossed 3.34% market consensus with 3.47% figures.
It’s worth noting that Indonesia’s close trade links with China also fuelled USD/IDR prices after Beijing reported mixed trade numbers for April.
Above all, the recently firmer covid woes in China, as well as the Group of Seven (G7) nations’ sanctions on Russia, appear as the key challenges to the global market sentiment of late. On the same line are growing inflation fears and resulting concerns surrounding growth, especially in Asian nations where China’s coronavirus conditions join the burden from the Western central bankers.
Against this backdrop, the US 10-year Treasury yields to the fresh high since late 2018, up by two basis points (bps) near 3.15% by the press time, while S&P 500 Futures drop 1.0% and also push the US Dollar Index (DXY) to poke the 20-year high around 104.00 at the latest.
Looking forward, Wednesday’s US inflation data will be crucial for the markets after Fed Chair Jerome Powell rejected the odds of 75 basis points (bps) rate hike. That said, The US Nonfarm Payrolls (NFP) reprinted the 428K figures, if compared to the revised figures for March, by surpassing the 391K forecasts. On the same line, the Unemployment Rate also remained intact at 3.6%.
Technical analysis
A successful rebound from 50-day EMA, around $14,400, directs USD/IDR towards the previous week’s top surrounding $14,585.
UOB Group’s FX Strategists Lee Sue Ann and Quek Ser Leang noted EUR/USD risks a deeper pullback if 1.0470 is cleared in the next weeks.
Key Quotes
24-hour view: “We highlighted last Friday that ‘there is room for the weakness in EUR to extend even though a break of last week’s low at 1.0470 appears unlikely’. EUR subsequently dropped to 1.0481 before rebounding. The current movement appears to be part of consolidation. In other words, EUR is likely to trade sideways for today, expected to be within a range of 1.0490/1.0585.”
Next 1-3 weeks: “Our view from last Friday (06 May, spot at 1.0540) still stands. As highlighted, EUR has to close below the solid support at 1.0470 before a sustained decline is likely. The chance for EUR to close below 1.0470 would remain intact as long as it does not move above 1.0640. Looking ahead, if EUR closes below 1.0470, the next support level to monitor is at 1.0420.”
- Risk-off impulse has weighed pressure on the Asian equities.
- Chinese equities turned negative on mixed Trade Balance data.
- Oil prices to march higher despite the promise of more oil supply from the OPEC.
Markets in the Asian domain are trading sharply lower as strengthening expectations of one more rate hike by the Federal Reserve (Fed) in June has underpinned negative market sentiment. Tightening the interest rates at a much higher pace is raising concerns over the growth rate going forward. An extreme liquidating tightening measures are going to absorb liquidity from the economy and henceforth difficulty in tapping funds for investment by corporate will dent the employment levels and aggregate demand.
At the press time, Japan’s Nikkie225 plunges 2.20%, China A50 sheds 1.21%, Hang Seng nosedives 3.81% and India’s Nifty50 erased 1.5%.
Chinese markets have plunged sharply despite a flat-to-positive opening on Monday. Lower than expected trade balance for April has brought a sell-off in the Chinese equities. China's Trade Balance for April, in Yuan terms, came in at CNY325.08 billion versus CNY441.88 as expected. While the exports rose by 1.9% last month against the consensus of 16.4%.
Oil prices have recovered their entire losses recorded in the early Asian session. This has also weighed pressure on the Asian equities, being a major importer of oil in the entire world. The unreliable promise of pumping more oil into the global supply failed to push the oil prices lower. The OPEC cartel has promised t pump more oil but some nations are unable to provide the discussed inventories. Also, banning oil from Russia has raised concerns over the supply worries.
- USD/JPY remains on the front foot around 20-year top marked in April.
- Short-term bearish chart pattern, overbought RSI may trigger pullback moves but buyers remain hopeful above fortnight-old support line.
USD/JPY stays bullish as the three-day upside momentum approaches a two-decade high flashed last month. However, an immediate rising wedge bearish chart formation joins overbought RSI conditions to test the further upside. That said, the yen pair seesaws around 131.00, up 0.30% intraday, during early Monday morning in Europe.
In addition to the overbought RSI and the wedge’s resistance around 131.20, the previous multi-year high of 131.25, will also act as nearby upside filters to challenge USD/JPY bulls.
Should the USD/JPY prices rally beyond 131.25, the upward trajectory can slowly approach the year 2002’s high surrounding 135.20.
Alternatively, a downside break of 130.70 can confirm a short-term downside targeting the 200-HMA and an ascending support line from April 26, respectively around 129.85 and 129.30.
However, a clear downside break of 129.30 won’t hesitate to aim for the year 2015’s high surrounding 125.85.
Overall, USD/JPY remains firmer but a short-term pullback can’t be ruled out.
USD/JPY: Hourly chart
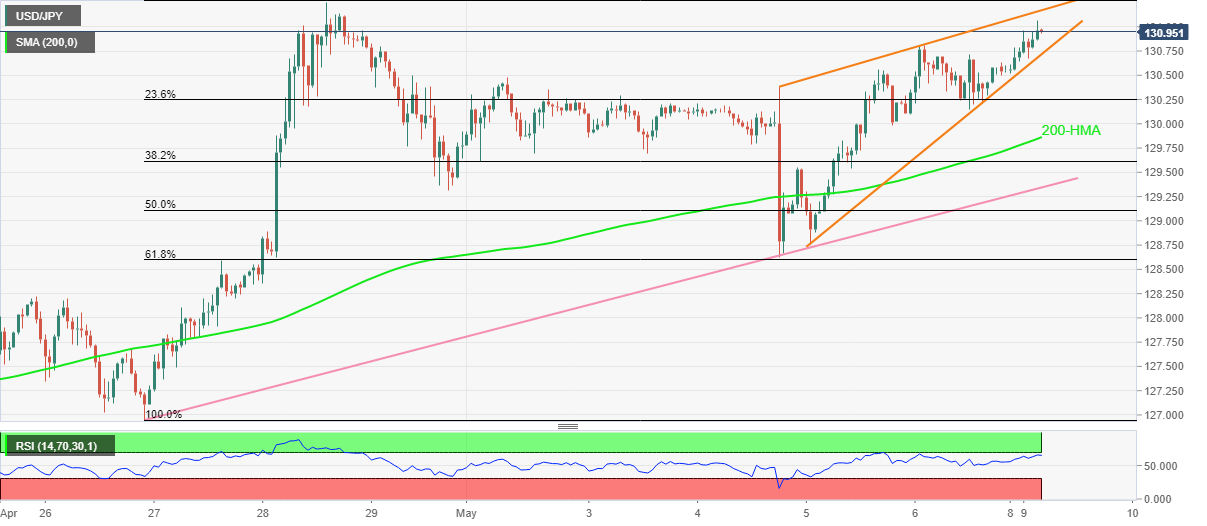
Trend: Pullback expected
China's Trade Balance for April, in Yuan terms, came in at CNY325.08 billion versus CNY441.88 expected and CNY300.58 billion last.
The exports rose by 1.9% last month vs. 16.4% expected and 12.9% previous.
Imports decreased by 2.0% vs. -2.9% expected and -1.7% prior.
In USD terms,
China reported a bigger-than-expected growth in the trade surplus, as imports and exports outpaced expectations.
Trade Balance came in at +51.12B versus +50.65B expected and +47.38B previous.
Exports (YoY): 3.9% vs. +3.2% exp. and +14.7% prior.
Imports (YoY): 0% vs. -3.0% exp. and -0.1% last.
Additional takeaways
China Jan-April yuan-denominated exports +10.3% YoY.
China Jan-April yuan-denominated imports +5.0% YoY.
China Jan-April trade balance $+212.93 bln.
China Jan-Apr dollar-denominated exports +12.5% y/y, imports +7.1% YoY.
China April trade surplus with the US $32.2 bln vs $32.1 bln surplus in March.
FX implications
AUD/USD remains unperturbed by the mixed Chinese trade figures, keeping its downside momentum intact just above 0.7000. The spot is down roughly 1% on the day.
- USD/INR takes the bids to refresh all-time high, up for third consecutive day.
- Oil prices, chatters of RBI intervention and growth fears amplify bearish bias over INR.
- News concerning China, Russia joins strong yields to also underpin USD strength.
With the US dollar bulls cheering the broad risk-off mood, as well as the firmer Treasury yields, the USD/INR renews the historical top above 77.00 during Monday’s Asian session. That said, the Indian rupee (INR) pair takes the bids to refresh its all-time high with a 77.43 level at the latest.
The escalated covid fears in China, as well as the Group of Seven (G7) nations’ sanctions on Russia, appear as the key challenges to the global market sentiment of late. On the same line are growing inflation fears and resulting concerns surrounding growth, especially in Asian nations where China’s covid conditions add to the toll.
Furthermore, Friday’s US jobs report for April and the following comments from Fed speakers fail to justify Fed Chair Jerome Powell’s rejection of 75 basis points (bps) of a rate hike. The US Nonfarm Payrolls (NFP) reprinted the 428K figures, if compared to the revised figures for March, by surpassing the 391K forecasts. On the same line, the Unemployment Rate also remained intact at 3.6%.
Following the data, Minneapolis Fed President and FOMC member Neel Kashkari said in a blog post on Medium, “Given that long-term real rates have the greatest influence on the demand for credit, financial conditions are already nearly back to neutral levels.” The policymaker also said his assessment of the nominal neutral rate of interest is still that it is around 2.0%. It’s worth noting that the President of the Federal Reserve Bank of St. Louis James Bullard reiterated his bullish bias and pushed the Fed towards a 3.5% rate.
On a different page, speculations over the state-run banks’ dollar sales and the RBI’s intervention also fuel the USD/INR prices.
Amid these plays, the US 10-year Treasury yields to the fresh high since late 2018, up by two basis points (bps) near 3.15% by the press time, while also pushing the US Dollar Index (DXY) to poke the 20-year high around 104.00 at the latest.
Moving on, pessimism in Asia joins the firmer USD to keep the USD/INR prices pressured towards a fresh record high. However, Wednesday’s inflation numbers will be important to watch for fresh impulse.
Technical analysis
A clear upside break of the two-month-old descending trend line, around 77.05 by the press time, directs USD/INR towards the 78.00 threshold.
- The 0.6968-0.6992 range demand zone will act as a pullback zone for the asset.
- Descending 20- and 50-EMAs are still favoring greenback bulls.
- The RSI (14) is expected to rebound as exhaustion looks likely.
The AUD/USD pair dropped sharply on Monday after slipping below the crucial support of 0.7030, which is the previous week’s low. The asset has recorded a low of 0.7004, short of the psychological support of 0.7000. A bearish open test-drive move has been displayed in the Asian session as the asset found responsive sellers on printing a marginal high of 0.7070 after opening at 0.7064.
The asset has remained vulnerable in the last week after posting a high of 0.7266. An ongoing bearish momentum is likely to drag the asset the demand zone placed in a range of 0.6968-0.6992. The major is likely to find a pullback as profit-booking may kick in.
The 20-and 50-period Exponential Moving Averages (EMAs) at 0.7205 and 0.7273 respectively are scaling lower, which still favors the downside. Meanwhile, the Relative Strength Index (RSI) (14) is showing minor signs of exhaustion below 40.00.
The asset is expected to deliver a pullback after slipping near the demand zone placed in a range of 0.6968-0.6992. This may push the asset higher towards the February 14 low at 0.7085, followed by the 20-EMA at 0.7205.
On the flip side, greenback bulls may continue their bullish momentum if the asset drops below the above-mentioned demand zone decisively. This will send the asset towards the 2 July 2020 low and the round level support at 0.6902 and 0.6800 respectively.
AUD/USD daily chart
-637876640032173193.png)
- EUR/USD reverses Friday’s corrective pullback, stays pressured towards yearly low.
- China’s covid conditions, G7 sanctions on Russia intensify risk aversion.
- Fears of Fed’s faster/heavier rate hikes keep US Treasury yields, USD on the front foot.
- Second-tier data, ECB’s Lagarde may entertain traders ahead of Wednesday’s US inflation data.
EUR/USD bears return to the table, following Friday’s failed attempt to rebound from the yearly low, as risk aversion joins the chatters surrounding monetary policy divergence between the European Central Bank (ECB) and the US Federal Reserve (Fed).
Even if Fed Chair Jerome Powel rejected the idea of 75 basis points (bps) of a rate hike, fears of inflation weighing on the economic growth and Friday’s upbeat US jobs report for April suggest that the Fed hawks aren’t off the table.
The US Nonfarm Payrolls (NFP) reprinted the 428K figures, if compared to the revised figures for March, by surpassing the 391K forecasts. On the same line, the Unemployment Rate also remained intact at 3.6%.
Following the data, Minneapolis Fed President and FOMC member Neel Kashkari said in a blog post on Medium, “Given that long-term real rates have the greatest influence on the demand for credit, financial conditions are already nearly back to neutral levels.” The policymaker also said his assessment of the nominal neutral rate of interest is still that it is around 2.0%. It’s worth noting that the President of the Federal Reserve Bank of St. Louis James Bullard reiterated his bullish bias and pushed the Fed towards a 3.5% rate.
On the other hand, ECB Board Member Frank Elderson mentioned on Friday, “The ECB must ensure that high inflation doesn't become entrenched in people's expectations,” reported Reuters. Before him, German central bank head Joachim Nagel said that the window for the ECB to take monetary policy measures was slowly closing. However, French central bank head Francois Villeroy de Gala stated that it is “reasonable to raise rates into positive territory by the year-end.”
Hence, the policy haws are flexing muscles at both ends but the bloc’s economics aren’t as strong as for the US, which in turn keeps the Fed to have an upper hand and cheers the bets for faster rate hikes. The same propels the US Treasury yields to the fresh high since late 2018, up two basis points (bps) near 3.15% by the press time, while also fueling the US Dollar Index (DXY) to poke the 20-year high around 104.00 at the latest.
Elsewhere, the worsening covid conditions and the resulting strict activity restrictions, recently in Shanghai pushed Chinese Premier Li Keqiang to warn of a "complicated and grave" employment situation as the country imposed sweeping lockdowns to contain Covid-19 outbreaks,” per Bloomberg.
Also challenging the mood is the global pressure on Russia, as it escalates fighting in Eastern Ukraine. During the weekend, the G7 nations held a virtual call with Ukrainian President Volodymyr Zelensky and said, per Reuters, “They would cut off key services on which Russia depends, reinforcing the isolation of Russia "across all sectors of its economy."
Looking forward, a light calendar for the day may restrict short-term moves of the EUR/USD prices, keeping them southwards. However, Wednesday’s US Consumer Price Index (CPI) and ECB President Christine Lagarde's speech will be crucial for the near-term direction.
Technical analysis
Unless providing a daily close beyond a downward sloping trend line from March 31, around 1.0600, EUR/USD remains vulnerable to visiting 2017’s yearly bottom surrounding 1.0340.
- Gold price has tumbled below $1,880.00 as the DXY has strengthened on the souring market mood.
- Upbeat US NFP has raised the odds of a consecutive rate hike by the Fed in June.
- The US CPI is seen as lower to 8.1% than the former figure of 8.5%.
Gold Price (XAU/USD) is continuously dropping lower in the Asian session after a flat open. The precious metal has displayed a bearish open test-drive session on Monday. The bright metal opened at $1,883.45 and moved a little higher to $1,884.94 but a quick response from responsive sellers dragged the gold prices lower. At the press time, the yellow metal is trading at $1,877.04 and has eased 0.37% from the last week’s closing price, and is inching lower to test the round level support of $1,870.00.
The carry-forward of negative market sentiment on Monday has fueled the US dollar index (DXY). The DXY is advancing higher to test 104.00 as higher-than-expected US Nonfarm Payrolls (NFP) released last week, have bolstered the expectations of one more jumbo rate hike by the Federal Reserve (Fed) in June. Inflation is scaling higher and higher NFP will add to the inflationary pressures as a tight labor market will push the wage price index higher.
This week, the US Consumer Price Index (CPI) will remain in the limelight. The US CPI is seen at 8.1% lower than the prior print of 8.5%. An unexpected slippage seen in the US inflation figures may dent the demand for the DXY as the odds of a bumper rate hike in June will get trimmed.
Gold technical analysis
A formation of a symmetrical triangle chart pattern is signaling indecisiveness in the sentiment of the market participants going forward. The downward trendline is placed from April 29 high at $1,920.02 while the ascending trendline is plotted from last week’s low at $1,855.00. The precious metal has senses resistance from the 200-period Exponential Moving Average (EMA) at $1,888.20.
The momentum oscillator, Relative Strength Index (RSI) is oscillating in a 40.00-60.00 range but on the verge of slipping below 40.00, which will infuse an adrenaline rush into the bears.
Gold hourly chart
-637876619286967760.png)
Chinese Premier Li Keqiang warned of a “complicated and grave” employment situation as the country’s covid lockdowns begin to weigh on the labor market.
Key quotes
“Stabilizing employment matters to people’s livelihoods, it is also a key support for the economy to operate within a reasonable range.”
“China will also promote the healthy development of internet platform companies to support employment.”
Related reads
- USD/CNH Price Analysis: Bulls pierce 200-week SMA to renew 18-month high
- Weekend news and economic data risks for the open
- USD/CNY fix: 6.6899 vs. the last close of 6.6651
| Raw materials | Closed | Change, % |
|---|---|---|
| Brent | 113.29 | 1.95 |
| Silver | 22.343 | -0.72 |
| Gold | 1882.49 | 0.31 |
| Palladium | 2025.57 | -7.13 |
USD/JPY takes the bids to refresh a one-week high around 130.90 as strong Treasury yields underpin the bullish bias during Monday’s Asian session.
Also keeping the USD/JPY buyers hopeful is the bullish outlook in the options market, as portrayed by the highest weekly risk reversal (RR) in six, the ratio between call and put premiums.
That said, the weekly RR rose to 0.375 by the end of Friday, the highest since March 25, whereas the daily print rose to 0.313 per the latest reading.
Inflation fears and hopes of faster/heavier Fed rate hikes keep the US Treasury yields directed towards the north. Also, fears of worsening covid woes in China and the global leaders’ sanctions on Russia keep the USD/JPY on the front foot, mainly due to the US dollar’s safe-haven appeal.
Read: Japan’s PM Kishida: Will take steps to phase out imports of Russian oil over time
European Central Bank (ECB) Governing Council member Olli Rehn said that they may start raising interest rates in July to ensure that inflation expectations remain anchored while speaking in an interview in Austria.
Key quotes
“We are seeing signs of second-round effects.”
“It’s important that we send a signal that these higher inflation expectations we are currently witnessing will not become entrenched.”
“it’s “reasonable that we will rather sooner, in my view in July, start raising rates in line with our normalization of monetary policy. And would expect that when autumn comes, we would be at zero.”
What “we would have in our toolbox in reserve” is “a kind of instrument that would help to counter possible unwarranted fragmentation of financial conditions in Europe.”
“We are seeing some stagflation tendencies.”
Market reaction
Despite the hawkish comments from the ECB policymaker, EUR/USD remains under heavy selling pressure on a firmer US dollar and risk-aversion.
The pair is trading at 1.0515, down 0.32% on the day, as of writing.
- USD/CNH rises for third consecutive day to refresh the multi-day top, sidelined of late.
- 200-week SMA, 50% Fibonacci retracement level tests bulls amid overbought RSI.
- Pullback remains elusive beyond April 2021 swing high.
USD/CNH prints a three-day uptrend to renew the 18-month high around 6.7475 during Monday’s Asian session.
In doing so, the offshore Chinese yuan (CNH) pair crosses the 200-week moving average amid the market’s rush for risk safety, as well as anxiety ahead of China's trade numbers for April.
It should be noted, however, that the overbought RSI conditions and the crucial SMA level, around 6.7385 by the press time, challenge USD/CNH bulls.
Also acting as the key upside filter is the 50% Fibonacci retracement (Fibo.) of the May 2020 to February 2022 downtrend, around 6.7515.
Meanwhile, a pullback move could aim for the 38.2% Fibo level, surrounding 6.6460, but remains elusive until breaking the April 2021 swing high towards the south, at 6.5875.
Overall, USD/CNH is likely to witness a pullback but the latest risk-aversion wave challenges the moves.
USD/CNH: Weekly chart
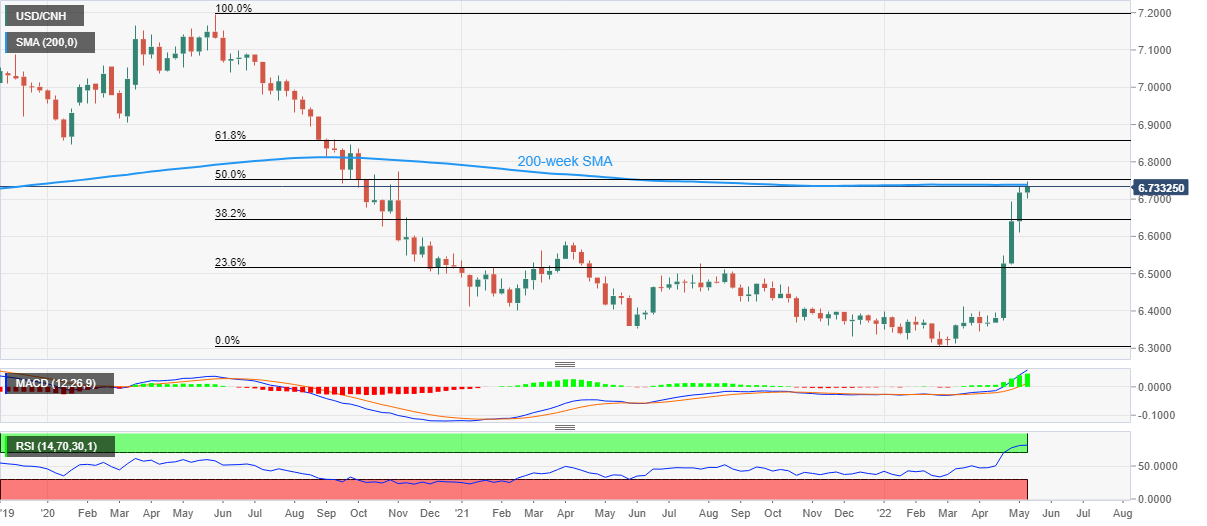
Trend: Pullback expected
- There are prospects of a bearish breakout for a run below 91 the figure.
- AUD/JPY is testing critical 4-hour support area.
AUD/JPY is pressured at the start of the week and extending the longer-term correction, breaking the unimportant 4-hour support level as illustrated in the following analysis.
AUD/JPY monthly chart

The price is finding resistance on attempts between 94 and 95.70.
AUD/JPY weekly chart
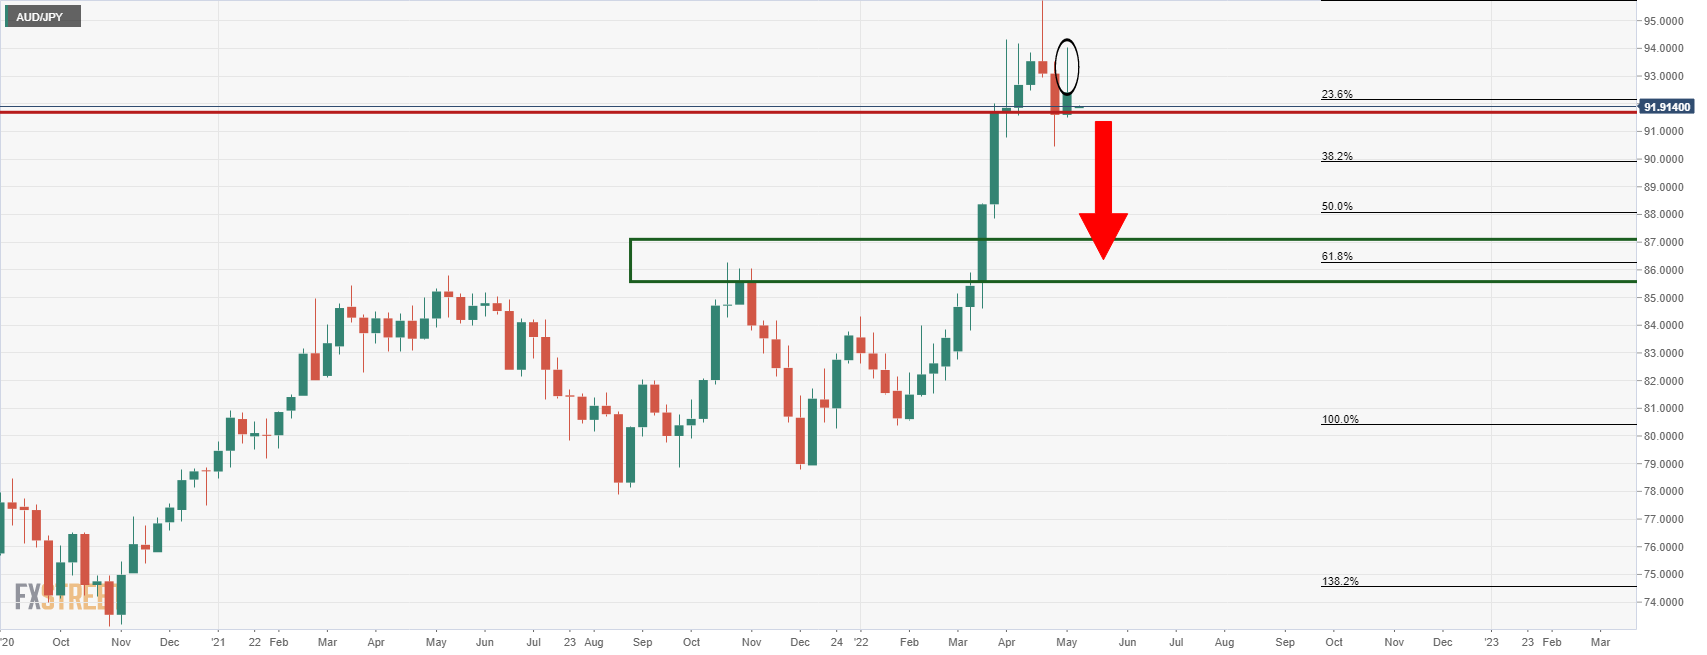
The price ended the week on the front foot and the wick is compelling as it reflects a lower time frame price action. There could be a test of prior resistance in the forthcoming sessions. Besides that, there are prospects of a downside correction in the medium term.
AUD/JPY daily chart
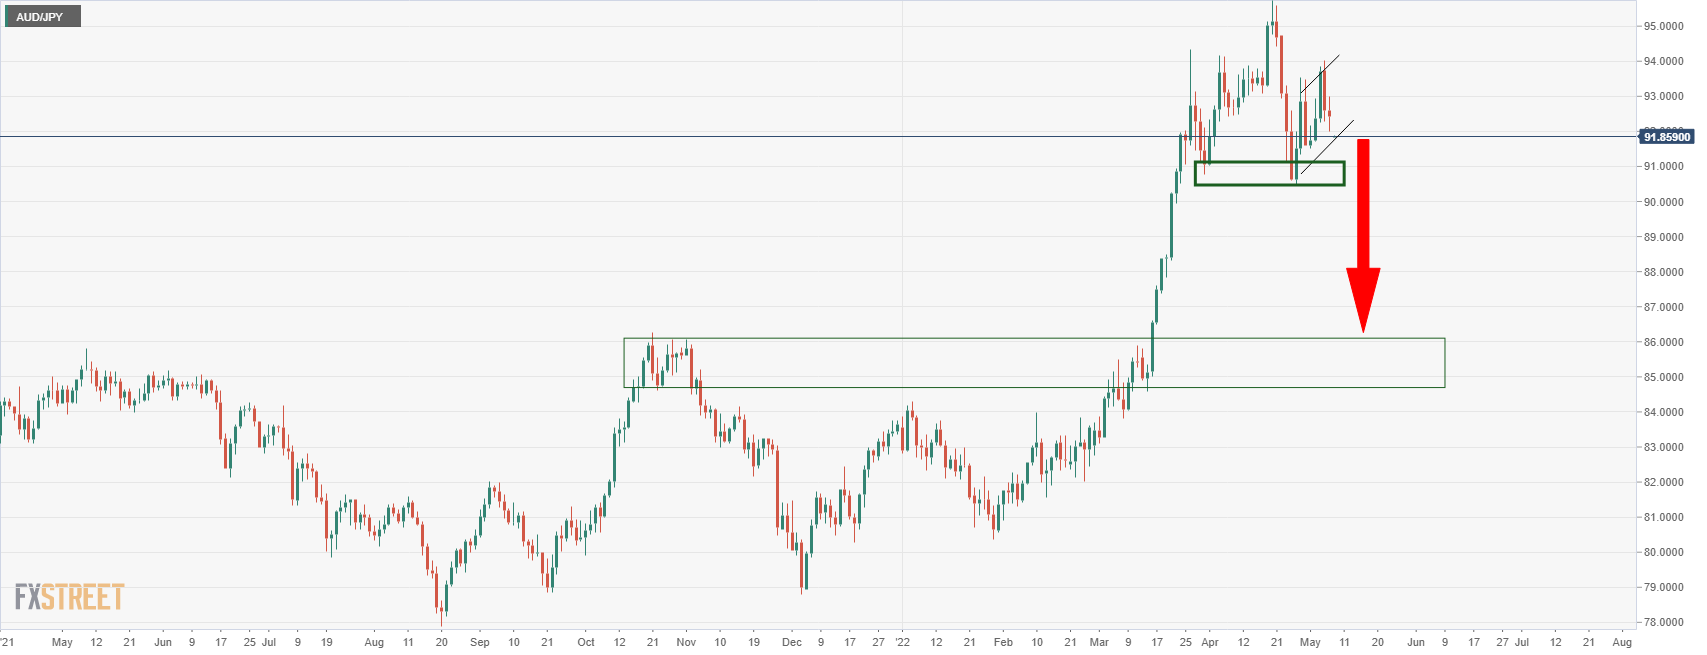
The bulls are tiring on the daily chart and while there is a possibility of the price moving higher for a test of the recent highs and resistance, the strength of the prior daily bearish impulse and recent deceleration of the corrections, the bias leans bearish.
AUD/JPY H4 chart
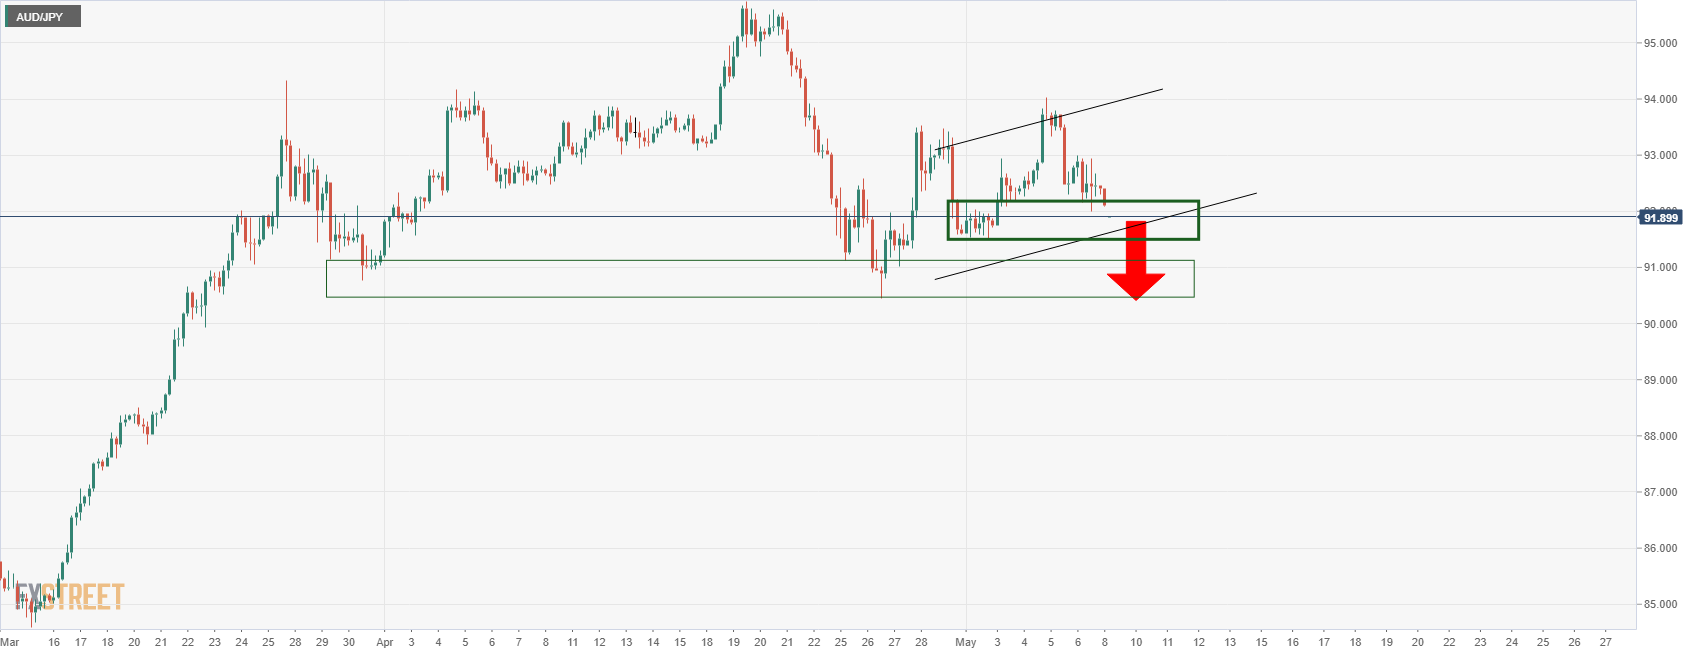
The 4-hour chart has the price moving in on the prior resistance/support structure. Bears need to get below there for prospects of a bearish breakout for a run below 91 the figure.
- AUD/USD prints three-day downtrend to poke the yearly low marked in January.
- Risk aversion intensify as China’s covid conditions worsen, G7 unveils fresh sanctions on Russia.
- Fears of faster/heavier rate hikes, inflation woes also weigh on the risk barometer pair.
AUD/USD justifies its risk barometer status by declining to the 0.7000 threshold during Monday’s Asian session, down for the third consecutive day, also around the lowest levels since January.
The pair’s latest fall could be linked to escalated covid fears in China, as well as the Group of Seven (G7) nations’ sanctions on Russia. Also keeping the AUD/USD bears hopeful are the concerns that the global monetary policies will tighten amid the inflation fears.
While considering the worsening covid conditions and the resulting strict activity restrictions, recently in Shanghai, “Chinese Premier Li Keqiang warned of a "complicated and grave" employment situation as the country imposed sweeping lockdowns to contain Covid-19 outbreaks,” per Bloomberg.
Also challenging the mood is the global pressure on Russia, as it escalates fighting in Eastern Ukraine. During the weekend, the G7 nations held a virtual call with Ukrainian President Volodymyr Zelensky and said, per Reuters, “They would cut off key services on which Russia depends, reinforcing the isolation of Russia "across all sectors of its economy."
On a different page, the US Dollar Index (DXY) rallied to the fresh high in two decades on Friday, 0.23% intraday near 103.90 by the press time, as markets keep the odds of a 75 basis points rate hike from the Fed on the table following the strong US jobs report. That said, the US Nonfarm Payrolls (NFP) reprinted the 428K figures, if compared to the revised figures for March, by surpassing the 391K forecasts. On the same line, the Unemployment Rate also remained intact at 3.6%.
Following the data, Minneapolis Fed President and FOMC member Neel Kashkari said in a blog post on Medium, “Given that long-term real rates have the greatest influence on the demand for credit, financial conditions are already nearly back to neutral levels.” The policymaker also said his assessment of the nominal neutral rate of interest is still that it is around 2.0%. It’s worth noting that the President of the Federal Reserve Bank of St. Louis James Bullard reiterated his bullish bias and pushed the Fed towards a 3.5% rate.
Against this backdrop, S&P 500 Futures drop 1.20% whereas the US 10-year Treasury yields remain firmer around 3.11%.
Moving on, China’s trade numbers for April will be important for the NZD/USD prices due to Auckland’s trade ties with Beijing. The headline Trade Balance is expected to increase to $50.65B versus $47.38B prior while the Imports and Exports may print mixed figures and can probe the bears.
Technical analysis
The support line of a two-month-old falling wedge chart pattern challenges the AUD/USD pair sellers around the 0.7000 threshold. The recovery moves remain elusive unless confirming the bullish chart pattern, by crossing the 0.7215 hurdle. However, the 100-DMA level surrounding 0.7260 appears a tough nut to crack for the AUD/USD bulls.
Japanese Prime Minister Fumio Kishida was on the wires in the last hour, making some comments on Japan’s embargo on Russian oil imports.
Key quotes
“Will take steps to phase out imports of Russian oil over time.”
“No change to existing plan to work on restarts of nuclear power stations by ensuring safety, gaining public understanding.”
- Silver prices remain pressured around intraday low, down for third consecutive day.
- Multiple levels marked since September 2021 limited immediate downside ahead of $21.42.
- Three-week-old descending trend line, bearish MACD signals challenge recovery moves.
Silver (XAG/USD) prices stay on the back foot at around $22.25, printing a three-day downtrend during Monday’s Asian session.
In doing so, the bright metal fades the previous week’s bounce off the short-term crucial horizontal support stretched from September 2021, surrounding $22.10-22.00.
Given the bearish MACD signals and the commodity’s failure to rebound, the quote is likely to retest the aforementioned horizontal support near $22.00.
However, the quote’s further downside will be challenged double bottoms marked during late 2021 around $21.42.
On the contrary, recovery moves, if any, need to cross the downward sloping trend line from April 18, close to $22.90, to convince short-term buyers to challenge the previous week’s top near $23.30. Also acting as a short-term key hurdle is the 200-DMA level of $23.72.
Overall, silver prices remain directed towards the south but there prevails limited room for bears.
Silver: Daily chart
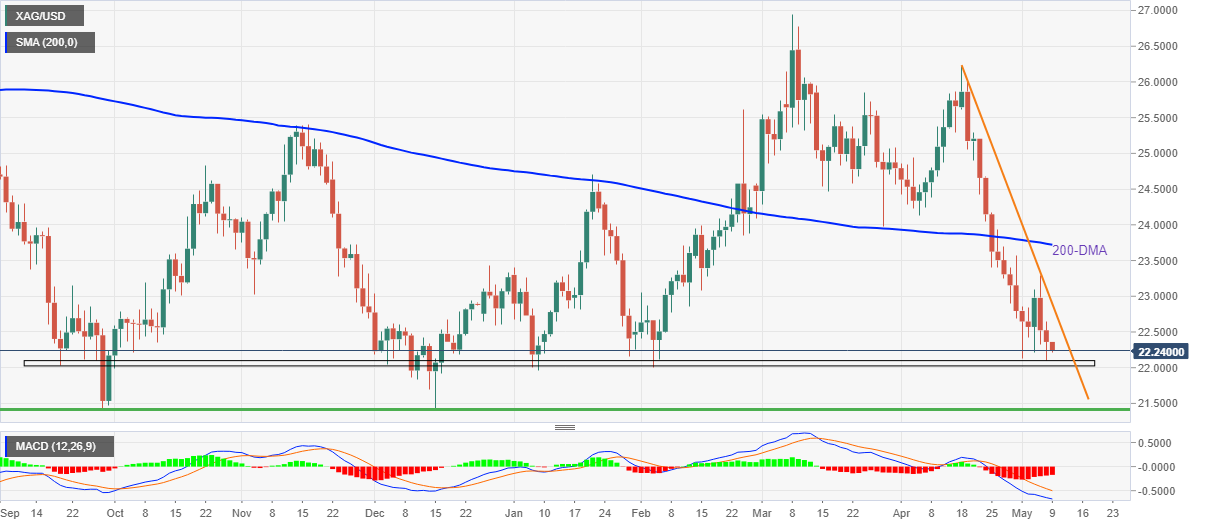
Trend: Further declines expected
- GBP/USD fades Friday’s bounce off multi-day low, renews intraday bottom of late.
- Sinn Fein’s victory in NI election renews Brexit fears, UK’s Truss threatens to suspend Brexit deal.
- Headlines concerning China’s covid, G7 sanctions on Russia add to the risk-off mood, which in turn underpins USD demand.
- Risk catalysts to entertain bears ahead of Thursday’s key data.
GBP/USD takes offers to renew intraday low around 1.2300, fading the previous day’s bounce off a two-year low during Monday’s Asian session. The cable pair’s latest weakness could be linked to the broad risk-off mood, as well as negative headlines concerning Brexit. Also weighing on the pair could be the anxiety ahead of this week’s key UK Q1 GDP.
Starting with the risk profile, an over 1.0% fall in the S&P 500 Futures joins a three-year high of the US 10-year Treasury yields to portray the sour sentiment in the markets. While checking the moves, the risk of tighter monetary policy and China’s covid, as well as the Western sanctions on Russia, gain major attention. Also weighing on the GBP/USD prices are recent challenges to Brexit, mainly due to Sinn Fein’s victory in the Northern Ireland (NI) elections.
The hopes of faster, as well as heavier, rate hikes remain firmer ahead of this week’s key US inflation data. The reason could be linked to the absence of softer US jobs reports, as well as mostly hawkish comments from the Fed policymakers.
The US Nonfarm Payrolls (NFP) reprinted the 428K figures, if compared to the revised figures for March, by surpassing the 391K forecasts. On the same line, the Unemployment Rate also remained intact at 3.6%.
Following the data, Minneapolis Fed President and FOMC member Neel Kashkari said in a blog post on Medium, “Given that long-term real rates have the greatest influence on the demand for credit, financial conditions are already nearly back to neutral levels.” The policymaker also said his assessment of the nominal neutral rate of interest is still that it is around 2.0%. It’s worth noting that the President of the Federal Reserve Bank of St. Louis James Bullard reiterated his bullish bias and pushed the Fed towards a 3.5% rate.
On a different page, G7 nations met during the weekend and announced further sanctions on Russian oil, as well as services. “After meeting virtually with Ukrainian President Volodymyr Zelensky, the leaders said they would cut off key services on which Russia depends, reinforcing the isolation of Russia "across all sectors of its economy,” said Reuters. Also portraying the risk-off mood was news from China as Shanghai announced fresh activity restriction measures due to the worsening covid conditions.
Furthermore, Sinn Fein’s status as the biggest party of Northern Ireland (NI), after the latest victory in Ireland assembly elections, renewed fears of Ireland’s reunification with Europe. While sensing the same, UK Minister Lizz Truss threatens the bloc to dump the Brexit deal if it doesn’t change the NI protocol. UK PM Boris Johnson will give a speech on Tuesday wherein he “is promising to deliver a “super seven” of Brexit Bills which will cut red tape and “unnecessary barriers inherited from the EU”, per Independent.
Moving on, the risk catalysts may keep the GBP/USD prices pressured amid firmer USD but Thursday’s preliminary UK GDP for Q1 2022 will be crucial amid fears of economic stagflation.
Read: GBP/USD Weekly Forecast: The worst seems far from over, focus shifts to US inflation, UK GDP
Technical analysis
Friday’s Dragonfly Doji, oversold RSI conditions challenge GBP/USD bears of late. While the latest swing low and June 2020 bottom, respectively around 1.2275 and 1.2250, restrict the short-term downside of the cable pair, corrective pullback needs validation from April’s low of 1.2411 to gain traction.
In recent trade today, the People’s Bank of China (PBOC) set the yuan (CNY) at 6.6899 on May 9, to the weakest since November 3, 2020 vs. the last close of 6.6651.
About the fix
China maintains strict control of the yuan’s rate on the mainland.
The onshore yuan (CNY) differs from the offshore one (CNH) in trading restrictions, this last one is not as tightly controlled.
Each morning, the People’s Bank of China (PBOC) sets a so-called daily midpoint fix, based on the yuan’s previous day closing level and quotations taken from the inter-bank dealer.
- EUR/USD is inching towards 1.0500 as the DXY is getting stronger ahead of US inflation.
- Euro bulls are awaiting the speech from ECB’s Christine Lagarde.
- ECB Lagarde is not likely to dictate a ‘hawkish’ stance on further guidance.
The EUR/USD has tumbled below 1.0530 and is likely to test the psychological support at 1.0500. The asset is scaling continuously lower right after the open bid on Monday. A bearish open drive has been observed yet and the asst is looking to test its previous week’s low at 1.0483.
Euro bulls are likely to remain volatile this week ahead of the speech from European Central Bank (ECB)’s Christine Lagarde, which is due on Wednesday. The speech from ECB’s Lagarde will provide insights on the likely monetary policy action by the ECB in June. It is worth noting that the ECB left its interest rates unchanged in its last interest rate decision announcement. The ECB dictated that policy rates will remain unchanged till the end of its bond-buying program, which is expected in the third quarter. Therefore, investors should not brace for a rate hike by the ECB before the end of this year. Also, the fears of stagflation in the eurozone after the Ukraine crisis have eroded the chances of hawkish tone adaptation by the ECB.
Meanwhile, the US dollar index (DXY) is converting every corrective pullback into an optimal buying opportunity for the market participants. The DXY is strong enough on rising odds of a rate hike by the Federal Reserve (Fed) in June. At the press time, the DXY has climbed above 130.90 and is inching closer to recapturing the previous week’s high at 104.06.
Apart from ECB Lagarde’s speech, investors are focusing on the release of Wednesday’s US inflation. A preliminary estimate for yearly US inflation is 8.1% against the old print of 8.5%.
- NZD/USD bears sinking in their teeth in the open.
- Risk-off sentiment is hurting the high beat currencies.
NZD/USD is pressured on Monday as risk-off sentiment weighs on the high beta currency complex. At 0.6380, the bird is down some 0.38% and has fallen from a high of 0.6412 to a low of 0.6377.
Asian equities are in a sea of red and the US dollar is higher at the start of the week. The greenback continues to be buttressed by sharply rising US yields as lockdowns in China, the Ukraine crisis and higher interest rates. The ASX 200 is -0.8%, the Nikkei 225 -1.1% and KOSPI -0.2%.
China’s COVID-19 outbreaks have darkened the outlook for risk sentiment on Monday. Reuters has reported that Shanghai is tightening its already strict COVID-19 lockdown in a fresh push to eliminate infections outside quarantined areas of China’s biggest city by late this month.
''While NZD volatility has died down compared to the 24hrs after the Fed meeting, high volatility is still being seen in bond (and equity) markets, with US bond yields edging another notch higher following stronger jobs data,'' analysts at ANZ Bank said.
''It is hard to anticipate any let-up in generalised volatility given this week’s data schedule, with US Consumer Price Index topping the list, and NZ inflation expectations data also due.''
''Risks around US CPI feel binary,'' the analysts at ANZ Bank said. ''A moderation from 8.5% (to 8.1% as markets expect) would be mildly comforting, but a lift would doubtless revive expectations for 75bp Fed hikes, and probably give the USD a boost. The idea that synchronised global tightening might proceed gently now feels like a forgotten dream as the reality of volatility bites.''
Analysts at TD Securities explained that the ''core prices likely stayed strong in April, regaining momentum to 0.5% m/m after recording 0.3% in March. While used vehicles prices likely declined again, they probably fell less sharply than in the last report. We also look for renewed strength in shelter inflation. Our MoM forecasts imply 8.1%/6.1% YoY for total/core prices, likely confirming March was the peak of the cycle.''
Meanwhile, there will also be Fed speakers this week. Governor Christopher Waller and New York Fed's John Williams could be important. Traders will be hoping for comments to shed some light after Fed Chairman Jerome Powell's presser last week that failed to offer much in the way of clarity on what the Fed will do after frontloading rate hikes until neutral.
For the day ahead, traders await trade data from China that is speculated to show a further slowing in export growth and weakness in imports with most provinces under some form of restrictions and Shanghai in a full month of lockdown.
- USD/CAD takes the bids to refresh the highest levels since December 21, 2021.
- Upside break of horizontal area from September 2021, absence of overbought RSI signal further advances.
- The late 2021 peak lures buyers, two-week-old ascending trend line adds to the downside filters.
USD/CAD extends the previous week’s rebound from 1.2813 as it rises to the fresh high of 2022 during Monday’s Asian session. That said, the Loonie pair rises 0.20% around 1.2931 by the press time.
A successful break of the horizontal area comprising multiple tops marked since September 2021, around 1.2895, keeps the USD/CAD buyers hopeful. Also favoring the upside momentum is the absence of overbought RSI conditions.
Hence, the latest run-up has further room to the north before hitting a speed-breaker, namely December 2021 high near 1.2965.
Following that, an upward sloping trend line from August 2021, near 1.2985, will precede the 1.3000 psychological magnet to entertain the USD/CAD bulls.
Meanwhile, pullback moves may initially aim for the previous horizontal resistance, now support around 1.2895, ahead of challenging an upward sloping support line from April 21, close to 1.2760 at the latest.
Even if the USD/CAD prices drop below 1.2760, the bears can wait for a clear break below the 100-DMA level of 1.2682 for conviction.
USD/CAD: Daily chart

Trend: Further upside expected
- USD/CHF is eyeing an establishment above 0.9900 as DXY has strengthened on rate hike expectations.
- The asset is witnessing a bullish open drive session, which may keep bulls reinforced.
- The in-line Unemployment Rate and Swiss CPI have failed to support the Swiss franc.
The USD/CHF pair is scaling higher in the early Asian session. The asset has witnessed a bullish open drive session as the pair is advancing higher right from its opening at 0.9885. A firmer rally in the asset banks upon strengthening the US dollar index (DXY).
The DXY is marching north on rising odds of a consecutive jumbo rate hike by the Federal Reserve (Fed) in June. The US Bureau of Labor Statistics reported the US Nonfarm Payrolls (NFP) at 428k, significantly higher than the expectations. Higher-than-expected job additions by the US administration are signaling an extremely tight labor market in the US, which has bolstered the chances of a rate hike consecutively. The tight labor market and multi-decade high inflation levels are empowering one more 50 basis points (bps) interest rate hike expectations.
Meanwhile, the Swiss franc is displaying underperformance on releasing a flat Unemployment Rate last week. The Unemployment Rate landed at 2.2%, in line with the forecasts and prior print. Also, the yearly Swiss inflation landed at 2.5% last week, similar to the street expectations. The catalysts are not advocating for a rate hike by the Swiss National Bank (SNB).
Going forward, the mega event will be the release of US inflation, which is scheduled on Wednesday. The US Consumer Price Index (CPI) carries a preliminary estimate of 8.1%, lower than the prior print of 8.5%.
- Market sentiment sours as fears of faster monetary policy tightening joins risk-negative headlines from China, G7.
- Firmer US NFP propels odds of faster/heavier rate hikes and highlights US inflation.
- China’s Shanghai announces more measures to curb covid spread, G7 nations sanction Russia.
Although Friday’s US jobs report refrained from major disappointment, global markets remain risk-averse as hopes of faster, as well as heavier, rate hikes remain firmer ahead of this week’s key US inflation data. Also challenging the market sentiment are the headlines from the Group of Seven (G7) nations and China.
While portraying the mood, the US 10-year Treasury yields rise to a fresh high since November 2018, up three basis points near 3.15%, whereas the S&P 5600 Futures drop 1.0% by the press time.
That said, the US Nonfarm Payrolls (NFP) reprinted the 428K figures, if compared to the revised figures for March, by surpassing the 391K forecasts. On the same line, the Unemployment Rate also remained intact at 3.6%. The absence of major disappointment from the US jobs report seemed to have capped the risk-off during late Friday. However, a second reading hints at more risk of tighter monetary policy, as well as the pre-inflation release anxiety, to spoil the risk profile.
Following the data, Minneapolis Fed President and FOMC member Neel Kashkari said in a blog post on Medium, “Given that long-term real rates have the greatest influence on the demand for credit, financial conditions are already nearly back to neutral levels.” The policymaker also said his assessment of the nominal neutral rate of interest is still that it is around 2.0%. It’s worth noting that the President of the Federal Reserve Bank of St. Louis James Bullard reiterated his bullish bias and pushed the Fed towards a 3.5% rate.
It’s worth noting that the US inflation expectations, as per the 10-year breakeven inflation rate per the St. Louis Federal Reserve (FRED) data, struggle to remain firmer after refreshing the record top in the last week. The same challenges the USD bulls ahead of the key inflation data, up for publishing on Wednesday.
Elsewhere, G7 nations met during the weekend and announced further sanctions on Russian oil, as well as services. “After meeting virtually with Ukrainian President Volodymyr Zelensky, the leaders said they would cut off key services on which Russia depends, reinforcing the isolation of Russia "across all sectors of its economy,” said Reuters. Also portraying the risk-off mood was news from China as Shanghai announced fresh activity restriction measures due to the worsening covid conditions.
Moving on, global markets are likely to remain pressured ahead of Wednesday’s US Consumer Price Index (CPI) data, which in turn could keep the US Treasury yields and the US dollar on the front foot while weighing on the riskier assets like commodities and Antipodeans.
Read: Week Ahead on Wall Street: Employment report to fails to calm equities as bears still in control
| Index | Change, points | Closed | Change, % |
|---|---|---|---|
| NIKKEI 225 | 185.03 | 27003.56 | 0.69 |
| Hang Seng | -791.44 | 20001.96 | -3.81 |
| KOSPI | -33.06 | 2644.51 | -1.23 |
| ASX 200 | -163.7 | 7203 | -2.22 |
| FTSE 100 | -115.4 | 7387.9 | -1.54 |
| DAX | -228.23 | 13674.29 | -1.64 |
| CAC 40 | -110.04 | 6258.36 | -1.73 |
| Dow Jones | -98.6 | 32899.37 | -0.3 |
| S&P 500 | -23.53 | 4123.34 | -0.57 |
| NASDAQ Composite | -173.03 | 12144.66 | -1.4 |
- Gold is under pressure in the open on Monday.
- Bears are taking on the first layer of 4-hour support.
At $1,880.40, gold is under pressure in the open on Monday down 0.17% and has fallen from a high of $1,885.85 to a low of $1,879.93 as the bears move in again with a focus on last week's lows at $1,850.47.
China’s COVID-19 outbreaks have darkened the outlook for risk sentiment at the start of the week. Reuters reports that Shanghai is tightening its already strict COVID-19 lockdown in a fresh push to eliminate infections outside quarantined areas of China’s biggest city by late this month.
Traders await yet further data from the Middle Kingdom that is speculated to show a further slowing in export growth and weakness in imports with most provinces under some form of restrictions and Shanghai in a full month of lockdown.
''China top leaders warned against questioning Xi Jinping’s covid-zero strategy as pressure builds to relax virus curbs,'' analysts at ANZ said. ''This comes as the market battles headwinds such as a stronger USD and a bond selloff as the US Federal Reserve tightens it monetary policy. These same issues weighed on gold prices, which recorded its third weekly drop,'' the analysts added.
''With further supply constraints across the base metals complex still a distinct possibility, the recent selloff appears overdone. Chinese demand is expected to rebound sharply once restrictions ease, with stimulus measures likely to boost economic activity.''
Key data ahead
Meanwhile, for the week ahead, other than today's Chinese trade data, the focus will be on US inflation data and Fed speakers. Analysts at TD Securities argue that core prices likely stayed strong in April, regaining momentum to 0.5% m/m after recording 0.3% in March. ''While used vehicle prices likely declined again, they probably fell less sharply than in the last report. We also look for renewed strength in shelter inflation. Our MoM forecasts imply 8.1%/6.1% YoY for total/core prices, likely confirming March was the peak of the cycle.''
A slew of Fed officials will be providing remarks in the upcoming week following the May meeting. New York Fed's John Williams and Governor Christopher Waller's remarks will be important and would be expected to shed some light after Fed Chairman Jerome Powell's presser last week that failed to offer much in the way of clarity on what the Fed will do after frontloading rate hikes until neutral.
Gold technical analysis
-
Gold, Chart of the Week: Bears eye a break of critical $1,875
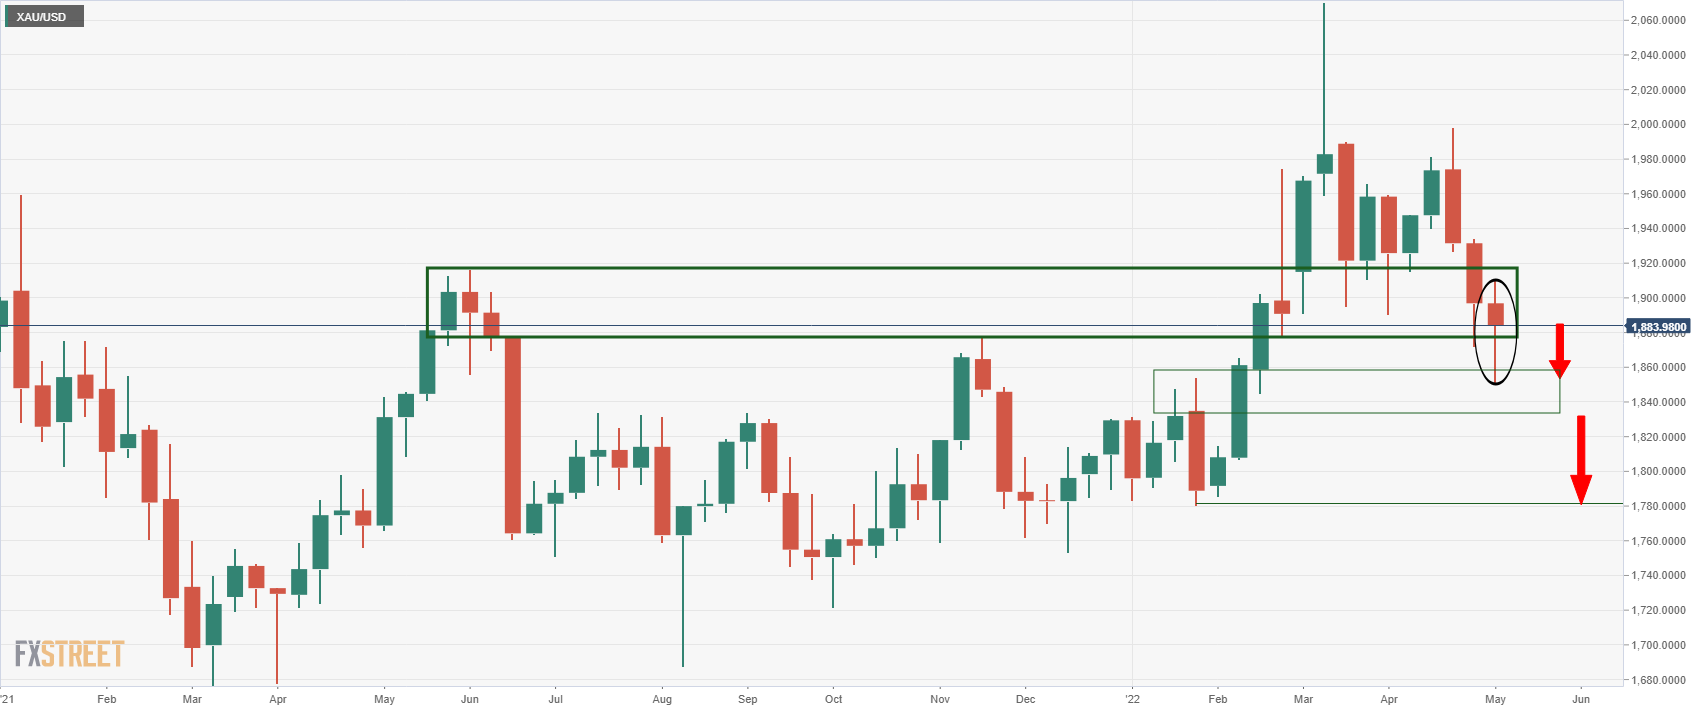
The bearish close and wick on the weekly chart would be expected to be followed by a move lower in the coming days to test last week's low and potentially move beyond. In trade today, the bears are challenging the bulls at the first layer of 4-hour support:
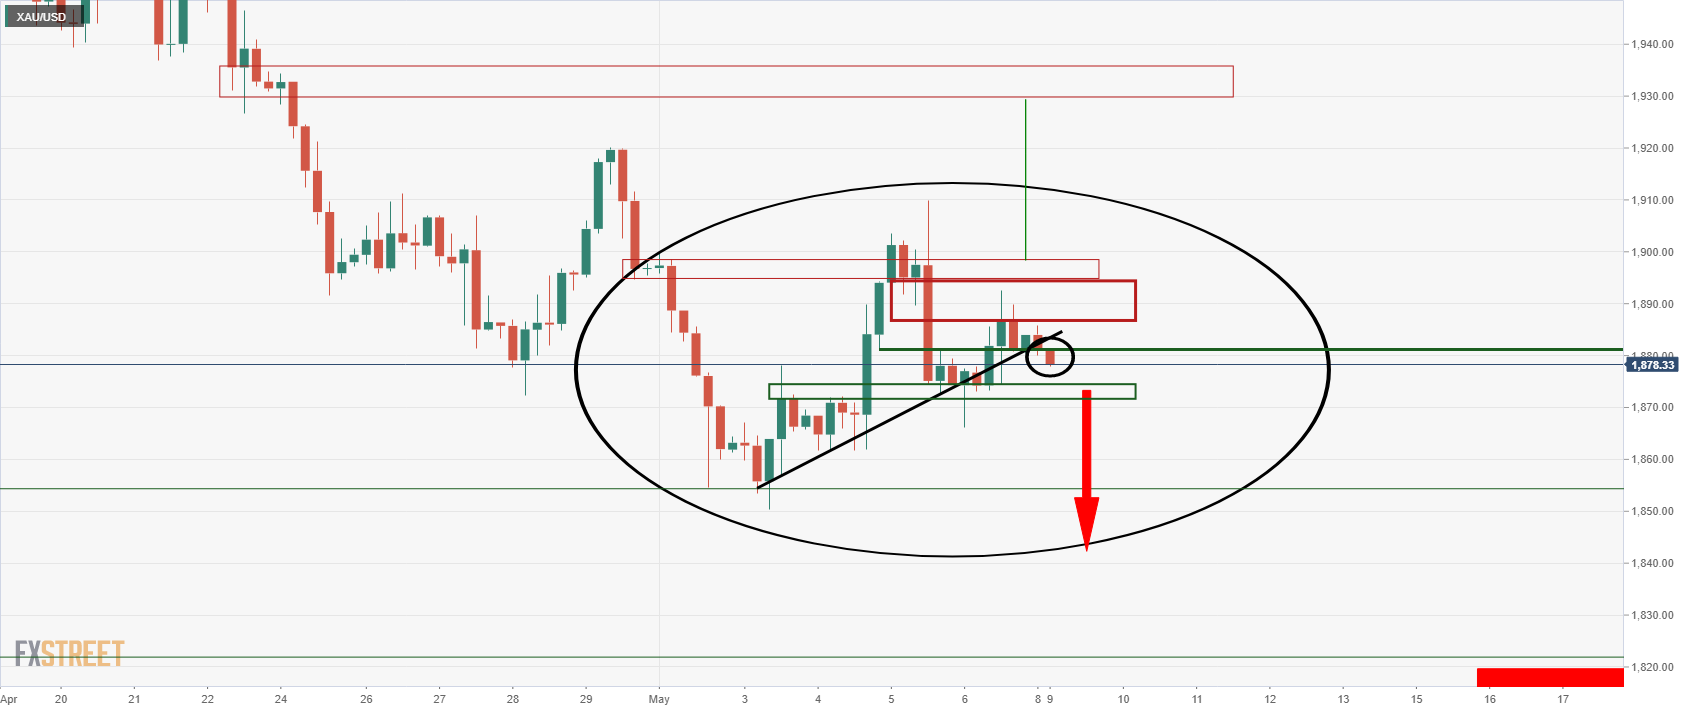
- GBP/JPY picks up bids to extend the previous day’s rebound from two-week low.
- Bearish MACD signals, failures to cross 21-DMA favor sellers.
- 50-DMA, lows marked in April, March act as additional downside filters.
GBP/JPY bulls poke intraday high surrounding 161.30, stretching Friday’s recovery moves, as Tokyo opens for Monday.
In doing so, the yen cross keeps the previous day’s U-turn from an upward sloping support line from March 30.
However, bearish MACD signals and multiple failures to cross the 21-DMA in the last two weeks keep sellers hopeful.
In addition to the 21-DMA level of 163.58, March’s high of 164.64 will also challenge GBP/JPY bulls before directing them to the last month’s peak surrounding 168.45.
Alternatively, pullback moves may initially aim for the aforementioned support line surrounding 160.40.
Following that, the 50-DMA level near the 160.00 threshold will be crucial to watch for the GBP/JPY sellers as a clear downside break of which will direct the pair towards lows marked in April and March, respectively around 159.60 and 159.00.
Overall, the GBP/JPY pair’s recovery moves seem less convincing until staying below the 21-DMA.
GBP/JPY: Daily chart
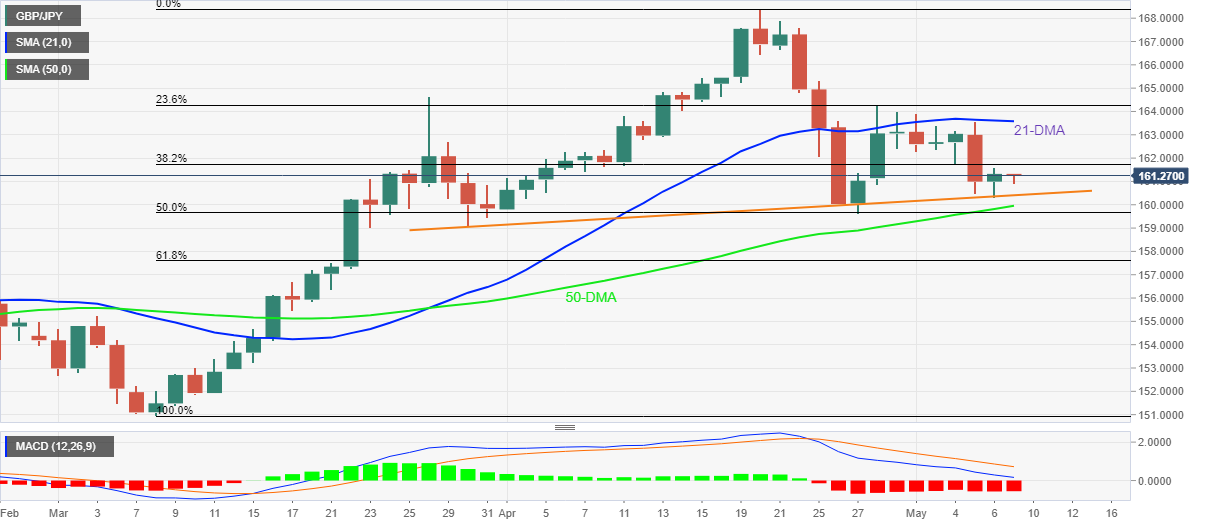
Trend: Recovery expected
| Pare | Closed | Change, % |
|---|---|---|
| AUDUSD | 0.70706 | -0.62 |
| EURJPY | 137.667 | 0.25 |
| EURUSD | 1.05441 | 0.02 |
| GBPJPY | 161.053 | -0 |
| GBPUSD | 1.23359 | -0.23 |
| NZDUSD | 0.64049 | -0.33 |
| USDCAD | 1.29059 | 0.55 |
| USDCHF | 0.98845 | 0.35 |
| USDJPY | 130.555 | 0.22 |
- DXY remains on the front foot near a two-decade high.
- Firmer jobs report highlights this week’s inflation as the key push for Fed hawks.
- Headlines from China, G7 also weigh on risk profit and underpin the USD buying.
US Dollar Index (DXY) stays on the bull’s radar by taking rounds to the highest levels since 2002, surrounding 104.10, flashed the last week. In doing so, the greenback gauge cheers the increasing odds of the Fed’s faster, as well as heavier rate hikes, while also benefiting from the risk-off mood.
Although Fed’s Powel rejected the idea of 75 basis points (bps) of a rate hike, fears of inflation weighing on the economic growth and Friday’s upbeat US jobs report for April suggest that the hawks aren’t off the table. As a result, this week’s US Consumer Price Index (CPI) data for April will be crucial to watch for clear direction.
Elsewhere, G7 nations met during the weekend and announced further sanctions on Russian oil, as well as services. “After meeting virtually with Ukrainian President Volodymyr Zelensky, the leaders said they would cut off key services on which Russia depends, reinforcing the isolation of Russia "across all sectors of its economy,” said Reuters. Also portraying the risk-off mood was news from China as Shanghai announced fresh activity restriction measures due to the worsening covid conditions.
The US Nonfarm Payrolls (NFP) reprinted the 428K figures, if compared to the revised figures for March, by surpassing the 391K forecasts. On the same line, the Unemployment Rate also remained intact at 3.6%.
Also read: Strong US payrolls deliver a reprieve to Fed policy
Following the data, Minneapolis Fed President and FOMC member Neel Kashkari said in a blog post on Medium, “Given that long-term real rates have the greatest influence on the demand for credit, financial conditions are already nearly back to neutral levels.” The policymaker also said his assessment of the nominal neutral rate of interest is still that it is around 2.0%. It’s worth noting that the President of the Federal Reserve Bank of St. Louis James Bullard reiterated his bullish bias and pushed the Fed towards a 3.5% rate.
It’s worth noting that the US inflation expectations, as per the 10-year breakeven inflation rate per the St. Louis Federal Reserve (FRED) data, struggle to remain firmer after refreshing the record top in the last week. The same challenges the USD bulls ahead of the key inflation data, up for publishing on Wednesday.
That said, the US 10-year Treasury yields rise to the fresh high since November 2018, up two basis points near 3.14%, whereas the S&P 5600 Futures drop 1.0% by the press time.
Technical analysis
Considering the overbought RSI, November 2002 low near 104.15 appears an immediate hurdle for the DXY bulls. The pullback moves, however, remain elusive unless dropping back below the post-Fed swing low surrounding 102.30.
- USD/JPY is struggling at around 130.75 as BOJ’s monetary policy minutes fail to bring an action.
- The BOJ will continue to stick with an ultra-loose monetary policy going forward.
- Higher US NFP is advocating for a consecutive jumbo rate hike by the Fed.
The USD/JPY pair has failed to deliver an action-pack performance despite the Bank of Japan (BOJ) releasing its monetary policy minutes. The minutes belonged to the monetary policy announced by the BOJ in April last week.
The decision came in line with the forecast of -0.1%. The BOJ policymakers adopted a ‘neutral’ stance on the policy rates as the institution is committed to releasing more stimulus packages to spurt the aggregate demand in the economy. The Japanese economy has yet not reached its pre-pandemic growth levels. Also, the inflation rate is very much low in the economy which seeks attention despite a recent rise in energy bills and food prices for the households.
Meanwhile, the US dollar index (DXY) is advancing higher and is expected to recapture its previous week’s high at 104.06. The DXY has remained in the grip of bulls as higher than expected US Nonfarm Payrolls reported last week have strengthened the odds of a consecutive jumbo rate hike by the Federal Reserve (Fed). The US administration has managed to add 428k additional jobs to the total labor force, which were higher than the estimates of 391k. A tight labor market is advocating a continuation of the hawkish stance by the Fed. Now, investors are eyeing the release of the US Consumer Price Index (CPI), which is due on Wednesday. The US CPI is expected to print at 8.1%, lower than the former print of 8.5%.


© 2000-2026. All rights reserved.
This site is managed by Teletrade D.J. LLC 2351 LLC 2022 (Euro House, Richmond Hill Road, Kingstown, VC0100, St. Vincent and the Grenadines).
The information on this website is for informational purposes only and does not constitute any investment advice.
The company does not serve or provide services to customers who are residents of the US, Canada, Iran, The Democratic People's Republic of Korea, Yemen and FATF blacklisted countries.
Making transactions on financial markets with marginal financial instruments opens up wide possibilities and allows investors who are willing to take risks to earn high profits, carrying a potentially high risk of losses at the same time. Therefore you should responsibly approach the issue of choosing the appropriate investment strategy, taking the available resources into account, before starting trading.
Use of the information: full or partial use of materials from this website must always be referenced to TeleTrade as the source of information. Use of the materials on the Internet must be accompanied by a hyperlink to teletrade.org. Automatic import of materials and information from this website is prohibited.
Please contact our PR department if you have any questions or need assistance at pr@teletrade.global.
transfers