- Analytics
- News and Tools
- Market News
CFD Markets News and Forecasts — 08-05-2022
The Bank of Japan's March meeting minutes are coming out in stages as follows@
Key notes
One member said markets may turn risk aversive if rising inflation triggers withdrawal of monetary easing by central banks
Members agreed japan's economy likely to recover on rising external demand, accomodative monetary policy
A few members said spring wage negotiations showed some bright signs such as big firms' wage hikes
More to come...
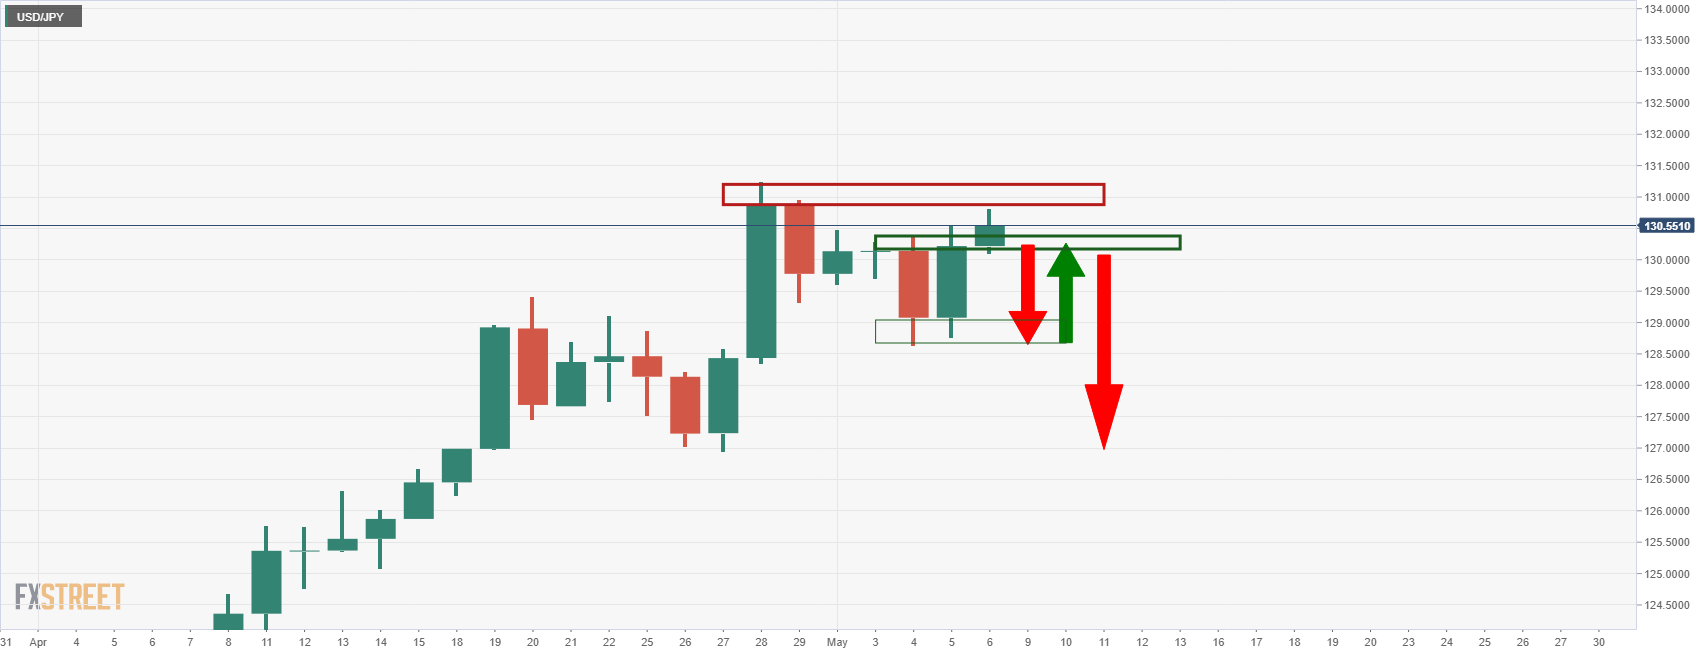
Meanwhile, the US dollar is firm at the start of the week and it is pushing the yen lower toward the cycle highs.
About the BoJ minutes
The Bank of Japan publishes a study of economic movements in Japan after the actual meeting. These meetings are held to review economic developments inside and outside of Japan and indicate a sign of new fiscal policy. Any changes in this report tend to affect the JPY volatility. Generally speaking, if the BoJ minutes show a hawkish outlook, that is seen as positive (or bullish) for the JPY, while a dovish outlook is seen as negative (or bearish).
- AUD/USD holds onto the bearish bias for the third consecutive day, stays pressured around one-week low.
- Upward sloping trend line from January, falling wedge’s lower line challenge immediate downside.
- Bulls need validation from the 100-DMA to retake controls.
AUD/USD takes offers around 0.7050, printing a three-day downtrend amid the initial Asian session on Monday. In doing so, the Aussie pair fails to extend the previous day’s corrective pullback by staying pressured inside a bullish chart pattern called a falling wedge.
That said, the quote drops towards the formation’s support line near the 0.7000 threshold, with an upward sloping trend line from late January acting as immediate support near 0.7030.
In a case where AUD/USD prices remain bearish past 0.7000, the yearly low surrounding 0.6965 will be in focus.
Hence, there prevails a limited downside available for the bears to cheer even if the MACD and the RSI conditions keep sellers hopeful.
On the flip side, recovery moves may initially aim for confirming the bullish chart pattern, by crossing the 0.7215 hurdle. However, the 100-DMA level surrounding 0.7260 appears a tough nut to crack for the AUD/USD bulls.
Should the pair remains firmer past 0.7260, the odds of its rally targeting April’s peak of 0.7662 can’t be ruled out.
AUD/USD: Daily chart
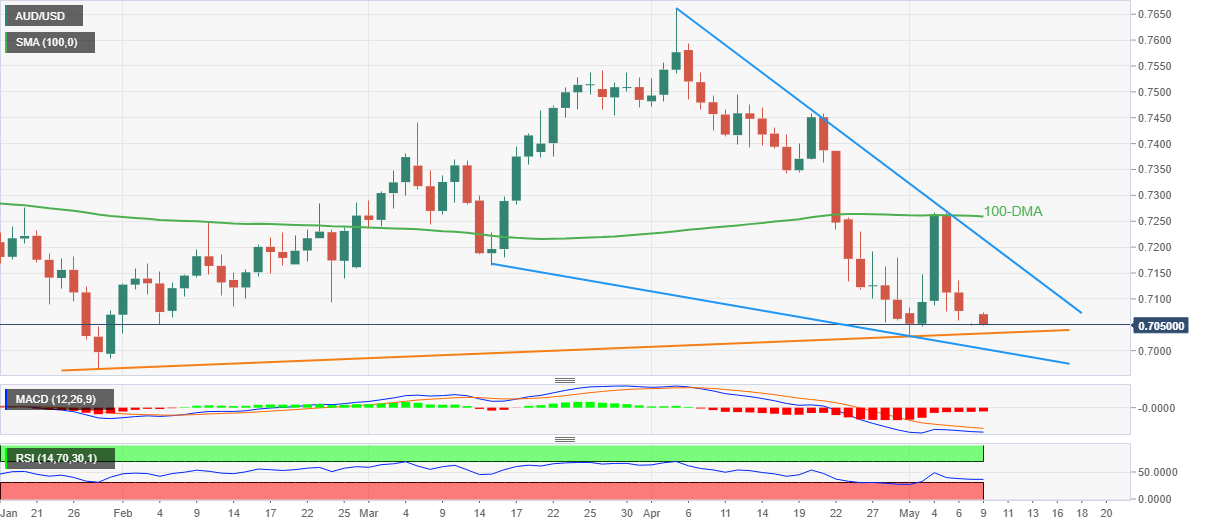
Trend: Limited downside expected
- EUR/JPY consolidates in the range of 136.50-138.00 from the last two trading weeks.
- Momentum oscillator, RSI seeks a trigger for a decisive move.
- The 200-EMA is modestly advancing higher but lacks conviction.
The EUR/JPY pair has surrendered half of its gains recorded in the first two hours of the early Asian session. Earlier, the cross has struggled to sustain above the round level figure of 138.00 but firmer price action at the upper boundary of the consolidation is underpinning euro bulls.
On an hourly scale, the consolidation phase is ongoing after a strong upside move from April 27 low at 134.78. The consolidation zone is marked from April 28 high at 138.00 to April 29 low at 136.50. The asset prices are overlapping to 20-period Exponential Moving Average (EMA) at 137.66, which signals a consolidation ahead. However, the 200-EMA at 137.20 is scaling modestly higher.
Meanwhile, the Relative Strength Index (RSI) is oscillating in a range of 40.00-60.00 for a longer period, which seeks a trigger for a decisive move.
Should the asset overstep the previous week’s high at 138.16, euro bulls will gain momentum and will drive the asset towards the April 21 low at 138.81. A breach of the latter will send the asset towards the psychological level resistance of 140.00
On the flip side, yen bulls could dictate the asset if it tumbles below April 29 low at 136.50. This will drag the asset towards April 28 low at 135.44, followed by April 27 low at 134.78.
EUR/JPY hourly chart
-637876489507697860.png)
- WTI extends pullback from six-week top to print the first daily loss in four.
- G7 nations levy fresh sanctions on Russian oil, diplomats due to Moscow’s Ukraine invasion.
- OPEC+ refrain from output change, Saudi Aramco’s price relief and China’s covid woes also weigh on the energy prices.
- China trade numbers may entertain intraday traders but risk catalysts are the key.
WTI bulls fail to keep reins as the black gold begins the week’s trading with a downbeat performance, flashing a 1.40% intraday loss to $108.00 by the press time.
In doing so, the energy benchmark ignores the weekend news that levied fresh sanctions on Russia by the Group of Seven (G7) nations. The reason could be linked to the worsening sentiment and attempts by the OPEC+, as well as Saudi Aramco, to ease the oil market worries.
The G7 nations met during the weekend and announced further sanctions on Russian oil, as well as services. “After meeting virtually with Ukrainian President Volodymyr Zelensky, the leaders said they would cut off key services on which Russia depends, reinforcing the isolation of Russia "across all sectors of its economy,” said Reuters.
Alternatively, Saudi Aramco cut its oil prices for North-Western Europe and Asia starting from June while keeping the prices intact for the US in the latest update. On the same line could be the headlines from the Organization of the Petroleum Exporting Countries and allies led by Russia, a group known as OPEC+. The oil cartel agreed to the previously announced terms of boosting crude output by 400,000 barrels per day (bpd) per month.
Elsewhere, China’s Shanghai announced fresh activity restriction measures due to the worsening covid conditions, which in turn curbs demand forecasts from the world’s largest oil consumer.
It should be noted that the global rush towards tighter monetary policy also weighs on the commodity prices, by way of the firmer US dollar.
Moving on, China’s trade numbers for April will offer immediate directions to WTI crude oil prices. The headline Trade Balance is expected to increase to $50.65B versus $47.38B prior while the Imports and Exports may print mixed figures and can probe the bears.
Technical analysis
Failures to cross a six-week-old ascending trend line, around $110.75 by the press time, triggered WTI’s pullback targeting an upward sloping support line from April 25, near $105.20 at the latest.
- USD/CAD has climbed to 1.2913 in the early trade, oil trades lower.
- Weak Canadian labor data has brought a sell-off for the loonie.
- The US inflation is seen lower at 8.1% against the previous multi-decade high print of 8.1%.
The USD/CAD pair has reclaimed its previous week’s high at 1.2913 in the early trade on the strengthening US dollar index (DXY) and struggling oil prices.
The DXY is advancing higher to recapture the round level resistance of 104.00 as higher US Nonfarm Payrolls (NFP) and flat Unemployment Rate have signaled that the US labor market is rock solid in an inflationary environment. The US Bureau of Labor Statistics reported the monthly job additions at 428k, much higher than the estimates of 391k. While the Unemployment Rate remained constant at 3.6% in comparison with the previous figure but expectations were elevated to 3.6%. The US labor market is extremely tight and higher employment opportunities may push the wages for the employees.
Meanwhile, Canada’s Employment data remained vulnerable in April. The Canadian administration added 15.3k jobs, significantly lower than the estimates of 55k and the prior print of 72.5k. This has dented the demand for loonie and has underpinned the greenback. Apart from that, oil prices have tumbled below $109.00 as UK’s recession fears have renewed the demand concerns in the world’s fifth-largest economy.
This week, investors will keep an eye over the release of the US Consumer Price Index (CPI), which is due on Wednesday. The US inflation is seen at 8.1%, lower than the previous figure of 8.1%. This could lower the necessity of a jumbo rate hike by the Federal Reserve (Fed) in June.
- AUD/JPY remains on the back foot for the third consecutive day.
- MACD signals back the confirmation of a bearish chart pattern to keep sellers hopeful.
- Sustained trading below the key SMAs also suggests further weakness.
AUD/JPY rejects late Friday’s corrective pullback by extending the downside move towards 92.00, around 92.20 during the initial hour of Monday’s Asian session.
The risk barometer pair confirmed the rising wedge bearish chart pattern the previous day, which in turn gained support from the bearish MACD signals to direct the south-run towards the 92.00 threshold.
Following that, the 91.55-50 area comprising multiple lows marked in the last week may offer an intermediate halt during the fall towards the previous month’s low surrounding 90.45.
In a case where the AUD/JPY prices remain weak past 90.45, the 90.00 round figure and the theoretical target surrounding 89.00 could lure the bears.
Meanwhile, any recovery remains elusive until crossing the 200-SMA level of 92.76. Before that, the 50-SMA and the support line of the wedge, respectively around 92.42 and 92.65, can restrict the immediate downside.
Even if the AUD/JPY pair manage to cross the 200-SMA, 61.8% Fibonacci Retracement of late April’s downside and the upper line of the stated wedge, close to 93.75 and 94.25 in that order, will challenge the bulls.
Overall, AUD/JPY has a further downside to track while the latest rising wedge adds strength to the bearish bias.
AUD/JPY: Four-hour chart
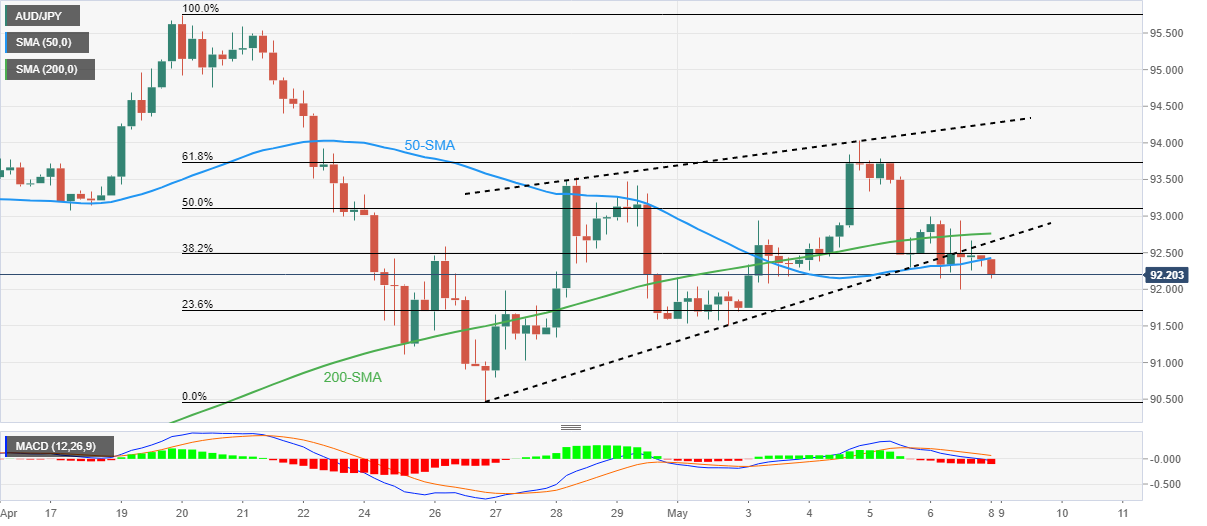
Trend: Further weakness expected
- NZD/USD holds lower grounds near the lowest levels since June 2020, down for the third consecutive day.
- Market sentiment sours amid fears of tighter monetary policy ahead, China’s worsening covid conditions and fresh sanctions on Russia.
- US NFP matched revised down prior figures, Unemployment Rate also stays intact at 3.6%.
- Inflation numbers are the key for this week, China trade figures for April can direct immediate moves.
NZD/USD bears attack the multi-month low surrounding 0.6400, tested on Thursday, as the week-start trading fails to push back the sellers. The bearish bias could be well-linked to the market’s expectations of further hardships due to tighter monetary policy and risk-negative headlines emanating from China, as well as relating to Russia.
The fresh week fails to bring any change in the market’s dull mood, at least during the start, as challenges to the risk profile stay heavy ahead of the key inflation numbers from the US, New Zealand and China. Also weighing on the sentiment, as well as on the NZD/USD prices are fears of worsening coronavirus conditions in China, New Zealand’s major customer, as well as heavy Western sanctions on Russia.
Although the Fed refrained from 75 basis points (bps) of the rate hike, the headline US jobs report failed to match the softer forecasts and maintained pressure on the US central bank to rush towards tighter monetary policy. The same leads the rest of the major central banks towards further rate hikes and drowns the riskier assets like NZD/USD. That being said, the US Nonfarm Payrolls (NFP) reprinted the 428K figures, if compared to the revised figures for March, by surpassing the 391K forecasts. On the same line, the Unemployment Rate also remained intact at 3.6%.
Following the data, Minneapolis Fed President and FOMC member Neel Kashkari said, per a blog post on Medium, “Given that long-term real rates have the greatest influence on the demand for credit, financial conditions are already nearly back to neutral levels.” The policymaker also said his assessment of the nominal neutral rate of interest is still that it is around 2.0%. It’s worth noting that the President of the Federal Reserve Bank of St. Louis James Bullard reiterated his bullish bias and pushed the Fed towards a 3.5% rate.
Elsewhere, weekend news suggested Shanghai introduced further activity restrictions due to covid while the Group of Seven (G7) nations announced additional sanctions on Russia due to its invasion of Ukraine.
Amid these plays, the US dollar is likely to keep adding to its gains while the commodities and the Antipodeans may have to suffer. On an immediate basis, China’s trade numbers for April will be important for the NZD/USD prices due to Auckland’s trade ties with Beijing. The headline Trade Balance is expected to increase to $50.65B versus $47.38B prior while the Imports and Exports may print mixed figures and can probe the bears.
Technical analysis
A downward sloping trend line from late April guards immediate NZD/USD rebound near the 0.6500 threshold. Until then, a convergence of the weekly support line and lows marked during late June 2020, around 0.6380-70, appears a tough nut to crack for the bears.
- GBP/USD eyes a directionless move but more downside is on the cards.
- The BOE has reinforced the chances of a recession on the weak labor market.
- The US economy has managed to report higher job additions than the forecasts.
The GBP/USD pair is oscillating in a narrow range of 1.2323-1.2369 as renewed recession fears after the monetary policy announcement by the Bank of England (BOE) have sidelined investors. The announcement of the monetary policy by BOE Governor Andrew Bailey unveiled a rate hike by 25 basis points (bps) with a majority of 6-3. The minority policymakers were advocating a consecutive rate hike by 50 bps.
Apart from the rate hike decision, the BOE dictated that inflation will persist for a longer period and it may reach up to 10% by 2024. However, the UK administration is much concerned over corporate inability to produce sufficient employment. The households are facing the strong headwinds of higher energy bills and food prices, which are already impacting their real income. And, lower job additions with higher personal expenses are fueling the signs of recession.
Meanwhile, the US dollar index looks to reclaim the round level resistance of 104.00 as higher US Nonfarm Payrolls (NFP) has bolstered the odds of a consecutive jumbo rate hike by the Federal Reserve (Fed). The US NFP came in at 428k, significantly higher than the expectations of 391k but a little lower than the prior print of 431k. Going forward, the US inflation numbers will remain in the spotlight, which are expected to land at 8.1%, lower than the previous figure of 8.5%.
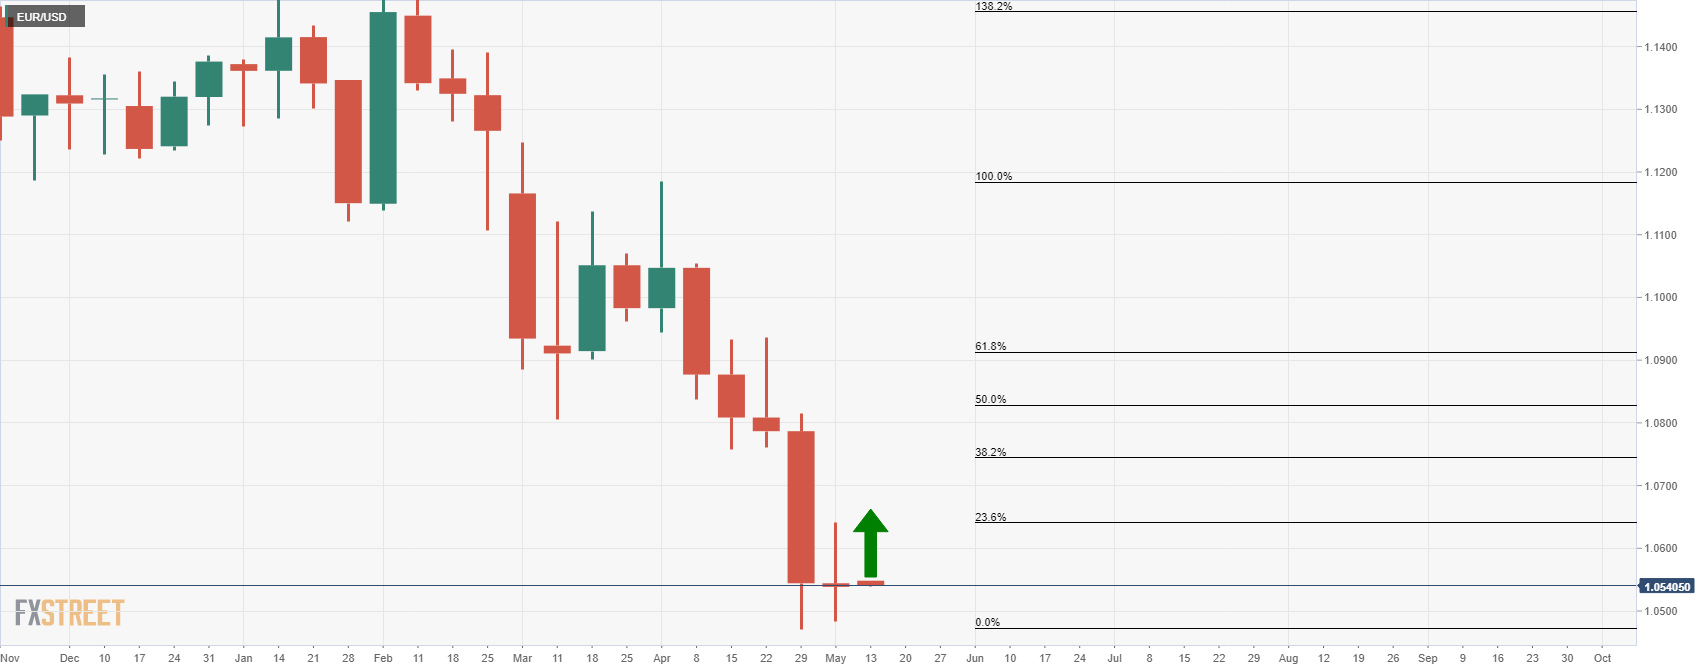
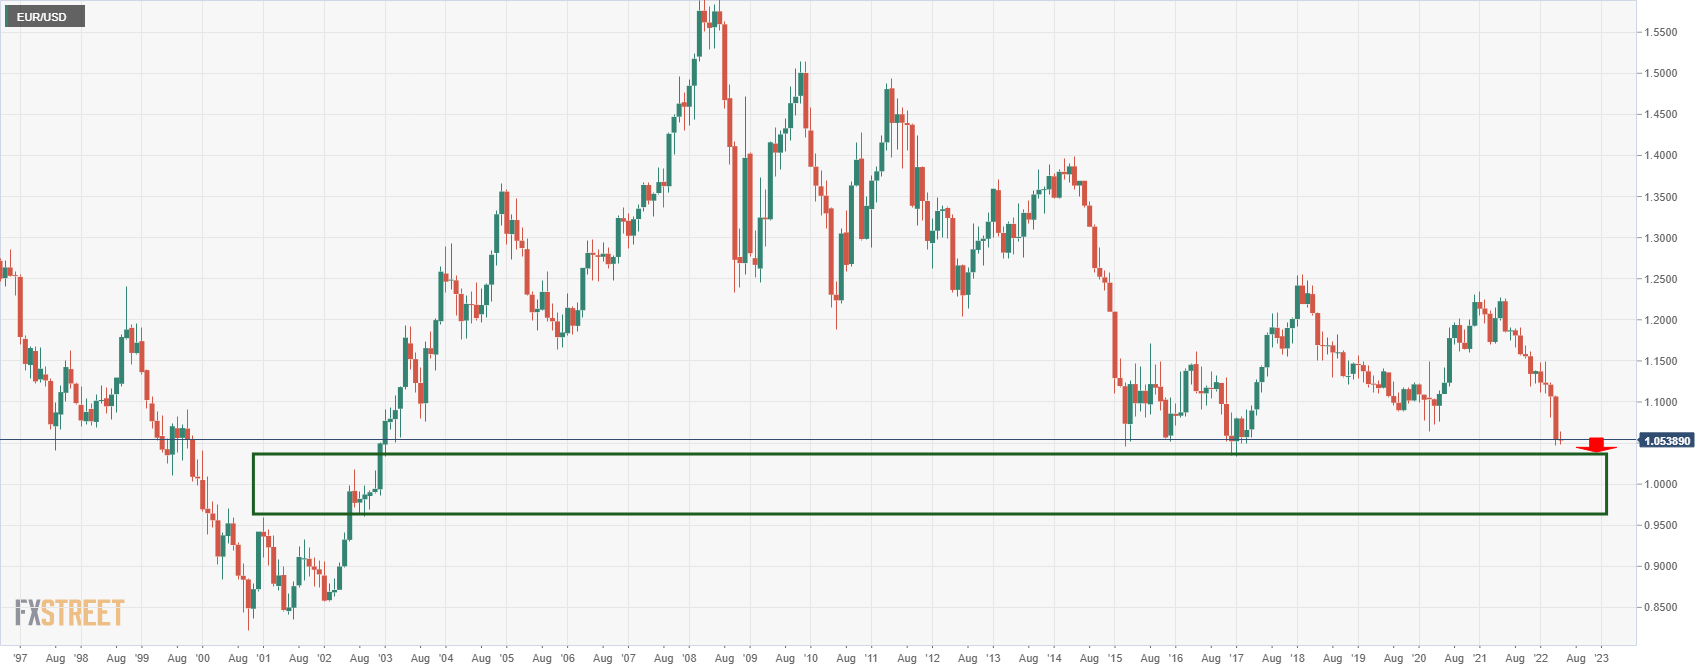
- 1.0340 2017 lows in focus for the weeks ahead.
- A break there will open the risk of a move below parity.
At a glance, the EUR/USD bearish impulse looks relatively overdone and the price is stalling after making a cycle low of 1.0472. At 1.0541, the euro is trading near Friday's doji close and bulls will be on the lookout for a bullish engulfing candle for the first day of the week to confirm the corrective bias. The same can be said for the weekly chart also:
EUR/USD weekly chart
EUR/USD daily chart
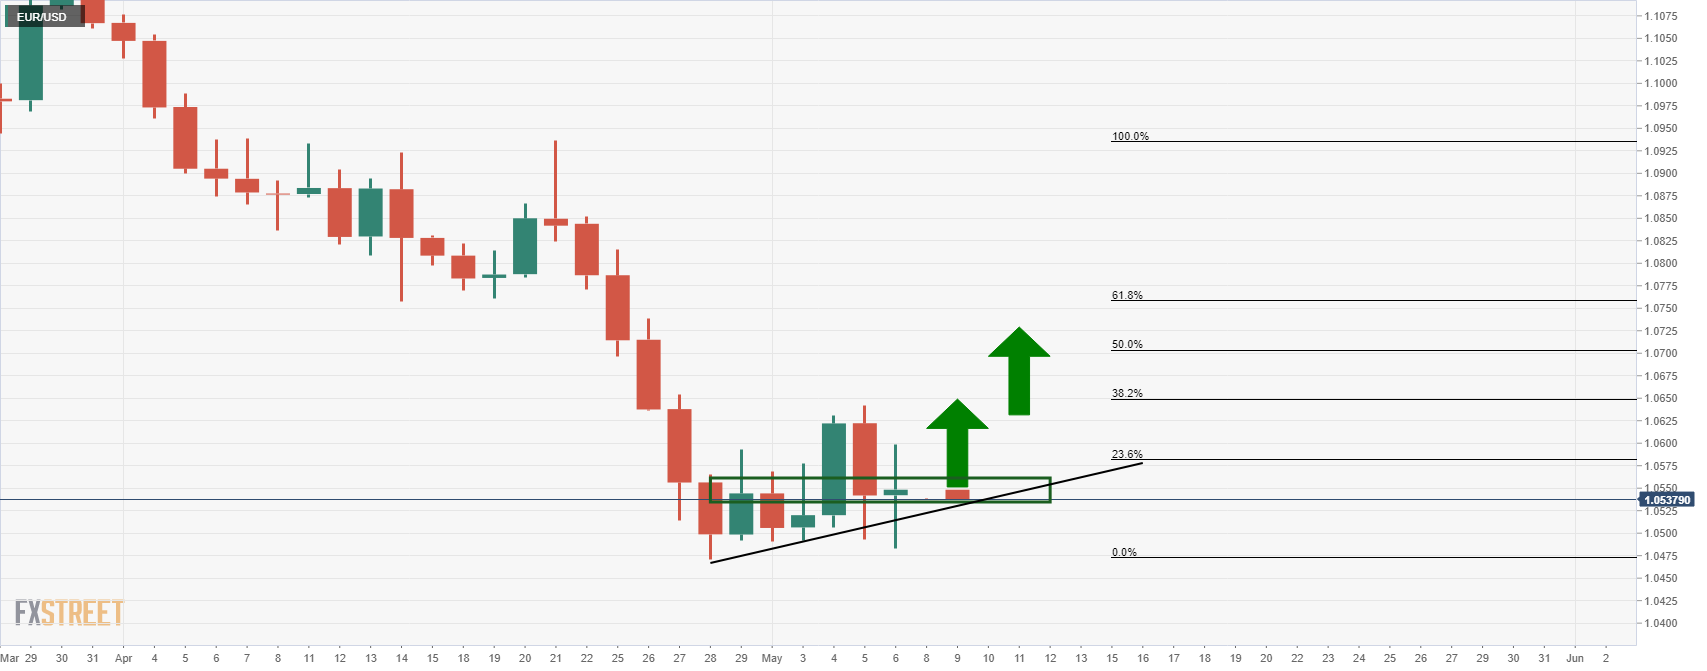
The price is based in what could be a phase of accumulation, at least on the lower time frames. However, failures to break higher will likely encourage the bears and lead to redistribution and a continuation of the bear trend for the days and possibly weeks ahead with a focus on the 2017 lows initially, 1.0340. A break there will open the risk of a move below parity:
EUR/USD monthly chart
- Gold price may hover below $1,900 as investors will focus on US inflation.
- Higher US NFP has bolstered the odds of a jumbo rate hike in June.
- US inflation is seen lower at 8.1% against the prior print of 8.5%.
Gold Price (XAU/USD) is expected to open flat on Monday and will likely perform lackluster on galloping catalysts that favor a rate hike by the Federal Reserve (Fed) in June. Inflation will persist longer on account of higher fossil fuel prices and costly commodities due to the multiplier effects of helicopter money and the Russia-Ukraine war. Now, the upbeat US Nonfarm Payrolls (NFP) has reinforced the chances of a jumbo rate hike by the Fed in June.
The US central bank elevated its interest rate by 50 basis points (bps) in May to tame the multi-decade inflation. Now, solid job additions in the US economy at 428k, much higher than the consensus of 391k have bolstered one more 50 bps rate hike in June. The Unemployment Rate remained unchanged at 3.6%, and according to the report, it was led by gains in leisure, hospitality, manufacturing, transportation, and warehousing.
It looks possible that a tight labor market will raise the Labor Price Index and higher earnings by the household will lead to a much higher inflation print in the US economy and eventually will impact the gold prices.
This week, the US inflation will remain in focus, which is expected to land at 8.1% against the prior print of 8.5% on yearly basis. A lower inflation print may dent the odds of a jumbo rate hike but broad-based inflation is still higher, which demands one more mega rate hike.
Gold technical analysis
The precious metal is forming a symmetrical triangle chart pattern on an hourly scale, which signals indecisiveness in the sentiments of the market participants. The 20-period Exponential Moving Average (EMA) at $1,882.16 is overlapping with prices, which signals a consolidation ahead. Meanwhile, the Relative Strength Index (RSI) (14) is oscillating in a 40.00-60.00 range, which advocates a directionless move.
Gold hourly chart
-637876435501530190.png)
Reuters reports that Shanghai is tightening its already strict COVID-19 lockdown in a fresh push to eliminate infections outside quarantined areas of China’s biggest city by late this month.
''Curbs will likely vary across the city’s 16 districts as some have already hit the target, but the people said movement curbs will generally remain until the end of May due to fears of a rebound, despite recently falling case numbers in the country’s worst coronavirus outbreak.''
''Shanghai is reporting thousands of cases a day, the vast majority in sealed-off areas such as central quarantine facilities, premises under “closed loop” management and housing where residents are barred from leaving their front doors.''
The mood in global markets has been soured surrounding the situation and is compounding the drag on risk appetite with global investors dumping stocks. Chinese tech stocks that are heavily exposed to domestic consumer activity have been among the hardest hit, with Alibaba tumbling more than 7 per cent and Tencent falling more than 5 per cent. This has been feeding its way through to Wall Street and forex, supporting the US dollar higher.
Chinese trade data coming up
Meanwhile, Chinese economic data is front and centre also. Monthly surveys released recently showed sentiment among manufacturing and services businesses have fallen in April to the lowest since the initial shock of the pandemic in February 2020. The Caixin services PMI was the latest release, with a drop to 36.2 in April. That’s far below the 50 line that indicates contraction or expansion. Other data depict a similarly broad impact from Covid restrictions in China and at the start of the week, China's trade data is released.
''April is likely to have been under pressure with most provinces under some form of restrictions and Shanghai in a full month of lockdown,'' analysts at TD Securities said. ''We expect further slowing in exports growth and weakness in imports. A soft trade outturn will add more pressure for follow-through by officials following their recent pledges on policy stimulus to support the economy.''
G7 sanction on Russia
Meanwhile, the ''US announced a slate of new sanctions against Russia on Sunday, cutting off Kremlin-controlled media outlets from American advertisers and prohibiting the country from using US-provided management and accounting consulting services,'' CNN reported.
President Joe Biden and the leaders of the G7 met virtually with Ukrainian President Volodymyr Zelensky on Sunday which concluded with an announcement that included new export controls against the Russian industrial sector and roughly 2,600 visa restrictions on Russian and Belarusian officials, as well as the first sanctions against executives of Gazprombank, the institution through which most of Europe buys Russian gas.
"Preventing Russia from accessing the United States' valuable professional services increases the pressure on the Kremlin and cuts off its ability to evade sanctions imposed by the United States and our partners," US Treasury Secretary Janet Yellen said in a statement. "We are also targeting Putin's ability to generate revenue that enables his aggression, as well as entities and their leaders who support his destructive actions."
G7 Leaders’ Statement “First, we commit to phase out our dependency on Russian energy, including by phasing out or banning the import of Russian oil. We will ensure that we do so in a timely and orderly fashion…”
- USD/JPY bulls moving in on critical resistance.
- Bull flag playing out in a trilogy on the daily chart.
As per the prior analysis, USD/JPY Price Analysis: Bears eye a 61.8% golden ratio, USD/JPY moved in on the 61.8% Fibonacci and could now be n the process of making a fresh bull cycle high following last week's bullish weekly close.
Weekly chart
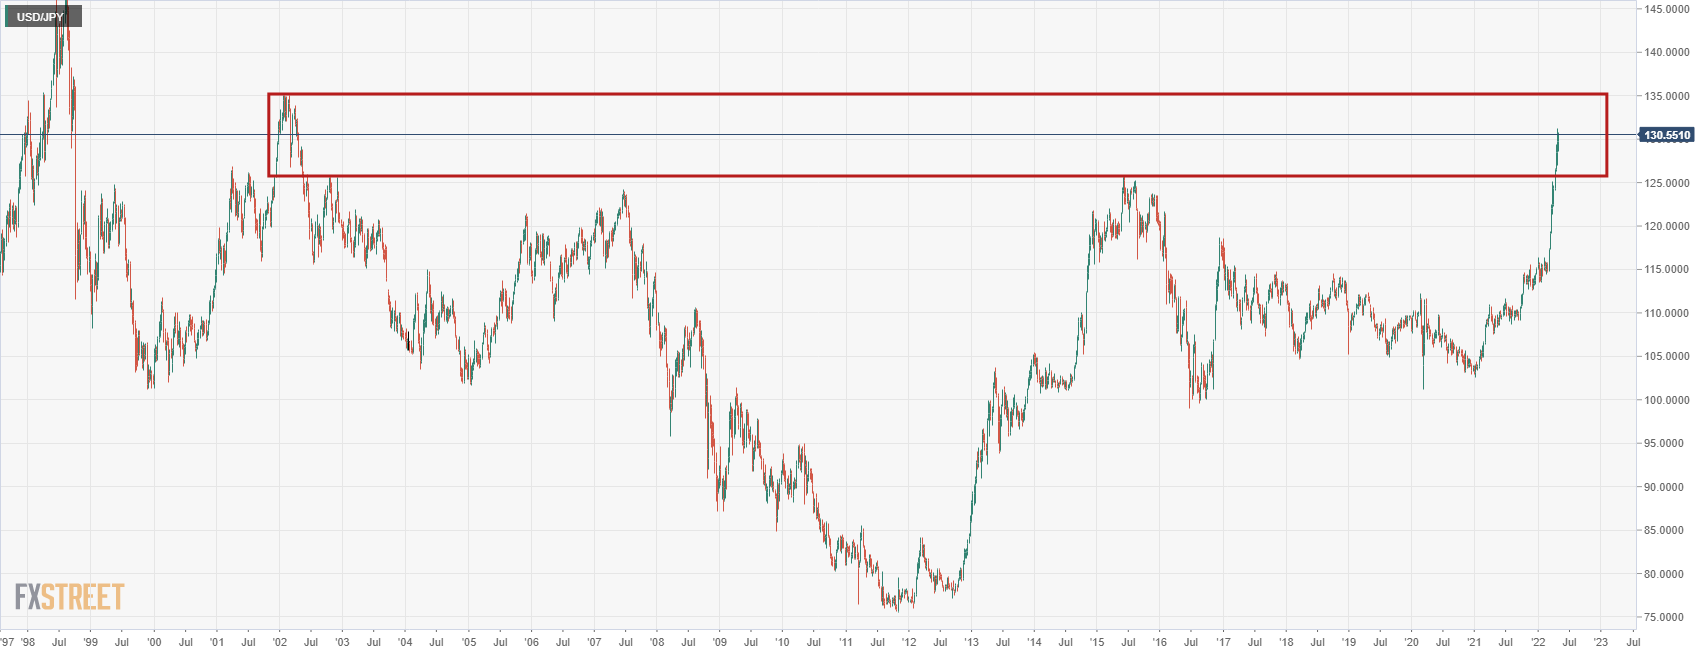
The market is mitigating the imbalance of price from the start of 2002's business. While the weekly rally is relatively overdone and parabolic, a correction may only come should the daily support structure give out.
USD/JPY daily chart
In last week's analysis, USD/JPY Price Analysis: Bullish daily flag breakout is underway, noting the series of bullish flag breakouts, the price has continued to move higher:
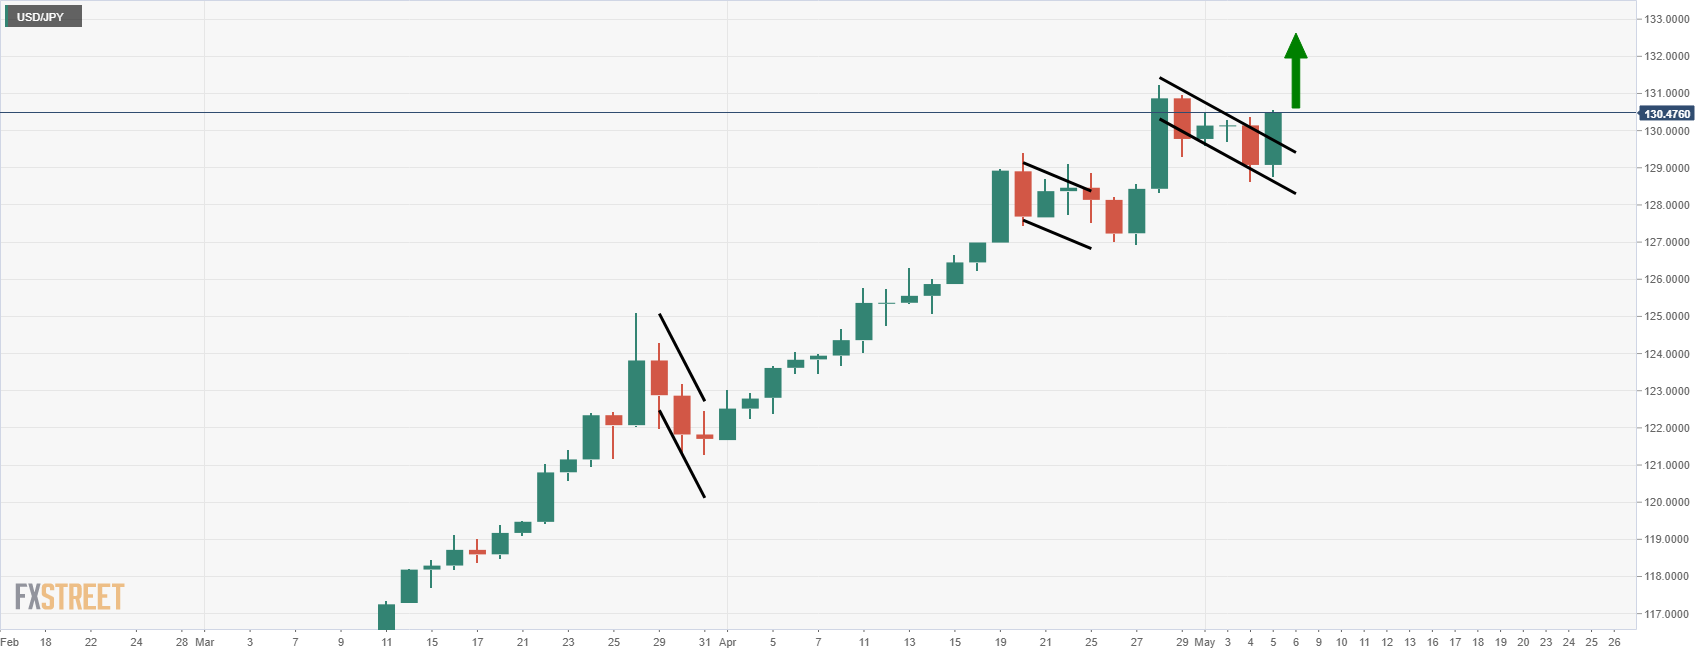
(Prior analysis)
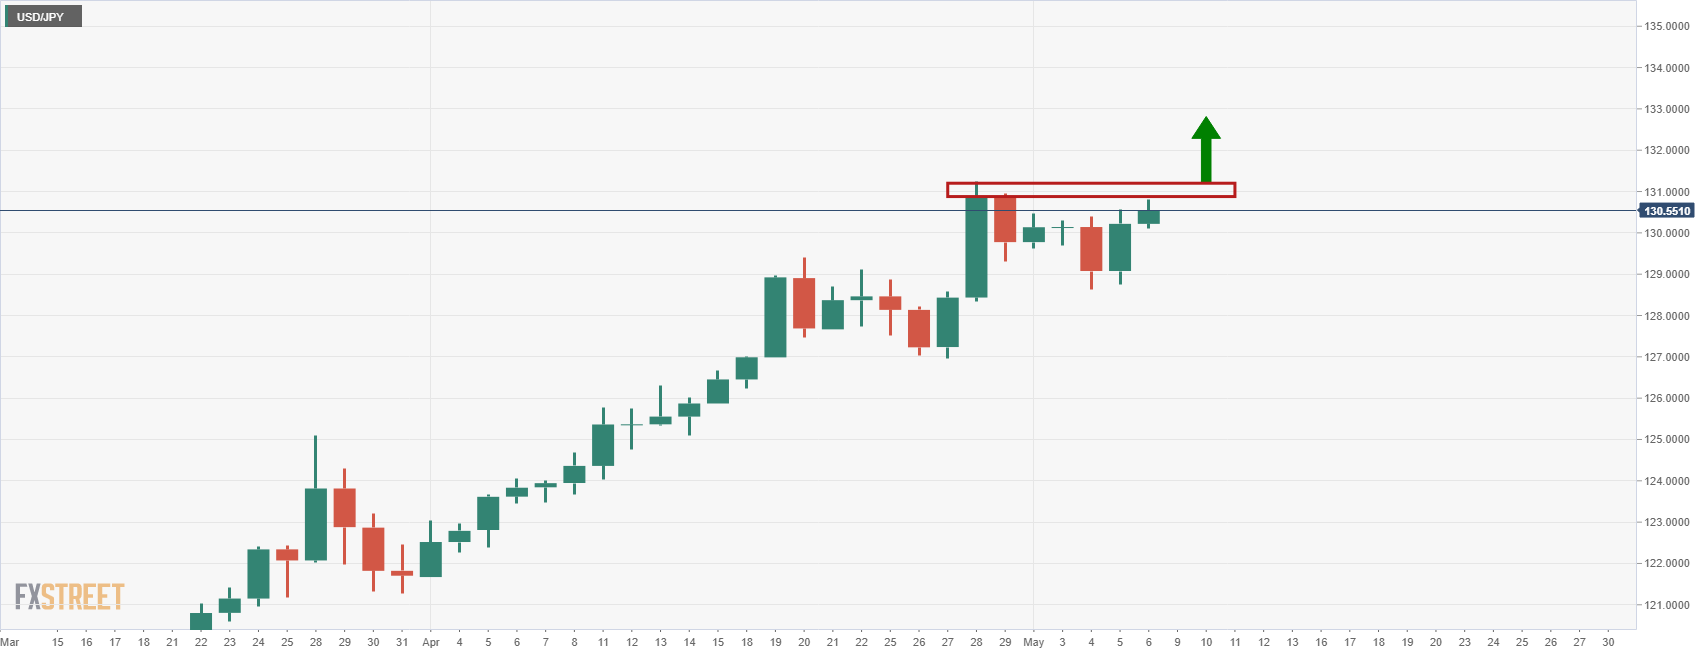
The price is up against resistance for the open but a break there for a fresh daily high could encourage the bulls on the way to the 2002 highs in the 134 area.
However, failing a continuation, a break of 130.14 support and the 128.70 could be the trap door for the forthcoming days:
- AUD/USD bears have their focus on a test of 0.70 the figure.
- External pressures remain despite US wage inflation possibly peaking.
At 0.7070, AUD/USD closed on the backfoot losing 0.54% on Friday and is poised for a break of key 4-hour support for the opening sessions this week with a focus on a negative external environment.
A very solid US labour market supports the Federal Reserve's inclination to front-load interest rate hikes, but a softer wage print would be expected to keep the US dollar contained and dependent on economic data going forward. US Nonfarm Payrolls rose a robust 428k in April, above the 380k consensus, data showed on Friday.
The Unemployment Rate remained unchanged at 3.6% but the average hourly earnings slowed to 0.3% MoM after posting a solid 0.5% MoM advance in March. That lowered the year-on-year increase in wages to 5.5% from 5.6% in March and could be a sign that inflation is peaking. Consequently, the US dollar slipped against a basket of currencies on Friday after hitting a 20-year high. The dollar index (DXY) reached 104.07, the highest since December 2002, before falling back to 103.64, down 0.09% on the day.
The next major US economic focus will be the Consumer Price Index on Wednesday which is expected to show that price pressures rose at an annual pace of 8.1% in April, just below March's reading of 8.5%. Additionally, a slew of Fed officials will be providing remarks in the upcoming week following the FOMC's May meeting.
New York Fed's John Williams and Governor Christopher Waller's remarks will be key in shedding some light after Fed Chairman Jerome Powell's presser last week that failed to offer much in the way of clarity on what the Fed will do after frontloading rate hikes until neutral.
Domestically, there is not a lot on the calendar for the week ahead. Traders are on standby for the wage figures that will be released on 18 May followed by the employment report released the day after. This information will be key for the Reserve Bank of Australia and will help traders gauge policy expectations ahead of the June meeting.
A focus on China
In the meantime, there will be a focus on lockdowns in mainland China and slowing global demand. The war in Ukraine remains a factor as well which has led to worsening supply-chain issues and a sharp rise in commodity prices which is providing less and less support to the Aussie.
Nevertheless, there is some good news coming out of the Chinese government which pressured iron ore prices higher last week. China Securities Regulatory Commission announced that it will support the financing of real estate companies as a feature of the government’s commitment to bolster infrastructure investment.
However, the Chinese trade data this week will likely show a slowing of imports with most provinces under some form of restrictions and Shanghai in a full month of lockdown. ''We expect further slowing in exports growth and weakness in imports. A soft trade outturn will add more pressure for follow-through by officials following their recent pledges on policy stimulus to support the economy,'' analysts at TD Securities said.
AUD/USD technical analysis
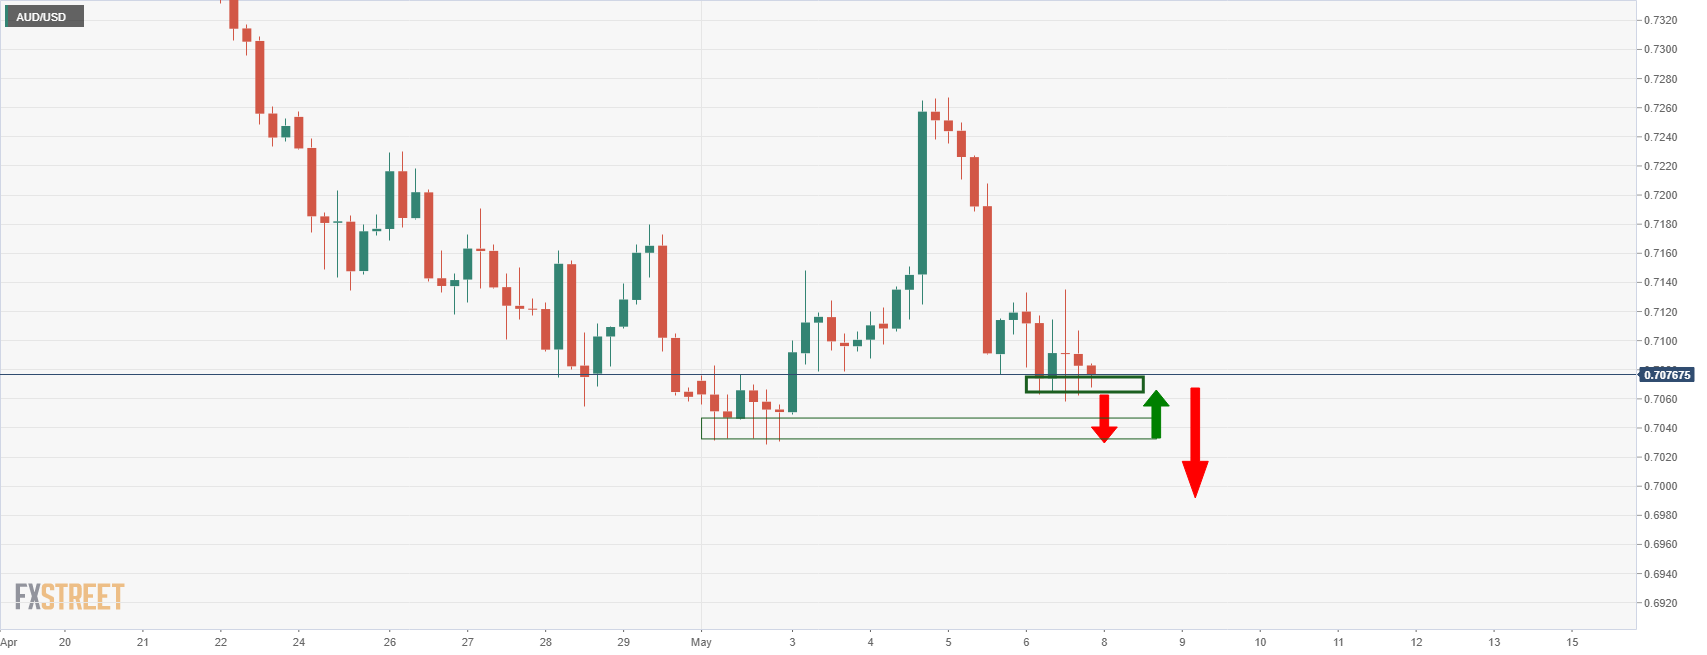
The bears are taking on the 4-hour support and there are prospects of a retest of the prior lows. Should the bears keep on top, then a lower low is feasible for the coming sessions:
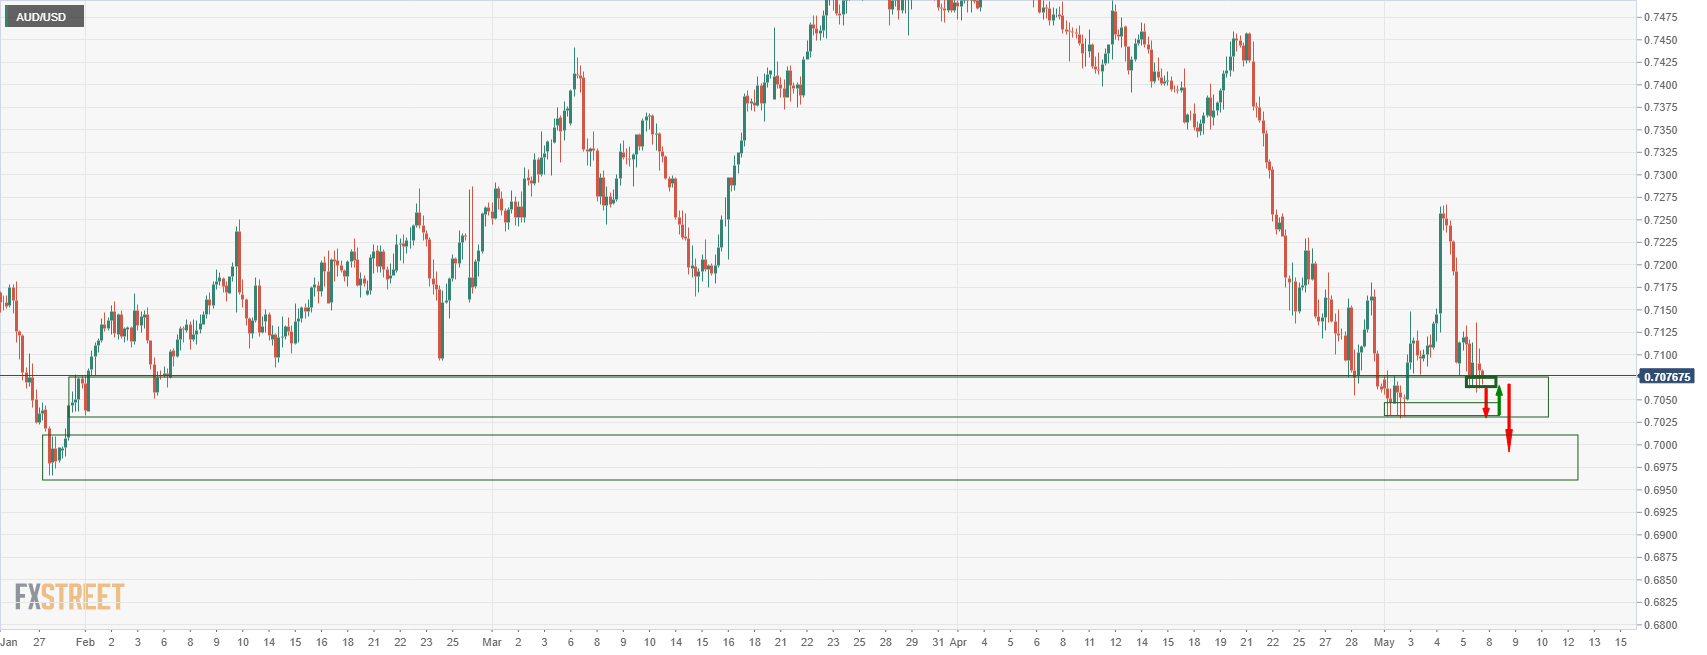
The bears will have an eye on 0.7000 and 0.6970 thereafter.


© 2000-2026. All rights reserved.
This site is managed by Teletrade D.J. LLC 2351 LLC 2022 (Euro House, Richmond Hill Road, Kingstown, VC0100, St. Vincent and the Grenadines).
The information on this website is for informational purposes only and does not constitute any investment advice.
The company does not serve or provide services to customers who are residents of the US, Canada, Iran, The Democratic People's Republic of Korea, Yemen and FATF blacklisted countries.
Making transactions on financial markets with marginal financial instruments opens up wide possibilities and allows investors who are willing to take risks to earn high profits, carrying a potentially high risk of losses at the same time. Therefore you should responsibly approach the issue of choosing the appropriate investment strategy, taking the available resources into account, before starting trading.
Use of the information: full or partial use of materials from this website must always be referenced to TeleTrade as the source of information. Use of the materials on the Internet must be accompanied by a hyperlink to teletrade.org. Automatic import of materials and information from this website is prohibited.
Please contact our PR department if you have any questions or need assistance at pr@teletrade.global.
transfers