- Analytics
- News and Tools
- Market News
CFD Markets News and Forecasts — 16-06-2020
| Time | Country | Event | Period | Previous value | Forecast |
|---|---|---|---|---|---|
| 01:30 | Australia | Leading Index | May | -1.5% | |
| 06:00 | United Kingdom | Producer Price Index - Output (YoY) | May | -0.7% | -0.9% |
| 06:00 | United Kingdom | Producer Price Index - Input (YoY) | May | -9.8% | -6% |
| 06:00 | United Kingdom | Producer Price Index - Input (MoM) | May | -5.1% | 4.5% |
| 06:00 | United Kingdom | Producer Price Index - Output (MoM) | May | -0.7% | 0.1% |
| 06:00 | United Kingdom | Retail Price Index, m/m | May | 0% | 0.1% |
| 06:00 | United Kingdom | HICP ex EFAT, Y/Y | May | 1.4% | |
| 06:00 | United Kingdom | Retail prices, Y/Y | May | 1.5% | 1.2% |
| 06:00 | United Kingdom | HICP, m/m | May | -0.2% | 0% |
| 06:00 | United Kingdom | HICP, Y/Y | May | 0.8% | 0.5% |
| 09:00 | Eurozone | Construction Output, y/y | April | -15.4% | |
| 09:00 | Eurozone | Harmonized CPI | May | 0.3% | -0.1% |
| 09:00 | Eurozone | Harmonized CPI ex EFAT, Y/Y | May | 0.9% | 0.9% |
| 09:00 | Eurozone | Harmonized CPI, Y/Y | May | 0.3% | 0.1% |
| 12:30 | U.S. | Housing Starts | May | 0.891 | 1.093 |
| 12:30 | U.S. | Building Permits | May | 1.066 | 1.225 |
| 12:30 | Canada | Bank of Canada Consumer Price Index Core, y/y | May | 1.2% | 1.4% |
| 12:30 | Canada | Consumer Price Index m / m | May | -0.7% | 0.7% |
| 12:30 | Canada | Consumer price index, y/y | May | -0.2% | 0% |
| 14:30 | U.S. | Crude Oil Inventories | June | 5.72 | 0.5 |
| 16:00 | U.S. | Fed Chair Powell Testimony | |||
| 20:00 | U.S. | FOMC Member Mester Speaks | |||
| 22:45 | New Zealand | GDP y/y | Quarter I | 1.8% | 0.3% |
| 22:45 | New Zealand | GDP q/q | Quarter I | 0.5% | -1% |
FXStreet reports that economist at UOB Group Ho Woei Chen, CFA, reviewed the latest set of data releases in the Chinese economy.
“The activity indicators for May showed further improvement in industrial production (IP) growth to 4.4% y/y in May…bringing the year-to-date IP to -2.8% y/y. The contraction in fixed-asset investment (FAI) narrowed to -6.3% y/y YD.... However, retail sales had continued to lag the recovery in the industrial sector, as it continued to fall at -2.8% y/y in May…”
“Meanwhile, the survey jobless rate improved to 5.9% in May from 6.0% in the previous month after touching a high of 6.2% in February… Stability in employment remains one of the key policy priorities in China and policymakers will continue to use a mix of policy tools to maintain the unemployment rate close to the official target of 6.0%.”
“In general, the latest data were slightly below Bloomberg’s consensus forecasts and pointed to a fairly lacklustre recovery pace in China. Earlier release of the trade data also showed China’s exports (in USD-terms) slipping back to contraction of -3.3% y/y in May from a gain of +3.5% y/y in April, though this was partly due to a higher base of comparison.”
“We are maintaining our forecast for China’s GDP growth at 3.5% y/y in 2Q20 before a more broad-based recovery in the second half as more economies emerge from their COVID-19 lockdowns. Our current GDP outlook for China is at 4.9% y/y in 3Q20 and 5.7% y/y in 4Q20 for full-year growth of 1.8% (2019: 6.1%).”
- This morning's retail sales number was more positive evidence
- Economic rebound will leave us 'well short' of January levels
- It's going to take time to rebuild confidence
- Tight job market is single best thing Fed can do to support gains of minority communities
- The Fed is highly motivated to get labor market back to where it was before pandemic
- I don't think the balance sheet currently presents any threat to inflation or financial stability
- Not concerned about Fed's plans for its balance sheet
- If state and local governments are in financial straits, it can really weigh on the economy
- Fed will slow corporate-bond buying program if market function improves
- Some recent indicators have pointed to stabilization
- Fed will keep current interest rates until the economy is on track to meet its employment and inflation goals
- Full recovery is unlikely until public is confident coronavirus has been contained
- Pandemic is hitting low-income households the hardest
- Long-term inflation expectations 'fairly stable'
- Fed is committed to using its full range of tools to support the economy
- Downturn could widen U.S. inequality if not reversed
- Direct financial help to families and business can make a critical difference and limit long-lasting economic damage
The Commerce
Department announced on Tuesday that business inventories fell 1.3 percent
m-o-m in April, following a revised 0.3 percent m-o-m decline in March
(originally, a drop of 0.2 percent m-o-m).
That was worse
than economists’ forecast for a 0.8 percent m-o-m decrease.
According to
the report, stocks at retailers plunged 3.7 percent m-o-m in April, while those
at manufacturers declined 0.4 percent m-o-m. At the same time, inventories at
wholesalers rose 0.3 percent m-o-m.
In y-o-y terms,
business inventories fell 2.2 percent in April.
The National
Association of Homebuilders (NAHB) announced on Tuesday its housing market
index (HMI) surged 21 points to 37 in June from an unrevised May reading of 37.
Economists had
forecast the HMI to increase to 45.
A reading over
50 indicates more builders view conditions as good than poor.
All three HMI
components registered gains this month. The indicator gauging current sales
conditions jumped 21 points to 63 in June, while the component measuring
traffic of prospective buyers climbed 22 points to 43 and the measure charting
sales expectations surged 22 points to 68.
NAHB Chairman
Dean Mon noted: “As the nation reopens, housing is well-positioned to lead the
economy forward. Inventory is tight, mortgage applications are increasing,
interest rates are low and confidence is rising. And buyer traffic more than
doubled in one month even as builders report growing online and phone inquiries
stemming from the outbreak.”
Meanwhile, NAHB
Chief Economist Robert Dietz said: “Housing clearly shows signs of momentum as
challenges and opportunities exist in the single-family market. Builders report
increasing demand for families seeking single-family homes in inner and outer
suburbs that feature lower density neighborhoods. At the same time, elevated
unemployment and the risk of new, local virus outbreaks remain a risk to the
housing market.”
The Federal
Reserve reported on Tuesday the U.S. industrial production rose 1.4 m-o-m in May,
following a revised 12.5 percent m-o-m decline in April (originally an 11.2
percent m-o-m drop), which was the largest drop in the 101-year history of the
index.
Economists had
forecast industrial production would increase 2.9 percent m-o-m in May.
According to
the report, many factories resumed at least partial operations following suspensions
related to COVID-19 in May. Manufacturing output, which fell sharply in March
and April, rose 3.8 percent m-o-m, as most major industries posted advances,
with the largest gain registered by motor vehicles and parts. Meanwhile, the indexes
for mining and utilities declined 6.8 percent m-o-m and 2.3 percent m-o-m,
respectively.
Capacity
utilization for the industrial sector increased 0.8 percentage point m-o-m to
64.8 percent in May. That was 2.1 percentage points below economists’ forecast and
15.0 percentage points below its long-run (1972-2019) average.
In y-o-y terms, the industrial output fell 15.3
percent in May, following a revised 16.2 percent decrease in the prior month
(originally a 15.0 percent drop).
U.S. stock-index futures rose on Tuesday after the release of much-better-than-expected data on the U.S. retail sales for May, as well as reports about potential steroidal treatment for coronavirus and Trump $1 trillion infrastructure plan.
Global Stocks:
Index/commodity | Last | Today's Change, points | Today's Change, % |
Nikkei | 22,582.21 | +1,051.26 | +4.88% |
Hang Seng | 24,344.09 | +567.14 | +2.39% |
Shanghai | 2,931.75 | +41.72 | +1.44% |
S&P/ASX | 5,942.30 | +222.50 | +3.89% |
FTSE | 6,284.47 | +219.77 | +3.62% |
CAC | 4,988.71 | +172.99 | +3.59% |
DAX | 12,387.08 | +475.73 | +3.99% |
Crude oil | $38.42 | +3.50% | |
Gold | $1,734.60 | +0.43% |
(company / ticker / price / change ($/%) / volume)
3M Co | MMM | 162.01 | 4.28(2.71%) | 19672 |
ALCOA INC. | AA | 12.25 | 0.84(7.36%) | 113606 |
ALTRIA GROUP INC. | MO | 40.88 | 0.57(1.41%) | 11813 |
Amazon.com Inc., NASDAQ | AMZN | 2,610.01 | 37.33(1.45%) | 46706 |
American Express Co | AXP | 110.91 | 6.96(6.69%) | 42139 |
AMERICAN INTERNATIONAL GROUP | AIG | 35.4 | 2.21(6.66%) | 25735 |
Apple Inc. | AAPL | 351.86 | 8.87(2.59%) | 544718 |
AT&T Inc | T | 31.25 | 0.75(2.46%) | 234949 |
Boeing Co | BA | 209 | 18.06(9.46%) | 1675016 |
Caterpillar Inc | CAT | 132.75 | 9.14(7.39%) | 106024 |
Chevron Corp | CVX | 95 | 3.77(4.13%) | 36028 |
Cisco Systems Inc | CSCO | 47.25 | 1.90(4.19%) | 111296 |
Citigroup Inc., NYSE | C | 56.42 | 3.44(6.49%) | 361592 |
Deere & Company, NYSE | DE | 162.49 | 7.02(4.52%) | 3188 |
E. I. du Pont de Nemours and Co | DD | 54 | 2.01(3.87%) | 3845 |
Exxon Mobil Corp | XOM | 49.55 | 2.41(5.11%) | 175145 |
Facebook, Inc. | FB | 237.45 | 4.95(2.13%) | 153443 |
FedEx Corporation, NYSE | FDX | 138.04 | 4.36(3.26%) | 9730 |
Ford Motor Co. | F | 6.99 | 0.49(7.54%) | 1106431 |
Freeport-McMoRan Copper & Gold Inc., NYSE | FCX | 11.13 | 0.66(6.30%) | 76004 |
General Electric Co | GE | 7.74 | 0.50(6.91%) | 1558366 |
General Motors Company, NYSE | GM | 29.23 | 1.46(5.26%) | 138292 |
Goldman Sachs | GS | 214 | 7.69(3.73%) | 40561 |
Google Inc. | GOOG | 1,449.49 | 29.64(2.09%) | 9728 |
Hewlett-Packard Co. | HPQ | 17.35 | 0.48(2.85%) | 30669 |
Home Depot Inc | HD | 250 | 8.64(3.58%) | 29339 |
HONEYWELL INTERNATIONAL INC. | HON | 151.75 | 5.12(3.49%) | 2105 |
Intel Corp | INTC | 61.19 | 1.09(1.81%) | 184943 |
International Business Machines Co... | IBM | 124.06 | 2.41(1.98%) | 54748 |
International Paper Company | IP | 36.74 | 1.68(4.79%) | 315 |
Johnson & Johnson | JNJ | 144.4 | 3.15(2.23%) | 27021 |
JPMorgan Chase and Co | JPM | 105.75 | 4.50(4.44%) | 203053 |
McDonald's Corp | MCD | 192.3 | 2.81(1.48%) | 75270 |
Merck & Co Inc | MRK | 75.4 | 1.38(1.86%) | 42114 |
Microsoft Corp | MSFT | 193.5 | 4.56(2.41%) | 283431 |
Nike | NKE | 100.75 | 2.91(2.97%) | 53391 |
Pfizer Inc | PFE | 33.6 | 0.24(0.72%) | 470694 |
Procter & Gamble Co | PG | 117.53 | 0.84(0.72%) | 15061 |
Starbucks Corporation, NASDAQ | SBUX | 79.1 | 2.14(2.78%) | 49234 |
Tesla Motors, Inc., NASDAQ | TSLA | 1,016.50 | 25.60(2.58%) | 307512 |
The Coca-Cola Co | KO | 47.5 | 1.20(2.59%) | 90789 |
Travelers Companies Inc | TRV | 118.79 | 3.94(3.43%) | 1731 |
Twitter, Inc., NYSE | TWTR | 34.93 | 0.82(2.40%) | 56909 |
UnitedHealth Group Inc | UNH | 295.77 | 9.49(3.31%) | 16367 |
Verizon Communications Inc | VZ | 57.1 | 0.95(1.69%) | 42707 |
Visa | V | 197.98 | 6.22(3.24%) | 46529 |
Wal-Mart Stores Inc | WMT | 119.56 | 1.48(1.25%) | 113132 |
Walt Disney Co | DIS | 121.9 | 4.82(4.12%) | 110215 |
Yandex N.V., NASDAQ | YNDX | 43.19 | 0.31(0.72%) | 44831 |
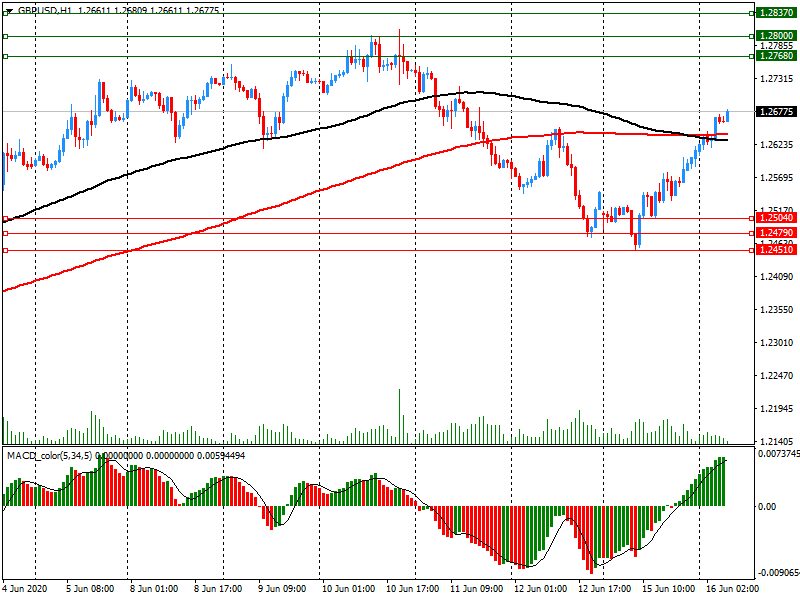
FXStreet notes that politics and economics are both set to remain drivers for the pound since they both are also likely to be an influence on the path of BoE policy which will need to increase QE and mull negative interest rates. Economists at Rabobank expect the EUR/GBP at 0.91 in one month.
“If a EU/UK trade deal is announced in the coming months it will be a relief for the pound. Even then, however, any gains for GBP could be curtailed by a string of poor UK economic data releases.”
“Our estimates suggest that UK GDP could plunge by -19.5% q/q in Q2 2020, far steeper than contractions in the US, Germany, France and even Italy.”
“There is a strong consensus in the market that the BoE will increase the size of its asset purchasing scheme over the summer, but a storm of bad UK economic data is likely to keep alive the debate over whether or not the Bank will eventually succumb to the draw of negative interest rates. The type of trade deal negotiated with the EU will also feed this argument about BoE policy is likely to pan out.”
“Given the risk that a trade deal is likely to be difficult to trash out, we see risk of a move towards EUR/GBP 0.91 on a one-month view. While we see scope for a recovery into year-end, we see GBP upside limited by recessionary woes. In a six-month view, we see EUR/GBP in the 0.89/0.88 area.”
Pfizer (PFE) initiated with a Mkt Perform at SVB Leerink; target $40
Apple (AAPL) target raised to $425 from $375 at Wedbush
Apple (AAPL) target raised to $400 from $310 at Citigroup
Alcoa (AA) downgraded to Hold from Buy at Deutsche Bank; target $10
Intel (INTC) downgraded to Equal-Weight from Overweight at Morgan Stanley; target $65
NVIDIA (NVDA) downgraded to Equal-Weight from Overweight at Morgan Stanley; target $380
Cisco (CSCO) upgraded to Buy from Neutral at BofA/Merrill; target raised to $55
The Commerce
Department announced on Tuesday the sales at U.S. retailers jumped 17.7 percent
m-o-m in May, following a revised 14.7 percent m-o-m plunge in April
(originally a 16.4 percent m-o-m tumble). That was the biggest monthly increase on record.
Economists had expected total sales would climb 8.0 percent m-o-m in May.
According to the report, sales of clothing and footwear (+188 percent m-o-m) rebounded the most, followed by furniture (+89.7 percent m-o-m), sporting goods, hobby, musical instrument, and book stores (+88.2 percent m-o-m), electronics and appliances (+50.5 percent m-o-m), motor vehicles (+44.1 percent m-o-m), and gasoline stations (+12.8 percent m-o-m).
Excluding auto,
retail sales rose 12.4 percent m-o-m in May after a revised 15.2 percent m-o-m
decline in the previous month (originally a 17.2 percent m-o-m fall), much better
than economists’ forecast of a 5.4 percent m-o-m gain.
In y-o-y terms,
the U.S. retail sales declined 6.1 percent in May, following a revised 19.9 decrease
in the previous month (originally a 21.6 percent drop).
| Time | Country | Event | Period | Previous value | Forecast | Actual |
|---|---|---|---|---|---|---|
| 06:00 | Germany | CPI, m/m | May | 0.4% | -0.1% | -0.1% |
| 06:00 | Germany | CPI, y/y | May | 0.9% | 0.6% | 0.6% |
| 06:00 | United Kingdom | Average earnings ex bonuses, 3 m/y | April | 2.7% | 1.9% | 1.7% |
| 06:00 | United Kingdom | Average Earnings, 3m/y | April | 2.4% | 1.4% | 1% |
| 06:00 | United Kingdom | ILO Unemployment Rate | April | 3.9% | 4.7% | 3.9% |
| 06:00 | United Kingdom | Claimant count | May | 1032.7 | 400 | 528.9 |
| 08:00 | France | IEA Oil Market Report | ||||
| 09:00 | Eurozone | ZEW Economic Sentiment | June | 46 | 58.6 | |
| 09:00 | Germany | ZEW Survey - Economic Sentiment | June | 51 | 60 | 63.4 |
USD was little changed and mixed against its major rivals in the European session on Tuesday as risk appetite improved after the Fed announced plans to start buying individual corporate bonds, while concerns for the second wave of global coronavirus infections faded.
The U.S. currency fell against GBP and CHF, rose against EUR and NZD, and changed little against CAD, AUD and JPY.
The U.S. Dollar Index (DXY), measuring the U.S. currency's value relative to a basket of foreign currencies, edged up 0.02% to 96.72.
On Monday, the Fed said it is to begin buying corporate bonds on Tuesday. The central bank will purchase the bonds under its Secondary Market Corporate Credit Facility (SMCCF), an emergency lending program, using an indexed approach. This move builds on the Fed's purchase of corporate bond ETFs, which started in May.
Market participants await the testimony of the Fed's Chairman Jerome Powell before the U.S. Senate Banking Committee, set to begin at 14:00 GMT. It is expected that Powell may address the Fed's latest corporate bond tailwind as well as the central bank's broader estimate of a 6.5% contraction for the U.S. economy this year.
An additional support to the market was provided by Bloomberg's report that the U.S. President Donald Trump’s administration was considering a nearly $1 trillion infrastructure proposal to boost the domestic economy.
FXStreet reports that USD/CAD reversed back lower yesterday, reinforcing the view that strength was corrective and the focus is on the support seen at 1.3482/73, the Credit Suisse analyst team apprise.
“We expect further weakness to unfold and see support initially at 1.3482/73, removal of which would see the small base negated and a fresh attempt at 1.3398, then 1.3365/57, ahead of the ‘neckline’ to the November/December 2019 base and 78.6% retracement of the 2020 surge at 1.3331/16, which may continue to prove a tough barrier. Removal of here though would then see the downtrend accelerate further, with support next at 1.3287.”
“Resistance is seen at 1.3586, then 1.3637, ahead of 1.3686, which ideally caps to maintain the immediate downside bias. Removal of here though could see a move back to the more important breakout point at 1.3851/56, which ideally then caps any further upside.”
FXStreet reports that Mike Wilson from Morgan Stanley believes that while a correction on the S&P 500 Index may be afoot, this isn’t atypical for a young bull market. Therefore, he targets 2800 before the rally resumes.
“The V-shape recovery in markets is foreshadowing a V-shape recovery in the economy and earnings. It's following the same pattern we witnessed after the Great Financial Crisis recession. In fact, the correction is right on schedule with that period too, and it's likely not finished. More specifically, I'm targeting 2800 on the downside for the S&P 500 before this bull market resumes in earnest.”
“Our June 2021 base case price target for the S&P 500 is now 3350 with a bull and bear case target of 3700 and 2900, respectively.”
“With housing and equity markets holding up, the average consumer net worth is unchanged, which means we aren't expecting a big deleveraging cycle this time. On the contrary, it appears the consumer wants to get back to normal fast, which means 70% of the economy is able to recover quickly.”
FXStreet reports that the Credit Suisse analyst team apprises that the kiwi maintains a consolidation range after closing above 0.6488 and is now trading at 0.6466 with a test of the 0.6563 June high on the cards. Above here, the trend would change to the upside.
“NZD/USD reverted back higher to close above the pivotal 0.6398 and 0.6448. This adds weight to the view of an extension of the rangebound environment, which may eventually result in a fresh test of the pivotal 2014 downtrend and current June high at 0.6563/84.”
“A sustained and closing break above the June high at 0.6563/84 would reinforce thoughts of a broader change in trend to the upside, with resistance then seen at 0.6629, ahead of 0.6665, where we might see fresh sellers at first. Removal of here in due course would the expose the 31st December 2019 high, then 38.2% retracement of the 2014/2020 fall and the 61.8% retracement of the 2017/2020 fall at 0.6755/60.”
“Short-term support moves initially to 0.6459, then 0.6426/17, ahead of 0.6381, which ideally holds once more. A close below here would now see a small top complete, with 0.6322/21 next.”
FXStreet notes that as the S&P 500 Index falls, the USD rallies and as the S&P 500 Index recovers, the USD sells off. This is due to Risk On-Risk Off (RORO) behaviour rather than a USD bull or bear market, in the opinion of economists at HSBC, who believes the Aussie and the kiwi will perform well thanks to its fiscal advantage.
“G10 currencies have behaved exactly as ‘Risk On-Risk Off’ (RORO) suggests: Risk-on currencies have recovered significant losses against the USD in the risk-on period, but they depreciate against the USD in the risk-off period. In our view, this is simply RORO playing out, rather than an idiosyncratic USD bull or bear market.”
“From the start of the year to its year-to-date low on 23 March, the S&P 500 Index fell c1,000 points amid the COVID-19 pandemic and market turmoil. This was the result of acute risk-off sentiment across financial markets, and FX was no exception to this phenomenon. We subsequently saw G10 FX behave in classic RORO fashion, with risk-on currencies (such as the AUD and NZD) depreciating markedly against the USD, and risk-off currencies (such as the CHF and JPY) less so.”
“The S&P 500 had recovered its losses – c1,000 points of them – when it reached its recent high on 8 June. G10 currencies again behaved in RORO fashion. Risk-on currencies surged against the USD, and the outperformance of the JPY and CHF faded.”
“Those with more fiscal room may see their economies recover faster than those with larger debt overhangs allowing their currencies to outperform. As a result, our preferences in the medium-term remain those currencies where fiscal firepower is less constrained: i.e., the AUD and NZD. Meanwhile, we see downside risks for the EUR, GBP and CAD, given their more challenging debt-to-GDP profiles.”
FXStreet reports that FX Strategists at UOB Group suggested that USD/JPY’s outlook remains tilted to the negative side, while the pair remains focused on the 106.70-region in the near-term.
24-hour view: “Our expectation for a stronger rebound did not materialize as USD traded in a quiet manner between 106.98 and 107.57 before ending the day little changed at 107.31 (-0.03%). The current movement is viewed as an on-going consolidation phase. In other words, USD could continue to trade sideways for now, likely between 107.00 and 107.70.”
Next 103 weeks: “Last Thursday (11 Jun, spot at 107.05), we held the view that the outlook for USD ‘is mildly negative’. We indicated that USD has to ‘close below 106.70 before a sustained decline can be expected’. While USD subsequently dropped to 106.56, it did not close below 106.70. Despite the strong rebound last Friday, the risk for further USD weakness is still intact. Only a move above 108.00 (no change in ‘strong resistance’ level) would indicate the current mild downward pressure has eased. In other words, we continue to hold the same view from last Thursday.”
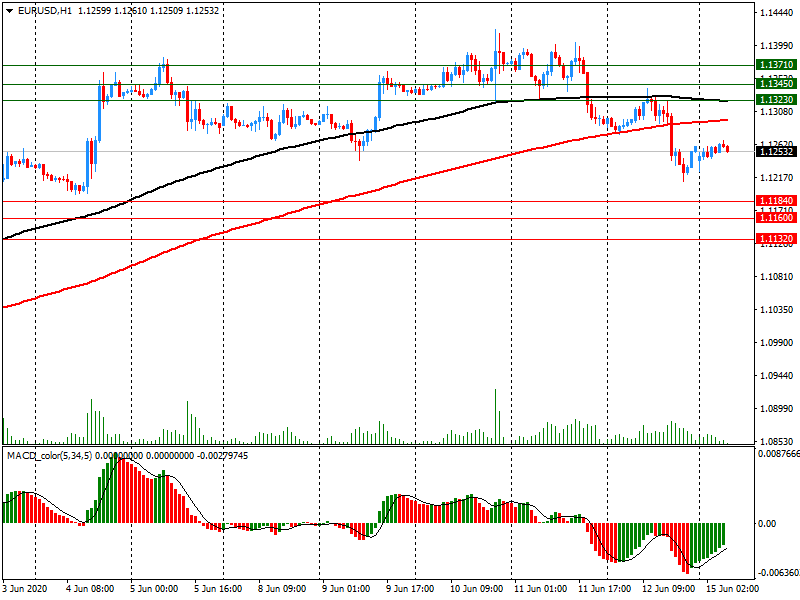
FXStreet reports that EUR/USD is holding support from its rising 13-day average at 1.1249 as the pair trades at 1.1325 and weakness stays seen as corrective by analysts at Credit Suisse ahead of a fresh attempt to establish the market above 1.1400.
“EUR/USD remains well supported, still holding its rising 13-day average, now at 1.1249 and we continue to view the weakness of the past few days as a corrective setback ahead of a fresh attempt to establish above 1.1400.”
“Resistance stays seen at the 38.2% retracement of the 2018/2020 decline and medium-term downtrend at 1.1357/69, above which would suggest the correction is over and the rally can resume with resistance then seen at 1.1403 ahead of 1.1423/28, then the 1.1495 high for the year. Whilst this latter level should clearly be respected, a break would mark a medium-term base to mark a more important change of trend higher, with just initial resistance then at 1.1596.”
“Near-term support moves to 1.1260, with 1.1249/40 now ideally holding to keep the immediate risk higher. Below 1.1213/12 though is needed to rekindle thoughts of a deeper setback, with support seen next at 1.1160/54.”
Reuters reports that Switzerland's economy will suffer its worst downturn in decades during 2020 as the coronavirus pandemic damages output and jobs, the government said on Wednesday, but the downturn will be less severe than initially feared.
Swiss gross domestic product will fall 6.2% this year, the State Secretariat for Economic Affairs (SECO) said, the worst downturn since 1975, when the country was hit by the aftermath of the oil price shocks.
Unemployment is forecast to rise to 3.8% this year, as foreign trade suffers, consumer spending shrinks and companies emerge slowly from shutdowns imposed to halt the spread of the COVID-19 virus.
Still, the forecast was a slight improvement from the 6.7% downturn in GDP foreseen by the Swiss government's economists in their April statement, and compares favourably with other European countries.
The Swiss government expects a gradual recovery during the second half of 2020, provided a massive second wave of the disease along with severe restrictions does not occur.
In 2021, SECO forecasts underlying economic growth of 4.9%, although unemployment will remain high by Swiss standards at 4.1%.
According to the report from ZEW, in June 2020, the ZEW Indicator of Economic Sentiment for Germany increased for the third consecutive time. The indicator currently stands at 63.4 points, which corresponds to a rise of 12.4 points compared with the May result. Economists had expected an increase to 60,0. The assessment of the economic situation in Germany has improved for the first time since January 2020. In the current survey, the corresponding indicator stands at minus 83.1 points, 10.4 points higher than in the previous month.
“There is growing confidence that the economy will bottom out by summer 2020. This is reflected in the renewed rise of the ZEW Indicator of Economic Sentiment as well as the more optimistic assessment of the current situation. The expected earnings for the individual sectors in Germany still vary greatly. Earnings expectations are strongly negative for export-oriented sectors such as automotive and mechanical engineering, as well as the financial sector. In contrast, forecasts are fairly positive for information technologies, telecommunications and consumer-oriented services. The financial market experts continue to expect only a slow increase in economic value added in the third and fourth quarters,” comments ZEW President Professor Achim Wambach.
Financial market experts’ sentiment concerning the economic development of the eurozone also improved once again, with the corresponding indicator climbing 12.6 points to a current level of 58.6 points compared to the previous month. The indicator for the current economic situation in the eurozone climbed 5.4 points to a level of minus 89.6 points.
FXStreet reports that UOB Group’s FX Strategists reiterated tat USD/CNH is expected to keep the rangebound mood for the time being.
24-hour view: “Yesterday, we held the view that ‘a break of the strong resistance at 7.0950 would not be surprising but USD is unlikely to move above 7.1100’. USD subsequently rose to a high of 7.0972 before dropping back down quickly. The rapid decline appears to be running ahead of itself but there is room for USD to test 7.0600 first before a more sustained recovery can be expected. Resistance is at 7.0830 followed by 7.0900.”
Next 1-3 weeks: “Last Monday (08 Jun, spot at 7.0570), we indicated that USD ‘could weaken to 7.0400’. After USD dropped to 7.0400, we highlighted on Thursday (11 Jun) that ‘the negative phase in USD is still intact and noted that the next support below 7.0400 is at 7.0200 followed 7.0000’. We added, ‘oversold short-term conditions could lead to a few days of consolidation first’. The subsequent consolidation has resulted in a rapid loss in momentum and while our 7.0950 ‘strong resistance’ is still intact, the prospect for USD to move below 7.0400 from here has dissipated. In other words, USD has likely moved into a consolidation phase and is expected to trade between 7.0500 and 7.1250 for a period.”
IEA raised the forecast for 2020 oil demand by nearly 500,000 bpd due to stronger than expected imports in Asia.
Floating storage of crude oil in May fell by 6.4 mil barrels m/m to 165.8 mil barrels
Global oil supply fell by 11.8 mil bpd in May
Helped by OPEC+ countries reducing output by 9.4 mil bpd
Sees oil demand next year to rise by 5.7 mil bpd, but still lower than in 2019
Oil demand next year to remain 2.4 mil bpd below 2019 levels
Reduced jet and kerosene deliveries will impact total oil demand until at least 2022.
Less flying due to coronavirus fears means the world will not return to pre-pandemic demand levels before 2022.
On OPEC+, they made a "strong start" and delivered 89% of its pledge to cut output
Rising prices could pose a problem:
Reuters reports that the European Union must urgently decide on a package of fiscal measures to help the bloc through its pandemic-induced economic crisis, European Central Bank board member Fabio Panetta told French newspaper Le Monde.
“It is extremely urgent and the aim should be to deploy it as soon as possible, no later than early 2021,” Panetta was quoted on Tuesday as saying. “The longer we wait, the costlier it will be to intervene.”
The EU proposed a 750 billion euro package last month, including 500 billion in grants, but resistance from a handful of fiscally conservative nations has threatened to delay the deal and no agreement in June is now expected.
FXStreet reports that NZD/USD followed the equities roller coaster and has made a recovery after nearing the 0.6370 key support and is now trading at 0.6474. Kiwi’s fate is tied to equities performance, according to economists at ANZ Bank.
“Kiwi hit its overnight low just above key support at 0.6370 almost to the minute as S&P500 futures hit their low, and has been in recovery mode ever since they turned, putting on almost 100bps. Again it’s all about equities – where they go Kiwi will blindly follow.”
“The overall liquidity environment remains supportive of risk currencies like the NZD, and New Zealand’s unique success in stamping out COVID-19 puts it in good stead too. But let’s not get too excited, there are major challenges down the track, leaving us broadly neutral at these levels.”
“Support 0.6370 Resistance 0.6500”
FXStreet reports that after a downside correction, the EUR/USD pair is ready to resume its uptrend targeting the last week high at 1.1422 and the 1.1495 March high, according to Commerzbank’s Karen Jones.
“EUR/USD has been downside corrective recently but dips lower have held over 1.1172, the 38.2% retracement and it is well placed to resume its up move.”
“Last week the market charted a new high at 1.1422 and this together with the March high at 1.495 represent the near-term targets. Above here will target 1.1570, the 2019 high, then 1.1815/22, the 61.8% retracement of the move down from the 2018 peak and the 1.1862 2008- 2020 resistance line.”
“Initial support is the 1.1170 38.2% retracement. Below 1.1170 would allow for 1.1096, the 6-week support line, but we would look for the market to hold down here.”
| Time | Country | Event | Period | Previous value | Forecast | Actual |
|---|---|---|---|---|---|---|
| 01:30 | Australia | House Price Index (QoQ) | Quarter I | 3.9% | 2.7% | 1.6% |
| 01:30 | Australia | RBA Meeting's Minutes | ||||
| 03:00 | Japan | BoJ Interest Rate Decision | -0.1% | -0.1% | ||
| 05:45 | Switzerland | SECO Economic Forecasts | ||||
| 06:00 | Germany | CPI, m/m | May | 0.4% | -0.1% | -0.1% |
| 06:00 | Germany | CPI, y/y | May | 0.9% | 0.6% | 0.6% |
| 06:00 | United Kingdom | Average earnings ex bonuses, 3 m/y | April | 2.7% | 1.9% | 1.7% |
| 06:00 | United Kingdom | Average Earnings, 3m/y | April | 2.4% | 1.4% | 1% |
| 06:00 | United Kingdom | ILO Unemployment Rate | April | 3.9% | 4.7% | 3.9% |
| 06:00 | United Kingdom | Claimant count | May | 1032.7 | 400 | 528.9 |
The US dollar fell against the euro, the pound, and the currencies of Asian emerging markets after the Federal reserve published a scheme for implementing a $250 billion corporate bond buyback program.
The Fed said it will begin buying back "a wide range of corporate bonds to maintain market liquidity and ensure that loans are available to large employers." The Fed will create a portfolio of corporate bonds based on the index, which will include all securities traded on the secondary market and meet the minimum requirements under this program.
The Fed's expansion of the range of bonds repurchased under this program has increased risk appetite in financial markets.
The yen fell after the Bank of Japan maintained ultra-soft monetary policy parameters at the end of its meeting on Tuesday, continuing to assess the impact of stimulus measures it introduced earlier in response to the crisis caused by the coronavirus pandemic. The interest rate on deposits from commercial banks remained at the level of -0.1% per annum, while the target yield on ten-year government bonds in Japan is about zero. The Central Bank confirmed that it still does not intend to limit the purchase of government bonds as part of the quantitative easing (QE) program.
The ICE index, which tracks the dynamics of the us dollar against six currencies (Euro, Swiss franc, yen, canadian dollar, pound sterling and Swedish Krona), fell by 0.2%
CNBC reports that Stephen Roach, one of the world’s leading authorities on Asia, is worried a changing global landscape paired with a massive U.S. budget deficit will spark a dollar crash.
“The U.S. economy has been afflicted with some significant macro imbalances for a long time, namely a very low domestic savings rate and a chronic current account deficit,” the former Morgan Stanley Asia chairman told CNBC. “The dollar is going to fall very, very sharply.”
His forecast calls for a 35% drop against other major currencies.
“These problems are going from bad to worse as we blow out the fiscal deficit in the years ahead,” said Roach, a Yale University senior fellow.
The U.S. Dollar Currency Index is up more than one percent over the past two weeks and is relatively flat so far this year. But Roach believes it’s no time to get complacent.
“The national savings rate is probably going to go deeper into negative territory than it has ever done for the United States or any leading economy in economic history,” he said.
Roach contends other forces are at play, too.
“At the same time, America is walking away from globalization and is focused on decoupling itself from the rest of the world,” said Roach. “That’s a lethal combination.”
The big question: Will it happen quickly or gradually?
His timeline is rough — over the next year or two, maybe more. However, Roach suggests a crash virtually inevitable, and it’s a risk investors shouldn’t ignore.
“Generally, it’s a negative implication for U.S. financial assets,” he added. “It points to the probability of higher inflation as we import more higher cost foreign goods from overseas, and that’s a negative for interest rates.”
He’s concerned a crash could spark a late 1970s-type stagflation crisis, when prices rose sharply while economic growth was muted.
According to the report from Federal Statistical Office (Destatis), the inflation rate in Germany, measured as the year-on-year change in the consumer price index, stood at +0.6% in May 2020. The inflation rate decreased for the third consecutive month. Destatis also reports that consumer prices fell by 0.1% compared with April 2020.
The prices of goods (total) decreased by 0.4% from May 2019 to May 2020. This was mainly due to the decline in energy product prices, which accelerated to 8.5% (April: -5.8%). As a oil price slump in the world market, which has been observed since the beginning of the year, in particular the prices of heating oil (-30.5%) and motor fuels (-20.7%) declined sharply compared with the same month a year earlier. Electricity prices, in contrast, rose by 4.2%. This was still due to the increase in the EEG surcharge at the beginning of the year. Food prices rose by an above-average 4.5% compared with May 2019. Consumers paid higher prices especially for fruit (+10.5%) and for meat and meat products (+9.2%), while the prices of edible fats and oils declined (-4.5%).
In particular, the sharply decreasing prices of energy products had a downward effect on the inflation rate. Excluding energy product prices, the inflation rate would have been much higher at +1.6% in May 2020.
Compared with April 2020, the overall consumer price index was down by 0.1% in May 2020. Energy product prices declined markedly by 1.3%, especially the prices of heating oil (-7.0%) and motor fuels (-2.4%). Fruit prices, in contrast, were up by 1.3%.
According to the report from Office for National Statistics, the UK employment rate in the three months to April 2020 was estimated at 76.4%, 0.3 percentage points higher than a year earlier but 0.1 percentage points down on the previous quarter.
The UK unemployment rate for the three months to April 2020 was estimated at 3.9%, 0.1 percentage points higher than a year earlier but largely unchanged on the previous quarter. Economists had expected an increase to 4.7%/
The total number of weekly hours worked in the three months to April 2020 was 959.9 million, down a record 94.2 million (8.9%) hours on the previous year.
Pay growth for employees in total pay (including bonuses) is estimated to be 1.0%; this translates to a fall of 0.4% in real terms
For the the three months to April 2020:
total pay (nominal) annual growth rate was 1.0%
regular pay (nominal) annual growth rate was 1.7%
total pay (real) annual growth rate was negative 0.4%
regular pay (real) annual growth rate was 0.4%
This is the first time since the three months to January 2018 that we have seen total pay fall in real terms. It is more impacted than that for regular pay because of subdued bonuses, which fell by an average negative 6.8% (in nominal terms) in the three months February to April 2020.
There were an estimated 476,000 vacancies in the UK in March to May 2020; this is 342,000 fewer than the previous quarter and 365,000 fewer than a year earlier; experimental single-month estimates indicate a decrease of approximately 60% of vacancies for May 2020 compared with March 2020.
The Claimant Count continued to rise during May 2020 reaching 2.8 million; this includes both those employed with low income or hours and those who are unemployed.
EUR/USD
Resistance levels (open interest**, contracts)
$1.1489 (1195)
$1.1455 (1164)
$1.1423 (1486)
Price at time of writing this review: $1.1343
Support levels (open interest**, contracts):
$1.1265 (299)
$1.1238 (1984)
$1.1206 (579)
Comments:
- Overall open interest on the CALL options and PUT options with the expiration date July, 2 is 46860 contracts (according to data from June, 15) with the maximum number of contracts with strike price $1,1700 (2339);
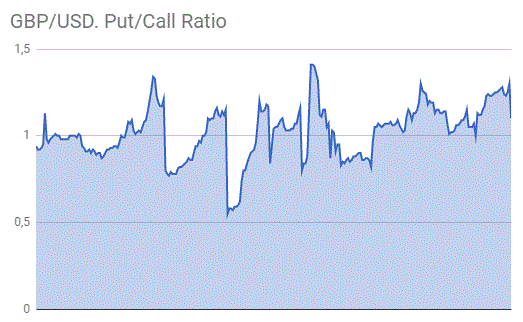
GBP/USD
Resistance levels (open interest**, contracts)
$1.2837 (1564)
$1.2800 (1342)
$1.2768 (1489)
Price at time of writing this review: $1.2678
Support levels (open interest**, contracts):
$1.2504 (941)
$1.2479 (987)
$1.2451 (1482)
Comments:
- Overall open interest on the CALL options with the expiration date July, 2 is 14800 contracts, with the maximum number of contracts with strike price $1,2900 (1606);
- Overall open interest on the PUT options with the expiration date July, 2 is 16774 contracts, with the maximum number of contracts with strike price $1,2550 (1482);
- The ratio of PUT/CALL was 1.13 versus 1.13 from the previous trading day according to data from June, 15
* - The Chicago Mercantile Exchange bulletin (CME) is used for the calculation.
** - Open interest takes into account the total number of option contracts that are open at the moment.
| Raw materials | Closed | Change, % |
|---|---|---|
| Brent | 39.67 | 4.67 |
| Silver | 17.34 | -0.52 |
| Gold | 1725.093 | -0.3 |
| Palladium | 1930.93 | 0.54 |
| Index | Change, points | Closed | Change, % |
|---|---|---|---|
| NIKKEI 225 | -774.53 | 21530.95 | -3.47 |
| Hang Seng | -524.43 | 23776.95 | -2.16 |
| KOSPI | -101.48 | 2030.82 | -4.76 |
| ASX 200 | -128 | 5719.8 | -2.19 |
| FTSE 100 | -40.48 | 6064.7 | -0.66 |
| DAX | -37.93 | 11911.35 | -0.32 |
| CAC 40 | -23.54 | 4815.72 | -0.49 |
| Dow Jones | 157.62 | 25763.16 | 0.62 |
| S&P 500 | 25.28 | 3066.59 | 0.83 |
| NASDAQ Composite | 137.21 | 9726.02 | 1.43 |
| Time | Country | Event | Period | Previous value | Forecast |
|---|---|---|---|---|---|
| 01:30 | Australia | House Price Index (QoQ) | Quarter I | 3.9% | 2.7% |
| 01:30 | Australia | RBA Meeting's Minutes | |||
| 03:00 | Japan | BoJ Interest Rate Decision | -0.1% | ||
| 05:45 | Switzerland | SECO Economic Forecasts | |||
| 06:00 | Germany | CPI, m/m | May | 0.4% | -0.1% |
| 06:00 | Germany | CPI, y/y | May | 0.9% | 0.6% |
| 06:00 | United Kingdom | Average earnings ex bonuses, 3 m/y | April | 2.7% | 1.9% |
| 06:00 | United Kingdom | Average Earnings, 3m/y | April | 2.4% | 1.4% |
| 06:00 | United Kingdom | ILO Unemployment Rate | April | 3.9% | 4.5% |
| 06:00 | United Kingdom | Claimant count | May | 856.5 | 370 |
| 08:00 | France | IEA Oil Market Report | |||
| 09:00 | Eurozone | ZEW Economic Sentiment | June | 46 | |
| 09:00 | Germany | ZEW Survey - Economic Sentiment | June | 51 | 60 |
| 12:30 | Canada | Foreign Securities Purchases | April | -9.78 | |
| 12:30 | U.S. | Retail Sales YoY | May | -21.6% | |
| 12:30 | U.S. | Retail sales excluding auto | May | -17.2% | 5.1% |
| 12:30 | U.S. | Retail sales | May | -16.4% | 8% |
| 13:15 | U.S. | Capacity Utilization | May | 64.9% | 66.9% |
| 13:15 | U.S. | Industrial Production YoY | May | -15% | |
| 13:15 | U.S. | Industrial Production (MoM) | May | -11.2% | 3% |
| 14:00 | U.S. | NAHB Housing Market Index | June | 37 | 45 |
| 14:00 | U.S. | Business inventories | April | -0.2% | -0.8% |
| 14:00 | U.S. | Fed Chair Powell Testimony | |||
| 22:45 | New Zealand | Current Account | Quarter I | -2.657 | |
| 23:50 | Japan | Trade Balance Total, bln | May | -930 | -970.8 |
| Pare | Closed | Change, % |
|---|---|---|
| AUDUSD | 0.69168 | 1.36 |
| EURJPY | 121.575 | 0.75 |
| EURUSD | 1.1324 | 0.74 |
| GBPJPY | 135.412 | 0.81 |
| GBPUSD | 1.26136 | 0.82 |
| NZDUSD | 0.64727 | 0.63 |
| USDCAD | 1.35581 | -0.29 |
| USDCHF | 0.94894 | -0.37 |
| USDJPY | 107.353 | 0.01 |


© 2000-2026. All rights reserved.
This site is managed by Teletrade D.J. LLC 2351 LLC 2022 (Euro House, Richmond Hill Road, Kingstown, VC0100, St. Vincent and the Grenadines).
The information on this website is for informational purposes only and does not constitute any investment advice.
The company does not serve or provide services to customers who are residents of the US, Canada, Iran, The Democratic People's Republic of Korea, Yemen and FATF blacklisted countries.
Making transactions on financial markets with marginal financial instruments opens up wide possibilities and allows investors who are willing to take risks to earn high profits, carrying a potentially high risk of losses at the same time. Therefore you should responsibly approach the issue of choosing the appropriate investment strategy, taking the available resources into account, before starting trading.
Use of the information: full or partial use of materials from this website must always be referenced to TeleTrade as the source of information. Use of the materials on the Internet must be accompanied by a hyperlink to teletrade.org. Automatic import of materials and information from this website is prohibited.
Please contact our PR department if you have any questions or need assistance at pr@teletrade.global.
transfers