- Analytics
- News and Tools
- Market News
CFD Markets News and Forecasts — 16-06-2021
| Time | Country | Event | Period | Previous value | Forecast |
|---|---|---|---|---|---|
| 00:10 (GMT) | Australia | RBA's Governor Philip Lowe Speaks | |||
| 01:30 (GMT) | Australia | RBA Bulletin | |||
| 01:30 (GMT) | Australia | Changing the number of employed | May | -30.6 | 30 |
| 01:30 (GMT) | Australia | Unemployment rate | May | 5.5% | 5.5% |
| 06:00 (GMT) | Switzerland | Trade Balance | May | 3.3 | |
| 07:30 (GMT) | Switzerland | SNB Interest Rate Decision | -0.75% | -0.75% | |
| 08:00 (GMT) | Eurozone | Eurogroup Meetings | |||
| 08:30 (GMT) | Switzerland | SNB Press Conference | |||
| 09:00 (GMT) | Eurozone | Construction Output, y/y | April | 18.3% | |
| 09:00 (GMT) | Eurozone | Harmonized CPI ex EFAT, Y/Y | May | 0.7% | 0.9% |
| 09:00 (GMT) | Eurozone | Harmonized CPI, Y/Y | May | 1.6% | 2% |
| 09:00 (GMT) | Eurozone | Harmonized CPI | May | 0.6% | 0.3% |
| 12:30 (GMT) | Canada | Foreign Securities Purchases | April | 3.25 | |
| 12:30 (GMT) | U.S. | Continuing Jobless Claims | June | 3499 | 3430 |
| 12:30 (GMT) | U.S. | Initial Jobless Claims | June | 376 | 359 |
| 12:30 (GMT) | U.S. | Philadelphia Fed Manufacturing Survey | June | 31.5 | 31 |
| 14:00 (GMT) | U.S. | Leading Indicators | May | 1.6% | 1.3% |
| 14:00 (GMT) | U.S. | Treasury Secretary Yellen Testimony | |||
| 23:30 (GMT) | Japan | National CPI Ex-Fresh Food, y/y | May | -0.1% | 0.1% |
| 23:30 (GMT) | Japan | National Consumer Price Index, y/y | May | -0.4% |
Экономисты Credit Suisse не ожидают каких-либо существенных изменений в политике по итогам заседания ШНБ. Поскольку они не верят, что ШНБ в настоящее время активен на валютных рынках, и учитывая голубиную позицию ЕЦБ по денежно-кредитной политики, ожидается, что пара EUR/CHF продолжит снижение до уровня 1.0800.
«Мы не ожидаем каких-либо серьезных изменений в текущей позиции ШНБ на завтрашнем заседании. Скорее всего, ШНБ оставит свою основную учетную ставку неизменной и сохранит свою формулировку по поводу валютного курса. Однако, недавний рост депозитов до востребования практически прекратился. Это говорит о том, что Центральный банк на данный момент прекратил интервенции. Однако мы не исключаем возобновления интервенции, если франк значительно и быстро вырастет».
«Мы ожидаем, что ЕЦБ изменит свое определение ценовой стабильности на 2%-ную общую инфляцию с симметричной нетерпимостью к устойчивым отклонениям выше или ниже этой отметки. Учитывая, что базовая инфляция упорно держалась на уровне 1% в течение большей части десятилетия, текущая задача ЕЦБ будет заключаться в обеспечении устойчивого роста инфляции. Это потребует продолжения покупки активов после окончания пандемии».
«Мы по-прежнему считаем, что расхождение в денежно-кредитной политике между еврозоной и Швейцарией должно сказаться на паре EUR/CHF. Следовательно, мы считаем, что пара EUR/CHF продолжит снижаться к нашей цели 1.0800».
Информационно-аналитический отдел TeleTrade
- Thanks to Congress, I believe, we are well on our way towards that goal
- Pandemic was not our only economic problem; long before COVID-19, millions of people in this country were running up against series of long-term, structural economic challenges that undermined their ability to make a good living, including divergence in wages and of geographic regions, decline in labor force participation, rise of climate change, and persistence of racial inequality;
- There are clear reasons why these destructive forces have festered: the private sector does not make enough of types of investments needed to reverse them;
- We need to remedy this lack of investment. We need ambitious fiscal policy to start unwinding these trends
- President’s Budget, which includes both American Jobs and Families Plans, will repair fractured foundations of our economy;
- We need to make these investments at some point, and now is fiscally most strategic time to make them
- We expect cost of federal debt payments will remain well below historical levels through coming decade; we have a window to invest in ourselves
- In fact, this Budget is both fiscally strategic and fiscally responsible
The
U.S. Energy Information Administration (EIA) revealed on Wednesday that crude
inventories tumbled by 7.355 million barrels in the week ended June 11,
following a decline of 5.241 million barrels in the previous week. Economists
had forecast a draw of 3.290 million barrels.
At the same time, gasoline stocks rose by 1.954 million barrels, while analysts had expected a fall of 0.614 million barrels. Distillate stocks dropped by 1.023 million barrels, while analysts had forecast an increase of 0.186 million barrels.
Meanwhile,
oil production in the U.S. grew by 200,000 barrels a day to 11,200 million
barrels a day.
U.S.
crude oil imports averaged 6.7 million barrels per day last week, up by 108,000
barrels per day from the previous week.
FXStreet reports that Lee Sue Ann, Economist at UOB Group, comments on the upcoming BoJ meeting.
“We still keep our view for the BoJ to do more and enhance its monetary policy easing further, most likely through re-accelerating its GB to Japanese corporates and SMEs.”
“Market expectations are now tilted to the BoJ having reached the end of the line on normalization and will remain in a holding pattern on policy until at least April 2023 when Governor Kuroda is scheduled to leave.”
The
Commerce Department reported on Wednesday the housing starts rose by 3.6
percent m-o-m in May to a seasonally adjusted annual pace of 1.572 million, while
building permits fell by 3.0 percent m-o-m to a seasonally adjusted annual rate
of 1.681 (the lowest level since October 2020).
Economists
had forecast housing starts increasing to a pace of 1.630 million units last
month and building permits remaining at a pace of 1.730 million units.
Data
for April was revised to show homebuilding growing to a pace of 1.517 million
units, instead of increasing at a rate of 1.569 million units as previously
reported, and permits advancing to a pace of 1.733 million units, instead of
rising at a rate of 1.730 million units as previously reported.
According
to the report, permits for single-family homes, the largest segment of the
market, decreased 1.6 percent m-o-m in May, while approvals for the
multi-family homes segment plunged 5.8 percent m-o-m.
In the
meantime, groundbreaking on single-family homes increased 4.2 percent m-o-m in May,
while housing starts for the multi-family rose 4.0 percent m-o-m.
U.S. stock-index futures were little changed on Wednesday, as cautiously awaited the announcement of the outcomes of the Federal Reserve's two-day policy meeting later today in the wake of mixed U.S. growth and inflation data.
Global Stocks:
Index/commodity | Last | Today's Change, points | Today's Change, % |
Nikkei | 29,291.01 | -150.29 | -0.51% |
Hang Seng | 28,436.84 | -201.69 | -0.70% |
Shanghai | 3,518.33 | -38.23 | -1.07% |
S&P/ASX | 7,386.20 | +6.70 | +0.09% |
FTSE | 7,174.38 | +1.90 | +0.03% |
CAC | 6,643.52 | +4.00 | +0.06% |
DAX | 15,701.23 | -28.29 | -0.18% |
Crude oil | $72.36 | +0.33% | |
Gold | $1,857.60 | +0.06% |
(company / ticker / price / change ($/%) / volume)
ALCOA INC. | AA | 36.16 | -0.13(-0.36%) | 20148 |
Amazon.com Inc., NASDAQ | AMZN | 3,391.01 | 7.88(0.23%) | 20950 |
American Express Co | AXP | 166.15 | -0.12(-0.07%) | 958 |
Apple Inc. | AAPL | 129.88 | 0.24(0.19%) | 357770 |
AT&T Inc | T | 29.23 | -0.05(-0.17%) | 27257 |
Boeing Co | BA | 246.88 | 0.34(0.14%) | 47515 |
Caterpillar Inc | CAT | 219 | -0.46(-0.21%) | 7428 |
Chevron Corp | CVX | 110.48 | 0.18(0.16%) | 8359 |
Citigroup Inc., NYSE | C | 73.55 | -0.27(-0.37%) | 60686 |
Deere & Company, NYSE | DE | 339.75 | 1.65(0.49%) | 3746 |
Exxon Mobil Corp | XOM | 64.45 | 0.12(0.19%) | 108392 |
Facebook, Inc. | FB | 337.25 | 0.50(0.15%) | 29478 |
FedEx Corporation, NYSE | FDX | 299.99 | 0.69(0.23%) | 1335 |
Ford Motor Co. | F | 14.97 | -0.03(-0.20%) | 283352 |
Freeport-McMoRan Copper & Gold Inc., NYSE | FCX | 37.34 | -0.26(-0.69%) | 121540 |
General Electric Co | GE | 13.53 | -0.01(-0.07%) | 72141 |
General Motors Company, NYSE | GM | 61.02 | 0.21(0.35%) | 52468 |
Goldman Sachs | GS | 371 | -0.30(-0.08%) | 2956 |
Google Inc. | GOOG | 2,524.75 | 4.09(0.16%) | 2014 |
Hewlett-Packard Co. | HPQ | 29.62 | 0.03(0.10%) | 3512 |
Home Depot Inc | HD | 305.63 | -0.82(-0.27%) | 808 |
Intel Corp | INTC | 58.1 | 0.11(0.19%) | 37475 |
International Business Machines Co... | IBM | 149.35 | -0.01(-0.01%) | 1663 |
Johnson & Johnson | JNJ | 164.25 | -0.24(-0.15%) | 27185 |
JPMorgan Chase and Co | JPM | 154.77 | -0.41(-0.26%) | 40245 |
McDonald's Corp | MCD | 236.94 | 0.59(0.25%) | 425 |
Merck & Co Inc | MRK | 75.55 | -0.15(-0.20%) | 5963 |
Microsoft Corp | MSFT | 258.4 | 0.04(0.02%) | 35431 |
Nike | NKE | 130.13 | -0.16(-0.12%) | 8284 |
Pfizer Inc | PFE | 39.44 | -0.15(-0.38%) | 86654 |
Procter & Gamble Co | PG | 134.31 | -0.34(-0.25%) | 704 |
Tesla Motors, Inc., NASDAQ | TSLA | 597.5 | -1.86(-0.31%) | 124623 |
The Coca-Cola Co | KO | 55.42 | 0.01(0.02%) | 15780 |
Twitter, Inc., NYSE | TWTR | 59.99 | -0.24(-0.40%) | 18740 |
Verizon Communications Inc | VZ | 57.25 | -0.04(-0.07%) | 6242 |
Visa | V | 233.2 | 0.22(0.09%) | 5162 |
Walt Disney Co | DIS | 175.9 | 0.04(0.02%) | 11214 |
Yandex N.V., NASDAQ | YNDX | 69.02 | 0.93(1.37%) | 3538 |
The
Labor Department reported on Wednesday the import-price index, measuring the
cost of goods ranging from Canadian oil to Chinese electronics, went up 1.1
percent m-o-m in May, following a revised 0.8 percent m-o-m gain in April
(originally a 0.7 percent m-o-m advance). Prices for U.S. imports have not
recorded a decline since October 2020. Economists had expected prices
to grow 0.8 percent m-o-m last month.
According
to the report, the May gain was driven by higher prices for both fuel (+4.0
percent m-o-m) and nonfuel (+0.9 percent m-o-m) imports.
Over
the 12-month period ended in May, import prices climbed 11.3 percent, with
higher fuel (+109.6 percent) and nonfuel (+6.0 percent; the largest 12-month
gain since September 2008) prices contributing to the jump. This was the
largest over-the-year increase since the year ended September 2011.
Meanwhile,
the price index for U.S. exports rose 2.2 percent m-o-m in May, following a
revised 1.1 percent m-o-m increase in the previous month (originally a 0.8
percent m-o-m growth). U.S. export prices have not recorded a monthly decrease
since April 2020. Economists had forecast export prices to rise 0.8 percent
m-o-m in May.
The May
rise was driven by higher prices for both agricultural exports (+6.1 percent
m-o-m; the largest one-month advance since November 2010) and nonagricultural
exports (+1.7 percent m-o-m).
Over
the past 12 months, the price index for exports surged 17.4 percent, reflecting
surges in prices of both agricultural exports (+33.6 percent; the largest
over-the-year rise since April 2011) and nonagricultural exports (+15.7
percent; the largest over-the-year advance since the index was first published
in March
1985).
This represented the largest over-the-year gain since the index was first
published in September 1983.
Statistics
Canada reported on Wednesday the country’s consumer price index (CPI) rose 0.5
percent m-o-m in May, the same pace as in the previous four months.
On
the y-o-y basis, Canada’s inflation rate surged 3.6 percent last month after
jumping 3.4 percent in April. This was the largest yearly gain since May 2011.
Economists
had predicted inflation would increase 0.4 percent m-o-m and 3.5 percent y-o-y
in May.
According to the report, prices rose in every major component on a year-over-year basis, led by shelter (+4.2 percent) and transportation (+7.6 percent).
Meanwhile,
the closely watched the Bank of Canada's core index jumped 2.8 percent y-o-y in
May, following a 2.3 percent y-o-y increase in April. This was the highest rate
since March 2003. Economists had forecast a gain
of 2.4 percent y-o-y.
- Recovery may be bumpy and uneven, the viability of some firms will be tested by necessary tapering of government supports
| Time | Country | Event | Period | Previous value | Forecast | Actual |
|---|---|---|---|---|---|---|
| 06:00 | United Kingdom | Producer Price Index - Input (YoY) | May | 10.0% | 10.6% | 10.7% |
| 06:00 | United Kingdom | Producer Price Index - Input (MoM) | May | 1.2% | 1.1% | 1.1% |
| 06:00 | United Kingdom | Producer Price Index - Output (MoM) | May | 0.4% | 0.4% | 0.5% |
| 06:00 | United Kingdom | Producer Price Index - Output (YoY) | May | 4.0% | 4.5% | 4.6% |
| 06:00 | United Kingdom | Retail Price Index, m/m | May | 1.4% | 0.3% | 0.3% |
| 06:00 | United Kingdom | HICP ex EFAT, Y/Y | May | 1.3% | 2% | |
| 06:00 | United Kingdom | Retail prices, Y/Y | May | 2.9% | 3.3% | 3.3% |
| 06:00 | United Kingdom | HICP, Y/Y | May | 1.5% | 1.8% | 2.1% |
| 06:00 | United Kingdom | HICP, m/m | May | 0.6% | 0.3% | 0.6% |
| 07:00 | China | Fixed Asset Investment | May | 19.9% | 16.9% | 15.4% |
| 07:00 | China | Retail Sales y/y | May | 17.7% | 13.6% | 12.4% |
| 07:00 | China | Industrial Production y/y | May | 9.8% | 9% | 8.8% |
USD was mixed against its major counterparts in the European session on Wednesday, as investors awaited the announcement of the U.S. Federal Reserve's policy decision later today. It rose against CHF, fell against JPY, GBP, AUD and NZD, and changed little against EUR and CAD.
The U.S. Dollar Index (DXY), measuring the U.S. currency's value relative to a basket of foreign currencies, edged down 0.01% to 90.53.
The outcomes of the meeting will be announced today at 18:00 GMT, and the Fed's Chairman Jerome Powell will follow with a press conference a half-hour later.
While the U.S. central bank isn't expected to make any changes in its ultra-low interest rates or begin trimming its $120 billion in monthly asset purchases at its June meeting, market participants will be monitoring the Fed’s updated policy statement and Powell’s comments closely for the forecasts on the U.S. inflation pressures, the strength of the economic recovery and any clues on when it might begin pulling back on monetary stimulus. Economists suggest that the Fed might acknowledge the first conversations among its policymakers about a reduction of its bond-buying program, but a tapering strategy is likely to be announced formally in August or September.
FXStreet notes that USD/CAD has continued higher after its recent break above 1.2145. Analysts at Credit Suisse look for a slightly deeper correction going into the FOMC, with resistance at 1.2203/05, then 1.2253/70, where the pair is set to find a solid cap.
“We look for a break above 1.2203/05 and a move to 1.2253/70, which includes the important 55-day average, the 38.2% retracement of the fall from April and the ‘measured base objective’. We would look for a cap here post the FOMC and then for the medium-term downtrend to reassert itself.”
“Near-term support moves to 1.2129/27. In contrast, a break below 1.2058/56 would quickly turn our bias back lower and negate the base, with a direct close below 1.2012/00 reasserting the broader downtrend."
The
Mortgage Bankers Association (MBA) reported on Wednesday the mortgage
application volume in the U.S. climbed 4.2 percent in the week ended June 11,
following a 3.1 percent fall in the previous week. This marked the first weekly
gain in total mortgage application volume since the week ended 14.
According
to the report, refinance applications surged 5.5 percent, while applications to
purchase a home rose 1.1 percent.
Meanwhile,
the average fixed 30-year mortgage rate decreased from 3.15 percent to 3.11 percent,
the lowest in five weeks.
“Treasury
yields have slid because of the uncertainty in the financial markets regarding
inflation and how the Federal Reserve may act over the next few months,” noted
Joel Kan, MBA’s associate vice president of economic and industry forecasting.
FXStreet reports that FX Strategists at UOB Group suggest that the upward bias in USD/CNH could push it to another test of 6.4400 in the next weeks.
24-hour view: “While our view for consolidation was not wrong, USD traded within a much narrower range than expected (6.4005/6.4100). The 95 pips range is the smallest 1-day range in about 9 months. The muted price actions offer no fresh clues and USD could continue to consolidate, albeit likely within a broader range of 6.3970/6.4170.”
Next 1-3 weeks: “Our narrative from yesterday (15 Jun, spot at 6.4090) still stands. As highlighted, USD “is expected to trade with an upward bias towards 6.4400. The upward bias is deemed intact as long as USD does not move below 6.3900 (‘strong support’ level was at 6.3830 yesterday).”
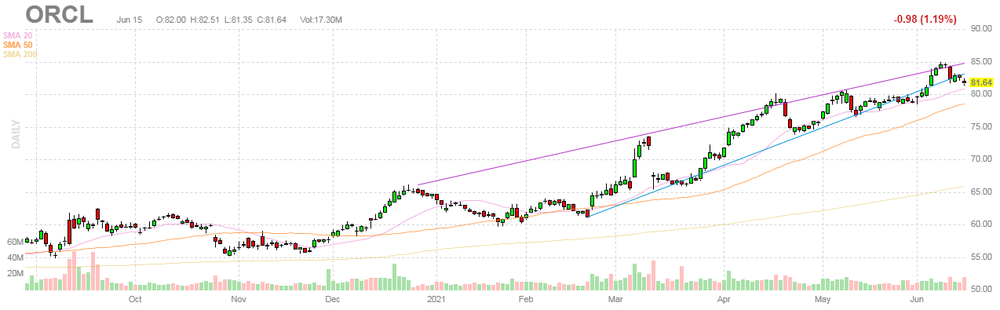
Oracle (ORCL) reported Q4 FY 2021 earnings of $1.54 per share (versus $1.20 per share in Q4 FY 2020), beating analysts’ consensus estimate of $1.33 per share.
The company’s quarterly revenues amounted to $11.227 bln (+7.5% y/y), beating analysts’ consensus estimate of $11.036 bln.
The company also issued guidance for Q1 FY 2022, projecting EPS of $0.94-0.98 versus analysts’ consensus estimate of $1.03 and revenues growing +3-5% y/y, which we compute as $9.65-9.84 bln versus analysts’ consensus estimate of $9.68 bln.
ORCL fell to $78.00 (-4.46%) in pre-market trading.
FXStreet reports that economists at Credit Suisse note that EUR/USD is seen at risk to a test of its 55-day average at 1.2080 – potentially price/retracement support at 1.2053/51 – but with this ideally holding.
“The immediate risk stays seen mildly lower going into the Fed for a test of the rising 55-day average, now at 1.2080. With the mid-May low and 38.2% retracement of the rally from late March not far below at 1.2053/51 our bias remains to then look for a floor here post the Fed. A break though would expose the 200 - day average and May low at 1.1996/86.”
“Failure to hold the 1.1996/86 support on a closing basis would reinforce the broader sideways range that has been in place all year, opening the door to further weakness to 1.1942 next, then 1.1928/18.”
- Policy should normalize gradually, with prudence
- There is light at end of tunnel
FXStreet reports that economists at Credit Suisse discuss gold prospects.
“Gold approaches the FOMC still above its 200-day average, now at $1840. We stay biased higher and look for this to continue to hold for a move to resistance seen at the high for the year, November 2020 high and potential trend resistance at $1941/66.”
“Whilst we would expect $1943/66 to cap again for now to maintain the broader consolidation range, an eventual break should open the door to a move back to the $2075 record high.”
FXStreet reports that according to economists at Charles Schwab, Europe is poised to outperform, as the new economic cycle has seen stock market leadership pass from the US to Europe.
“European countries are only now starting to ease their restrictions on economic activity just as Europe’s largest-ever stimulus plan is about to be deployed. This suggests eurozone growth still has some way to go before peaking, and that eurozone stocks likely can still deliver further gains after outperforming in the first half of the year.”
“Continued solid growth combined with signs that inflationary pressure may be transitory could ease concerns that central banks will tighten policy prematurely, a fear that weighed on emerging market stocks in the first half of the year.”
“Among the risks to economic expansion is the prevalence of COVID-19 variants, and potential for antibodies to wane over time, which could lead to waves of infection in the late fall/winter.”
According to the report from Eurostat, in the first quarter of 2021, the hourly labour costs rose by 1.5% in the euro area and by 1.7% in the EU, compared with the same quarter of the previous year. In the fourth quarter of 2020, hourly labour costs increased by 2.8% and 3.2% respectively.
The two main components of labour costs are wages & salaries and non-wage costs. In the euro area, the costs of wages & salaries per hour worked grew by 2.2%, while the non-wage component dropped by 0.9% in the first quarter of 2021, compared with the same quarter of the previous year. In the fourth quarter of 2020, the annual changes were +3.5% for wages & salaries and +0.8% for the non-wage component. In the EU, the costs of hourly wages & salaries increased by 2.6% and the non-wage component decreased by 1.0% in the first quarter of 2021. In the fourth quarter of 2020, the annual change in wages & salaries was +3.8% and for the non-wage component +1.1%.
In both the EU and the euro area, the non-wage component moderated the growth in hourly labour costs, in particular due to the tax reliefs and subsidies granted by EU governments to support enterprises affected by the crisis.
FXStreet reports that economists at Credit Suisse do not expect any significant policy changes from the SNB meeting.
“We do not expect any major changes to the current SNB’s stance at tomorrow’s meeting. Most likely, the SNB will leave its main policy rate unchanged and will keep its FX language intact as well. We note, though, that the recent increase in sight deposits has almost come to a halt. This would suggest that the central bank has stopped intervening for the time being. However, we would not rule out renewed intervention should the franc appreciate significantly and in a speedy fashion.”
“We continue to believe that the divergent monetary policy stance between the Eurozone and Switzerland should weigh on EUR/CHF. Consequently, we believe that EUR/CHF will continue to grind lower towards our 1.0800 target.”
According to the report from Office for National Statistics, UK average house prices increased by 8.9% over the year to April 2021, down from 9.9% in March 2021.
The average UK house price was £251,000 in April 2021; this is £20,000 higher than in April 2020.
On a non-seasonally adjusted basis, average house prices in the UK decreased by 1.9% between March and April 2021, compared with a decrease of 1.0% in the same period a year ago.
On a seasonally adjusted basis, average house prices in the UK decreased by 2.2% between March and April 2021 following an increase of 2.0% in the previous month.
Average house prices increased over the year in England to £268,000 (8.9%), in Wales to £185,000 (15.6%), in Scotland to £161,000 (6.3%) and in Northern Ireland to £149,000 (6.0%). London continues to be the region with the lowest annual growth (3.3%) for the fifth consecutive month.
Reuters reports that data from the National Bureau of Statistics showed that real estate investment in China rose at a slower pace in May, as more smaller towns joined bigger cities in trying to curb red-hot housing prices.
Real estate investment in May rose 9.8% from a year earlier, slowing from 13.7% seen in April.
For January-May, property investment grew 18.3% from the same period last year, slower than a 21.6% increase in January-April.
With China's economy rebounding from last year's coronavirus-induced slump, authorities have stepped up efforts to rein in home price rises this year to curb speculative activity and prevent an asset bubble.
Property sales by floor area rose 9.2% in May from a year earlier, slower than 19.2% growth in April, Reuters calculations showed.
New construction starts, measured by floor area, fell 6.1% in May, narrowing from the 9.3% decline in April.
Funds raised by China's property developers grew 29.9% on the year, down from growth of 35.2% in the first four months.
FXStreet reports that analysts at Natixis discuss EUR/USD prospects.
“We have the following configuration: A rapid deterioration in US foreign trade due to the strong stimulation of domestic demand through expansionary fiscal and monetary policies. A faster return to full employment than in the eurozone. The cyclical recovery is taking place faster in the US than in the euro zone following the COVID-19 crisis: this means that the US will return to full employment faster than the eurozone. We should therefore expect the expansionary monetary policies to end earlier in the US than in the eurozone.”
“If tapering takes place from spring 2022 in the US and from the end of 2022 in the eurozone, there will be a gap between the two countries' monetary policies during 2022, with a more expansionary monetary policy in the eurozone. We should therefore expect: A long-term trend depreciation of the dollar; Interrupted in 2022 by the monetary policy gap between the US and the eurozone, as monetary policy will temporarily be more expansionary in the eurozone.”
Reuters reports that growth in China's factory output slowed for a third straight month in May, possibly due to disruptions caused by COVID-19 outbreaks in the country's southern export powerhouse of Guangdong.
Industrial production grew 8.8% in May from a year ago, slower than the 9.8% uptick in April, National Bureau of Statistics data showed. That missed a 9.0% on-year rise forecast.
Most China watchers had expected some moderation in May output due to softer export orders, higher cost pressures for factories and tighter environmental restrictions on heavy industry. But they said underlying activity still appears solid, even if headline growth figures are heavily distorted by comparisons to the pandemic plunge early last year.
Retail sales rose 12.4% year-on-year in May, weaker than 13.6% growth expected by analysts and down from the 17.7% jump seen in April. Chinese consumer and business confidence has been picking up thanks to pent-up demand and quickening vaccine rollouts, which are also reviving domestic tourism.
Fixed asset investment increased 15.4% in the first five months from the same period a year earlier, versus a forecast 16.9% rise, slowing from January-April's 19.9% increase.
| Time | Country | Event | Period | Previous value | Forecast | Actual |
|---|---|---|---|---|---|---|
| 01:00 | Australia | Leading Index | May | 0.19% | -0.06% | |
| 06:00 | United Kingdom | Producer Price Index - Input (YoY) | May | 10.0% | 10.6% | 10.7% |
| 06:00 | United Kingdom | Producer Price Index - Input (MoM) | May | 1.2% | 1.1% | 1.1% |
| 06:00 | United Kingdom | Producer Price Index - Output (MoM) | May | 0.4% | 0.4% | 0.5% |
| 06:00 | United Kingdom | Producer Price Index - Output (YoY) | May | 4.0% | 4.5% | 4.6% |
| 06:00 | United Kingdom | Retail Price Index, m/m | May | 1.4% | 0.3% | 0.3% |
| 06:00 | United Kingdom | HICP ex EFAT, Y/Y | May | 1.3% | 2% | |
| 06:00 | United Kingdom | Retail prices, Y/Y | May | 2.9% | 3.3% | 3.3% |
| 06:00 | United Kingdom | HICP, Y/Y | May | 1.5% | 1.8% | 2.1% |
| 06:00 | United Kingdom | HICP, m/m | May | 0.6% | 0.3% | 0.6% |
| 07:00 | China | Fixed Asset Investment | May | 19.9% | 16.9% | 15.4% |
| 07:00 | China | Retail Sales y/y | May | 17.7% | 13.6% | 12.4% |
| 07:00 | China | Industrial Production y/y | May | 9.8% | 9% | 8.8% |
During today's Asian trading, the US dollar consolidated against the euro, but fell against the pound, yen, and australian dollar.
Investors are waiting for the end of the two-day meeting of the US Federal Reserve (Fed).The Fed's meeting comes amid growing evidence of increased price pressures in the economy as it recovers from last year's downturn due to the COVID-19 pandemic.
In general, experts are inclined to believe that the Federal Reserve is unlikely to give signals about plans to gradually reduce the volume of bond purchases earlier than in August-September of this year. At the same time, some analysts are betting that the Fed can begin reducing the asset purchase program from the current $120 billion per month by the end of 2021.
The dot plot - a chart that reflects the individual expectations of the Fed's board of governors and the heads of the Federal Reserve banks regarding interest rates - can show that all 18 Fed managers expect at least one rate hike in 2023.
Meanwhile, the international rating agency Fitch Ratings has improved its forecast for global GDP growth for 2021 due to incoming macroeconomic data, faster opening of the service sector in the United States and Europe, as well as measures of support from the authorities.
The pound rose by 0.25% against the US dollar on the back of data on the UK. Consumer prices in the UK rose by 2.1% in May compared to the same month last year, according to data from the Office for National Statistics (ONS). Thus, inflation accelerated compared to April's 1.5%. Analysts had expected an increase to 1.8%.
The ICE index, which tracks the dollar's performance against six currencies (euro, swiss franc, yen, canadian dollar, pound sterling and swedish krona), fell 0.07%.
EUR/USD
Resistance levels (open interest**, contracts)
$1.2212 (1037)
$1.2190 (393)
$1.2174 (118)
Price at time of writing this review: $1.2130
Support levels (open interest**, contracts):
$1.2084 (2995)
$1.2056 (1084)
$1.2022 (2103)
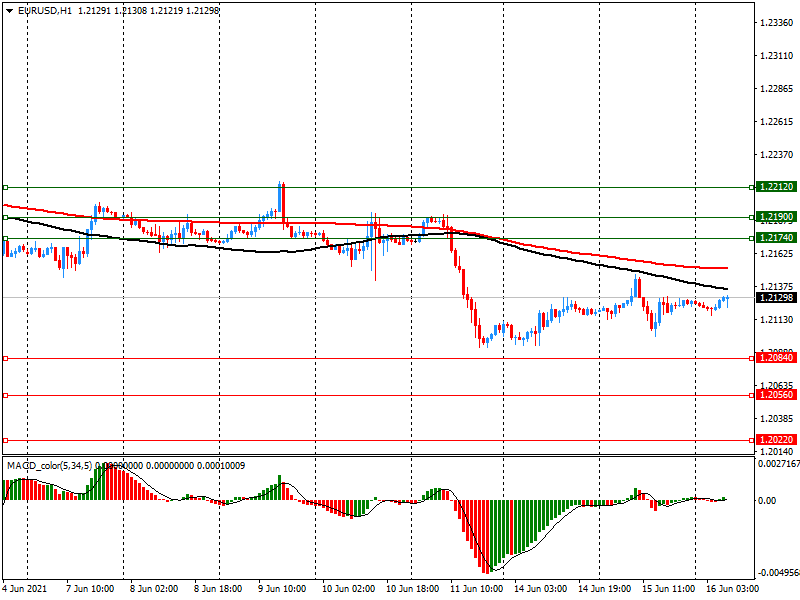
Comments:
- Overall open interest on the CALL options and PUT options with the expiration date June, 15 is 44062 contracts (according to data from July, 9) with the maximum number of contracts with strike price $1,1650 (3885);
GBP/USD
$1.4208 (405)
$1.4180 (306)
$1.4137 (141)
Price at time of writing this review: $1.4105
Support levels (open interest**, contracts):
$1.4025 (297)
$1.4003 (670)
$1.3977 (368)
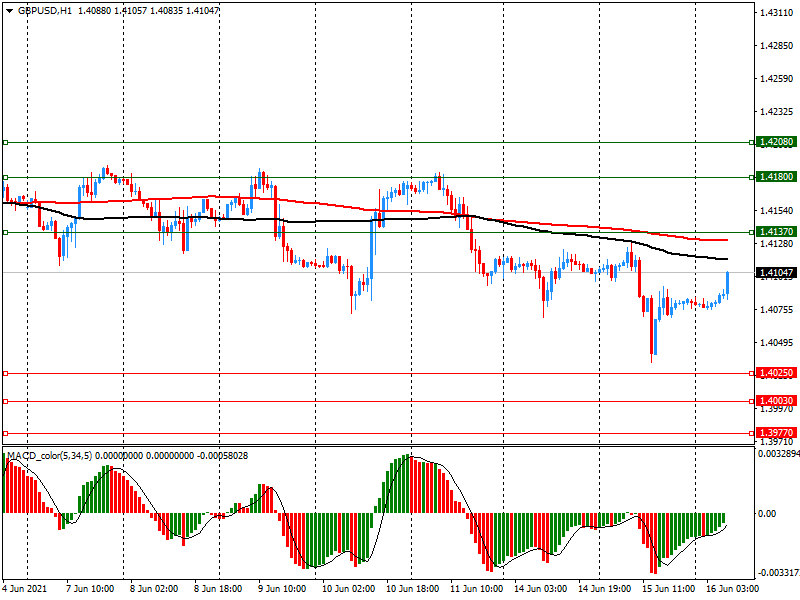
Comments:
- Overall open interest on the CALL options with the expiration date July, 9 is 113038 contracts, with the maximum number of contracts with strike price $1,4500 (3531);
- Overall open interest on the PUT options with the expiration date July, 9 is 14706 contracts, with the maximum number of contracts with strike price $1,4000 (2983);
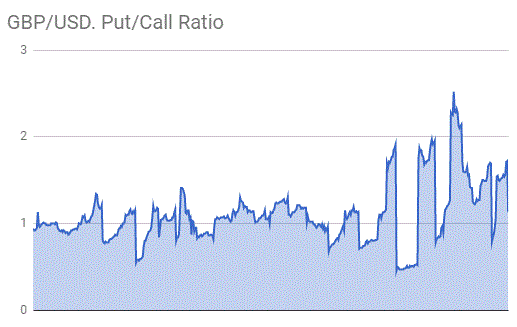
- The ratio of PUT/CALL was 1.13 versus 1.12 from the previous trading day according to data from June, 15
* - The Chicago Mercantile Exchange bulletin (CME) is used for the calculation.
** - Open interest takes into account the total number of option contracts that are open at the moment.
Reuters reports that as part of a policy review in March, the BOJ created a scheme that seeks to mitigate the side-effects of negative rates in the hope of convincing markets the central bank will cut rates if necessary to support the economy.
But the head of Japan's regional bank lobby on Wednesday urged the central bank to be cautious about deepening negative interest rates due to the "very big" impact it would have on lenders' earnings.
"Even after the creation of this new scheme, I hope the BOJ takes a cautious stance about deepening negative rates," Hisashi Shibata, head of the lobby, said.
The Office for National Statistics said that the Consumer Prices Index (CPI) rose by 2.1% in the 12 months to May 2021, up from 1.5% to April. Economists had expected a 1.8% increase. On a monthly basis, CPI rose by 0.6% in May 2021, compared with little change in May 2020. Economists had expected a 0.3% increase.
The Consumer Prices Index including owner occupiers’ housing costs (CPIH) rose by 2.1% in the 12 months to May 2021, up from 1.6% to April.
The largest upward contribution to the CPIH 12-month inflation rate came from transport (0.72 percentage points).
On a monthly basis, CPIH rose by 0.5% in May 2021, compared with little change in May 2020.
Rising prices for clothing, motor fuel, recreational goods (particularly games and recording media), and meals and drinks consumed out resulted in the largest upward contributions to the change in the CPIH 12-month inflation rate between April and May 2021.
These were partially offset by a large downward contribution from food and non-alcoholic beverages, where prices fell this year but rose a year ago, particularly for bread and cereals.
As a result of the easing of coronavirus (COVID-19) restrictions, the number of CPIH items identified as unavailable in May 2021 fell to 27, accounting for 3.1% of the basket by weight; we collected a weighted total of 77.7% of the comparable coverage collected before the first lockdown (excluding unavailable items).
| Raw materials | Closed | Change, % |
|---|---|---|
| Brent | 74.28 | 1.54 |
| Silver | 27.63 | -0.78 |
| Gold | 1858.657 | -0.4 |
| Palladium | 2758.94 | 0.38 |
| Time | Country | Event | Period | Previous value | Forecast |
|---|---|---|---|---|---|
| 01:00 (GMT) | Australia | Leading Index | May | 0.2% | |
| 06:00 (GMT) | United Kingdom | Producer Price Index - Input (YoY) | May | 9.9% | 10.6% |
| 06:00 (GMT) | United Kingdom | Producer Price Index - Input (MoM) | May | 1.2% | 1.1% |
| 06:00 (GMT) | United Kingdom | Producer Price Index - Output (MoM) | May | 0.4% | 0.4% |
| 06:00 (GMT) | United Kingdom | Producer Price Index - Output (YoY) | May | 3.9% | 4.5% |
| 06:00 (GMT) | United Kingdom | Retail Price Index, m/m | May | 1.4% | 0.3% |
| 06:00 (GMT) | United Kingdom | HICP ex EFAT, Y/Y | May | 1.3% | |
| 06:00 (GMT) | United Kingdom | Retail prices, Y/Y | May | 2.9% | 3.3% |
| 06:00 (GMT) | United Kingdom | HICP, Y/Y | May | 1.5% | 1.8% |
| 06:00 (GMT) | United Kingdom | HICP, m/m | May | 0.6% | 0.3% |
| 07:00 (GMT) | China | Fixed Asset Investment | May | 19.9% | 16.9% |
| 07:00 (GMT) | China | Retail Sales y/y | May | 17.7% | 13.6% |
| 07:00 (GMT) | China | Industrial Production y/y | May | 9.8% | 9% |
| 12:30 (GMT) | U.S. | Building Permits | May | 1.73 | 1.73 |
| 12:30 (GMT) | U.S. | Housing Starts | May | 1.569 | 1.63 |
| 12:30 (GMT) | U.S. | Import Price Index | May | 0.7% | 0.7% |
| 12:30 (GMT) | Canada | Bank of Canada Consumer Price Index Core, y/y | May | 2.3% | 2.4% |
| 12:30 (GMT) | Canada | Consumer price index, y/y | May | 3.4% | 3.5% |
| 12:30 (GMT) | Canada | Consumer Price Index m / m | May | 0.5% | 0.4% |
| 14:30 (GMT) | U.S. | Crude Oil Inventories | June | -5.241 | -3 |
| 18:00 (GMT) | U.S. | FOMC Economic Projections | |||
| 18:00 (GMT) | U.S. | Fed Interest Rate Decision | 0.25% | 0.25% | |
| 18:30 (GMT) | U.S. | Federal Reserve Press Conference | |||
| 22:45 (GMT) | New Zealand | GDP q/q | Quarter I | -1% | 0.5% |
| 22:45 (GMT) | New Zealand | GDP y/y | Quarter I | -0.9% | 0.9% |
| Pare | Closed | Change, % |
|---|---|---|
| AUDUSD | 0.7687 | -0.32 |
| EURJPY | 133.452 | 0.05 |
| EURUSD | 1.21263 | 0.06 |
| GBPJPY | 154.944 | -0.2 |
| GBPUSD | 1.40811 | -0.18 |
| NZDUSD | 0.71229 | -0.25 |
| USDCAD | 1.21823 | 0.33 |
| USDCHF | 0.89795 | -0.14 |
| USDJPY | 110.035 | -0.02 |


© 2000-2026. All rights reserved.
This site is managed by Teletrade D.J. LLC 2351 LLC 2022 (Euro House, Richmond Hill Road, Kingstown, VC0100, St. Vincent and the Grenadines).
The information on this website is for informational purposes only and does not constitute any investment advice.
The company does not serve or provide services to customers who are residents of the US, Canada, Iran, The Democratic People's Republic of Korea, Yemen and FATF blacklisted countries.
Making transactions on financial markets with marginal financial instruments opens up wide possibilities and allows investors who are willing to take risks to earn high profits, carrying a potentially high risk of losses at the same time. Therefore you should responsibly approach the issue of choosing the appropriate investment strategy, taking the available resources into account, before starting trading.
Use of the information: full or partial use of materials from this website must always be referenced to TeleTrade as the source of information. Use of the materials on the Internet must be accompanied by a hyperlink to teletrade.org. Automatic import of materials and information from this website is prohibited.
Please contact our PR department if you have any questions or need assistance at pr@teletrade.global.
transfers