- Analytics
- News and Tools
- Market News
CFD Markets News and Forecasts — 17-06-2021
| Time | Country | Event | Period | Previous value | Forecast |
|---|---|---|---|---|---|
| 03:00 (GMT) | Japan | BoJ Interest Rate Decision | -0.1% | -0.1% | |
| 06:00 (GMT) | Germany | Producer Price Index (MoM) | May | 0.8% | 0.7% |
| 06:00 (GMT) | Germany | Producer Price Index (YoY) | May | 5.2% | 6.4% |
| 06:00 (GMT) | United Kingdom | Retail Sales (MoM) | May | 9.2% | 1.6% |
| 06:00 (GMT) | United Kingdom | Retail Sales (YoY) | May | 42.4% | 29% |
| 08:00 (GMT) | Eurozone | Current account, unadjusted, bln | April | 31 | |
| 17:00 (GMT) | U.S. | Baker Hughes Oil Rig Count | June | 365 |
FXStreet reports that economist Lee Sue Ann at UOB Group offers her view on the PBoC's interest rate decision next week.
“The PBoC said there should be 'no sudden U-turn' of policy operations.”
“While loans growth is set to moderate this year, we continue to expect the benchmark 1Y loan prime rate (LPR) to stay flat at 3.85% for the rest of 2021.”
eFXdata reports that analysts at Citi see scope for an extension in the ongoing USD rally.
"We calculate USD positioning to be quite neutral at these levels. As such, we think that as fresh positions are added, this USD squeeze can continue in the near term and would not stand in the way of it."
"USD/JPY tends to be the most reactive to moves in fixed income; but right here we think selling EUR/USD on top of buying USD/JPY makes sense, as the shift by the Fed may elicit a more risk-off tone in markets this week."
The
Conference Board announced on Thursday its Leading Economic Index (LEI) for the
U.S. rose 1.3 percent m-o-m in May to 114.5 (2016 = 100), following a revised 1.3
percent m-o-m gain in April (originally a 1.6 percent m-o-m jump).
Economists
had forecast an increase of 1.3 percent m-o-m.
“After
another large improvement in May, the U.S. LEI now stands above its previous
peak reached in January 2020 (112.0), suggesting that strong economic growth
will continue in the near term,” noted Ataman Ozyildirim, Senior Director of
Economic Research at The Conference Board. “Strengths among the leading
indicators were widespread, with initial claims for unemployment insurance
making the largest positive contribution to the index; housing permits made
this month’s only negative contribution. The Conference Board now forecasts
real GDP growth in Q2 could reach 9 percent (annualized), with year-over-year
economic growth reaching 6.6 percent for 2021.”
The
report also revealed the Conference Board Coincident Economic Index (CEI) for
the U.S. went up 0.4 percent m-o-m in May to 105.1, following a 0.3 percent
m-o-m gain in April. Meanwhile, its Lagging Economic Index (LAG) for the U.S. fell
2.2 percent m-o-m in May to 103.0, following a 3.0 percent advance in April.
The
Manufacturing Business Outlook Survey, released by the Federal Reserve Bank of
Philadelphia on Thursday, revealed the region's manufacturing activity
continued to expand in early June, albeit at a slower pace than in May.
According
to the survey, the diffusion index for current general activity fell from 31.5 in May to 30.7 this month. This was the lowest
reading since February.
Economists
had forecast the index to slip to 31.0.
A
reading above 0 signals expansion, while a reading below 0 indicates
contraction.
According to the report, the new orders index dropped 10.3 points to 22.2 this month, while the current shipments index rose 6.2 points to 27.2 and the current employment index surged 11.4 points to 30.7. On the price front, the prices paid diffusion index went up 3.9 points to 80.7, reaching its highest level since June 1979, while the current prices received index moved up 8.7 points to 49.7, its highest since October 1980.
U.S. stock-index futures fell on Thursday, as investors continued to digest the FOMC's latest policy statement and its updated forecasts for еру U.S. interest rates. A disappointing jobless claims report was also in focus.
Global Stocks:
Index/commodity | Last | Today's Change, points | Today's Change, % |
Nikkei | 29,018.33 | -272.68 | -0.93% |
Hang Seng | 28,558.59 | +121.75 | +0.43% |
Shanghai | 3,525.60 | +7.28 | +0.21% |
S&P/ASX | 7,359.00 | -27.20 | -0.37% |
FTSE | 7,146.26 | -38.69 | -0.54% |
CAC | 6,649.64 | -3.01 | -0.05% |
DAX | 15,714.91 | +4.34 | +0.03% |
Crude oil | $72.05 | -0.14% | |
Gold | $1,787.10 | -4.02% |
(company / ticker / price / change ($/%) / volume)
ALCOA INC. | AA | 34.84 | -0.52(-1.47%) | 29315 |
ALTRIA GROUP INC. | MO | 47.32 | -0.05(-0.11%) | 35331 |
Amazon.com Inc., NASDAQ | AMZN | 3,399.00 | -16.25(-0.48%) | 20616 |
American Express Co | AXP | 164.7 | 0.02(0.01%) | 1813 |
AMERICAN INTERNATIONAL GROUP | AIG | 51.86 | 0.18(0.35%) | 4780 |
Apple Inc. | AAPL | 129.61 | -0.54(-0.41%) | 667059 |
AT&T Inc | T | 29.07 | 0.01(0.03%) | 131375 |
Boeing Co | BA | 241.41 | -0.86(-0.36%) | 70609 |
Caterpillar Inc | CAT | 216.5 | -0.66(-0.30%) | 5943 |
Chevron Corp | CVX | 109.17 | -0.50(-0.46%) | 8346 |
Cisco Systems Inc | CSCO | 53.25 | -0.22(-0.41%) | 12726 |
Citigroup Inc., NYSE | C | 72.1 | 0.64(0.90%) | 124165 |
Deere & Company, NYSE | DE | 335.8 | -0.76(-0.23%) | 1605 |
Exxon Mobil Corp | XOM | 63.75 | -0.35(-0.55%) | 88764 |
Facebook, Inc. | FB | 329.5 | -1.58(-0.48%) | 59161 |
FedEx Corporation, NYSE | FDX | 294.98 | 0.30(0.10%) | 2153 |
Ford Motor Co. | F | 15.41 | 0.39(2.60%) | 3938077 |
Freeport-McMoRan Copper & Gold Inc., NYSE | FCX | 36.12 | -0.94(-2.54%) | 171265 |
General Electric Co | GE | 13.4 | -0.04(-0.30%) | 105422 |
General Motors Company, NYSE | GM | 61.98 | 0.22(0.36%) | 138022 |
Goldman Sachs | GS | 373.2 | 2.20(0.59%) | 13659 |
Hewlett-Packard Co. | HPQ | 29.07 | 0.04(0.14%) | 6204 |
Home Depot Inc | HD | 302.88 | 0.10(0.03%) | 5902 |
HONEYWELL INTERNATIONAL INC. | HON | 218.1 | -0.89(-0.41%) | 1773 |
Intel Corp | INTC | 56.87 | -0.35(-0.61%) | 83269 |
International Business Machines Co... | IBM | 147.32 | -0.51(-0.35%) | 3538 |
Johnson & Johnson | JNJ | 163.5 | -0.93(-0.57%) | 3152 |
JPMorgan Chase and Co | JPM | 157.18 | 0.91(0.58%) | 71431 |
McDonald's Corp | MCD | 234.98 | -0.60(-0.25%) | 2450 |
Merck & Co Inc | MRK | 76.27 | -0.34(-0.44%) | 7837 |
Microsoft Corp | MSFT | 256.39 | -0.99(-0.38%) | 94416 |
Nike | NKE | 129.45 | -0.95(-0.73%) | 32173 |
Pfizer Inc | PFE | 39.2 | -0.10(-0.25%) | 57243 |
Procter & Gamble Co | PG | 132.5 | -0.28(-0.21%) | 5446 |
Starbucks Corporation, NASDAQ | SBUX | 111 | -0.36(-0.32%) | 4037 |
Tesla Motors, Inc., NASDAQ | TSLA | 600.3 | -4.57(-0.76%) | 134950 |
The Coca-Cola Co | KO | 54.59 | -0.08(-0.15%) | 46298 |
Travelers Companies Inc | TRV | 152.4 | -0.39(-0.26%) | 1228 |
Twitter, Inc., NYSE | TWTR | 59.62 | -0.31(-0.52%) | 49084 |
UnitedHealth Group Inc | UNH | 396 | -1.25(-0.31%) | 2597 |
Verizon Communications Inc | VZ | 56.57 | -0.07(-0.12%) | 64196 |
Visa | V | 228.5 | -1.10(-0.48%) | 4448 |
Wal-Mart Stores Inc | WMT | 136.78 | -0.37(-0.27%) | 22429 |
Walt Disney Co | DIS | 174.4 | -0.26(-0.15%) | 13310 |
Yandex N.V., NASDAQ | YNDX | 68.58 | 0.18(0.26%) | 4213 |
Coca-Cola (KO) target raised to $63 from $60 at Argus
FXStreet reports that the retreat in US Treasury yields over the past month or so seems at odds with the US economy’s fundamentals, and economists at Capital Economics doubt that it will be sustained. Their forecast that the 10-year yield will end 2021 well above its current level implies that US equities will fail to make further gains this year.
“While we forecast that the Fed will keep rates on hold for a few years yet, we expect higher inflation to prove more persistent than many expect. We think this will lead investors to judge that a greater degree of tightening will be needed further down the line, pushing up long-dated bond yields. This informs our forecast that the US 10-year yield will end 2021 at 2.25%, up from just below 1.50% at present.”
“We suspect that a jump in yields on that scale would knock some of the wind out of the US stock market’s sails, particularly when valuations and analysts’ expectations for corporate earnings are already high. Our forecast is that the S&P 500 will end 2021 at 4,200, a bit below its current level.”
“Higher bond yields might also help the rotation in stock markets to get back on track following its recent pause.”
The
data from the Labor Department revealed on Thursday the number of applications
for unemployment unexpectedly increase last week.
According
to the report, the initial claims for unemployment benefits rose by 37,000 to 412,000
for the week ended June 12. This was the highest reading since the week ended
May 15 and marked the first increase in initial claims in seven weeks.
Economists
had expected 359,000 new claims last week.
Claims for the prior week
were revised downwardly to 375,000 from the initial estimate of 376,000.
Meanwhile,
the four-week moving average of jobless claims fell to 395,000 from an upwardly
unrevised 403,000 in the previous week.
Continuing
claims went up to 3,518,000 from an upwardly revised 3,517,000 in the previous
week.
FXStreet reports that economists at Westpac note that GBP/USD has slipped below 1.40 due to a rapid increase in COVID-19 cases in Britain. The Delta variant is wreaking havoc but recovery is still sound. What’s more, UK/EU tensions over N. Ireland are likely to weigh on GBP into next week’s BoE meeting.
“UK’s attempts to renegotiate the N. Ireland Protocol in order to avoid potential civil unrest (Unionist marching season peaks on 12th July) stoked EU frustration that UK is failing to implement the existing agreement... The standoff shows the potential fragility of the deal struck with EU and potentially of the United Kingdom itself.”
“This week’s UK/AU trade deal is the first fully independent (of EU) trade deal that the UK has struck since Brexit. The UK hopes to build on this as well as differentiate its post-Brexit financial system. Both aspects may inflame rather than placate EU tensions. Survey data into next week’s BoE MPC should show further recovery potential but the delay in relaxing all covid restrictions may dampen near-term prospects.”
“Near-term tensions may pressure GBP/USD towards support around 1.38.”
FXStreet notes that higher production from OPEC+ member states and in the Americas means that global oil production is set to rise sharply over the next eighteen months. This is the reason why strategists at Capital Economics expect oil prices to fall from Q4 this year and throughout 2022.
“We expect global oil production to expand to around 96m bpd in 2021, from just under 94m bpd in 2020, and to fully rebound to pre-virus levels by 2022. This should be enough to swing the global oil market balance into a surplus.”
“We forecast that the price of Brent (WTI) will peak in Q3 later this year at $75 ($72) per barrel before falling gradually to $60 ($57) by end-2022.”
| Time | Country | Event | Period | Previous value | Forecast | Actual |
|---|---|---|---|---|---|---|
| 06:00 | Switzerland | Trade Balance | May | 3.3 | 4.3 | |
| 07:30 | Switzerland | SNB Interest Rate Decision | -0.75% | -0.75% | -0.75% | |
| 08:00 | Eurozone | Eurogroup Meetings | ||||
| 08:30 | Switzerland | SNB Press Conference | ||||
| 09:00 | Eurozone | Construction Output, y/y | April | 20% | 42.3% | |
| 09:00 | Eurozone | Harmonized CPI ex EFAT, Y/Y | May | 0.7% | 0.9% | 1% |
| 09:00 | Eurozone | Harmonized CPI, Y/Y | May | 1.6% | 2% | 2% |
| 09:00 | Eurozone | Harmonized CPI | May | 0.6% | 0.3% | 0.3% |
USD continued to advance against its major counterparts in the European session on Thursday after the Federal Reserve’s latest policy update, which was released yesterday afternoon, signaled earlier-than-expected interest rate increase and a possibility of a near-term tapering of the bank’s monthly asset purchases.
The U.S. Dollar Index (DXY), measuring the U.S. currency's value relative to a basket of foreign currencies, rose 0.7% to 91.77.
At its latest meeting, the FOMC kept the target range for the fed funds rate near zero and maintained the pace of asset purchases by at least $120 billion per month, as widely expected. The U.S. central bank also confirmed its commitment to the view that recent inflation spikes have largely reflected transitory factors. However, the Fed's dot plot projections, which are closely watched by investors for indications of the future trajectory of interest rates, revealed that the FOMC’s members are now predicting at least two interest rate hikes in 2023, a year earlier than seen in March.
In addition, the Fed’s Chairman Jerome Powell confirmed that the central bank’s policymakers have begun discussing tapering asset purchases, but added that this was the "talking about talking about meeting” and repeated that the Fed would provide an “advanced notice” before announcing any updates regarding tapering. He also reiterated that “dot plots are not a great forecaster of rates”.
FXStreet reports that FX Strategists at UOB Group suggest that the upside momentum in USD/CNH could extend to the 6.4500 level in the short-term horizon.
24-hour view: “Our expectation for USD to consolidate was wrong as it surged to 6.4420 during NY hours. The rapid rise appears to be overdone and USD is unlikely to advance much further. For today, USD is more likely to trade within a 6.4150/6.4450 range.”
Next 1-3 weeks: “While further USD strength is not ruled out, shorter-term conditions are deeply overbought and it is left to be seen if USD can muster enough momentum to break major long-term resistance at 6.4500. That said, a break of this major resistance could potentially lead to a rapid rise towards 6.4660. Meanwhile, USD could consolidate for a couple of days but as long as the ‘strong support’ at 6.4000 (level was at 6.3880 yesterday) is not breached, the risk is still for a higher USD.”
FXStreet reports that the Credit Suisse analyst team notes that EUR/USD has broken sharply below its 200-day average at 1.1996. A close below here would confirm a more important in-range top to suggest further weakness over the next few weeks, potentially as far as 1.1753.
“A close below the 200-day average at 1.1996, which we think is likely, would suggest we have seen a more important in-range top complete, turning the trend lower over the next few weeks.
“We see support next at the mid-April ‘outside day’ low at 1.1942, then the 61.8% retracement of the rally from late March. Whilst we would look for this latter support to hold at first, below in due course can see weakness extend to 1.1867/60 next, then the 78.6% retracement at 1.1823. Whilst we would also look for this to hold at first, below can see weakness extend to potential trend support from the lower end of the converging range, now at 1.1756.”
“Resistance is seen at 1.1983 initially, then the 200-day average at 1.1996.”
FXStreet notes that the reverberations from the FOMC should support USD via yields and skittish equities. Analysts at Westpac look for the AUD/USD pair to test the 200-day moving average (DMA), currently at 0.7554.
“The FOMC meeting was a game-changer for the US dollar’s prospects near term. It posted substantial gains against all G10 currencies on the week, so AUD/USD’s 2 month lows under 0.7600 don’t tell us much new about underlying demand for the aussie.”
“As for domestic developments, an emerging COVID-19 cluster in Sydney is a concern but RBA Governor Lowe was broadly upbeat.”
“Still, Lowe emphasised that ending QE in Sep was not an option at the July meeting. And the reverberations from the FOMC should support USD via yields and skittish equities. Look for the aussie to test the 200-DMA at 0.7554.”
FXStreet reports that UOB Group’s FX Strategists keep the bullish view on USD/JPY, with the next target at the 110.95 level in the next weeks.
24-hour view: “The overbought rally in USD has room to extend but it is unlikely able to maintain a foot hold above the year-to-date high near 110.95. On the downside, a break of 110.25 (minor support is at 110.45) would indicate that the current upward pressure has eased.”
Next 1-3 weeks: “Two days ago (15 Jun, spot at 110.05), we noted that ‘risk is beginning to shift to the upside but USD has to close above the major resistance at 110.35 before a sustained advance can be expected’. We added, ‘the next resistance is at 110.60 followed by 110.95’. While our view for an upside risk is not wrong, we did not anticipate the rapid pace of advance as USD soared to an overnight high of 110.71. The level to focus on now is at the year-to-date high near 110.95. If USD can close above this level, there is a good chance for it to advance further to 111.25. The upside risk remains intact as long as USD does not move below 110.00 (‘strong support’ level was at 109.60 yesterday).”
FXStreet reports that according to economists at Westpac, DXY (US Dollar Index) is unlikely to revisit sub-90 levels anytime soon.
“The USD is in a much healthier place now the Fed is inching toward the exits. Discussions are actively taking place about talking tapering and a large swathe of the FOMC brought forward the timing of rate hikes, notably, the median dot projects two hikes by end-2023.”
“With the timeline for lifting Fed Funds moving forward and a modest tapering likely to take 12 months or so, the taper timeline has arguably shifted forward too, a start date of late 2021 now looking more likely.”
“A return to sub-90 trade for the DXY seems unlikely near term, if anything there’s scope for multi-day upside toward 92-93 to bring DXY closer into line with yield spreads. But further sustained upside beyond that seems unlikely.”
According to first estimates from Eurostat, in April 2021 compared with April 2020, production in construction increased by 42.3% in the euro area and by 32.7% in the EU.
In April 2021 compared with March 2021, seasonally adjusted production in the construction sector decreased by 2.2% in the euro area and by 1.6% in the EU. In March 2021, production in construction rose by 4.1% in the euro area and by 3.5% in the EU.
In the euro area in April 2021, compared with March 2021, civil engineering decreased by 6.1% and building construction by 1.0%. In the EU, civil engineering decreased by 5.4% and building construction by 0.7%.
In the euro area in April 2021, compared with April 2020, building construction increased by 43.7% and civil engineering by 30.4%. In the EU building construction increased by 33.9% and civil engineering by 22.4%.
Among Member States for which data are available, the highest increases in production in construction were observed in France (+160.4%), Belgium (+45.2%) and Austria (+37.3%). The largest decreases were recorded in Hungary (-7.1%), Sweden (-5.5%) and Poland (-4.2%).
According to the report from Eurostat, the euro area annual inflation rate was 2.0% in May 2021, up from 1.6% in April. A year earlier, the rate was 0.1%. The core figures rose to 1.0%, beating the 0.9% consensus forecasts. European Union annual inflation was 2.3% in May 2021, up from 2.0% in April. A year earlier, the rate was 0.6%.
The lowest annual rates were registered in Greece (-1.2%), Malta (0.2%) and Portugal (0.5%). The highest annual rates were recorded in Hungary (5.3%), Poland (4.6%) and Luxembourg (4.0%). Compared with April, annual inflation fell in four Member States, remained stable in one and rose in twenty-two.
In May, the highest contribution to the annual euro area inflation rate came from energy (+1.19 percentage points, pp), followed by services (+0.45 pp), non-energy industrial goods (+0.19 pp) and food, alcohol & tobacco (+0.15 pp).
Reuters reports that ECB Chief Economist Philip Lane said that the ECB may not have the data it needs by its Sept. 9 meeting to decide the future of its emergency bond-buying programme.
The ECB last week decided to maintain an elevated level of bond buying, but as the economy rebounds and the pandemic retreats some policymakers are already making the case to start a discussion about rolling back emergency stimulus.
"We're not necessarily going to have every piece of hard data you want to have going into the September meeting," Lane told.
"September is of course going to be an important meeting, but there's going to be a lot of data coming in throughout the autumn," he said.
Lane also repeated the ECB's stance that, for now, it is "premature and unnecessary" to discuss questions related to the end of the bank's 1.85 trillion euro Pandemic Emergency Purchased Programme (PEPP), especially since unemployment remained too high and wage pressure was muted.
FXStreet reports that strategists at Capital Economics expect the RBNZ to impose new lending restrictions in the months ahead which should result in house prices declining next year.
“The government has now granted the RBNZ the power to impose debt serviceability restrictions on mortgage lending. The Bank has argued that such restrictions, such as caps on borrowing relative to a borrowers’ income, would ‘be the most effective tool that could be deployed’ for curbing house price growth. So we expect the Bank to impose restrictions before long.”
“We think house price growth will slow in the months ahead and turn negative in 2022. Our forecast for interest rate hikes would be historically consistent with prices dropping 10% YoY. But that relationship may have been shifted by the low level of interest rates. We expect house prices to fall 7% between early 2022 and end-2023 which would keep affordability from declining further as interest rates rise.”
According to the report from the European Automobile Manufacturers' Association (ACEA), in May 2021, passenger car registrations in the European Union rose by 53.4% compared to last year, totalling 891,665 units. Nevertheless, last month’s result is still far below the 1.2 million cars that were sold in May 2019. The national markets saw strong volume gains, with Spain posting the biggest increase (+177.8%). The EU’s three other key car markets also did well in May: France +46.4%, Italy +43.0% and Germany +37.2%.
From January to May 2021, EU demand for new cars increased by 29.5% to reach 4.3 million units registered in total. The steep declines in the first two months of 2021 were counterbalanced by rises in March, April and May. Each of the four major markets posted double-digit percentage increases so far this year: Italy (+62.8%), France (+50.1%), Spain (+40.0%) and Germany (+12.8%).
The SNB is maintaining its expansionary monetary policy with a view to ensuring price stability and providing ongoing support to the Swiss economy in its recovery from the impact of the coronavirus pandemic.
SNB remains willing to intervene in the foreign exchange market as necessary, while taking the overall currency situation into consideration.
The Swiss franc remains highly valued.
The SNB’s expansionary monetary policy provides favourable financing conditions, contributes to an appropriate supply of credit and liquidity to the economy, and counters upward pressure on the Swiss franc.
The new conditional inflation forecast for 2021 and 2022 is slightly higher than in March. This is primarily due to higher prices for oil products and tourism-related services, as well as for goods affected by supply bottlenecks.
In the longer term, the inflation forecast is virtually unchanged compared with March.
The new forecast stands at 0.4% for 2021, and 0.6% for both 2022 and 2023. The conditional inflation forecast is based on the assumption that the SNB policy rate remains at −0.75% over the entire forecast horizon.
Coronavirus and the measures implemented to contain it are continuing to shape the global economy more than a year after the outbreak of the pandemic.
The SNB’s baseline scenario for the global economy anticipates that the major advanced economies will ease containment measures further through to the summer. Against this backdrop, the SNB expects strong growth in the second and third quarters. However, the after-effects of the pandemic will continue to weigh on demand for some time yet.
SNB expects GDP growth of around 3.5% for 2021. The upward revision compared with March is primarily attributable to the lower than-expected decline in GDP in the first quarter.
Swiss GDP is likely to return to its pre-crisis level by the middle of the year. However, production capacity will remain underutilised for some time yet.
Owing to the pandemic, the forecast for Switzerland, as for the global economy, remains subject to heightened uncertainty.
| Time | Country | Event | Period | Previous value | Forecast | Actual |
|---|---|---|---|---|---|---|
| 00:10 | Australia | RBA's Governor Philip Lowe Speaks | ||||
| 01:30 | Australia | RBA Bulletin | ||||
| 01:30 | Australia | Changing the number of employed | May | -30.7 | 30 | 115.2 |
| 01:30 | Australia | Unemployment rate | May | 5.5% | 5.5% | 5.1% |
| 06:00 | Switzerland | Trade Balance | May | 3.3 | 4.3 |
During today's Asian trading, the US dollar rose against most major currencies.
The ICE index, which tracks the dollar's performance against six currencies (euro, swiss franc, yen, canadian dollar, pound sterling and swedish krona), rose 0.36% to 91.47 points, the highest level in the last two months.
According to analysts, "hawkish" signals from the last meeting of the US Federal Reserve System (Fed), which ended on Wednesday, contributed to the strengthening of the dollar.
The Fed kept the interest rate in the range of 0% to 0.25% at the end of the June meeting. The Fed also said it will continue to buy back $120 billion worth of assets each month " until significant progress is made towards the goals of maximum employment and price stability." These decisions coincided with the forecasts of economists and market participants.
Meanwhile, the Fed raised its forecast for GDP growth in 2021 to 7% from the 6.5% expected in March. At the same time, the dot plot showed that 7 of the 18 Fed leaders do not rule out a rate hike in 2022. The majority - 13 people - are waiting for an increase in rates in 2023.
Fed Chairman Jerome Powell was more upbeat about the economic outlook during a press conference than he was just a few months ago, saying that "we will soon find ourselves in a very strong labor market." However, he cautioned that the Fed would not rush to raise interest rates.
FXStreet reports that economists at Danske Bank think the message from FOMC and the likely path for US monetary policy support their call for a lower EUR/USD.
“We were wrong thinking that this Fed meeting would not be a significant one, as the Fed was more hawkish than expected. The median Fed dot now signals two rate hikes by 2023 (we expected the Fed to signal one) and seven out of 18 FOMC members signal at least one rate hike already next year. Hence, this meeting was likely the first step in the Fed taking the foot off the gas, assuming that equities and inflation expectations hold up and jobs growth strengthens.”
“We now expect the Fed to turn more and more hawkish in coming months so that actual tapering will start in Q4 21 (previously in January 2022). We continue to expect a moderation in the pace of expansion in the manufacturing sector (declining PMIs) and a shift towards dollar amid a slight tapering of cross asset inflation momentum. In our view, such macro and financial outcomes will involve downside pressure for EUR/USD from its currently elevated level and we continue to forecast 1.19 in 3M, 1.15 in 12M.”
Bloomberg reports that the People’s Bank of China is now dealing with a currency sliding on the prospect of over higher U.S. rates.
The exchange rate plunged the most in nearly three months in offshore markets Wednesday, after the Fed accelerated its expected pace of policy tightening -- a move that would strengthen the dollar. A forum backed by the Chinese central bank released a statement urging corporates to hedge against yuan volatility, right after a state-run paper said the currency could start to decline.
“The Fed will definitely start tapering eventually, so it’s normal that the PBOC and investors are now concerned with yuan depreciation,” said Gao Qi, a currency strategist at Scotiabank in Singapore. “In the short-term, the yuan could rebound as the market has overreacted to news on tapering. But still, bets on tighter U.S. policy should have dampened confidence in the yuan, which will drop every time there’s news on the Fed being hawkish in the second half.”
The PBOC has always been cautious about yuan volatility in either direction, as it strives to keep financial markets steady to avoid risks. Rapid depreciation raises risks of fast capital outflows, hurting China’s push for the global use of its currency.
EUR/USD
Resistance levels (open interest**, contracts)
$1.2175 (1008)
$1.2139 (623)
$1.2110 (121)
Price at time of writing this review: $1.1989
Support levels (open interest**, contracts):
$1.1951 (3449)
$1.1918 (1912)
$1.1879 (866)
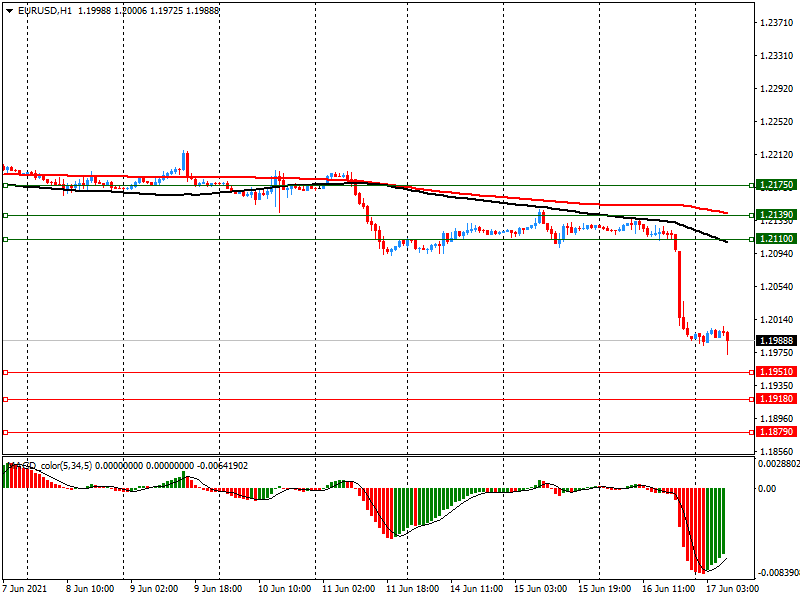
Comments:
- Overall open interest on the CALL options and PUT options with the expiration date June, 16 is 53772 contracts (according to data from July, 9) with the maximum number of contracts with strike price $1,2200 (5980);
GBP/USD
$1.4146 (312)
$1.4089 (141)
$1.4037 (127)
Price at time of writing this review: $1.3987
Support levels (open interest**, contracts):
$1.3957 (671)
$1.3938 (368)
$1.3914 (3054)
Comments:
- Overall open interest on the CALL options with the expiration date July, 9 is 13231 contracts, with the maximum number of contracts with strike price $1,4500 (3578);
- Overall open interest on the PUT options with the expiration date July, 9 is 15101 contracts, with the maximum number of contracts with strike price $1,4000 (3054);
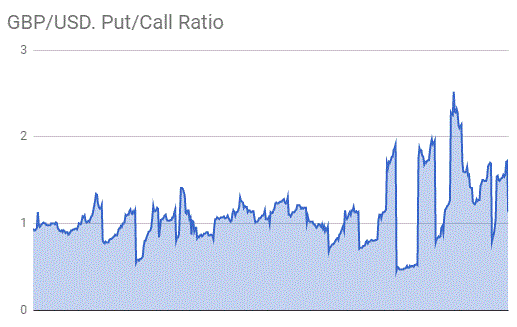
- The ratio of PUT/CALL was 1.14 versus 1.13 from the previous trading day according to data from June, 16
* - The Chicago Mercantile Exchange bulletin (CME) is used for the calculation.
** - Open interest takes into account the total number of option contracts that are open at the moment.
Reuters reports that former central bank executive Eiji Maeda said that the Bank of Japan may be able to start debating ways to phase out its extraordinary stimulus programme, such as by ditching negative interest rates, in 2023.
Discussions on abandoning negative rates would only emerge if Japan's economy returns to post-pandemic levels and inflation perks up near 1%, said Maeda, who as BOJ executive director oversaw its policy drafting until May 2020.
And if the central bank raises rates, it will only move the short-term rate target to around 0.0%-0.5% in what will be a modest reversal of crisis-mode policies rather than the start of a full-fledged rate-hike cycle.
"If the BOJ is lucky, debate (on raising rates) could begin from around 2023," Maeda told Reuters in an interview.
"But this won't be policy normalisation. It will merely be a shift away from an extraordinary stimulus towards a more sustainable monetary easing," he said.
RTTNews reports that the Australian Bureau of Statistics said that the jobless rate in Australia came in at a seasonally adjusted 5.1 percent in May, well below expectations for 5.5 percent, which would have been unchanged from the April reading.
Economy added 115,200 jobs last month to 13,125,100, blowing away forecasts for an increase of 30,000 following the loss of 30,600 in the previous month.
Full-time employment gained 97,500 jobs in May after adding 33,800 in April. Part-time employment gained 17,700 after shedding 64,400 jobs in the previous month.
The participation rate was 66.2 percent, exceeding expectations for 66.1 percent and up from 66.0 percent a month earlier.
Monthly hours worked in all jobs increased by 25.2 million hours (1.4 percent) to 1,814 million hours, while the underemployment rate decreased by 0.3 percent to 7.4 percent.
| Raw materials | Closed | Change, % |
|---|---|---|
| Brent | 73.94 | -0.52 |
| Silver | 26.891 | -2.73 |
| Gold | 1809.977 | -2.64 |
| Palladium | 2795.05 | 1.45 |
| Time | Country | Event | Period | Previous value | Forecast |
|---|---|---|---|---|---|
| 00:10 (GMT) | Australia | RBA's Governor Philip Lowe Speaks | |||
| 01:30 (GMT) | Australia | RBA Bulletin | |||
| 01:30 (GMT) | Australia | Changing the number of employed | May | -30.6 | 30 |
| 01:30 (GMT) | Australia | Unemployment rate | May | 5.5% | 5.5% |
| 06:00 (GMT) | Switzerland | Trade Balance | May | 3.3 | |
| 07:30 (GMT) | Switzerland | SNB Interest Rate Decision | -0.75% | -0.75% | |
| 08:00 (GMT) | Eurozone | Eurogroup Meetings | |||
| 08:30 (GMT) | Switzerland | SNB Press Conference | |||
| 09:00 (GMT) | Eurozone | Construction Output, y/y | April | 18.3% | |
| 09:00 (GMT) | Eurozone | Harmonized CPI ex EFAT, Y/Y | May | 0.7% | 0.9% |
| 09:00 (GMT) | Eurozone | Harmonized CPI, Y/Y | May | 1.6% | 2% |
| 09:00 (GMT) | Eurozone | Harmonized CPI | May | 0.6% | 0.3% |
| 12:30 (GMT) | Canada | Foreign Securities Purchases | April | 3.25 | |
| 12:30 (GMT) | U.S. | Continuing Jobless Claims | June | 3499 | 3430 |
| 12:30 (GMT) | U.S. | Initial Jobless Claims | June | 376 | 359 |
| 12:30 (GMT) | U.S. | Philadelphia Fed Manufacturing Survey | June | 31.5 | 31 |
| 14:00 (GMT) | U.S. | Leading Indicators | May | 1.6% | 1.3% |
| 14:00 (GMT) | U.S. | Treasury Secretary Yellen Testimony | |||
| 23:30 (GMT) | Japan | National CPI Ex-Fresh Food, y/y | May | -0.1% | 0.1% |
| 23:30 (GMT) | Japan | National Consumer Price Index, y/y | May | -0.4% |
| Pare | Closed | Change, % |
|---|---|---|
| AUDUSD | 0.76082 | -1.03 |
| EURJPY | 132.671 | -0.58 |
| EURUSD | 1.19922 | -1.1 |
| GBPJPY | 154.713 | -0.15 |
| GBPUSD | 1.39846 | -0.68 |
| NZDUSD | 0.70521 | -1 |
| USDCAD | 1.22702 | 0.72 |
| USDCHF | 0.90842 | 1.16 |
| USDJPY | 110.622 | 0.53 |


© 2000-2026. All rights reserved.
This site is managed by Teletrade D.J. LLC 2351 LLC 2022 (Euro House, Richmond Hill Road, Kingstown, VC0100, St. Vincent and the Grenadines).
The information on this website is for informational purposes only and does not constitute any investment advice.
The company does not serve or provide services to customers who are residents of the US, Canada, Iran, The Democratic People's Republic of Korea, Yemen and FATF blacklisted countries.
Making transactions on financial markets with marginal financial instruments opens up wide possibilities and allows investors who are willing to take risks to earn high profits, carrying a potentially high risk of losses at the same time. Therefore you should responsibly approach the issue of choosing the appropriate investment strategy, taking the available resources into account, before starting trading.
Use of the information: full or partial use of materials from this website must always be referenced to TeleTrade as the source of information. Use of the materials on the Internet must be accompanied by a hyperlink to teletrade.org. Automatic import of materials and information from this website is prohibited.
Please contact our PR department if you have any questions or need assistance at pr@teletrade.global.
transfers