- Analytics
- News and Tools
- Market News
CFD Markets News and Forecasts — 18-08-2020
| Time | Country | Event | Period | Previous value | Forecast |
|---|---|---|---|---|---|
| 00:30 | Australia | Leading Index | July | 0.4% | |
| 06:00 | United Kingdom | Retail Price Index, m/m | July | 0.2% | 0.1% |
| 06:00 | United Kingdom | Producer Price Index - Output (YoY) | July | -0.8% | -0.9% |
| 06:00 | United Kingdom | Producer Price Index - Input (MoM) | July | 2.4% | 1.1% |
| 06:00 | United Kingdom | Producer Price Index - Input (YoY) | July | -6.4% | -6.1% |
| 06:00 | United Kingdom | Producer Price Index - Output (MoM) | July | 0.3% | 0.2% |
| 06:00 | United Kingdom | Retail prices, Y/Y | July | 1.1% | 1.2% |
| 06:00 | United Kingdom | HICP ex EFAT, Y/Y | July | 1.4% | |
| 06:00 | United Kingdom | HICP, m/m | July | 0.1% | 0.0% |
| 06:00 | United Kingdom | HICP, Y/Y | July | 0.6% | 0.6% |
| 08:00 | Eurozone | Current account, unadjusted, bln | June | -10.5 | |
| 09:00 | Eurozone | Harmonized CPI ex EFAT, Y/Y | July | 0.8% | 1.2% |
| 09:00 | Eurozone | Harmonized CPI | July | 0.3% | -0.3% |
| 09:00 | Eurozone | Harmonized CPI, Y/Y | July | 0.3% | 0.4% |
| 12:30 | Canada | Wholesale Sales, m/m | June | 5.7% | 10% |
| 12:30 | Canada | Bank of Canada Consumer Price Index Core, y/y | July | 1.1% | |
| 12:30 | Canada | Consumer Price Index m / m | July | 0.8% | 0.4% |
| 12:30 | Canada | Consumer price index, y/y | July | 0.7% | 0.5% |
| 14:30 | U.S. | Crude Oil Inventories | August | -4.512 | -2.475 |
| 18:00 | U.S. | FOMC meeting minutes |
According to ActionForex, analysts at TD Bank Financial Group note that the U.S. housing starts surged by 22.6% month-on-month to 1.50 million units (annualized) in July.
"The July print shattered market expectations, which called for a much more staid increase of 5.0% to 1.24 million units. Today’s report also came with revisions to the June and May readings (+61k on net)."
"The improvements were broad-based, with both single and multi-family starts coming in higher. Single-family starts rose by 8.2% to 940k units, while the multi-family segment posted an impressive 58.4% gain to 556k units."
"Similarly, permits advanced by 18.8% in July to 1.50 million. Multi-family permits surged by 22.5%, following a 11.1% contraction in the previous month, while single-family permits were up 17.0%."
"The regional outturn was decidedly positive, with gains largest in the Northeast (+35.3%) and the South (+33.2%)."
"While housing starts were expected to forge ahead in July, it is fair to say that today’s report blew expectations out of the water. The rebound in homebuilding activity has now extended to three consecutive months, bringing starts within 5% of their pre-pandemic levels. On the whole, the housing sector, supported by low mortgage rates and resilient demand from millennial homebuyers, continues to be a bright spot for the American economy and is one of a few sectors showcasing a “V-shaped” recovery."
FXStreet notes that the sugar, coffee and cocoa markets have been under pressure during the coronacrisis. A rapid recovery in demand cannot be expected as the uncertainties surrounding the pandemic are still too great. Due to the drop in demand, the availability of sugar, coffee and cocoa is currently more than sufficient. This increased availability will eventually have a downward effect on prices, strategists at ABN Amro brief.
“The sugar price has been in an upward trend since 27 April, mainly due to the recovery in the oil price. As long as the ethanol price is relatively low, sugar production will continue to increase. Greater supply means more price pressure in general. However, upward price risks have increased. Less output from Thailand, Russia and EU can offset higher output from Brazil. When in this scenario the demand outlook is buoyant, sugar price will gain momentum again, which will keep Brazilian sugar allocation elevated.”
“The price of Arabica coffee fell 24% up to 20 July compared to the level of 1 January. However, the market situation changed from 20 July, when the price increased by 21% in just nine days. Rumours of adverse weather affecting the crop in Brazil, optimism about a vaccine for Covid-19, a stronger Brazilian real, the weaker dollar and declining supplies of coffee worldwide boosted prices. However, we think this revival is only temporary. Our year-end price for Arabica coffee is currently at 111 cents per pound. This represents a decline of 4 cents per pound from current levels or about 4%. Despite the recent decline in exchange stocks, the availability of coffee remains good for the time being. Moreover, it appears that out-of-home consumption will not recover anytime soon. After all, as long as there is no vaccine for Covid-19, the growth potential of coffee demand will remain relatively low.”
“Due to the economic support measures implemented by the US central bank (Fed), sufficient dollars became available on the financial markets again. This resulted in a weaker dollar and made commodities in counter currencies cheaper. Cocoa was no exception. This set a buying spree in motion and pushed the cocoa price back to a higher level.However, this higher price will not last long. The demand for cocoa is still far from its previous level and stocks are relatively high. In the end, this will have a negative effect on the price trend of cocoa. In addition, the outlook for the cocoa supply is very positive. A good harvest is expected for the 2020/21 season, which will add to price pressure.”
- Notes that there are around $400 million now committed in Main Street lending program
- People are beginning to spend
- Half of the employment in the US is in small business
- President Trump wants to do more for small business
- Five U.S States have been approved for new unemployment aid, 14 others applied or preparing to
- White House and Democrats agreed to $10 billion for USPS but was part of stimulus bill
- There's a deal to be done here if Democrats want to be reasonable
- I hope House Speaker Pelosi is interested in sitting down for more COVID aid talks
U.S. stock-index futures rose on Tuesday after better-than-expected earnings reports from Walmart (WMT) and Home Depot (HD), as well as upbeat data on the U.S. housing market. Investors also weighed escalating tensions between the U.S. and China against signals of possible break in the impasse between Democrats and Republicans over the next coronavirus aid package.
Global Stocks:
Index/commodity | Last | Today's Change, points | Today's Change, % |
Nikkei | 23,051.08 | -45.67 | -0.20% |
Hang Seng | 25,367.38 | +20.04 | +0.08% |
Shanghai | 3,451.09 | +12.29 | +0.36% |
S&P/ASX | 6,123.40 | +47.00 | +0.77% |
FTSE | 6,127.44 | +37.40 | +0.61% |
CAC | 4,973.43 | +1.49 | +0.03% |
DAX | 12,969.94 | +49.28 | +0.38% |
Crude oil | $42.72 | -0.40% | |
Gold | $2,021.90 | +1.16% |
(company / ticker / price / change ($/%) / volume)
ALCOA INC. | AA | 14.52 | 0.02(0.14%) | 6381 |
ALTRIA GROUP INC. | MO | 43.14 | 0.11(0.26%) | 2778 |
Amazon.com Inc., NASDAQ | AMZN | 3,215.00 | 32.59(1.02%) | 57891 |
American Express Co | AXP | 97.9 | 0.35(0.36%) | 3282 |
AMERICAN INTERNATIONAL GROUP | AIG | 30.02 | 0.06(0.20%) | 4168 |
Apple Inc. | AAPL | 458.78 | 0.35(0.08%) | 394157 |
AT&T Inc | T | 29.89 | 0.04(0.13%) | 44302 |
Boeing Co | BA | 172.25 | 0.24(0.14%) | 109082 |
Caterpillar Inc | CAT | 138.9 | 0.18(0.13%) | 1385 |
Chevron Corp | CVX | 89.7 | 0.22(0.25%) | 18243 |
Cisco Systems Inc | CSCO | 42.11 | 0.02(0.05%) | 60670 |
Citigroup Inc., NYSE | C | 51.43 | 0.01(0.02%) | 57448 |
Deere & Company, NYSE | DE | 193.65 | 0.66(0.34%) | 345 |
E. I. du Pont de Nemours and Co | DD | 57.55 | 0.09(0.16%) | 1229 |
Exxon Mobil Corp | XOM | 42.68 | 0.04(0.09%) | 21625 |
Facebook, Inc. | FB | 261.7 | 0.54(0.21%) | 33109 |
FedEx Corporation, NYSE | FDX | 207 | 0.36(0.17%) | 2884 |
Ford Motor Co. | F | 6.97 | -0.01(-0.14%) | 88719 |
Freeport-McMoRan Copper & Gold Inc., NYSE | FCX | 14.2 | 0.10(0.71%) | 14451 |
General Electric Co | GE | 6.48 | 0.01(0.16%) | 319574 |
General Motors Company, NYSE | GM | 30.47 | 0.46(1.53%) | 119795 |
Goldman Sachs | GS | 204.01 | 0.94(0.46%) | 7339 |
Google Inc. | GOOG | 1,524.00 | 6.02(0.40%) | 2458 |
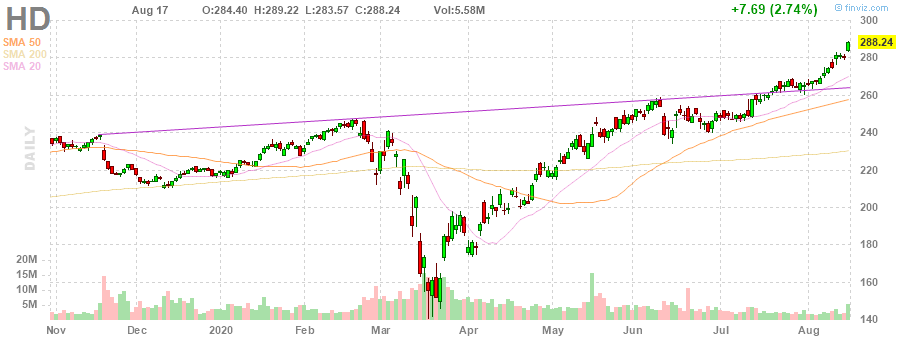
Home Depot Inc | HD | 291 | 2.76(0.96%) | 311046 |
HONEYWELL INTERNATIONAL INC. | HON | 158.87 | 0.11(0.07%) | 409 |
Intel Corp | INTC | 49.15 | 0.22(0.45%) | 96910 |
International Business Machines Co... | IBM | 124.99 | 0.55(0.44%) | 4652 |
Johnson & Johnson | JNJ | 149.6 | 0.61(0.41%) | 9771 |
JPMorgan Chase and Co | JPM | 99.71 | 0.00(0.00%) | 74128 |
Merck & Co Inc | MRK | 84.99 | 0.23(0.27%) | 1818 |
Microsoft Corp | MSFT | 210.48 | 0.20(0.10%) | 87516 |
Nike | NKE | 106.31 | 0.65(0.62%) | 3720 |
Pfizer Inc | PFE | 38.4 | 0.05(0.13%) | 22215 |
Procter & Gamble Co | PG | 135.17 | -0.33(-0.24%) | 2860 |
Starbucks Corporation, NASDAQ | SBUX | 79.14 | 0.19(0.24%) | 141078 |
Tesla Motors, Inc., NASDAQ | TSLA | 1,904.11 | 68.47(3.73%) | 878243 |
The Coca-Cola Co | KO | 48.32 | 0.11(0.23%) | 13034 |
Travelers Companies Inc | TRV | 116 | 0.09(0.08%) | 1017 |
Twitter, Inc., NYSE | TWTR | 38.1 | 0.13(0.34%) | 19308 |
Verizon Communications Inc | VZ | 58.75 | -0.03(-0.05%) | 2422 |
Visa | V | 200.02 | 0.59(0.30%) | 18192 |
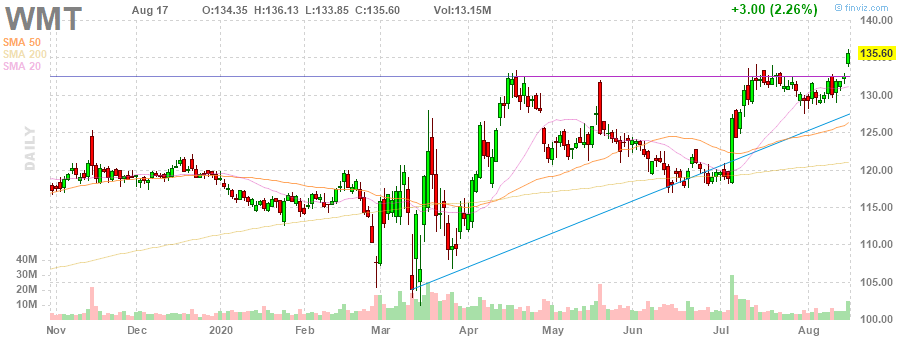
Wal-Mart Stores Inc | WMT | 134.99 | -0.61(-0.45%) | 4300296 |
Walt Disney Co | DIS | 129.2 | -0.17(-0.13%) | 12585 |
Yandex N.V., NASDAQ | YNDX | 61.7 | 1.09(1.80%) | 232474 |
Tesla (TSLA) target raised to $1900 from $1800 at Wedbush
Nvidia (NVDA) target raised to $540 from $450 at Susquehanna
The Commerce Department
reported on Tuesday the housing starts jumped by 22.6 percent m-o-m in July to
a seasonally adjusted annual pace of 1.496 million (the highest level since
February), while building permits climbed by 18.8 percent m-o-m to an annual
rate of 1.495 million (the highest level since January).
Economists had
forecast housing starts increasing to a pace of 1.240 million units last month
and building permits rising to a pace of 1.320 million units.
Data for June
was revised to show homebuilding growing to a pace of 1.220 million units,
instead of increasing at a rate of 1.186 million units as previously reported.
According to
the report, permits for single-family homes, the largest segment of the market,
surged 17.0 percent m-o-m to a rate of 983,000 million units in July, while
approvals for the multi-family homes segment jumped 22.5 percent m-o-m to a 512,000
unit-rate.
| Time | Country | Event | Period | Previous value | Forecast | Actual |
|---|---|---|---|---|---|---|
| 08:00 | U.S. | FOMC Member Brainard Speaks |
GBP rose against other major currencies in the European session on Tuesday, even though analysts remained cautious about the outlook for the pound as a new round of the UK-EU trade negotiations began.
The negotiators from the UK and the EU are to begin another - the sixth - round of talks on a post-Brexit trade deal later today. It is expected that the Brexit-related headlines could drive the volatility in sterling this week, causing investors to price back in the possible outcomes of the talks.
Last week, Britain's chief Brexit negotiator David Frost stated that the UK wants a deal with at its core a free trade agreement like the one the EU has with Canada. He also suggested that the trade agreement with the EU can be reached in September. Yesterday, the UK PM Boris Johnson’s spokesman reiterated that Britain still believes the deal can be reached next month.
Meanwhile, the two sides should iron out their disagreements over competition rules, fishing rights, and how a deal would be enforced.
FXStreet notes that the S&P 500 rally continues to lose momentum at the 3394 record high, with a daily RSI momentum divergence in place the risk for a correction lower is growing steadily, but with a break below 3336/26 needed to mark a near-term top, according to the Credit Suisse analyst team.
“The uptrend continues to stall just ahead of the 3394 record high and with a recent small ‘doji’ session from Thursday last week and with daily RSI momentum holding a small bearish RSI divergence, the risk for a correction lower continues to grow. Below 3362 can see this risk increase further with key then the recent low and 13-day average at 3336/26. Only a close below here though would confirm a correction lower is finally underway, with support then seen next at 3301, then 3271.”
“Whilst support at 3336/26 holds the trend can just lean higher for now and the corrective threat ignored for a test of the 3394 record high. Beyond here can see resistance next at the top of the daily Bollinger Band at 3415, then what we look to be tougher Fibonacci projection resistance at 3432/36 which we then look to cap for a consolidation/corrective phase.”
ING's strategists note that the U.S. dollar is extending its broad-based bearish momentum.
"The Federal Reserve's Empire State manufacturing index slump yesterday came in stark contrast with encouraging signs from the US housing market (which should be confirmed by housing starts figures today), while the mix of geopolitical tensions (US-China spat and protests in Belarus) are still failing to offer support to the dollar as most safe-haven flows are being absorbed by the Japanese yen."
"Today is going to be a quiet day in terms of data releases, with investors likely keeping their eyes open on any developments in the key market-moving threads: from geopolitical tensions to any (unlikely) advancement in the US bipartisan stimulus talks."
"All in all, with a bearish trend consolidating, the dollar appears to be hoping for a less-dovish-than-expected message in the Fed minutes due tomorrow. We doubt that the release will offer enough push to the USD to invert the trend and any potential USD-positive effect may be short-lived on the back of an opportunistic sell-the-rally approach on the dollar."
Home Depot (HD) reported Q2 FY 2020 earnings of $4.02 per share (versus $3.17 per share in Q2 FY 2019), beating analysts’ consensus estimate of $3.71 per share.
The company’s quarterly revenues amounted to $38.05 bln (+23.4% y/y), beating analysts’ consensus estimate of $34.53 bln.
HD rose to $294.75 (+2.26%) in pre-market trading.
Walmart (WMT) reported Q2 FY 2020 earnings of $1.56 per share, beating analysts’ consensus estimate of $1.25 per share.
The company’s quarterly revenues amounted to $137.74 bln (+5.6% y/y), beating analysts’ consensus estimate of $135.48 bln.
WMT rose to $143.51 (+5.83%) in pre-market trading.
FXStreet reports that economists at Credit Suisse apprise that USD/CHF has moved sharply lower over the past couple of sessions, breaking below the range lows at 0.9056/51 in early trading this morning, with the next major supports at 0.9000, before 0.8875.
“USD/CHF has broken through its 0.9056/51 recent lows to move decisively below the 0.9072 2015 low. Whilst short-term momentum is so far failing to confirm the break, our core outlook stays bearish following the completion of a major top, with a close below here confirming the end of the recent consolidation phase for a resumption of the downtrend, with support seen next at a major psychological inflection point at 0.9000, before the next major Fibonacci retracement level at 0.8875.”
“Resistance is seen initially at 0.9121/24, above which would quickly suggest a false break lower. Next resistance is seen at 0.9189/98, before the more important range top at 0.9241/59. Only above this latter area would warn of an important base to suggest a deeper corrective move higher.”
FXStreet reports that economist at UOB Group Lee Sue Ann gives her prospects for the economic activity in the euro area for the current year.
“… 2Q20 GDP in the Eurozone was confirmed to have fallen by 12.1% q/q, following earlier estimates released on 31 July. This marks a record fall in Eurozone GDP in the second quarter, the deepest since the time series started in 1995… The record-fall in GDP coincided with COVID-19 lockdowns, where many countries in the region began to ease only from May.”
“Much depends, however, on the evolving COVID-19 situation in Europe given that increasing numbers are contending with a resurgence of infections. But taking into account these recent data releases, we now expect the Eurozone economy to contract by 8.0% in 2020, compared to a contraction of 7.4% previously penciled in our 3Q quarterly update. This is largely on the back of a revision in 2Q20 GDP to -14.9% y/y, compared to -12.6% y/y previously. 3Q20 and 4Q20 GDP forecasts remain at -8.3% y/y and -5.7% y/y, respectively.”
AUD/USD: Close above 0.7243/46 to reassert the upmove - Credit Suisse
FXStreet reports that analysts at Credit Suisse note AUD/USD has turned sharply higher within its recent range, up 0.25%on the day to 0.7030, with a break above 0.7243 needed to confirm the uptrend is resuming, with next resistance at 0.7295.
“AUD/USD has moved sharply higher within its range, breaking above the 0.7190/7196 mid-range highs to suggest we set to see a renewed challenge of its recent range highs at 0.7243/46. Fresh selling is expected at this point as bears try to maintain the range, particularly with short term momentum looking increasingly tired, however, our core medium-term outlook stays bullish and a break above here would end this range and see the upmove resume, with resistance seen thereafter at the late July and the 2019 high at 0.7284/95. “
“Support stays at 0.7141/32, which includes the 21-day exponential average, which ideally holds. Removal of here could see a fall back to the aforementioned ‘neckline’ at 0.7076, where we would expect to see a more important effort to hold.”
FXStreet reports that the most important development of the past week was the outsized move in 10-year Treasury yields. Although marketplace consensus believes that long-term interest rates are set to stay lower for longer, five factors suggest higher long-term rates could be ahead, according to Mike Wilson from Morgan Stanley.
“The policy response to this recession is different than what we got after the Great Financial Crisis. While monetary policy support is similar, the scope and size are much greater. More importantly, it has been accompanied by equally large fiscal policy support that was absent after the Great Financial Crisis, and it's directed right at consumer spending rather than the banks. Therefore, the Fed's money printing this time is going directly into the real economy, and that's potentially inflationary.”
“The next fiscal stimulus is likely to be bigger once it's passed. Despite the uncertainty around the negotiations in Congress, we think the stimulus package ultimately will be passed and due to the delay, is likely to end up being bigger than originally proposed. This may come as a surprise to the bond market, particularly if it starts to realize such spending as structural rather than cyclical.”
“Longer maturity parts of the bond market may already be having digestion problems with the current supply. Last week's 30-year auction went poorly, with a weak bid to cover ratio and a large tail.”
“The Fed is likely to announce an average inflation targeting scheme over the next few weeks. That should mark peak fed dovishness unless they decide to move to negative rates, something we think is very unlikely. Peak Fed could mean a trough for longer-term interest rates.”
“Stocks and commodity prices are leading indicators. Our cyclical/defensive stock ratios suggest long-term interest rates are significantly underpriced. Meanwhile, both copper and gold have risen sharply over the past few months in anticipation of rising inflation, which also suggests long-term rates are too low.”
Reuters reports that investors are “most bullish” on financial markets since February, when world stocks hit a record high, a Bank of America fund manager survey showed.
A net 46% of investors surveyed by BofA said “it’s a bull market”, up from 40% the previous month. A secular bull market is one where the prevailing trend is for higher prices, with short corrections interrupting it.
World stocks have bounced back by a whopping 51%, adding $24 trillion in value, in five months as investors bet that economic activity would rebound rapidly after record plunges.
Of the 181 survey participants, who manage half-a-trillion dollars in assets, a net 79% expect a stronger economy, the strongest reading since December 2009.
But evidence of a new wave coronavirus infections in some countries has led to some caution and the survey showed that a pandemic “second wave” was still seen as the biggest risk to markets for the fifth straight month.
Other findings from the survey included that long U.S. tech and growth stocks were the “most crowded” trade for the fourth month running as the pandemic transformed the way people work, study and shop, making tech stocks the ultimate beneficiaries.
As global equities near record highs, strategists told Reuters that the quickfire bear-to-bull switch was not only justified but deserves to go further.
FXStreet reports that USD/CNH faces extra losses on a breach of the 6.9300 area in the next weeks, noted FX Strategists at UOB Group.
24-hour view: “We expected USD to weaken yesterday but held the view that ‘a break of last week’s low at 6.9280 is unlikely’. USD subsequently dropped to 6.9305 before closing at 6.9326 (-0.10%). Downward momentum has improved further as USD took out 6.9280 after opening this morning and the risk for today, remains on the downside. From here, barring a move above 6.9370, USD is likely to weaken towards 6.9200, possibly a slow 6.9150.”
Next 1-3 weeks: “We have held the same view since last Thursday (13 Aug, spot at 6.9315) wherein ‘if there is a NY closing below 6.9300, it would indicate the start of a period of sustained weakness in USD that could lead to a move to 6.9050, possibly even to 6.8850’. USD closed just above 6.9300 yesterday (6.9326, -0.10%) and the prospect for the start of a negative phase is rather high unless USD moves above 6.9400 within these 1 to 2 days.”
RTTNews reports that Germany's machinery exports declined sharply in the second quarter amid the coronavirus pandemic, data from the engineering industry association, VDMA, showed Tuesday.
Machinery exports decreased 22.9 percent year-on-year in the second quarter, following a moderate 5 percent fall in the first quarter.
In the first six months of 2020, machinery exports were down 14.1 percent.
"In order for export business to return to normal, many of the mechanical engineering customer countries must first get the consequences of the pandemic under control and develop more confidence for new investments," said VDMA Chief Economist Ralph Wiechers.
Data showed that machinery exports to the US decreased 23 percent in the second quarter from last year. Meanwhile, business to China fell only 7.9 percent between April and June.
"In the People's Republic we are observing an extremely robust economic recovery, especially in industry," Wiechers said. "This in turn benefits some mechanical engineering sectors, which are recording significant growth in exports to the People's Republic."
FXStreet reports that after reaching a record high of $2,051/oz in early August, gold suffered its largest one-day decline in seven years on 11 August, dropping back below $1,900/oz. Gold has already recovered to $2,000/oz. The bout of profit-taking in gold is short-lived as noted by economists at UBS who believe a bounce towards $2,300/oz is on the cards.
“Gold’s sell-off was driven by a rebound in 10-year real rates after falling to record lows in negative territory. Demand for gold this year has been driven mostly by record inflows to gold exchange-traded funds, so the price reaction was exaggerated and should be seen in the context of the sharp price runup prior to the pullback.”
“With the Fed continuing to suppress nominal rates and inflation expectations rising, we maintain our end-year forecast of $2,000/oz.”
“In the near-term, gold may move as high as $2,300/oz, particularly if geopolitical tensions rise.”
CNBC reports that there may be more upside for Chinese markets as the world’s second-largest economy recuperates from the coronavirus pandemic, a strategist said on Tuesday.
“I think that it’ll continue to be constructive both on the Chinese economy and on the markets. I still think that’s there’s still meaningful upside from current levels,” said David Chao, a global market strategist for Asia Pacific ex-Japan at Invesco.
Chinese markets extended their rally on Monday as the People’s Bank of China issued medium-term loans worth 700 billion yuan ($100.99 billion) to financial institutions on Monday.
The overall positivity also comes as as Chinese policy markers have demonstrated the ability to quickly contain new waves of the coronavirus without hampering the economy, Chao told CNBC’s “Street SignsAsia.”
“This means the economy can continue its recuperation somewhat uninterrupted,” said Chao.
Recent data out of China showed supply-side manufacturing activity recovering in July. However, Chinese consumption continues to be anemic, with retail sales negative as recent floods likely hit demand, Chao noted.
But Chinese authorities appear to be on the alert to prop up the country’s economy, with Monday’s fresh fund injection boosting market sentiment, said Chao.
“That’s a very positive signal to the markets that the PBOC continues to be watching the economic events closely and that they stand ready to help propel the economy forward,” he added.
FXStreet reports that economists at ANZ BAnk now expect the Reserve Bank of New Zealand (RBNZ) to cut the OCR 50bp at the April OCR Review. Furthermore, they see a further increase in the large-scale asset purchase (LSAP) programme in November as likely, perhaps to $120 billion. This policy is set to be a a real headwind for the kiwi.
“We are now forecasting the RBNZ to cut the OCR by 50bp to -0.25% in April 2021. Beyond that, further easing is possible, but there are constraints on the OCR going below -0.75%.”
“The RBNZ has ruled out changing the OCR before March 2021, but expressed a preference for a package of a lower OCR and a bank ‘funding for lending’ programme, should they conclude that further stimulus is required at that point. We think they will.”
“The LSAP programme could easily be extended to $120 billion in November, with the timeframe extended to December 2022. At this stage, this seems like the most likely outcome. That figure could rise to almost $140 billion if the RBNZ were prepared to buy 70% of outstandings, or if more fiscal support is needed and the government bond market grows more quickly.”
Bloomberg reports that the failure of the U.S. to handle the coronavirus pandemic risks derailing the economic recovery and puts the country at a competitive disadvantage in its long-run battle with China for global hegemony, former Federal Reserve Chairman Alan Greenspan said.
In an article written for Advisors Capital Management, Greenspan said that the U.S. has at times looked like it “has lost its way,” while China has enjoyed continued success in expanding its economy, including being the first to recover from a pandemic-driven swoon in activity.
“The Covid-19 crisis has presented a real threat to the U.S. position of global dominance,” wrote Greenspan, who is a senior economic adviser to the money manager. “As political tensions heat up between the world’s two largest economies, the balance of power that will result is still unclear, but becoming of increasingly greater concern by the day.”
President Donald Trump has made his tough positions on China a key element in the lead-up to the U.S. presidential election, now less than three months away, and he seems intent on keeping the pressure on. Barely a day goes by without Trump slamming what he calls a “plague” unleashed on the world by China in press briefings, Twitter and elsewhere.
“The failure by the U.S. to effectively deal with the onset of the Covid-19 crisis has only worsened its competitive position” versus China, Greenspan said. “The resurgence of the virus in the U.S. threatens to forestall our economic recovery.”
While the former Fed chairman said that U.S. dominance will probably ebb this century as China accounts for a greater share of global economic output, he also saw reasons for America to remain on top overall.
“America leads in all the industries that are inventing the future, such as artificial intelligence, robotics, driverless cars, and, indeed, finance,” he wrote. “And for all its problems with populism, America has something precious that China lacks: a stable political regime.”
He said the U.S. needs to find the political will to tackle the problems he believes are holding back growth: out-of-control government spending on entitlement programs and ill-considered regulations.
FXStreet reports that AUD/USD trades near-weekly tops just above 0.7230 fueled by its positive correlation with equities. Furthermore, iron ore and gold prices also support the aussie. Nonetheless, rising Covid-19 cases and bleak economic outlook in Australia lead economists at Westpac to forecast AUD/USD at 0.71 by end-September.
“AUD’s rally to above 0.72 in early August coincided with the MSCI World index reaching highs since Feb, keeping the Aussie’s traditional positive correlation with risk appetite firmly intact. The Aussie’s support is broader than equities however, with commodity prices accelerating in recent weeks, especially iron ore and gold.”
“Westpac’s index of Australia’s commodity export prices is up 29% since late April, reinforcing Australia’s current account surplus. Australia’s renewed Covid-19 containment challenge is a potential brake on gains, however.”
“While the RBA does not favour either negative rates or FX intervention, the weakening domestic economic outlook could raise expectations that the RBA might take other steps to loosen policy to support the labour market, where unemployment is still rising.”
“Our end-Sep forecast is 0.71, though a soft USD should keep lending support at least in the run-up to the Sep FOMC meeting, so fresh highs since Jan 2019 remain within reach.”
| Time | Country | Event | Period | Previous value | Forecast | Actual |
|---|---|---|---|---|---|---|
| 01:30 | Australia | RBA Meeting's Minutes |
During today's Asian trading, the US dollar declined against major currencies.
The ICE U.S. Dollar index, which shows the value of the US dollar against six major world currencies, fell 0.29% from the previous day.
Traders are waiting for the minutes of the July meeting of the US Federal reserve system, which will be published tomorrow. The minutes should specify on the dovish position of the regulator concerning the control of the yield curve and inflation targeting, experts say.
Market participants are monitoring the development of relations between Washington and Beijing, where there is another round of tension. The US Department of Commerce yesterday announced new measures to restrict access to Chinese telecommunications company Huawei Technologies Co. to key components for its work.
In addition, the Commerce Department added 38 Huawei-affiliated organizations in 21 countries to the" black list " of companies that are prohibited from exporting american technology to organizations that do not have the necessary license.
Meanwhile, the UK and the European Union are due to start another round of talks on post-Brexit trade relations today.
The Australian dollar rose against the US dollar by 0.16%. The Reserve Bank of Australia does not see the need to adjust the monetary stimulus package, as it works in general, as expected, the minutes of the August meeting of the Australian Central Bank showed. Meanwhile, members of the regulator's management agreed to continue monitoring the development of the situation in the country and did not rule out the possibility of adjusting monetary policy if it is justified.
CNBC reports that the gold rally still has some ways to go despite its recent stumble, says Standard Chartered Private Bank’s Manpreet Gill.
“We think gold’s run ... hasn’t quite finished yet,” said Gill, head of fixed income, currencies and commodities investment strategy at the firm.
“It comes back to interest rates,” he told CNBC’s “Street Signs Asia”. “One of the best explanations of why gold has surged the way it has through this year have been bond yields.”
“Net of inflation or what we call real bond yields, those have been sort of on (a) one-way tear and that’s sort of lined up very nicely with move in gold,” the strategist said.
Gold prices have had a stellar run so far in 2020, soaring to levels beyond $2,000 in early August. That hit a pause last week as prices of the precious metal fell below $2,000, with spot gold trading at $1,942.1405 per ounce Monday afternoon Singapore time.
Gill said the recent pullback in gold prices was explained by an uptick in bond yields. U.S. Treasury yields spiked early last week, as positive developments on the coronavirus vaccine front boosted risk sentiment. The yield on the benchmark 10-year Treasury note was last at 0.673%. A rise in yields puts pressure on non-yielding assets such as gold given the opportunity cost of holding the latter.
“We have quite a bit of one-sided positioning in gold and I think, you know, that’s actually unwound quite quickly. A lot of our proprietary indicators are telling us exactly that,” he said.
Commenting on the recent uptick in Treasury yields, the strategist said: “As long as yields stay below 1%, that doesn’t really alter our longer-theme that ... central banks have really liked to do whatever they can to keep bond yields capped.”
Still, Gill added that it’s “ultimately a great environment” for gold, assuming factors such as central banks doing their best to keep bond yields capped and the economic recovery staying the course.
Reuters reports that Japan's low unemployment rate on paper suggests an economy weathering the coronavirus reasonably well, but official figures belie worsening prospects for the country's army of temporary workers, who make up about 40% of the jobs market.
A rise in job losses would undermine one of the few successes of Prime Minister Shinzo Abe's "Abenomics" stimulus policies, aimed at reviving the economy.
Japan's jobless rate stood at 2.8% in June, much lower than 10.2% in the United States and 7.8% in the 19-member euro zone.
But a close look at data shows a rising number of people dropping out of the jobs race. That prevents the official jobless rate - the ratio of job seekers who are yet to land work - from rising much.
About 2.4 million furloughed workers are kept on payrolls backed by state subsidies, which the government is seeking to extend beyond its end-September expiration.
"The huge number of furloughed workers suggests companies are saddled with excess labour and are under pressure to cut jobs down the road," said Hisashi Yamada, senior economist at Japan Research Institute.
"Job losses will hurt Japan's economic recovery as they spread to broader sectors in coming years, eroding households' purchasing power," he said.
Japan's economy plunged by a record pace in the second quarter as the pandemic hit consumption and exports.
In the jobs market, the pain has been felt most by those categorised as "non-regular workers," including those with low-paying, part-time jobs, who make up 38% of all employees in Japan.
Non-regular workers account for roughly three quarters of those employed by restaurants and hotels, many of which were hit hard by the pandemic, according to the labour ministry.
A government survey showed more than 40,000 workers, about 15,000 of whom are non-regular workers, have been laid off since February.
Some economists estimate the jobless rate would be closer to 4% if furloughed workers were included in the official figures.
More broadly, the downturn has affected both those at the start and end of their careers.
Some analysts expect Japan's official jobless rate to rise to a record 5.5% hit during the 2009 global financial crisis.
That is a high level in Japan, where labour unions have historically accepted low wage offers to protect jobs - keeping the jobless rate low compared with other countries.
FXStreet reports that FX Strategists at UOB Group noted that EUR/USD faces further upside if close above the 1.1915 level.
24-hour view: “We highlighted yesterday that ‘there is room for EUR to edge higher and test the 1.1880 resistance’. We added, for today, ‘a sustained rise above this level is not expected’. Our view was not wrong as EUR rose to a high of 1.1880 before ending the day on a firm note at 1.1869 (+0.24%). While in overbought territory, the advance has room to extend further even though the odds for a sustained rise above the month-to-date high at 1.1915 are not high (next resistance is at 1.1945). Overall, the current upward pressure is expected to remain intact as long as EUR does not move below 1.1835 (minor support is at 1.1855).”
Next 1-3 week: “EUR tested the top of our expected consolidation range of 1.1660/1.1880 yesterday (high of 1.1880). The price action was not surprising as we highlighted yesterday (17 Aug, spot at 1.1845) that ‘while EUR could edge above 1.1880, only a NY closing above 1.1915 would indicate the start of fresh positive phase’. For now, the prospect for EUR to move clearly above 1.1915 is not high but it would increase quickly unless EUR moves and stays below 1.1815 within these few days. Looking forward, if there is a NY closing above 1.1915, EUR could strengthen towards 1.2000.”
EUR/USD
Resistance levels (open interest**, contracts)
$1.2036 (2368)
$1.2000 (1223)
$1.1968 (2747)
Price at time of writing this review: $1.1894
Support levels (open interest**, contracts):
$1.1805 (271)
$1.1781 (1424)
$1.1752 (738)
Comments:
- Overall open interest on the CALL options and PUT options with the expiration date September, 4 is 88719 contracts (according to data from August, 17) with the maximum number of contracts with strike price $1,0500 (5007);
GBP/USD
Resistance levels (open interest**, contracts)
$1.3331 (1416)
$1.3257 (1087)
$1.3198 (840)
Price at time of writing this review: $1.3136
Support levels (open interest**, contracts):
$1.3005 (503)
$1.2946 (1482)
$1.2911 (789)
Comments:
- Overall open interest on the CALL options with the expiration date September, 4 is 22750 contracts, with the maximum number of contracts with strike price $1,3800 (3416);
- Overall open interest on the PUT options with the expiration date September, 4 is 17356 contracts, with the maximum number of contracts with strike price $1,2900 (1482);
- The ratio of PUT/CALL was 0.76 versus 0.76 from the previous trading day according to data from August, 17
* - The Chicago Mercantile Exchange bulletin (CME) is used for the calculation.
** - Open interest takes into account the total number of option contracts that are open at the moment.
| Raw materials | Closed | Change, % |
|---|---|---|
| Brent | 45.13 | 0.94 |
| Silver | 27.44 | 3.86 |
| Gold | 1984.23 | 2.1 |
| Palladium | 2189.99 | 3.34 |
| Index | Change, points | Closed | Change, % |
|---|---|---|---|
| NIKKEI 225 | -192.61 | 23096.75 | -0.83 |
| Hang Seng | 164.33 | 25347.34 | 0.65 |
| ASX 200 | -49.8 | 6076.4 | -0.81 |
| FTSE 100 | 37.4 | 6127.44 | 0.61 |
| DAX | 19.32 | 12920.66 | 0.15 |
| CAC 40 | 9.01 | 4971.94 | 0.18 |
| Dow Jones | -86.11 | 27844.91 | -0.31 |
| S&P 500 | 9.14 | 3381.99 | 0.27 |
| NASDAQ Composite | 110.43 | 11129.73 | 1 |
| Time | Country | Event | Period | Previous value | Forecast |
|---|---|---|---|---|---|
| 01:30 | Australia | RBA Meeting's Minutes | |||
| 08:00 | U.S. | FOMC Member Brainard Speaks | |||
| 12:30 | U.S. | Building Permits | July | 1.258 | 1.313 |
| 12:30 | U.S. | Housing Starts | July | 1.186 | 1.237 |
| 22:45 | New Zealand | PPI Output (QoQ) | Quarter II | 0.1% | |
| 22:45 | New Zealand | PPI Input (QoQ) | Quarter II | -0.3% | |
| 23:50 | Japan | Core Machinery Orders, y/y | June | -16.3% | -17.6% |
| 23:50 | Japan | Core Machinery Orders | June | 1.7% | 2% |
| 23:50 | Japan | Trade Balance Total, bln | July | -268.8 | -77.6 |
| Pare | Closed | Change, % |
|---|---|---|
| AUDUSD | 0.72113 | 0.56 |
| EURJPY | 125.866 | -0.26 |
| EURUSD | 1.18714 | 0.26 |
| GBPJPY | 138.899 | -0.45 |
| GBPUSD | 1.31022 | 0.09 |
| NZDUSD | 0.65543 | 0.18 |
| USDCAD | 1.32186 | -0.33 |
| USDCHF | 0.90588 | -0.35 |
| USDJPY | 106.007 | -0.53 |


© 2000-2026. All rights reserved.
This site is managed by Teletrade D.J. LLC 2351 LLC 2022 (Euro House, Richmond Hill Road, Kingstown, VC0100, St. Vincent and the Grenadines).
The information on this website is for informational purposes only and does not constitute any investment advice.
The company does not serve or provide services to customers who are residents of the US, Canada, Iran, The Democratic People's Republic of Korea, Yemen and FATF blacklisted countries.
Making transactions on financial markets with marginal financial instruments opens up wide possibilities and allows investors who are willing to take risks to earn high profits, carrying a potentially high risk of losses at the same time. Therefore you should responsibly approach the issue of choosing the appropriate investment strategy, taking the available resources into account, before starting trading.
Use of the information: full or partial use of materials from this website must always be referenced to TeleTrade as the source of information. Use of the materials on the Internet must be accompanied by a hyperlink to teletrade.org. Automatic import of materials and information from this website is prohibited.
Please contact our PR department if you have any questions or need assistance at pr@teletrade.global.
transfers