- Analytics
- News and Tools
- Market News
CFD Markets News and Forecasts — 20-08-2020
| Time | Country | Event | Period | Previous value | Forecast |
|---|---|---|---|---|---|
| 00:30 | Japan | Nikkei Services PMI | August | 45.2 | |
| 00:30 | Japan | Manufacturing PMI | August | 45.2 | |
| 06:00 | United Kingdom | PSNB, bln | July | -34.8 | -29.3 |
| 06:00 | United Kingdom | Retail Sales (MoM) | July | 13.9% | 2% |
| 06:00 | United Kingdom | Retail Sales (YoY) | July | -1.6% | 0% |
| 07:15 | France | Services PMI | August | 57.3 | 56.3 |
| 07:15 | France | Manufacturing PMI | August | 52.4 | 53.7 |
| 07:30 | Germany | Services PMI | August | 55.6 | 55.1 |
| 07:30 | Germany | Manufacturing PMI | August | 51 | 52.5 |
| 08:00 | Eurozone | Manufacturing PMI | August | 51.8 | 52.9 |
| 08:00 | Eurozone | Services PMI | August | 54.7 | 54.5 |
| 08:30 | United Kingdom | Purchasing Manager Index Manufacturing | August | 53.3 | 53.8 |
| 08:30 | United Kingdom | Purchasing Manager Index Services | August | 56.5 | 57 |
| 10:00 | United Kingdom | CBI industrial order books balance | August | -46 | -35 |
| 12:30 | Canada | Retail Sales YoY | June | -18.4% | |
| 12:30 | Canada | Retail Sales, m/m | June | 18.7% | 24.5% |
| 12:30 | Canada | New Housing Price Index, MoM | July | 0.1% | |
| 12:30 | Canada | New Housing Price Index, YoY | July | 1.3% | |
| 12:30 | Canada | Retail Sales ex Autos, m/m | June | 10.6% | 15% |
| 13:45 | U.S. | Manufacturing PMI | August | 50.9 | 51.9 |
| 13:45 | U.S. | Services PMI | August | 50 | 51 |
| 14:00 | Eurozone | Consumer Confidence | August | -15 | -15 |
| 14:00 | U.S. | Existing Home Sales | July | 4.72 | 5.38 |
| 17:00 | U.S. | Baker Hughes Oil Rig Count | August | 172 |
FXStreet reports that Alvin Liew, Senior Economist at UOB Group, reviewed the latest set of trade balance data in the Japanese economy.
“Even though Japan’s exports contracted by the least in 4 months (on y/y terms), it was still a significant contraction of 19.2% y/y in July… This was also the 20th consecutive month of decline since December 2018, further extending the longest stretch of monthly contraction since 1987.”
“The decline in imports was a sharper -22.3% y/y… Imports have been on the decline for 14 straight months since May 2019.”
“The weak exports were offset by an even sharper decline in imports and resulted in Japan recording a surprise small trade surplus of JPY11.6bn for July (from a deficit of JPY269.3bn in June). On an adjusted basis, the trade balance showed a deficit of JPY34.8bn in July (narrowing from a JPY410.9bn deficit in June).”
“While we still believe the worst for Japan’s trade collapse to be in 2Q 2020, the subsequent recovery in 2H has not yet materialized as shown by July’s dismal exports decline. In the latest 2Q GDP report, external demand weakness added to the 2Q GDP collapse as the exports of goods and services shrunk by a massive -18.5% q/q and it overwhelmed the paltry 0.5% q/q decline of imports. As a result, net exports contributed -3ppts to the -7.8% q/q GDP contraction, meaning the fall in external demand was responsible for nearly 40% of Japan’s record GDP quarterly contraction. The current export trajectory will not help Japan’s recovery path unless there is an even sharper fall in imports (which in itself is also a bad thing, because a sharp decline in imports reflects severe weakness in Japan’s domestic demand).”
“We have further revised our forecast of Japan’s exports slightly lower and will now contract by 16.7% in 2020 from previous forecast of -16.6% (+5.6% in 2019) while imports may contract by 12.6% from previous forecast of -11.7% (+5.0% in 2019). Based on these latest projections, Japan is likely to record a trade deficit, amounting to JPY 6.3 trillion in 2020 from previous forecast of JPY 7 trillion (versus a trade deficit of JPY 3.6 trillion in 2019).”
Carsten Brzeski, Chief Economist, Eurozone and Global Head of Macro at ING, notes that the minutes of the European Central Bank's July meeting can be summarized with one word: “uncertainty”.
"The just-released minutes of the ECB’s July meeting illustrate that, at least in the current crisis, the ECB does not have any exclusive insights but is looking at the same developments like the rest of us. And the conclusion from looking at the available data is and was that the eurozone economy will see a sharp initial rebound, while the shape of the subsequent recovery is anything but clear. The word “uncertainty” appeared 20 times in the minutes.'
"During the discussion on the economic outlook, the ECB made the important distinction between rebound and recovery, by for example stating that “it was important to emphasise that, although economic activity was gaining momentum, there was no room for complacency.” The fact that the outlook for growth and inflation in the June staff projections was “conditional on substantial monetary policy support, while any premature tightening of financial conditions could put the ongoing recovery at risk”, shows that the current monetary stance is here to stay for a while."
"Looking ahead, the latest comments from senior ECB officials at the start of August underlined that the ECB remains on high alert. A blog entry by Chief Economist Philip Lane stressed that the ECB expects a very gradual recovery after the initial rebound and suggested a clear willingness to do more if needed in order to bring inflation back to target. In this regard, the next ECB meeting in September will probably come too early to take a more distinct position on the shape of the recovery but will definitely create some more headaches regarding the inflation outlook. The appreciation of the euro exchange rate over the summer months could lower the inflation forecasts almost mechanically by between 0.2 and 0.4 percentage points."
"As uncertainty will defintely not have disappeared at the September meeting, the meeting will come too early for new action. However, new downward revisions to the inflation forecasts could be the trigger for fresh monetary stimulus before year-end."
The Conference
Board announced on Thursday its Leading Economic Index (LEI) for the U.S. rose 1.4
percent m-o-m in July to 104.4 (2016 = 100), following a revised 3.0 percent
m-o-m advance in June (originally a 2.0 percent m-o-m gain).
Economists had
forecast an increase of 1.1 percent m-o-m.
“The US LEI
increased for the third consecutive month in July, albeit at a slower pace than
the sharp increases in the previous two months,” noted Ataman Ozyildirim,
Senior Director of Economic Research at The Conference Board. “Despite the
recent gains in the LEI, which remain fairly broad-based, the initial
post-pandemic recovery appears to be losing steam. The LEI suggests that the
pace of economic growth will weaken substantially during the final months of
2020.”
The report also
revealed the Conference Board Coincident Economic Index (CEI) for the U.S. went
up 1.2 percent m-o-m in July to 99.2, following a 2.9 percent m-o-m climb in June.
Meanwhile, its Lagging Economic Index (LAG) for the U.S. declined 1.0 percent
m-o-m in July to 109.2, following a 2.3 percent m-o-m drop in June.
The
Manufacturing Business Outlook Survey, released by the Federal Reserve Bank of
Philadelphia on Thursday, revealed the region's manufacturing activity
continued to grow in August, albeit at a slower pace than in the previous
month.
According to
the survey, the diffusion index for current general activity fell from 24.1 in
July to 17.2 this month, its third positive reading after reaching long-term
lows in the spring.
Economists had
forecast the index to decrease to 21.0.
A reading above
0 signals expansion, while a reading below 0 indicates contraction.
According to
the report, the new orders index decreased 4 points to 19.0, while the
shipments index fell 5.9 points to 9.4 and the employment index tumbled 11.1 points
to 9.0 but stayed in positive territory for the second consecutive month. Meanwhile,
most of the future indicators of the survey remained elevated, suggesting that
the firms expect growth over the next six months.
FXStreet notes that fear of summer vacation-related increases in COVID-19 cases may mar the recovery path in Europe. Further reimposing of restrictions could dampen EUR’s recent gains, according to economists at Westpac.
“The European summer of lockdown easing has been scarred by resurgent COVID cases from Spain and France and through Croatia, Greece and other Eastern European nations. Concerns over ‘reckless’ youths with limited symptoms spreading COVID more widely may trigger greater reimposing of travel and social distancing restrictions and so dampen the path of recent activity rebounds.”
“The process of ratifying the EU Recovery Fund is effectively on hold at present, but media reports of the Frugal Four meeting to discuss how to ensure their related budget rebates if the Recovery Fund proceeds have raised some concerns that the path to ratification may be less smooth than hoped.”
“The coming seven days will see the release of critical surveys, notably flash Aug PMIs and Germany’s IFO. Any sign of COVID concerns dampening activity could see a slide in confidence and add to the risk of retracements of the recent uptrends in EUR/USD even if the underlying trend of USD weakness is likely to persist into the US election.”
- Thinks U.S. stock market is "correctly portraying" V-shaped recovery
- Says Trump administration remains engaged on Phase 1 trade deal with China
- U.S. Trade Representative is pleased with the progress ıunder Phase 1 trade deal
- "Commodity piece" of the deal with China looks good
- Sees 20% growth in the third and fourth quarters
- Sees single-digit unemployment numbers possible in November
U.S. stock-index futures fell on Thursday, as investors reassessed their expectations for the U.S. economy’s recovery after grim outlook from the Fed and disappointing weekly jobless claims.
Global Stocks:
Index/commodity | Last | Today's Change, points | Today's Change, % |
Nikkei | 22,880.62 | -229.99 | -1.00% |
Hang Seng | 24,791.39 | -387.52 | -1.54% |
Shanghai | 3,363.90 | -44.23 | -1.30% |
S&P/ASX | 6,120.00 | -47.60 | -0.77% |
FTSE | 6,024.21 | -87.77 | -1.44% |
CAC | 4,909.08 | -68.15 | -1.37% |
DAX | 12,811.90 | -165.43 | -1.27% |
Crude oil | $42.74 | -0.86% | |
Gold | $1,947.90 | -1.14% |
(company / ticker / price / change ($/%) / volume)
3M Co | MMM | 163 | -0.97(-0.59%) | 8495 |
ALCOA INC. | AA | 15.23 | -0.08(-0.52%) | 14131 |
ALTRIA GROUP INC. | MO | 43.55 | -0.10(-0.23%) | 4354 |
Amazon.com Inc., NASDAQ | AMZN | 3,261.00 | 0.52(0.02%) | 32717 |
American Express Co | AXP | 95.87 | -1.02(-1.05%) | 4957 |
AMERICAN INTERNATIONAL GROUP | AIG | 29.45 | -0.41(-1.37%) | 4111 |
Apple Inc. | AAPL | 464.01 | 1.18(0.26%) | 320672 |
AT&T Inc | T | 29.65 | -0.08(-0.27%) | 102180 |
Boeing Co | BA | 168.85 | -0.42(-0.25%) | 152634 |
Caterpillar Inc | CAT | 137.65 | -0.37(-0.27%) | 2081 |
Chevron Corp | CVX | 85.8 | -0.59(-0.68%) | 10050 |
Cisco Systems Inc | CSCO | 41.71 | -0.16(-0.38%) | 38698 |
Citigroup Inc., NYSE | C | 49.7 | -0.59(-1.17%) | 123101 |
Deere & Company, NYSE | DE | 191.01 | -0.98(-0.51%) | 1811 |
E. I. du Pont de Nemours and Co | DD | 55.54 | -0.73(-1.29%) | 1669 |
Exxon Mobil Corp | XOM | 41.66 | -0.30(-0.72%) | 62506 |
Facebook, Inc. | FB | 262.4 | -0.19(-0.07%) | 42085 |
FedEx Corporation, NYSE | FDX | 206 | -1.88(-0.90%) | 2802 |
Ford Motor Co. | F | 6.82 | -0.05(-0.73%) | 344004 |
Freeport-McMoRan Copper & Gold Inc., NYSE | FCX | 14.7 | -0.24(-1.61%) | 84026 |
General Electric Co | GE | 6.36 | -0.02(-0.31%) | 682485 |
General Motors Company, NYSE | GM | 28.91 | -0.31(-1.06%) | 22589 |
Goldman Sachs | GS | 201.42 | -1.60(-0.79%) | 17157 |
Google Inc. | GOOG | 1,542.90 | -4.63(-0.30%) | 2247 |
Home Depot Inc | HD | 281.1 | -1.76(-0.62%) | 17763 |
Intel Corp | INTC | 49.87 | 1.54(3.19%) | 1051923 |
International Business Machines Co... | IBM | 123.2 | -0.64(-0.52%) | 5254 |
Johnson & Johnson | JNJ | 150.02 | -0.37(-0.25%) | 21362 |
JPMorgan Chase and Co | JPM | 97.47 | -1.08(-1.10%) | 54960 |
McDonald's Corp | MCD | 208.1 | -1.41(-0.67%) | 1753 |
Merck & Co Inc | MRK | 84.5 | -0.53(-0.62%) | 12881 |
Microsoft Corp | MSFT | 209.59 | -0.11(-0.05%) | 59295 |
Nike | NKE | 107.78 | -0.61(-0.56%) | 5818 |
Pfizer Inc | PFE | 38.08 | -0.18(-0.47%) | 19420 |
Procter & Gamble Co | PG | 134.75 | -1.02(-0.75%) | 3097 |
Starbucks Corporation, NASDAQ | SBUX | 77.11 | -0.52(-0.67%) | 6653 |
Tesla Motors, Inc., NASDAQ | TSLA | 1,869.00 | -9.53(-0.51%) | 106064 |
The Coca-Cola Co | KO | 47.15 | -0.22(-0.46%) | 17320 |
Travelers Companies Inc | TRV | 112.51 | -0.69(-0.61%) | 1308 |
Twitter, Inc., NYSE | TWTR | 38.84 | -0.05(-0.12%) | 19477 |
UnitedHealth Group Inc | UNH | 313.27 | -2.13(-0.68%) | 1972 |
Verizon Communications Inc | VZ | 59 | -0.05(-0.08%) | 2638 |
Visa | V | 200.01 | -0.98(-0.49%) | 10622 |
Wal-Mart Stores Inc | WMT | 131.91 | -0.50(-0.38%) | 35095 |
Walt Disney Co | DIS | 127 | -0.77(-0.60%) | 14859 |
Yandex N.V., NASDAQ | YNDX | 63.82 | 1.36(2.18%) | 344823 |
FXStreet reports that the Credit Suisse analyst team notes that the S&P 500 has again rejected its 3394 record high and with a small bearish ‘reversal day’ in place and a growing momentum divergence, the risk for a correction lower is increasing sharply, with a close below the 13-day average at 3348 needed to confirm.
“S&P 500 move briefly to a new record high above 3394, but with strength capped again ahead trend resistance from early June, today seen at 3409 and the subsequent retreat has seen a small bearish ‘reversal day’ established. With RSI momentum still holding a bearish divergence and now threatening a small top the risk for a correction lower is seen growing steadily.”
“Beneath 3370 should see the immediate risk stay lower for a test of the 13-day exponential average at 3348. A close below here is needed to suggest a correction lower is finally underway with support then seen next at 3326, then gap support from early August at 3317/07.”
“Above 3392 is needed to ease the immediate downside bias for a move back to 3400. Beyond here can negate yesterday’s bearish session for strength to trend resistance at 3409 initially, then more importantly at 3432/36.”
The data from
the Labor Department revealed on Thursday the number of applications for
unemployment unexpectedly rose last week, signaling that the U.S. labor
market is continuing to struggle in the grip of the coronavirus pandemic
According to
the report, the initial claims for unemployment benefits totaled 1,106,000 for
the week ended August 15. That brought the number of job losses over the past
twenty-two weeks (since the U.S. went into coronavirus lockdown in mid-March)
to near 57.4 million.
Economists had
expected 925,000 new claims last week.
Claims for the
prior week were revised upwardly to 971,000 from the initial estimate of
963,000.
Meanwhile, the
four-week moving average of claims fell to 1,175,750 from an upwardly revised
1,254,750 in the previous week.
Continuing
claims decreased to 14,844,000 million from a downwardly revised 15,480,000 in
the previous week.
| Time | Country | Event | Period | Previous value | Forecast | Actual |
|---|---|---|---|---|---|---|
| 06:00 | Germany | Producer Price Index (YoY) | July | -1.8% | -1.8% | -1.7% |
| 06:00 | Germany | Producer Price Index (MoM) | July | 0% | 0.1% | 0.2% |
| 06:00 | Switzerland | Trade Balance | July | 2.74 | 2.58 | |
| 09:00 | Eurozone | Construction Output, y/y | June | -10.5% | -5.9% | |
| 11:30 | Eurozone | ECB Monetary Policy Meeting Accounts | ||||
| 12:30 | U.S. | Continuing Jobless Claims | August | 15486 | 15000 | 14 |
| 12:30 | U.S. | Philadelphia Fed Manufacturing Survey | August | 24.1 | 21 | 17.2 |
| 12:30 | U.S. | Initial Jobless Claims | August | 963 | 925 | 1 |
EUR traded mixed against other major currencies in the European session on Thursday as investors assessed the account of the ECB’s monetary policy meeting on July 15-16. The euro rose against AUD and NZD, fell against GBP, CHF and JPY, and was little changed against USD and CAD.
The accounts revealed that the ECB’s Governing Council was cautioned that the recent positive market developments were not fully backed by economic data and might be based on overly optimistic expectations about the European Council’s recovery package and about progress on developing a vaccine. In addition, the policymakers acknowledged that uncertainty about the economic outlook remained elevated.
The ECB released account of its July 15-16 monetary policy meeting. It noted that:
- While financial market conditions had continued to normalize since ECB’s June monetary policy meeting, they remained tighter and more fragile than before the pandemic;
- Monetary and fiscal policy measures had brought about a considerable improvement in financial conditions since the height of coronavirus crisis;
- Recent market developments were not fully backed by economic data and might be based on overly optimistic expectations about the European Council’s recovery package and about progress on developing a vaccine;
- Uncertainty about the economic outlook remained elevated;
- With regard to PEPP, the flexibility of the programme was highlighted as key element of its effectiveness and efficiency in supporting transmission of monetary policy over time;
- The argument was also made that flexibility of the PEPP suggested that net purchase envelope should be considered a ceiling rather than a target;
- The current presumption was that the PEPP envelope would have to be used in full;
- Governing Council had to await further data to better assess future path of economy and extent to which inflation was returning to its pre-crisis trajectory within projection horizon
FXStreet reports that Lee Sue Ann, Economist at UOB Group, gives her assessment on the July’s inflation figures in the UK.
“Inflation in the UK jumped unexpectedly in July to its highest rate since March, in a blow to households already struggling from the COVID-19 pandemic. CPI rose to 1.0% y/y from 0.6% y/y in June, above expectations for an unchanged rate of 0.6% y/y. The latest CPI figure was pushed up by clothing prices and household items, as the COVID-19 pandemic meant stores reduced the number of discounted items from last year.”
“Core inflation, which excludes volatile energy, food, alcohol and tobacco prices, also rose to 1.8% y/y from 1.4% y/y in June, and against expectations for a reading of 1.2% y/y. Month-on-month, consumer prices rose 0.4% m/m in July, accelerating from a rise of 0.1% m/m in June.”
“Even though this is still well below the Bank of England (BOE)’s target of 2%, the climb in inflation certainly cofounds the expectations of the central bank. That said, the rise is expected to be short-lived. The BOE is expecting inflation to turn briefly negative in the near term (falling to -0.3% m/m in August) due to lower energy prices and the impact of government measures to support businesses.”
FXStreet suggests that near-term downside risks remain, due to a dovish shift by the Reserve Bank of New Zealand (RBNZ) and emerging second COVID wave in New Zealand. NZD/USD is extending the previous day’s sharp retracement slide from near two-week tops, trading around the 0.6530 mark, and a break below 0.6520 will cheer bears up, per Westpac.
“NZD/USD continues to look toppish but requires a break below 0.6520 to get excited about the bearish case. Such a break would signal 0.6300.”
“Recent events have been negative for the NZD: the Auckland region lockdown, and the dovish shift by the RBNZ last week. On that shift, the RBNZ expanded its QE program, and signalled a lower OCR/low-cost bank loan package could be ready by November for potential deployment. NZ interest rates have fallen, and will probably continue to do so since markets have so far priced a 30bp fall – well short of the 75bp cut Westpac is forecasting.”
“NZD/USD falls may be limited since we remain bearish on the USD. Greater underperformance will be seen vs the AUD.”
FXStreet notes that EUR/USD has seen an abject failure to hold its break above key resistance at 1.1916/26, with daily RSI and MACD momentum never confirming the new highs. Therefore, economists at Credit Suisse are set for a more protracted consolidation phase. The immediate risk is seen lower with support at 1.1811 then 1.1783/78.
“EUR/USD has seen an abrupt reversal and rejection of its break to new cycle highs above 1.1916/26 and with daily RSI and MACD momentum having failed to even make new highs and thus hold bearish divergences, this suggests it has been too soon to look for a direct resumption of the uptrend and instead it looks like we are set for a more protracted corrective phase prior to the uptrend resuming.”
“Below support from the 13-day average at 1.1811 on a closing basis can add weight to this view with support then seen next at 1.1783/78 – the lows from the end of last week and 23.6% retracement of the rally from late June – which we would look to try and hold at first. A break can expose the beginning of what we see as more important support, starting at 1.1721 and stretching down to 1.1710.”
“Resistance is seen at 1.1893 initially, with a move above 1.1923 needed to ease the immediate downside bias for strength back to 1.1949/53, then 1.1966 and eventually 1.2145/55.”
FXStreet notes that EUR/CHF climbed through the 1.0818 two-year downtrend to 1.0848 on Wednesday, the highest level since June 8. Karen Jones, Team Head FICC Technical Analysis Research at Commerzbank, targets the June peak at 1.0915.
“EUR/CHF has eroded the 2018-2020 downtrend at 1.0818 and the recent high at 1.0838 is exposed. A close above 1.0838 is needed (favoured) to target the 1.0915 June high and the 1.1058 October 2019 high. We look for an imminent break higher, dips lower have remained shallow and longer-term, we favour a break higher.”
“The market will find initial support at the 1.0736 the mid-August low. The July low and the 78.6% Fibonacci retracement at 1.0607/1.0593 are regarded as stronger support that is expected to hold.”
NVIDIA (NVDA) reported Q2 FY 2020 earnings of $2.18 per share, beating analysts’ consensus estimate of $1.97 per share.
The company’s quarterly revenues amounted to $3.87 bln (+50% y/y), beating analysts’ consensus estimate of $3.65 bln.
The company also announced upside guidance for Q3 FY 2020, projecting revenues of $4.40 bln, +/-2%, versus analysts’ consensus estimate of $3.97 bln.
NVDA fell to $480.00 (-1.14 %) in pre-market trading.

FXStreet reports that Westpac’s economists apprise that the Canadian dollar is finally playing catch up to the broader risk sentiment recovery but the loonie still likely holds to a 1.30-1.35 range into year’s end.
“Despite firmer energy prices and much better virus management than the US, the investment community continues to resist CAD, CFTC positioning showing specs still running sizeable CAD shorts at 30k contacts. That may well fuel some further near-term CAD upside, as will the persistently solid data run of late. While high-frequency mobility indicators show a levelling out in Canada’s recovery through August, traditional data continues to show the recovery gaining momentum.”
“Yet USD/CAD should still hold in a 1.30-1.35 range into year’s end. Medium-term CAD outlook still constrained by the economy’s leverage to a virus-compromised US outlook.”
FXStreet reports that with EUR/USD having nearly just reached the 1.20 target earlier this week, economists at Deutsche Bank now favor taking profit and see a more balanced outlook as September approaches. It is still possible EUR/USD goes for a small break above 1.20 for the rest of the year but they think consolidation around 1.20 is the most likely outcome.
“The euro range of 13 big figures so far has now reached what would be a ‘normal’ range for the year. A peak around 1.20 would be entirely ‘normal’. A move towards 1.23 would make the range extreme and suggest ultimate exhaustion. Similarly, we had identified 1.20 as a level where leveraged positioning on the CFTC would turn to a small long. This is indeed what has happened, so there is scope for a further extension in positioning up to the 2018 highs which would be equivalent to around 1.22. But more worryingly the broader CFTC metric of euro positioning has now reached record highs. Positioning is a bigger concern now.”
“Relative data surprises between the US and the rest of the world have turned back to flat from being extremely favourable to the US at the start of the year. US data can of course deteriorate further as the fiscal cliff unfolds, but on the other hand virus divergence is over with European COVID cases starting to accelerate again which could dampen European momentum as we head into Q4.”
“American yield exceptionalism can decline further, most notably via real yields if the Fed stays true to its word of the need for very accommodative policy. But in recent months the Fed has signaled aversion towards yield curve control and negative rates. More importantly, the FOMC minutes yesterday left an open question mark on whether the Fed would do more aggressive QE by the September meeting.”
“On the ECB side, we have now reached levels in the euro trade-weighted that have historically led to heightened risks of ECB verbal intervention. Meanwhile, the level of BTP-bund spreads has reached pre-COVID levels suggesting that the ECB backstop on Italy is fully priced in. In all, taking the sum of US real yields and BTP-bund spreads as a proxy of the key driver of higher EUR/USD this year it has reached all-time extremes.”
“There is of course scope for a EUR/USD extension above 1.20. US policy dysfunction has scope to turn uglier as the polarized phase of the US election materializes. The three-month run-up to the US election is the period where the market starts to pay more attention to the event. A further extension of these drivers would conveniently coincide with a build-up in more extreme positioning and ranges. But we would view any move above 1.20 as consistent with an over-shoot rather than a move to chase. Bottom line, EUR/USD around 1.20 is close to fair value as things stand.”
FXStreet reports that USD/CNH has now shifted its focus to the 6.8850 level, suggested FX Strategists at UOB Group.
24-hour view: “Yesterday, we held the view that ‘USD could drop below the overnight low of 6.9056 but odds for a breach of 6.8950 are not high’. While our view was not wrong as the decline in USD stopped at 6.8981, the strong rebound during NY hours was unexpected (overnight high of 6.9247). The rapid rebound is unlikely to be sustained but for today, USD could extend its gains to 6.9310 before a pullback can be expected (next resistance is at 6.9400). On the downside, support is at 6.9150 followed by 6.9050. For today, the 6.8981 low is not expected to come into the picture.”
Next 1-3 weeks: “We noted yesterday (18 Aug. spot at 6.9315) that ‘if there is a NY closing below 6.9300, it would indicate the start of a period of sustained weakness in USD that could lead to a move to 6.9050, possibly even to 6.8850’. We added, ‘the prospect for the start of a negative phase is rather high unless USD moves above 6.9400 within these 1 to 2 days’. USD subsequently dropped to within a few pips of 6.9050 (overnight low of 6.9056) before ending the day on a weak note at 6.9079 (-0.36%). In other words, the price actions suggest USD has moved into a negative phase and the next level to focus on is 6.8850. On the upside, the ‘strong resistance’ level at 6.9400 remains unchanged for now.”
According to the report from Eurostat, in June 2020, a month marked by some relaxation of COVID-19 containment measures in many Member States, the seasonally adjusted production in the construction sector rose by 4.0% in the euro area and by 2.9% in the EU, compared with May 2020. In May 2020, production in construction increased by 29.4% in the euro area and by 22.3% in the EU. In June 2020 compared with June 2019, production in construction decreased by 5.9% in the euro area and by 5.8% in the EU.
In the euro area in June 2020, compared with May 2020, building construction increased by 4.5% and civil engineering by 2.3%. In the EU, building construction increased by 3.2% and civil engineering by 1.8%.
In the euro area in June 2020, compared with June 2019, building construction decreased by 6.6% and civil engineering by 2.6%. In the EU, building construction decreased by 6.2% and civil engineering by 3.2%.
Among Member States for which data are available, the largest decreases in production in construction were observed in Slovakia (-17.8%), Hungary (-15.7%) and Slovenia (-15.3%). Increases were observed in Romania (+6.9%), Germany (+1.4%), Finland (+1.2%) and the Netherlands (+0.8%).
Reuters reports that the Swiss National Bank (SNB) and other major central banks will cut the frequency of 7-day dollar liquidity operations conducted in partnership with the U.S. Federal Reserve, the SNB said on Thursday.
“In view of continuing improvements in U.S. dollar funding conditions and the low demand at recent 7-day maturity U.S. dollar liquidity-providing operations, the Bank of England, the Bank of Japan, the European Central Bank and the Swiss National Bank, in consultation with the Federal Reserve, have jointly decided to further reduce the frequency of their 7-day operations from three times per week to once per week,” Switzerland’s central bank said in a statement, adding the change would become effective on Sept. 1.
The central banks will continue to hold weekly operations with an 84-day maturity, it said.
FXStreet reports that the scope for a USD correction stronger remains rooted in the continued spread of COVID globally relative to the US. EUR/USD, which plunged on Wednesday to 1.1850 from near two-year highs of 1.1956, has benefitted from a relatively positive outlook for growth driven in part by COVID improving relative to the US. That is no longer the case and has the potential to undermine the euro over the coming weeks, per MUFG Bank.
“The spread remains notable in the US but the direction of travel at least shows a slowing of the spread. The 7-day average of the daily change in COVID cases in the US continues to drop notably, falling from a peak of 67k on 22nd July to 47.5k as of yesterday. That’s in sharp contrast to the situation in Europe.”
“The largest European countries impacted by COVID have seen the 7-day average daily increase in COVID move from 2.4k on 14 July to 12.5k on Tuesday. The impact of this is not yet evident in the official economic data but the high-frequency figures show a clear flattening of activity – this will undoubtedly come through in the official data.”
“Spain is worthy of particular mention here. There were 3,715 new cases reported yesterday, that’s the highest one-day increase since 23rd April. Elsewhere the outright increases are relatively small but the direction of travel is a concern. In Italy, there were 642 new cases yesterday, the highest total since 23rd May. Increases in Germany resulted in Chancellor Merkel suspending any further relaxing of restrictions.”
“Market participants will become increasingly sensitive to further evidence of spread and until we see these trends in Europe turn lower again, the risk/reward for EUR is set to remain skewed to the downside.”
eFXdata reports that Bank of America Global Research discusses CHF outlook and maintains a structural bearish bias on GBP/CHF over the coming months.
"CHF continues to defy convention. Against the backdrop of an improving market landscape (declining financial stress, improving liquidity conditions), the currency has remained relatively resilient. In TWI terms, CHF is still comfortably in positive territory, but more significantly is trading at its highest levels since the peg broke in January 2015," BofA notes.
"August is a notoriously difficult month to extract trends, but recent resilience bodes well for CHF heading into the rest of the year and we reiterate our bearish stance on GBP/CHF," BofA adds.
Reuters reports that China and the United States have agreed to hold trade talks "in the coming days" to evaluate the progress made on their Phase 1 trade deal at the six-month mark after it was reached in January, China's commerce ministry said on Thursday.
Ministry spokesman Gao Feng made the comments at a weekly briefing held online, without elaborating.
FXStreet reports that falling inflation means the Reserve Bank of New Zealand (RBNZ) needs to take vigorous action. The RBNZ's next tool will be a negative OCR combined with loans to banks, and economists at Westpac expect this will be deployed next year. The RBNZ’s aggressive monetary policy will dampen the rise and rise of the kiwi.
“The outlook is clear: inflation is set to fall, and the RBNZ will need to act aggressively if it is to meet its targets. We now have confirmation of the predicted plunge in inflation, with the annual rate stepping down from 2.5% to 1.5% at the June reading. We forecast that inflation will drop to 0.2% next year, and will remain below 1% until mid-2022.”
“The RBNZ estimates that, in order to return inflation to 2% and reach full employment, it will need to deliver monetary stimulus equivalent to an OCR of -2% over a period of two years. The RBNZ is planning to achieve the equivalent of a -2% OCR by setting the actual OCR at 0.25% and buying about a billion dollars per week worth of bonds under the Large Scale Asset Purchase (LSAP) programme (money printing).”
“We have long been of the view that the RBNZ will cut the OCR to -0.5% in April next year. For some months we have been the only bank forecasting a negative OCR. However, the idea is now likely to gain broader acceptance after the RBNZ said in its August MPS that a combination of a negative OCR and a term lending facility for banks (low-interest loans) is its preferred next monetary policy tool. We are now forecasting that the OCR will return to positive territory only in 2023, and will rise only slowly after that.”
“The key global exchange rate trend has been weakness in the USD, and this is likely to continue due to the ongoing spread of Covid-19 in the US. However, the NZD could experience weakness of its own, if the RBNZ continues with its aggressive quantitative easing and adopts a negative OCR, as we expect. We see no reason to forecast large moves in either direction for the NZD/USD exchange rate, particularly because this exchange rate is currently very close to its long-run inflation-adjusted average.”
“New Zealand’s more aggressive approach to monetary stimulus will probably set it apart from Australia. We expect the NZD/AUD exchange rate to fall from its current high level to around 88 cents at the time New Zealand moves to a negative OCR, which would bring the cross closer to the historical average.”
Reuters reports that former U.S. President Barack Obama on Wednesday assailed his successor, Donald Trump, as deeply unfit for the office he occupies and argued that voting for his former No. 2, Joe Biden, was necessary to ensure the survival of American democracy.
“He’s shown no interest in putting in the work; no interest in finding common ground; no interest in using the awesome power of his office to help anyone but himself and his friends; no interest in treating the presidency as anything but one more reality show that he can use to get the attention he craves,” Obama said of Trump during the third night of the Democratic National Convention.
After avoiding direct criticism for most of Trump’s first term, the scathing broadsides from Obama constituted an unusually harsh appraisal of one president by another - although Trump has rarely hesitated to attack Obama, often leveling accusations of misconduct without evidence.
Obama blamed Trump for the 170,000 Americans who have died from the coronavirus, the millions of jobs lost to the ensuing recession and the diminishment of the country’s democratic principles at home and abroad.
His assertion that Trump, a Republican, is incapable of meeting the demands of the presidency echoed the remarks from his wife, Michelle Obama, on Monday, that Trump “simply cannot be who we need him to be.”
“Donald Trump hasn’t grown into the job because he can’t,” Obama said. “And the consequences of that failure are severe.”
| Time | Country | Event | Period | Previous value | Forecast | Actual |
|---|---|---|---|---|---|---|
| 06:00 | Germany | Producer Price Index (YoY) | July | -1.8% | -1.8% | -1.7% |
| 06:00 | Germany | Producer Price Index (MoM) | July | 0% | 0.1% | 0.2% |
| 06:00 | Switzerland | Trade Balance | July | 2.74 | 2.58 |
During today's Asian trading, the US dollar exchange rate changed slightly against the euro and yen, and traders continued to evaluate the minutes of the July meeting of the US Federal reserve system, which was published the day before.
The ICE Dollar index, which shows the value of the US dollar against six major world currencies, rose 0.20% from the previous day.
Fed officials during the July meeting noted high uncertainty about the prospects of the US economy in connection with the coronavirus pandemic, according to the minutes of the Federal open market committee (FOMC) meeting on July 28-29. The participants of the meeting expressed the opinion that the American economy will probably need additional support, but did not decide when they should start using new tools.
The exchange rate of the chinese yuan declined slightly against the dollar. The People's Bank of China (PBOC) kept its benchmark annual interest rate at 3.85%. The country's Central Bank left the rate unchanged for the fourth month in a row after cutting 20 basis points in April to revive the economy, which has been hit hard by the coronavirus pandemic. The rate on five-year loans was left at 4.65%, the PBOC said on Thursday. This decision coincided with market expectations. Last week, the PBOC kept the rate on one-year loans under the medium-term lending program (MLF) at 2.95% per annum.
FXStreet reports that further upside in NZD/USD is not ruled out, although a convincing move above 0.6660 remains unlikely in the short-term horizon, suggested FX Strategists at UOB Group.
24-hour view: “Our view for NZD yesterday was ‘here is scope for NZD to edge above the strong resistance at 0.6620’ but ‘the next resistance at 0.6660 is unlikely to be challenged’. Our expectation was not wrong as NZD topped at 0.6652 before dropping sharply during NY hours. The sharp drop appears to be running ahead of itself and further sustained weakness in NZD is unlikely. For today, NZD is more likely to consolidate and trade between 0.6540 and 0.6590.”
Next 1-3 weeks: “We noted yesterday (18 Aug, spot at 0.6560) that ‘the mild downward pressure has eased but it is too early to expect a sustained rebound and we expected NZD to “consolidate and trade between 0.6500 and 0.6620 for a while’. NZD subsequently popped to a high of 0.6609 before closing on a strong note at 0.6601 (+0.67%). While NZD has not moved above the top of our expected range, upward momentum has improved and NZD could edge higher towards 0.6660. At this stage, the prospect for a sustained advance above 0.6660 is not high. On the downside, a breach 0.6525 would indicate the current mild upward pressure has eased.”
RTTNews reports that China's left its benchmark interest rates unchanged on Thursday, as the economy showed signs of robust recovery.
The one-year loan prime rate was retained at 3.85 percent and the five-year loan prime rate was maintained at 4.65 percent.
The one-year and five-year loan prime rates were last reduced in April. The one-year loan prime rate was lowered by 20 basis points and five-year rate by 10 basis points in April.
Markets had also expected the rates to be maintained today as the rate on its medium-term lending facility or MLF, which serves as a guide for the LPR, was retained early this month.
The loan prime rate is fixed monthly based on the submission of 18 banks, though Beijing has influence over the rate-setting. This new lending rate replaced the central bank's traditional benchmark lending rate in August 2019.
Iris Pang, an ING economist said she expects monetary policy on interest rates to remain the same for the rest of 2020 as China's Covid-19 infection cases have been stabilized.
There will be no broad-based RRR cut, but there could be targeted RRR cut or targeted re-lending for SMEs and the agricultural sector, the economist noted. In the meantime, if liquidity tightens, the central bank will fine-tune it via daily open market operations, Pang added.
It seems that policymakers see little need to engineer a further decline in bank lending rates given the relatively rapid economic recovery and the continued prop from loose fiscal policy, which is set to drive a further improvement in activity in the coming months, Julian Evans-Pritchard, an economist at Capital Economics, said.
The economist said the next move in the LPR will be an increase, though probably not until next year once the economy has fully recovered and returned to its pre-virus growth path.
According to the report from Federal Statistical Office, in July 2020 the index of producer prices for industrial products decreased by 1.7% compared with the corresponding month of the preceding year. In June the annual rate of change all over had been –1.8%, as reported by the Federal Statistical Office. Compared with the preceding month June the overall index rose by 0.2% in July 2020 (0.0% in June). Economists had expected a 0.1% increase.
Energy prices as a whole decreased by 5.8%. On an annual basis, prices of petroleum products were down 16.7%, prices of natural gas (distribution) decreased by 14.1%.
The overall index disregarding energy was 0.5% down on July 2019.
Prices of intermediate goods decreased by 2.3% compared to July 2019. Prices decreased especially regarding basic iron, steel and ferro-alloys (-9.0%) and basic chemicals (-7.0%). Prices of cereal flour were down 3.4%. By contrast, prices of precious metals increased by 22.3% compared to July 2019. Prices of ready-mixed concrete rose by 3.7%.
Prices of non-durable consumer goods increased by 0.5% compared to July. Food prices were up 0.1% on July 2019. The price of sugar increased by 18.4%. Prices of meat and poultry meat products rose by 3.5%. Butter prices were down 9.6% compared to July 2019.
Prices of capital goods increased by 1.1% compared to July 2019, durable consumer goods by 1.6%.
Compared to the June 2020 energy prices rose by 1.1%, prices of durable consumer goods by 0.1% while prices of capital goods were unchanged. Intermediate goods were 0.2% cheaper and non-durable consumer goods 0.3%.
EUR/USD
Resistance levels (open interest**, contracts)
$1.1963 (2725)
$1.1935 (2318)
$1.1913 (2354)
Price at time of writing this review: $1.1836
Support levels (open interest**, contracts):
$1.1799 (344)
$1.1777 (1289)
$1.1749 (789)
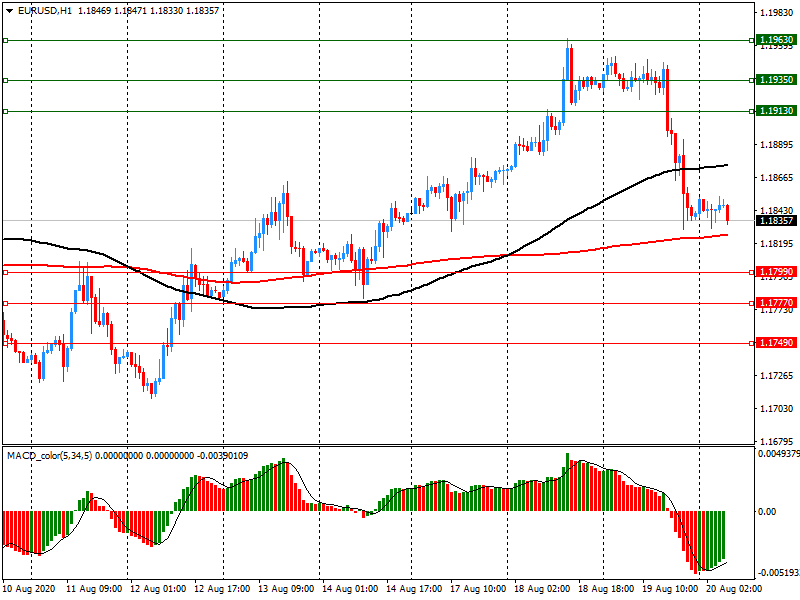
Comments:
- Overall open interest on the CALL options and PUT options with the expiration date September, 4 is 91559 contracts (according to data from August, 19) with the maximum number of contracts with strike price $1,0500 (5007);
GBP/USD
Resistance levels (open interest**, contracts)
$1.3257 (1108)
$1.3199 (828)
$1.3161 (1796)
Price at time of writing this review: $1.3077
Support levels (open interest**, contracts):
$1.3017 (569)
$1.2988 (506)
$1.2955 (1658)
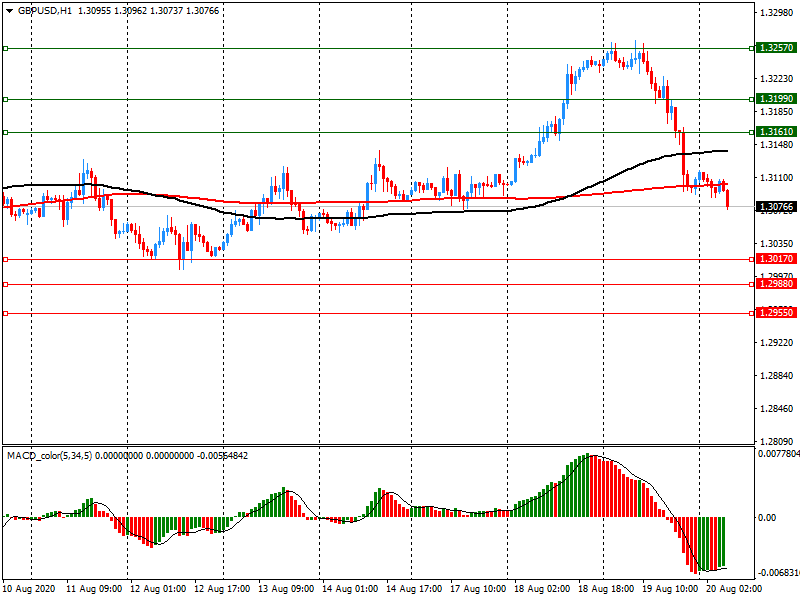
Comments:
- Overall open interest on the CALL options with the expiration date September, 4 is 23124 contracts, with the maximum number of contracts with strike price $1,3800 (3394);
- Overall open interest on the PUT options with the expiration date September, 4 is 18501 contracts, with the maximum number of contracts with strike price $1,3000 (1658);
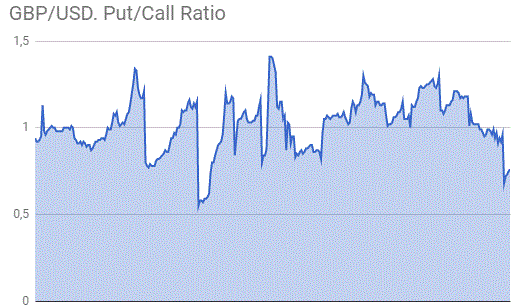
- The ratio of PUT/CALL was 0.80 versus 0.78 from the previous trading day according to data from August, 19
* - The Chicago Mercantile Exchange bulletin (CME) is used for the calculation.
** - Open interest takes into account the total number of option contracts that are open at the moment.
| Raw materials | Closed | Change, % |
|---|---|---|
| Brent | 45.1 | 0.38 |
| Silver | 26.63 | -3.69 |
| Gold | 1927.498 | -3.75 |
| Palladium | 2150.82 | -2.07 |
| Index | Change, points | Closed | Change, % |
|---|---|---|---|
| NIKKEI 225 | 59.53 | 23110.61 | 0.26 |
| Hang Seng | -188.47 | 25178.91 | -0.74 |
| KOSPI | 12.3 | 2360.54 | 0.52 |
| ASX 200 | 44.2 | 6167.6 | 0.72 |
| FTSE 100 | 35.36 | 6111.98 | 0.58 |
| DAX | 95.57 | 12977.33 | 0.74 |
| CAC 40 | 39.17 | 4977.23 | 0.79 |
| Dow Jones | -85.19 | 27692.88 | -0.31 |
| S&P 500 | -14.93 | 3374.85 | -0.44 |
| NASDAQ Composite | -64.38 | 11146.46 | -0.57 |
| Time | Country | Event | Period | Previous value | Forecast |
|---|---|---|---|---|---|
| 06:00 | Germany | Producer Price Index (YoY) | July | -1.8% | -1.8% |
| 06:00 | Switzerland | Trade Balance | July | 2.8 | |
| 06:00 | Germany | Producer Price Index (MoM) | July | 0.0% | 0.1% |
| 09:00 | Eurozone | Construction Output, y/y | June | -11.9% | |
| 10:00 | United Kingdom | CBI industrial order books balance | August | -46 | -35 |
| 11:30 | Eurozone | ECB Monetary Policy Meeting Accounts | |||
| 12:30 | U.S. | Continuing Jobless Claims | August | 15486 | 15000 |
| 12:30 | U.S. | Philadelphia Fed Manufacturing Survey | August | 24.1 | 21 |
| 12:30 | U.S. | Initial Jobless Claims | August | 963 | 925 |
| 14:00 | U.S. | Leading Indicators | July | 2% | 1.1% |
| 17:00 | U.S. | FOMC Member Daly Speaks | |||
| 23:01 | United Kingdom | Gfk Consumer Confidence | August | -27 | -25 |
| 23:30 | Japan | National CPI Ex-Fresh Food, y/y | July | 0.0% | 0.1% |
| 23:30 | Japan | National Consumer Price Index, y/y | July | 0.1% |
| Pare | Closed | Change, % |
|---|---|---|
| AUDUSD | 0.71826 | -0.79 |
| EURJPY | 125.556 | -0.16 |
| EURUSD | 1.18408 | -0.75 |
| GBPJPY | 138.984 | -0.38 |
| GBPUSD | 1.31078 | -0.98 |
| NZDUSD | 0.65595 | -0.63 |
| USDCAD | 1.32079 | 0.34 |
| USDCHF | 0.91427 | 1.25 |
| USDJPY | 106.034 | 0.61 |


© 2000-2026. All rights reserved.
This site is managed by Teletrade D.J. LLC 2351 LLC 2022 (Euro House, Richmond Hill Road, Kingstown, VC0100, St. Vincent and the Grenadines).
The information on this website is for informational purposes only and does not constitute any investment advice.
The company does not serve or provide services to customers who are residents of the US, Canada, Iran, The Democratic People's Republic of Korea, Yemen and FATF blacklisted countries.
Making transactions on financial markets with marginal financial instruments opens up wide possibilities and allows investors who are willing to take risks to earn high profits, carrying a potentially high risk of losses at the same time. Therefore you should responsibly approach the issue of choosing the appropriate investment strategy, taking the available resources into account, before starting trading.
Use of the information: full or partial use of materials from this website must always be referenced to TeleTrade as the source of information. Use of the materials on the Internet must be accompanied by a hyperlink to teletrade.org. Automatic import of materials and information from this website is prohibited.
Please contact our PR department if you have any questions or need assistance at pr@teletrade.global.
transfers