- Analytics
- News and Tools
- Market News
CFD Markets News and Forecasts — 19-10-2021
- NZD/USD bulls are moving in on critical hourly resistance.
- There are bullish fundamentals at play, but the rally is overextended, relative to historic price action.
NZD/USD has fallen from the highs of the experiential rally that .started on Oct 13 as the greenback started to tail off before the more recent catalyst in New Zealand's inflation data. At the time of writing, NZD/USD is trading at 0.7150 and flat ahead of the Tokyo open and fix that could kick start some price action in Asia today.
''The Kiwi is around 80bps higher than it was 24hrs ago, having benefited from a combination of USD weakness and its own credentials, with good performance seen on most crosses,'' analysts at ANZ Bank noted.
Earlier in the week, New Zealand's Consumer Price Index (CPI) was reported to have risen 2.2% in the third quarter, beating expectations and surging at the fastest pace in over a decade driven by housing-related costs and other supply constraints, data released on Monday showed.
Statistics New Zealand said in a statement. CPI rose 2.2% in the quarter ending September from a rise of 1.3% in the second quarter, the biggest quarterly movement since a 2.3% rise in the December 2010 quarter. Annual inflation surged 4.9% compared to a rise of 3.3% in the previous quarter, also the biggest annual movement in more than a decade.
The data beat analysts' expectations in a Reuters poll and forecasts of the Reserve Bank of New Zealand (RBNZ), both of which put the quarterly inflation rise at 1.4%, lifting annual inflation to 4.1%.
''While the reaction seems delayed and had been haphazard, the sharp move higher in short-end interest rates looks to now be impacting. Yesterday we changed our OCR call; we now expect six more hikes – one at each meeting between now and August, taking the OCR to 2%,'' analysts at ANZ Bank said, adding:
''Perhaps more importantly, we have also lifted our inflation forecasts. In an environment of still well-anchored inflation expectations, that speaks to the RBNZ being ahead of the pack and cyclically higher rates, which should benefit the NZD.''
NZD/USD technical analysis
- NZD/USD Price Analysis: Countertrend traders to eye 0.7050
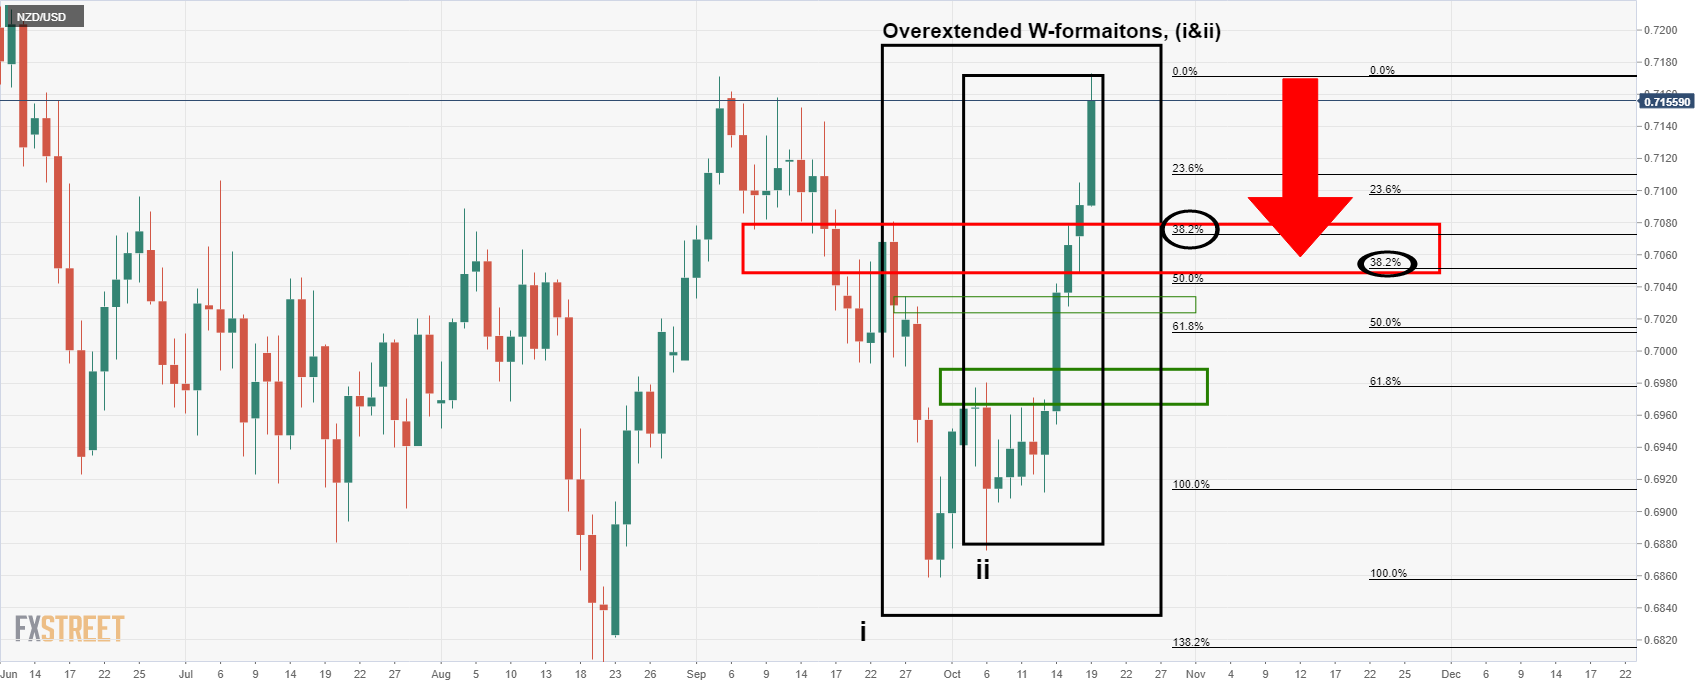
''The 38.2% Fibonacci channel between Wi and Wii offers a target area between 0.7080 and 0.7050 as the closest round numbers, the latter being aligned to the weekly counter trendline.''
From an hourly perspective, however, the price is moving in on the M-formation as follows:
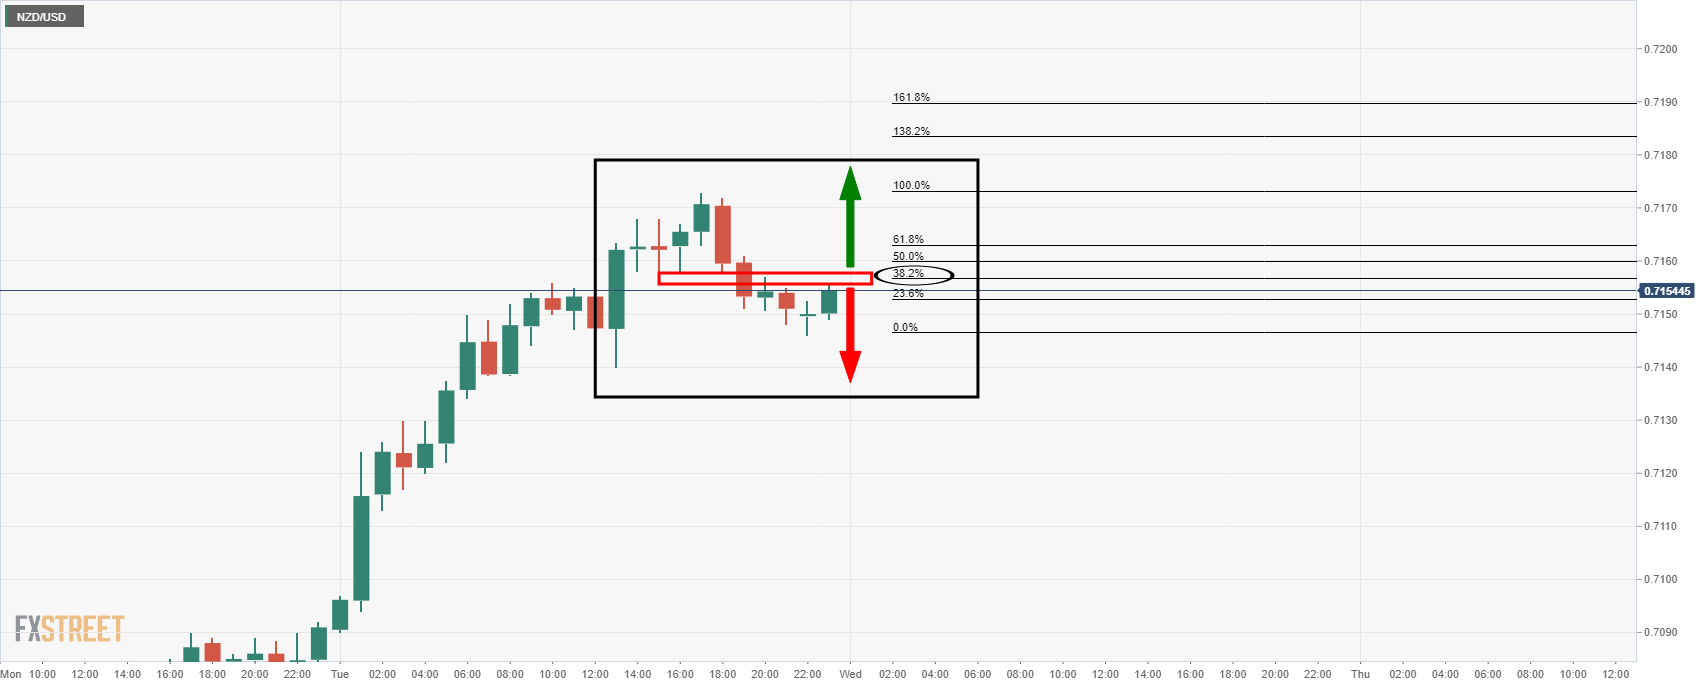
The price is making a 38.2% retracement to the neckline that would be expected to hold. This could lead to a downside 1-hour bearish impulse in the sessions ahead. If it breaks the neckline, then there will be prospects of some consolidation and a potential upside continuation from the newly formed bullish structure in coming sessions.
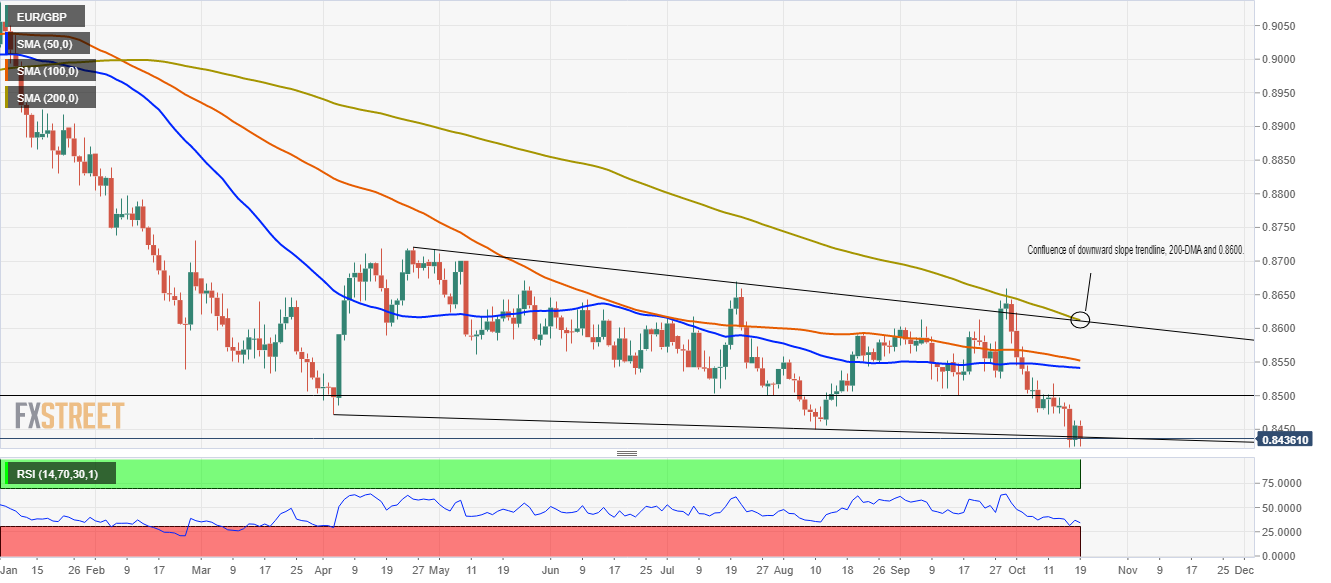
- EUR/GBP licks its wounds near 20-month low, stays inside bearish chart pattern.
- Downbeat momentum, sustained trading below 200-SMA favor sellers.
- Monthly horizontal hurdle adds to the upside barriers.
EUR/GBP stays defensive around 0.8430 amid Wednesday’s Asian session. In doing so, the cross-currency pair remains near the lowest levels since February 2020, test the last week, while staying inside a two-week-old descending trend channel.
Given the downbeat Momentum line and the pair’s inability to rebound from the multi-month low, EUR/GBP bears remain hopeful of visiting the 0.8400 threshold.
However, the support line of the stated channel, near the 0.8400 round figure, will restrict the quote’s further weakness.
Should EUR/GBP bears keep reins past 0.8400, the year 2020’s low near 0.8280 will be in focus.
Meanwhile, corrective pullback needs to defy the bearish chart pattern by crossing the channel’s resistance line, close to 0.8455 by the press time.
Following that, a horizontal area from September 16 and 200-SMA, respectively near 0.8500 and 0.8535, will challenge the EUR/GBP buyers.
EUR/GBP: Four-hour chart
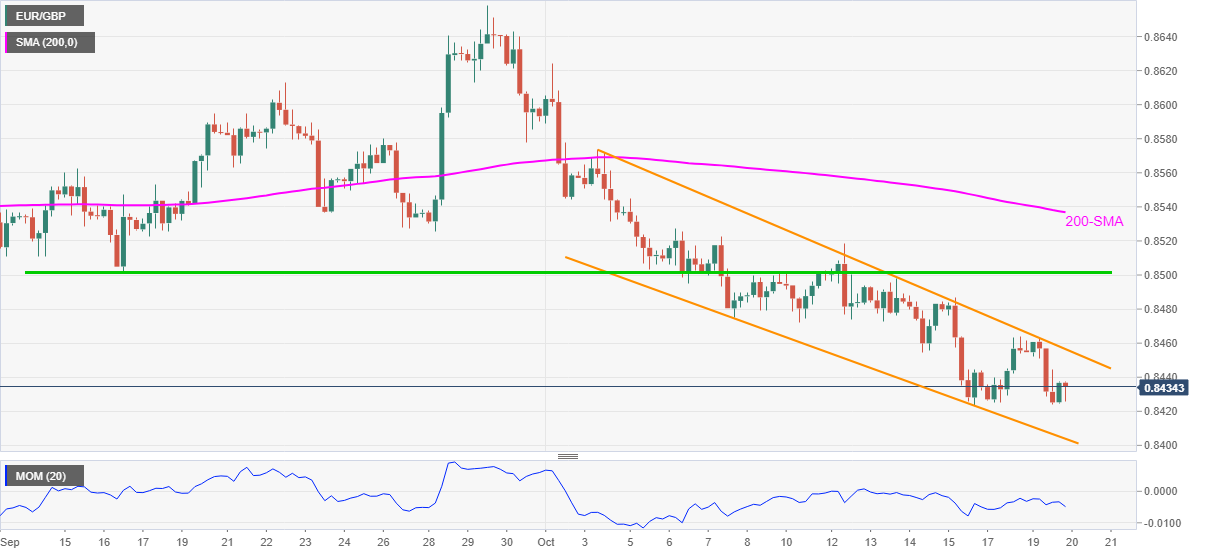
Trend: Bearish
- The GBP/JPY continue its rally for the third consecutive week, trades at five-month highs.
- Positive market sentiment weighs on the Japanese yen, boosts the British pound.
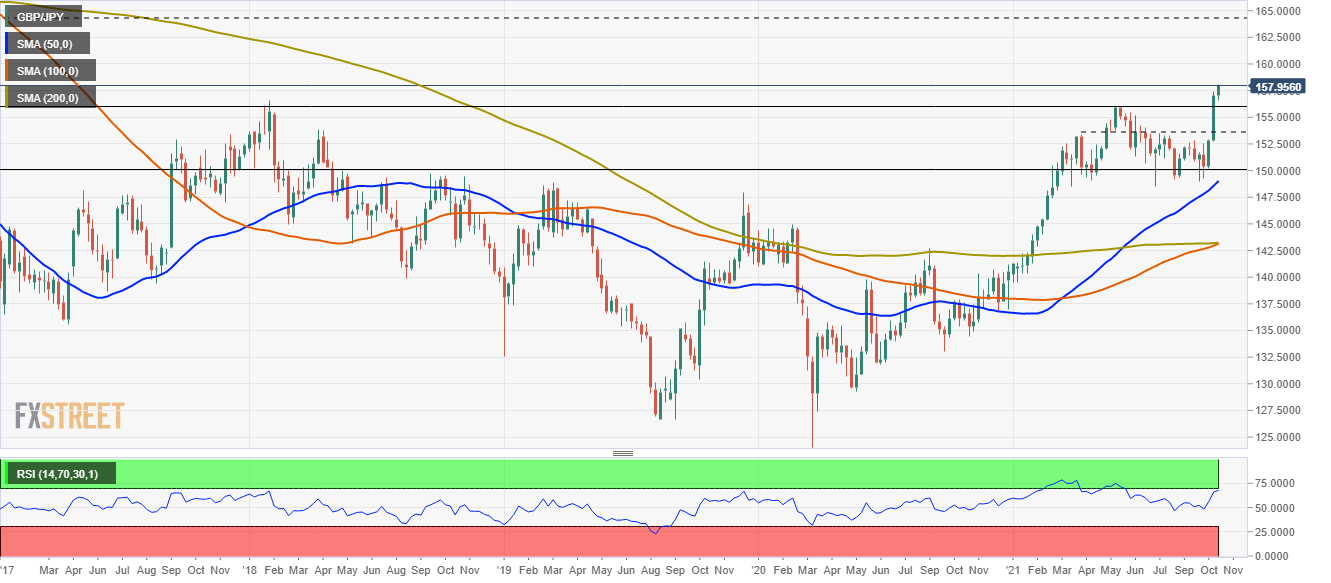
- GBP/JPY: The weekly chart depicts the possibility of a break of a trading range, opening the door for higher prices.
The GBP/JPY edges higher as the Asian session begins, up 0.13%, trading at 157.88 at the time of writing. Positive market sentiment surrounds the financial markets, depicted by Asian equity futures rising between 0.67% and 2.17%, except for the Nikkei 225 falling 0.04%. Furthermore, risk-sensitive currencies like the British pound, the Australian, and the New Zealand dollar, rallied against the safe-haven status Japanese yen.
GBP/JPY Price Forecast: Technical outlook
The weekly chart depicts the GBP/JPY is breaking to the upside, leaving February 2018 resistance level around 156.61 as its first support. A weekly close over the abovementioned could open the way towards the March 2016 swing highs around 163.90. A breach of the latter would open a test of the February 2015 highs around 175.02.
On the flip side, failure at 156.61 could open the way for further losses. The first support level would be psychological 156.00. A break below that level would exert downward pressure on the pair, exposing vital support levels, as the September swing highs around 153.42, followed by the 150.00 psychological level.
The Relative Strength Indes (RSI) is at 67, indicating that upward pressure remains in place. However, as it is closer to overbought conditions, the GBP/JPY pair could print a correction before resuming the upward trend.
- USD/CHF edges lower on Wednesday in the Asian session.
- Higher highs and higher lows depict the upside trend in the pair since August 30.
- MACD holds onto the overbought zone with receding upside momentum.
USD/CHF remains muted on Wednesday in the initial Asian trading hours. After testing the low of 0.9185 in the US session, the pair managed to close higher while composing more than a 50-pips movement. At the time of writing, USD/CHF is trading at 0.9298 down 0.02% for the day.
On the daily chart, the USD/CHF pair has been trading in a rectangle formation in a range of 0.9220 and 0.9230 since September 15. The spot showed a weakening trend after it slipped below the 21-day Simple Moving Average (SMA) at 0.9275. Further, the mid-term uptrend from the low of 0.9018 made on August 4 invalidated after USD/CAD breaks below the bullish slopping line in the previous session.
Having said that, If the price break below the intraday low it could immediately test the psychological 0.9200 mark followed by the low made on September 15 at 0.9163. Furthermore, the Moving Average Convergence Divergence (MACD) trades in the overbought zone with receding upside momentum. Any downtick in the MACD would encourage the USD/CHF bears to test the 0.9140 horizontal support level.
Alternatively, if the price reverses direction then the possibility of meeting the 0.9250 horizontal resistance level emerges. A daily close above the 21-day SMA will fuel the upside rally toward the 0.9300 horizontal resistance level, and then the October, 1 high of 0.9337.
- GBP/USD grinds higher around five-week top after cheering broad US dollar weakness.
- BOE rate hike concerns joined risk-on mood to favor bulls.
- UK coronavirus fears, Brexit jitters challenge upside ahead of British CPI for September.
- US stimulus, Fed tapering concerns may also entertain traders.
GBP/USD seesaws around 1.3800 as traders brace for the key inflation data during Wednesday’s Asian session. The cable pair cheered hopes of the Bank of England’s (BOE) rate hike, as well as broad US dollar weakness, to refresh the multi-day high the previous day. However, challenges surrounding the UK’s covid conditions and Brexit woes probed the bulls.
Bloomberg quotes BOE Governor Andrew Bailey’s latest comments to highlight the rate hike chatters. “Speaking to an online panel organized by the Group of 30, Bailey said that while central banks don’t have the tools to counter supply disruptions and he still believes the recent acceleration of inflation will be temporary, officials need to seek to prevent higher inflation expectations from becoming entrenched,” said the news.
On a different page, the US dollar eased after the downbeat housing data cooled down tapering tantrums. US Housing Starts registered a sharp fall in September, -1.6% MoM versus +1.2% prior, whereas the Building Permits registered the largest contraction since February, down 7.7% compared to 5.6% previous readouts. That being said, the US Dollar Index (DXY) dropped to a three-week low before consolidating losses around 93.77 at the latest.
It’s worth noting that the risk-on mood helped the Wall Street benchmarks to poke record tops whereas the US 10-year Treasury yields gained 5.7 basis points (bps) to rise to the highest levels since late May by the end of Tuesday’s North American session.
Alternatively, the UK recorded the highest coronavirus-led daily death numbers since March 9 the previous day. “The weekly rate of new reported cases of Covid-19 in the UK is one of the highest in the world, having jumped from 367 cases per 100,000 people at the start of October to its current level of 463 per 100,000,” said the HuffPost UK.
Also negative for the GBP/USD prices were Brexit headlines quoting UK Minister David Frost who pushes the bloc for easing controls over the Northern Ireland (NI) border. However, UK PM Boris Johnson sounds optimistic noting job losses and disruption to capital flows have been lower than feared, per Bloomberg.
Given the latest supply crunch and fresh reflation chatters, any uptick in the UK CPI, expected to remain unchanged at 3.2% YoY in September, may well anchor the expectations of a BOE rate hike in 2021, which in turn could propel the GBP/USD further towards the north.
Read: UK September CPI Inflation Preview: Will rising price pressures boost British pound?
Technical analysis
In addition to the 100 and 200-DMA, respectively around 1.3810 and 1.3850, a downward sloping resistance line from July 30, close to 1.3860, also challenges GBP/USD upside. However, sellers may refrain from fresh entries until the quote stays beyond the 50-DMA level surrounding 1.3710.
- Precious metals benefit from US dollar weakness to rival currencies.
- The stagflation themes feed through into the precious metals hedge.
- Gold price remains bound by daily dynamic support.
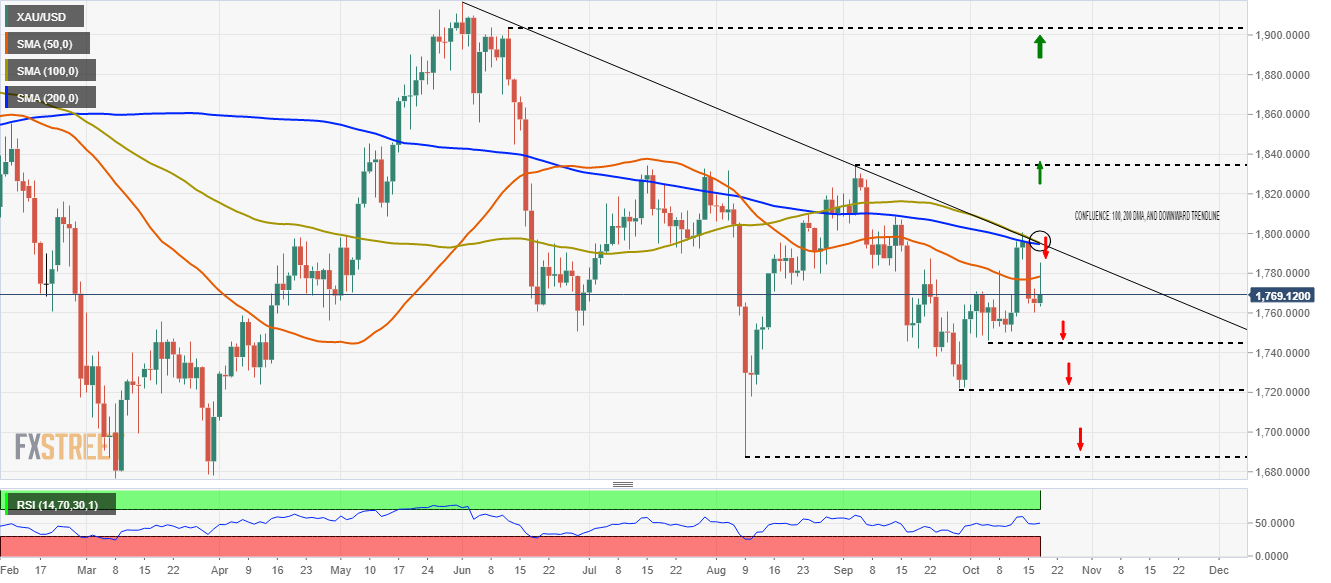
Gold is subdued and rests in familiar territory awaiting the next major catalyst to kick start it into gear within bullish territory towards the psychological $1,800 level. At the time of writing, XAU/USD is trading at 41,769 and flat in Asia, so far.
Precious metals are finding support from the stagflation theme that has been brewing in recent weeks as well as weakness in the US dollar. The greenback had struggled against its rivals on Tuesday in a bout of profit-taking as rival currencies of central banks that are on the verge of lift-off play catch-up. The moves in forex are denting the US dollar's appeal that had otherwise benefitted by expectations of sooner-than-previously expected interest rate hikes.
''Market pricing for Fed hikes is far too hawkish,'' analysts at TD Securities argued. ''This suggests gold is an ideal hedge against rising stagflationary winds, and reasons to own the yellow metal are growing more compelling as Fed pricing is likely to unwind.''
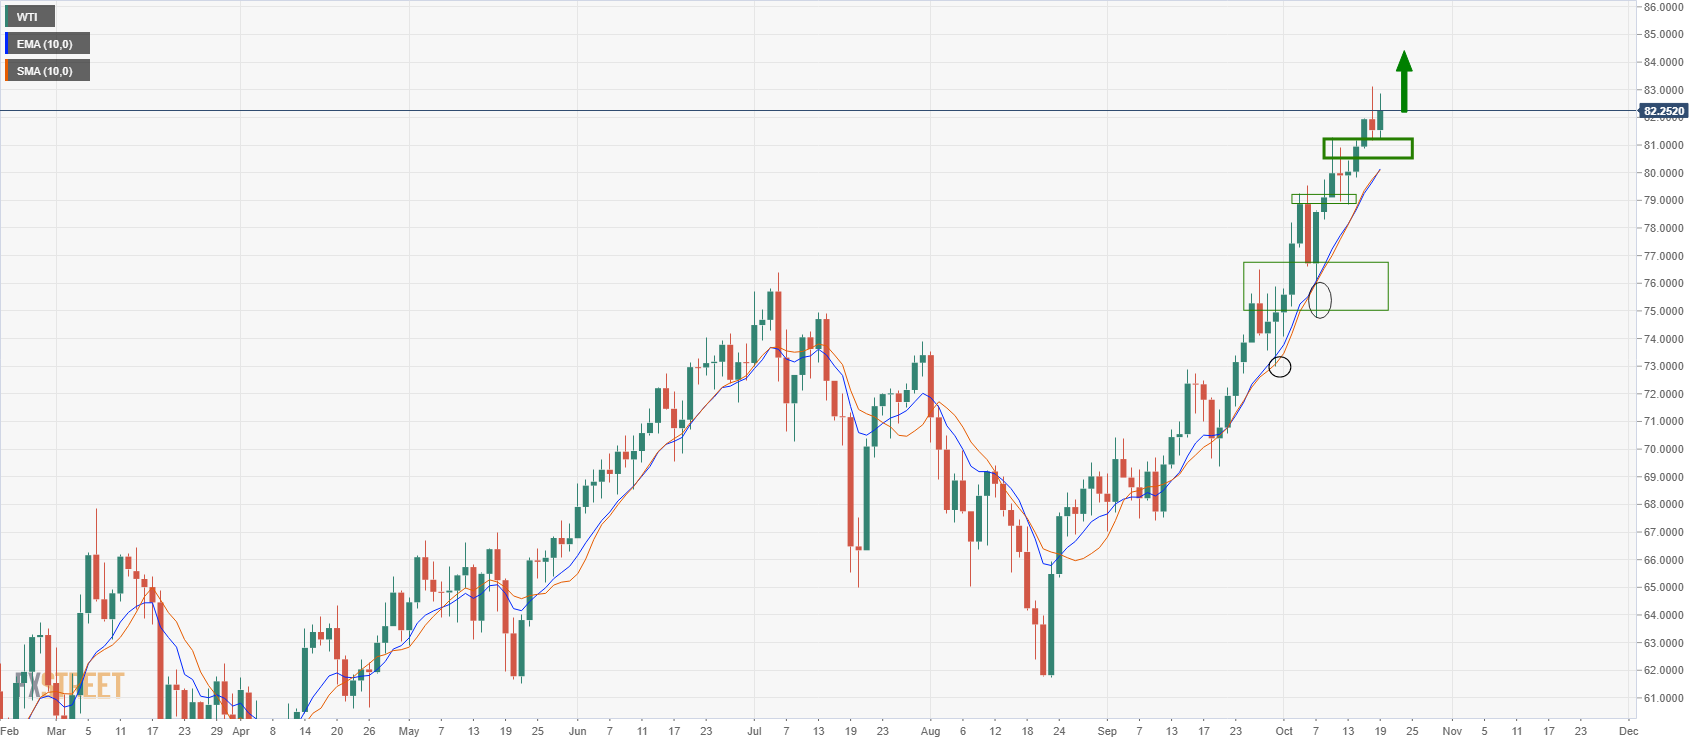
US Oil (WTI) extends higher
The analysts added that a ''cold winter could send energy prices astronomically higher, potentially pricing-out industries and fueling price asymmetries in markets — which translates into a fat right tail for gold prices. Chinese brokers have also increased their net length in SHFE gold, pointing to increased appetite for the yellow metal amid a growing wall of worry.''
Gold technical analysis
For an in-depth technical analysis of gold, see here: Gold Chart of the Week: XAU hit the $1,800 target, now what?
However, at a snapshot, we are likely to see some consolidation to continue to play out:
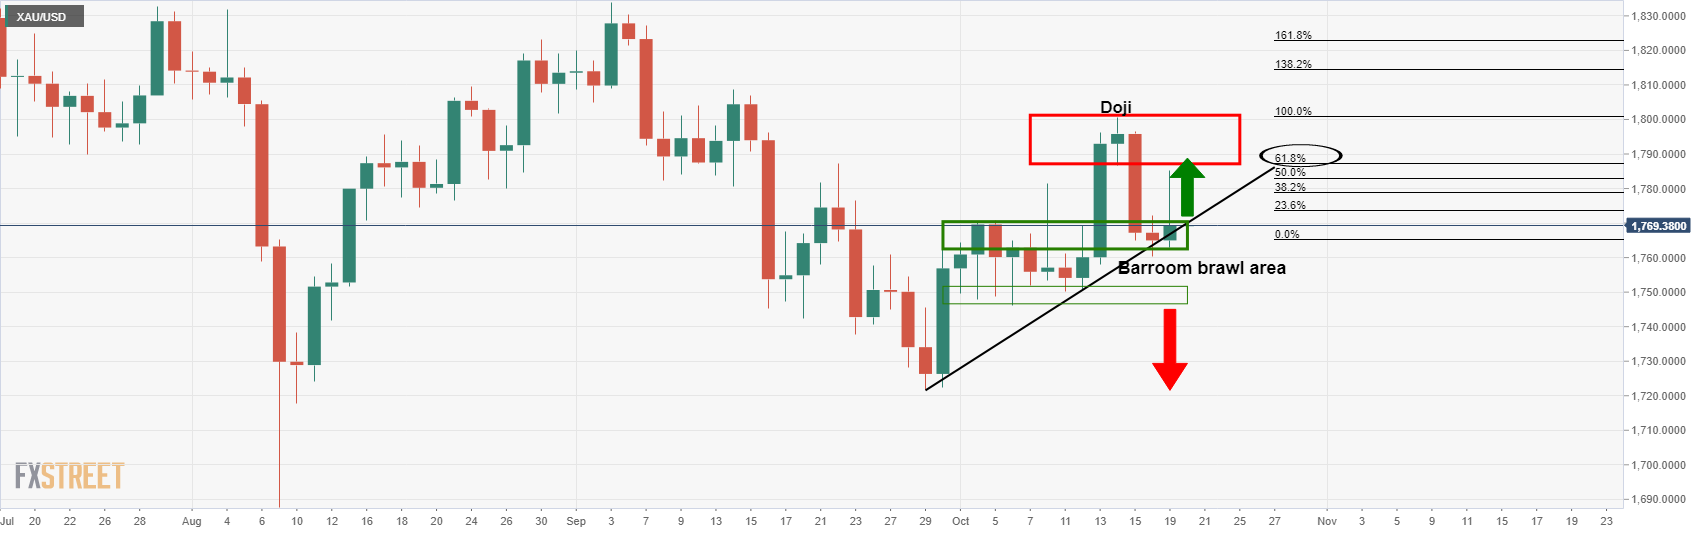
The price is consolidated unfamiliar territory mid-week and resting by the dynamic trendline support. A move beyond $1,800 is required if the bulls are going to take charge again, or otherwise, a break below the barroom brawl area and $1,750 will open the risk of a downside continuation.
This can be illustrated better from a weekly perspective, as follows:
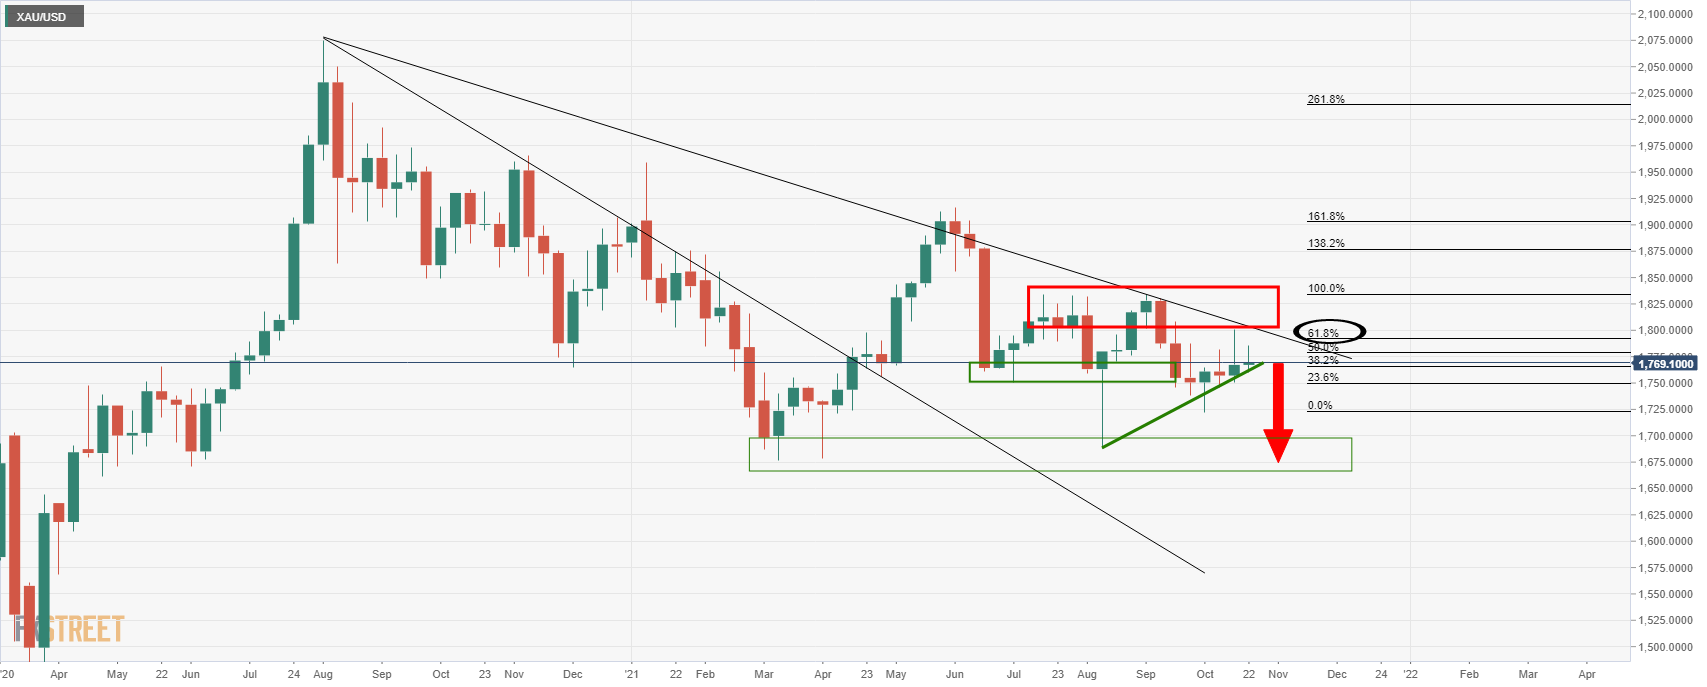
The price has met a 61.8% Fibonacci retracement of the prior bearish impulse. This is significant and could lead to a break below the dynamic support. A fresh bearish impulse to the downside in the coming weeks would, however, be in contrast to the fundamental stagflation theme.
- USD/JPY trades virtually unchanged on Wednesday in the initial Asia session.
- The US dollar trades below 94.00 despite higher US T-bond yields.
- US spending bill, hawkish Fed members, and higher equities rule traders' decisions.
USD/JPY remains muted on Wednesday, extending the previous session’s momentum. The pair stays in a relatively narrow price band, after hovering near the daily highs in the US session. At the time of writing, USD/JPY is trading at 114.37, up 0.02% for the day.
The US benchmark 10-year Treasury bond yields trade at 1.64%, for the first time since May. As investors continue to anticipate the Fed’s tapering next month amid rising inflationary pressure and soaring energy prices. The weaker housing data dented the sentiment, which kept the greenback below 94.00.
The US Building Permits fell 7.7% in September whereas Housing Starts dropped 1.6%. The comments from Fed’s Governor Christopher Waller that a more aggressive policy might be required if higher inflationary pressure persists limits the losses for the buck.
Meantime, US President Joe Biden and Democratic lawmakers were close to a deal on the cost and scope of their cornerstone economic revival package as per Reuters.
On the other hand, the Japanese yen lost its ground on improved risk sentiment. It is worth noting that, S&P 500 Future is trading at 4,512, up 0.02% for the day.
As for now, traders are waiting for Japan's Balance of Trade data, and US Fed’s Quarles speech to gauge the market sentiment.
USD/JPY additional levels
- USD/CAD seesaws within a 30-pip trading range, edging higher of late.
- Risk-on mood, strong WTI crude oil prices battle multi-day-old horizontal support.
- US EIA Crude Oil Stocks Change, Canada CPI will be important catalysts to watch.
USD/CAD struggles to keep the bounce off at the lowest levels since early July, taking rounds to 1.2365-70 amid Wednesday’s Asian session. In doing so, the Loonie pair stays within the immediate trading range between 1.2375 and 1.2345 amid a brighter mood and upbeat prices of Canada’s key export item, WTI crude oil.
The USD/CAD dropped to the lowest since early July during Tuesday before bouncing off 1.2311 horizontal support, established in late April. The rebound also took clues from a pullback in oil prices after downbeat weekly inventory data from the industry source, namely the American Petroleum Institute (API). API Weekly Crude Oil Stock rose past 2.233M forecast to 3.294M for the period ended on October 15. It’s worth noting that the previous readout was 5.213M.
It’s worth noting that the latest comments from Fed Governor Christopher Waller also underpinned the USD/CAD rebound. “If inflation keeps rising at its current pace in coming months rather than subsiding as expected, Federal Reserve policymakers may need to adopt ‘a more aggressive policy response’ next year,” said the Fed policymaker per Reuters.
On the contrary, the downbeat US housing numbers questioned the Fed’s tapering plans. US Housing Starts registered a sharp fall in September, -1.6% MoM versus +1.2% prior, whereas the Building Permits registered the largest contraction since February, down 7.7% compared to 5.6% previous readouts.
Against this backdrop, the Wall Street benchmarks poked record tops whereas the US 10-year Treasury yields gained 5.7 basis points (bps) to rise to the highest levels since late May by the end of Tuesday’s North American session. Further, the US Dollar Index (DXY) dropped to a three-week low before consolidating losses around 93.77 at the latest. That being said, S&P 500 Futures struggle for clear direction amid uncertainty over US stimulus and Fed tapering tantrums by the press time.
Looking forward, the official weekly oil inventory data from the Energy Information Administration (EIA), expected 2.233M versus 6.088M prior, will direct short-term oil prices and help USD/CAD traders. However, Canada’s Consumer Price Index (CPI) for September, market forecast 4.3% YoY versus 4.1% prior, as well as the BOC CPI Core which is expected to improve to 0.3% from 0.2% previous readings, will be crucial for USD/CAD moves. Should the oil prices stay firmer around multi-month top amid supply outage fears, also backed by hopes of improving demand, upbeat Canadian data may weigh on the pair.
Technical analysis
A horizontal area comprising multiple levels marked since late April challenge USD/CAD bears near 1.2315-10. The corrective pullback also takes clues from the upside break of a monthly resistance line, now support around 1.2350. Even so, the pair buyers remain cautious until the quote rises past the 100-DMA level of 1.2510 on a daily closing basis.
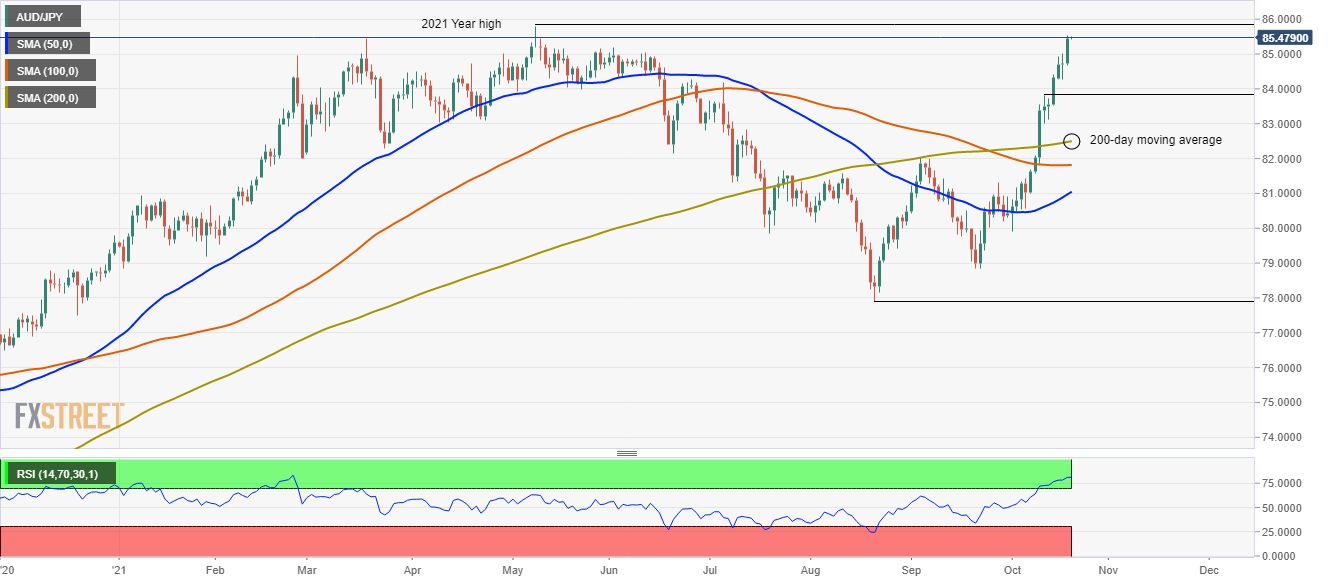
- AUD/JPY: The prevailing trend still tilted to the upside on the back of the interest rate differentials.
- AUD/JPY: Monday’s doji was a pause for bulls, as witnessed by a 100 pip jump on Tuesday, which printed a fresh five-month high.
- AUD/JPY: An upside break opens the door to 2018 highs around 89.00.
The AUD/JPY edges low as the Asian session kicks in, barely down 0.01%, trading at 85.46 at the time of writing. Positive market sentiment through the New York session found some follow through as Asian equity futures rise between 0.67% and 2.17%. Solid US third-quarter corporate earnings spurred risk-on mood in the market, as energy prices stabilized around familiar levels, like US crude oil benchmark WTI, which sits around $82.36 per barrel.
AUD/JPY Price Forecast: Technical outlook
Back to the AUD/JPY cross-currency pair, it is trading at five-month highs. At press time, the daily chart depicts the cross-currency is approaching the May 10 high, at 85.80, a strong resistance level. In the case of an upward break above the latter, December 5, 2017, high at 86.84 would be the first resistance level. A breach of the abovementioned could expose crucial supply zones towards 89.00, but it would find some hurdles on the way, like January 10, 2018, low at 87.20, followed by January 31, 2018, high at 88.49.
On the flip side, failure at 85.80 could send the AUD/JPY sliding lower. A daily close below the 84.27 level could trigger a downward move towards the before resistance-now support area around 83.80. A breach of the latter would expose the 200-day moving average (DMA) at 82.47.
The Relative Strength Index (RSI), a momentum indicator, is at 81, in overbought levels, indicating that the AUD/JPY might consolidate before resuming the upward move, confirmed by the daily moving averages (DMA’s), which are located well below the spot price.
- Silver eases after refreshing a six-week high, consolidates the heaviest daily jump in a week.
- Sustained break of the key trend line resistances, now supports, join firmer RSI line to direct bulls toward 100-DMA.
- Two-month-old horizontal support adds to the downside filters.
Silver (XAG/USD) steps back from the highest levels since early September, easing to $23.65 during the initial Asian session on Wednesday. Even so, the bright metal keeps the latest upside breaks of the previous key resistance lines.
Also favoring the silver buyers is the firmer RSI line, not overbought, as well as a successful run-up beyond horizontal support established since August 20.
That being said, the XAG/USD bulls are well-directed towards the 100-DMA, around $24.70 by the press time.
However, September’s high around $24.85-90 and 50% Fibonacci retracement of the May-September downside of the metal, close to $25.10, will challenge the quote’s further upside.
Alternatively, a downward sloping trend line from early July, near $23.40, acts as immediate support for the commodity before highlighting the resistance-turned-support line from June 10, close to $23.05.
Even if the XAG/USD sellers manage to conquer the $23.05 support, the $23.00 threshold and aforementioned horizontal line near $22.88 will be important to watch.
Silver: Daily chart
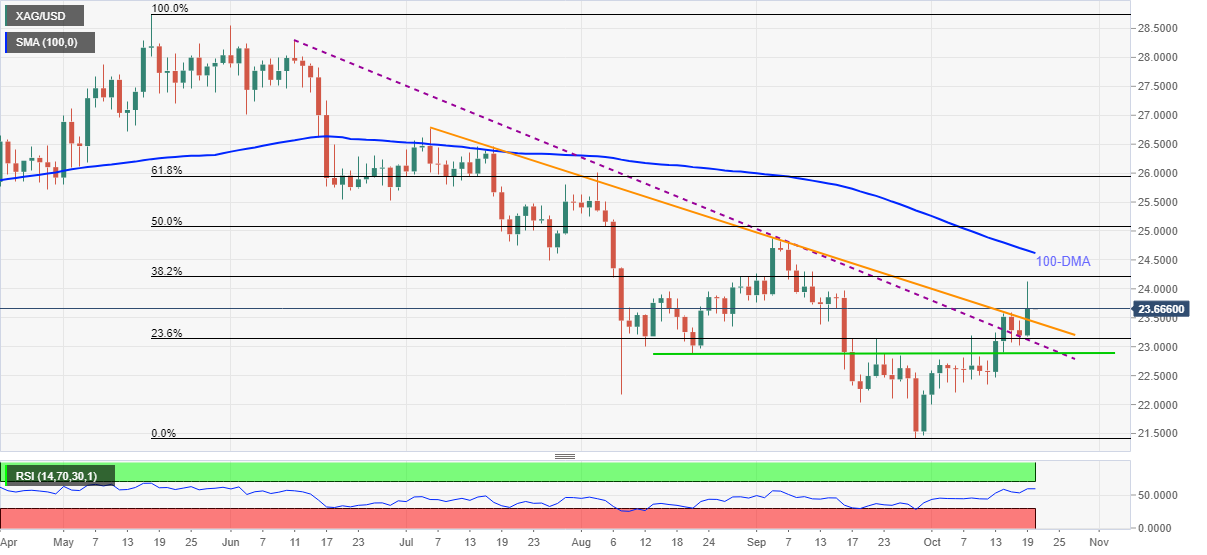
Trend: Further upside expected
- AUD/USD grinds higher around three-month top after the heaviest daily jump in seven weeks.
- Upbeat market sentiment underpinned stocks, US Treasury yields refresh five-month high.
- RBA Meeting Minutes offered no surprise, IMF comments on China failed to stop the bulls.
- Aussie Westpac Leading Index, PBOC Interest Rate Decision eyed for fresh impulse.
AUD/USD bulls take a breather around 0.7475-80 during early Wednesday morning in Asia, following its heaviest daily jump since late August. The risk barometer pair cheered US dollar weakness amid a brighter mood to refresh the multiday high the previous day. However, strong resistance around 0.7480 challenges the quote’s further upside of late.
Global market sentiment improved on Tuesday after the downbeat US housing number questioned the Fed’s tapering plans. Also positive for the AUD/USD was a lack of any surprises from the Reserve Bank of Australia’s (RBA) Monetary Policy Meeting Minutes, as well as easing coronavirus fears at home.
Additionally, chatters that the US Democrats are close to the much-awaited economic stimulus offered extra strength to the risk appetite and the AUD/USD prices. “President Joe Biden and Democratic lawmakers are close to a deal on the cost and scope of their cornerstone economic revival package and hope to reach a compromise this week, people briefed on the negotiations said on Tuesday,” per Reuters.
US Housing Starts registered a sharp fall in September, -1.6% MoM versus +1.2% prior, whereas the Building Permits registered the largest contraction since February, down 7.7% compared to 5.6% previous readouts. Further, the RBA Meeting Minutes was a copy of September wherein the policymakers reiterated cautious optimism while cutting down the reflation fears.
Elsewhere, the International Monetary Fund (IMF) expects the Chinese economy to grow by 8% in 2021 but added that the economic recovery remains unbalanced, per Reuters. The news also said, “China's economic setbacks have darkened the outlook for countries in its orbit, from South Korea to Thailand, as a sharp factory slowdown and trade bottlenecks in the world's second-largest economy hit Asia on the supply as well as demand sides.”
Amid these plays, the Wall Street benchmarks flirt with the record tops whereas the US 10-year Treasury yields gained 5.7 basis points (bps) to rise to the highest levels since late May. Further, the US Dollar Index (DXY) dropped to a three-week low before consolidation losses around 93.77 at the latest.
Looking forward, Australia’s Westpac Leading Index for September, prior -0.27%, will precede the People’s Bank of China (PBOC) Interest Rate Decision and China Housing Price Index for September, previous readouts 4.2%, will be important data/events for AUD/USD traders. Although the PBOC isn’t expected to alter monetary policy, strong defense from financial market risks emanating from reality companies’ defaults can’t be ruled out, which in turn could help Aussie bulls.
Technical analysis
AUD/USD needs a daily closing beyond the four-month-old horizontal hurdle surrounding 0.7480 to justify a 100-DMA breakout. Bullish MACD and a clear cross of the key moving average keep buyers hopeful to aim for 0.7530-35 resistance line, established in early April. However, RSI conditions seem nearly overbought and hence bulls may take a breather but the stated 100-DMA and an ascending support line from September 30, respectively around 0.7405-7400, restrict the bear’s entry.
AUD/USD: Daily chart
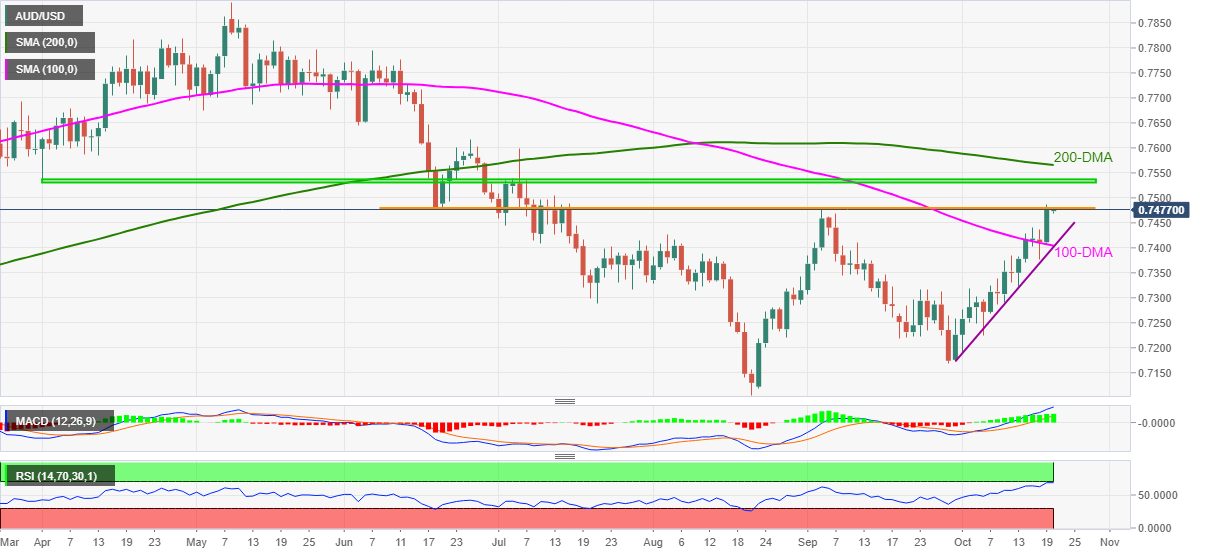
Trend: Further upside expected
Reuters reported that President Joe Biden and Democratic lawmakers are close to a deal on the cost and scope of their cornerstone economic revival package and hope to reach a compromise this week, people briefed on the negotiations said on Tuesday.
However, this is little news to markets as the US House of Representatives Speaker Nancy Pelosi had previously set Oct. 31 as the deadline for the House to pass a $1.2 trillion infrastructure deal. Additionally, the Senate has already approved and has broad bipartisan support.
''Biden held a busy day of meetings with lawmakers, seeking to close what may be the signature effort of his administration, a multitrillion-dollar, two-bill legislative package that expands social safety net programs and infrastructure spending,'' Reuters reported.
''One source said a deal could be announced midweek if things go well, a second said the White House was hoping for an announcement in coming days.''
''A spending package that was originally estimated at $3.5 trillion could be $1.9 to $2.2 trillion, Representative Pramilia Jayapal, the chair of the Progressive Caucus said at the White House after meeting with Biden.''
''Any final deal is likely to severely curtail Biden's initial ambition. Initiatives in his original proposal that may see cuts include $322 billion for affordable housing, money for paid family leave and some $400 billion earmarked to increase home-based care for the elderly and disabled, according to a person familiar with the matter.''
- S&P 500, Nasdaq climb for 5th straight session as investors cheer earnings.
- The S&P 500 led the gains in percentage points of 0.74% followed by the Nasdaq Composite that added 107.28 points, or 0.71%.
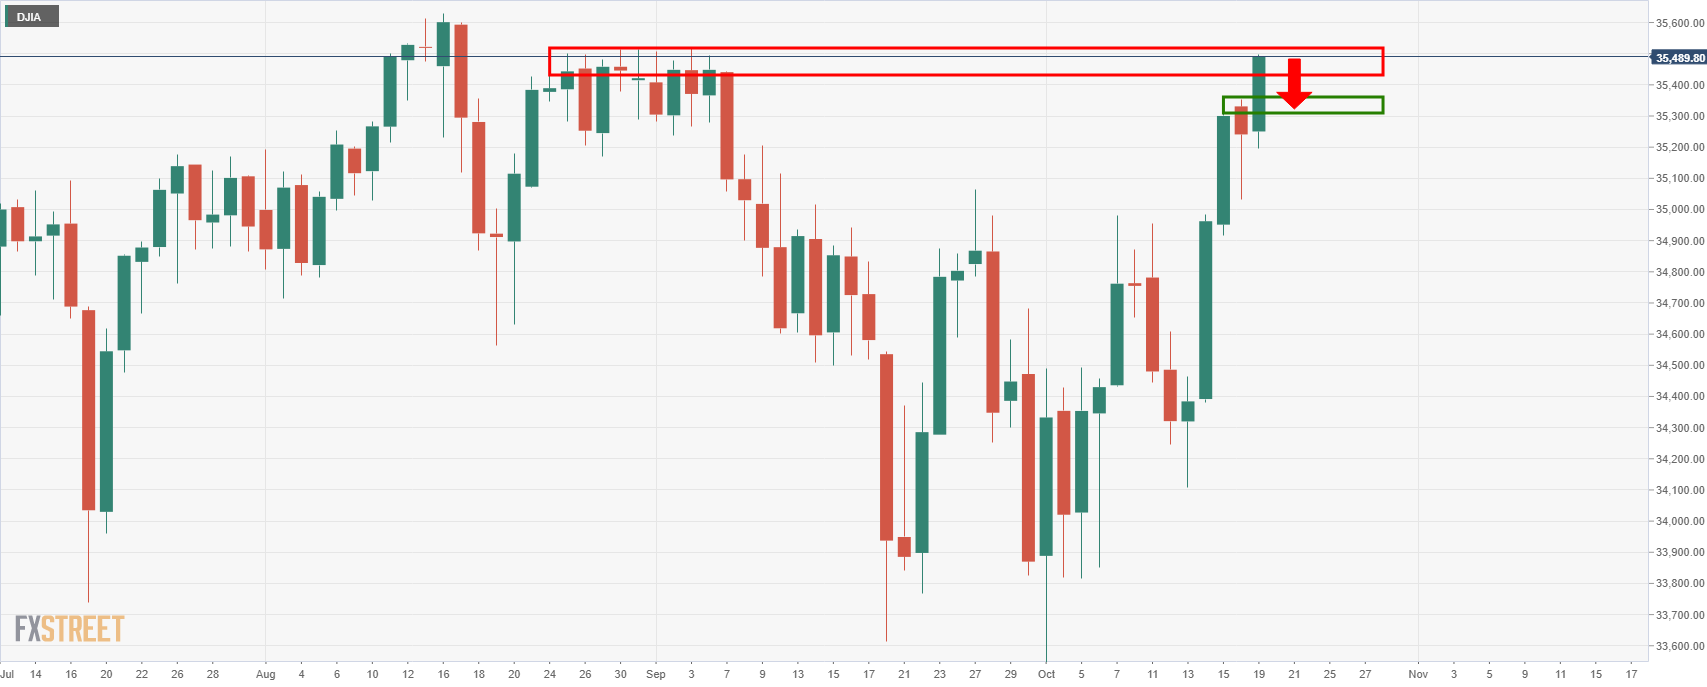
- The Dow Jones Industrial Average was the laggard and rose 199.36 points or 0.57%.
Wall Street's benchmarks got a boost on Tuesday from the technology and healthcare sectors as investors cheered strong quarterly reports. Notably, in its fifth straight session of gains, the benchmark S&P 500 index neared its early September record high. Analysts now expect S&P 500 earnings to rise 32.4% from a year earlier, according to Refinitiv data.
In healthcare, Johnson & Johnson raised its 2021 adjusted profit forecast which lifted the S&P 500 while insurer Travelers Cos Inc TRV climbed after beating third-quarter profit estimates. In other earnings-related outcomes, high-profile technology and communications companies were also big contributors to the S&P's gain with Apple Inc AAPL, Facebook FB and Microsoft MSFT all rising.
Meanwhile, the CBOE market volatility index hit its lowest level since mid-August during the session. Unofficially, the Dow Jones Industrial Average rose 199.36 points, or 0.57%, to 35,457.97, the S&P 500 gained 33.3 points, or 0.74%, to 4,519.76 and the Nasdaq Composite added 107.28 points, or 0.71%, to 15,129.09.
In related markets, the 10-year US Treasury yield increased 5.1 basis points to 1.635% and West Texas Intermediate crude oil climbed to a multi-year high of $83.72 a barrel. DXY, a measure of the US dollar vs a basket of rival currencies recovered from the lows of 93.50 and targets 93.80 at the close with higher levels eyed:
US dollar 1-hour chart
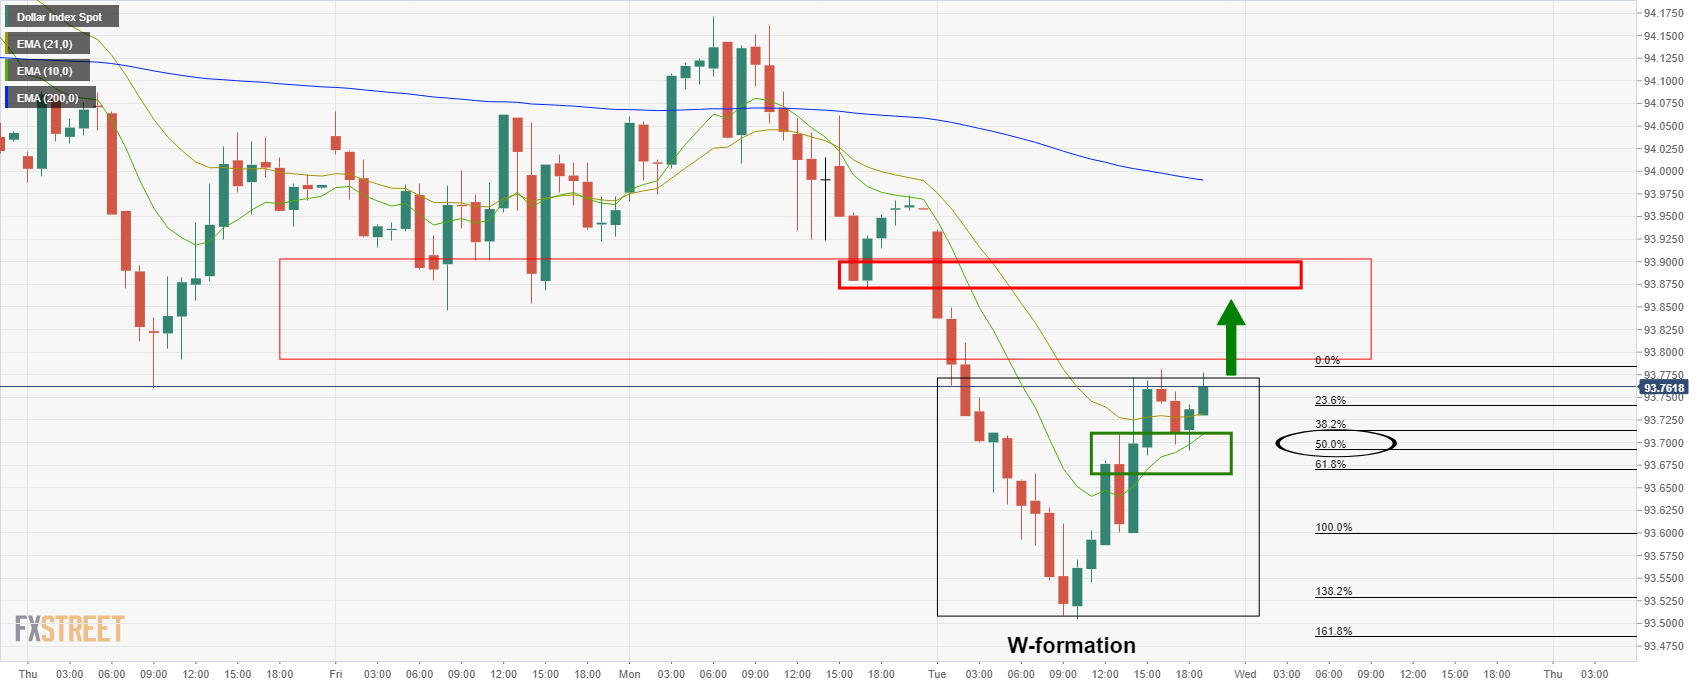
As illustrated, the price has retested the neckline of the W-formation and is now making tracks towards 93.80. A break there opens risk towards 93.87 18 Oct lows.
DJIA daily chart
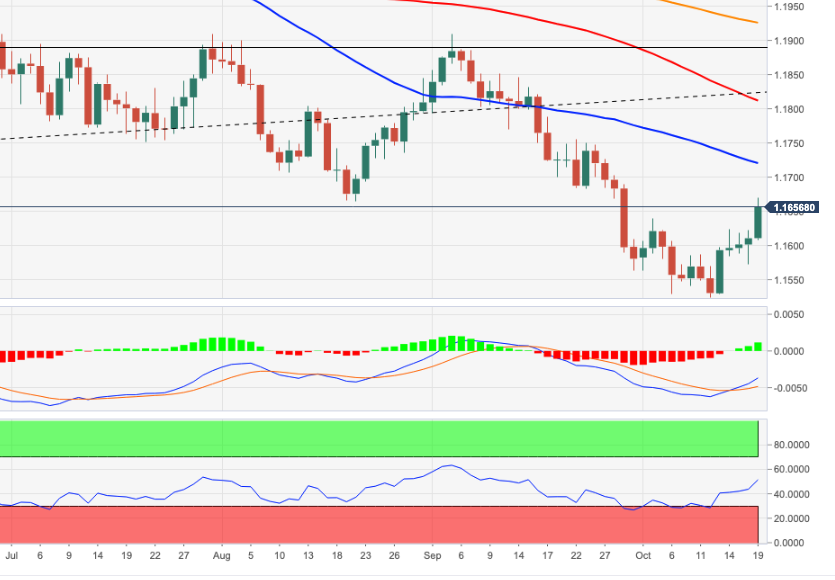
- EUR/USD extends its five-day rally, trades above 1.1600.
- A weaker dollar boosts the EUR/USD pair, despite surging US 10-year yields, above 1.641%.
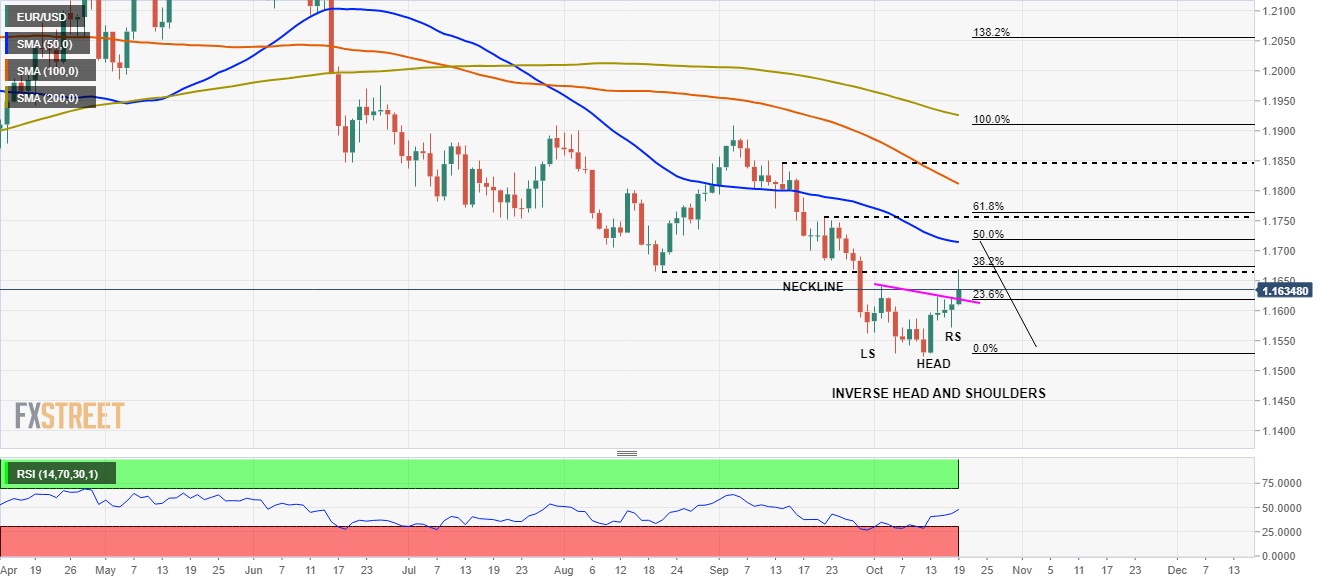
- EUR/USD: The target of an inverse head-and-shoulders is 1.1750, but first, euro bulls need to reclaim 1.1700.
The EUR/USD climbs during the New York session, up some 0.22%, trading at 1.1636 at the time of writing. The market sentiment remains upbeat, as major US stock indices record gains between 0.46% and 68%, while the safe-haven status of the US dollar weakens across the board.
The euro extended its five-day rally, though weaker, reclaimed the 1.1600 figure. The US dollar sell-off witnessed the US Dollar Index drop below the 94.00 threshold despite higher US T-bond yields, with the 10-year coupon, rallying almost six basis points, sitting at 1.641%, at press time.
EUR/USD Price Forecast: Technical outlook
The daily chart of the EUR/USD shows that an inverse head-and-shoulders formed around the 2021 lows, indicating the EUR/USD is under some buying pressure. The inverse head-and-shoulders pattern measured target is 1.1750, near the 50% Fibonacci retracement, which could resume the long-term downward move towards a renewed test of 2021 lows.
To challenge US dollar bulls, euro buyers will need a daily close above 1.1800, near the 100-day moving average (DMA). In that outcome, the September 14 high at 1.1846 would be the first resistance level, followed by the 1.1900.
On the flip side, to resume the downward trend, US dollar bulls will need to push the EUR/USD below the 1.1600 threshold. If EUR/USD sellers exert enough pressure to spur a daily close below 1.1600, a challenge of the 2021 lows around 1.1524 is on the cards.
The Relative Strength Index (RSI), a momentum indicator, is at 48, trending slightly up, indicating that buying pressure is piling on the EUR. However, caution is warranted, as the RSI remains below the 50-midline.
Netflix (NFLX) announced Q3 results after the close on Tuesday. Q3 Earnings Per Share came in ahead of estimates at $3.19 versus $2.56 estimate. Revenue was in line, coming in at $7.48 billion versus the $7.48 estimate.
Netflix (NFLX) stock forecast
Netflix (NFLX) stock is trading up just over 1% in Tuesday's after market.
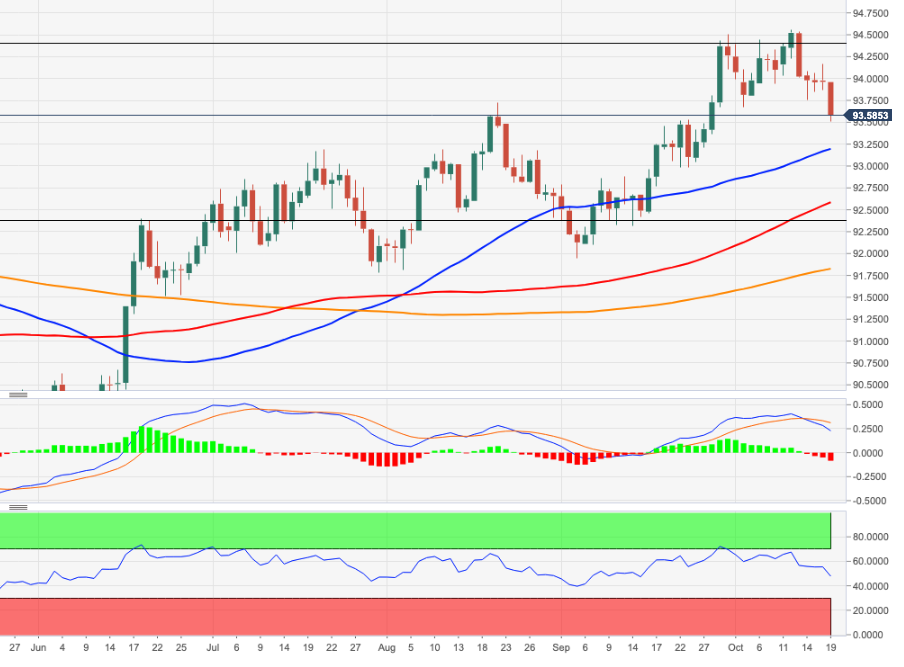
- The US dollar has found its feet in the US session and has started to carve out a bullish structure.
- There is room for an upside extension to target 93.80/90.
The price of the US dollar, as measured by the DXY index vs a basket of rival currencies, has recovered from the 93.50 targets and is embarking on a run to 93.80 at the time of writing.
US dollar 1-hour chart
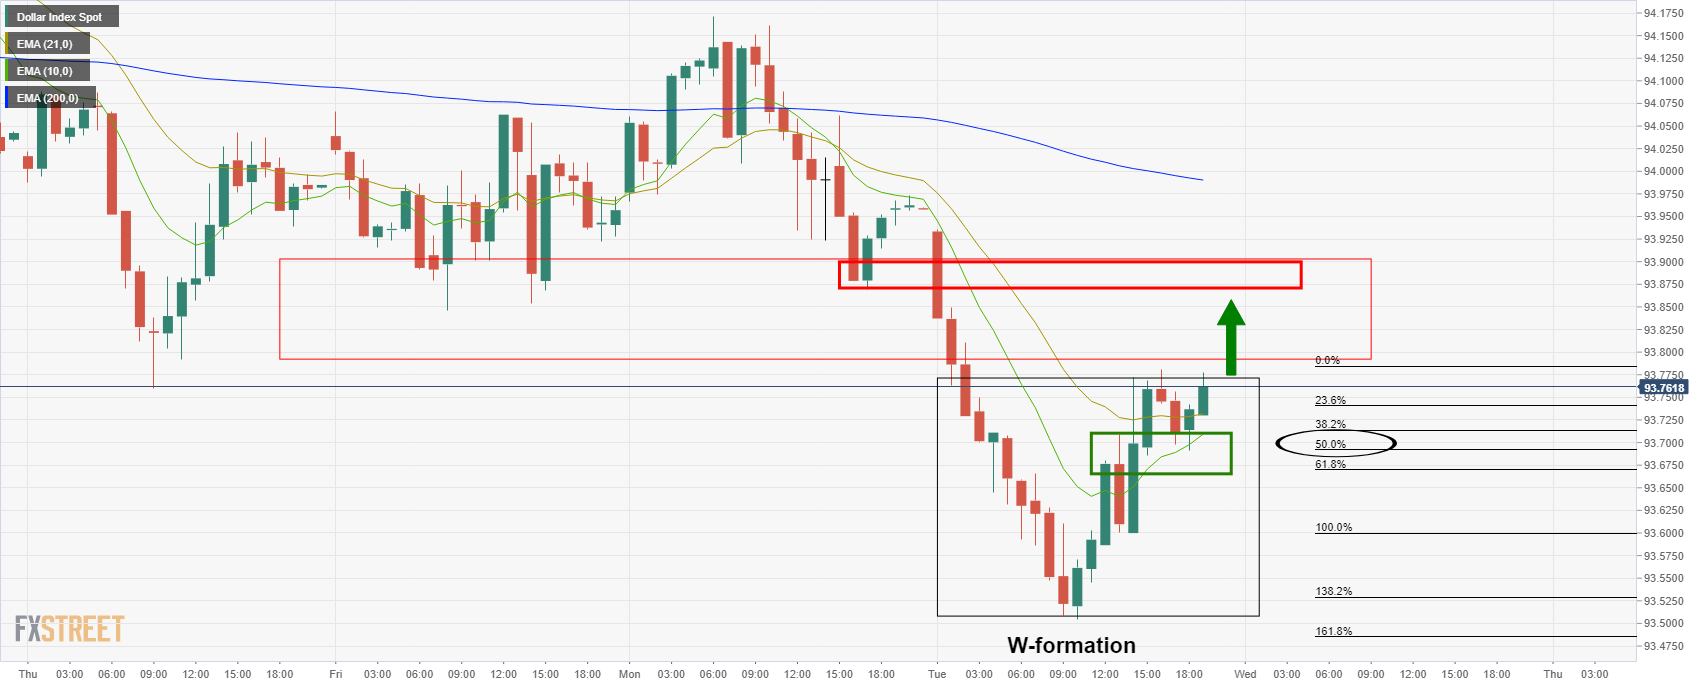
As illustrated, the price has retested the neckline of the W-formation and is now making tracks towards 93.80. A break there opens risk towards 93.87 18 Oct lows.
US yields and dollar to continue higher
In confluence, US yields are rising and the 10year benchmark is printing a fresh daily high of 1.642% with 1.706% now eyed 13 May pivot. ''Global yields are stabilizing after yesterday’s panic moves,'' analysts said but argued that the inflation debate is by no means settled, not with supply chain issues and higher commodity prices still percolating through the system.
''As we wrote yesterday, this debate will likely take weeks, if not months, before some sort of definitive conclusion can be reached. However, we are confident that US rates and the dollar will continue rising throughout this debate.''
What you need to know on Wednesday, October 20:
The American dollar edged lower against high-yielding rivals and remained flat against those considered safe-havens as the market’s sentiment somehow improved. Global indexes closed in the green, with speculative interest ignoring tepid macroeconomic figures.
The EUR/USD pair hit a three-week high of 1.1669 but ended the day in the 1.1630 price zone, as demand for the EUR was capped by comments from ECB’s Lane. The chief economist said that medium-term inflation pressures are under the central bank’s target, somehow suggesting a longer wait-and-see stance.
GBP/USD trades around 1.3800, backed by speculation the BOE will soon start raising rates. The UK will publish inflation figures on Wednesday and may trigger some wild action in the pound’s crosses.
The Australian dollar was the best performer, advancing up to 0.7485 against the greenback and retaining its intraday gains. The USD/CAD pair fell to 1.2310 but trimmed losses ahead of the close.
Crude oil prices maintained their positive tone, with WTI settling at $82.20 a barrel. Gold surged intraday but finished the day with modest gains at around $1,769 a troy ounce.
US Treasury yields rallied to fresh multi-week highs ahead of Wall Street’s close. The yield on the 10-year note hit 1.644% and settled nearby. Firmer yields may give the dollar a respite should the rally there continues.
Top 3 Price Prediction Bitcoin, Ethereum, Ripple: Investors prepare to sell on ETF news
Like this article? Help us with some feedback by answering this survey:
- The pound turns higher to reach one-month highs at 1.3845.
- BoE rate hike speculation remains fuelling sterling's recovery.
- GBP/USD: Monetary tightening might not be enough to lift the pound – MUFG.
The British pound has appreciated beyond 0.5% on Tuesday, favored by a moderate reversal on the USD, to hit one-month highs at 1.3835 before consolidating around the 1.3800 level.
The pound on BoE hike expectations, US dollar weakness
On a broader view, the pair has been performing a solid recovery in October, appreciating a nearly 3% after bouncing from year-to-date lows near 1.3400. The sterling has regained most of the ground lost on the second half of September when it was hammered by concerns about the fuel and labor shortages caused by Brexit restrictions
Furthermore, rising expectations about the possibility that the Bank of England will lead the world’s major central banks on hiking interest rates are also increasing demand for the GBP.
With inflation accelerating at levels almost twice the Bank’s target for price stability, BoE officials have started to openly suggest the possibility of accelerating the monetary policy normalization plan. BoE Governor, Andrew Bailey, has supported this idea, suggesting this weekend that the Bank of England "will have to act" as rising energy prices are threatening to spill over consumer prices.
On the other end, the US dollar pulled lower on Tuesday. The US Dollar Index is trading 0.2% lower on the day, after having bottomed at 93.45, its lowest level in the last three weeks, weighed by a somewhat brighter market mood and a pause on the US Treasury bond’s rally.
GBP/USD: BoE’s aggressive rate hike cycle, not enough to lift the pound – MUFG
From a broader perspective, the FX analysis team at MUFG warns about further GBP weakness when monetary tightening is confirmed: The faster pace of tightening poses some upside risk to our pound forecasts in the near term. However, we are still sticking to our view that the GBP is more likely to weaken heading into year-end given the more challenging backdrop of slowing global growth, higher inflation and tightening liquidity conditions which should be less supportive for risk assets and high beta currencies like the pound.”
Technical levels to watch
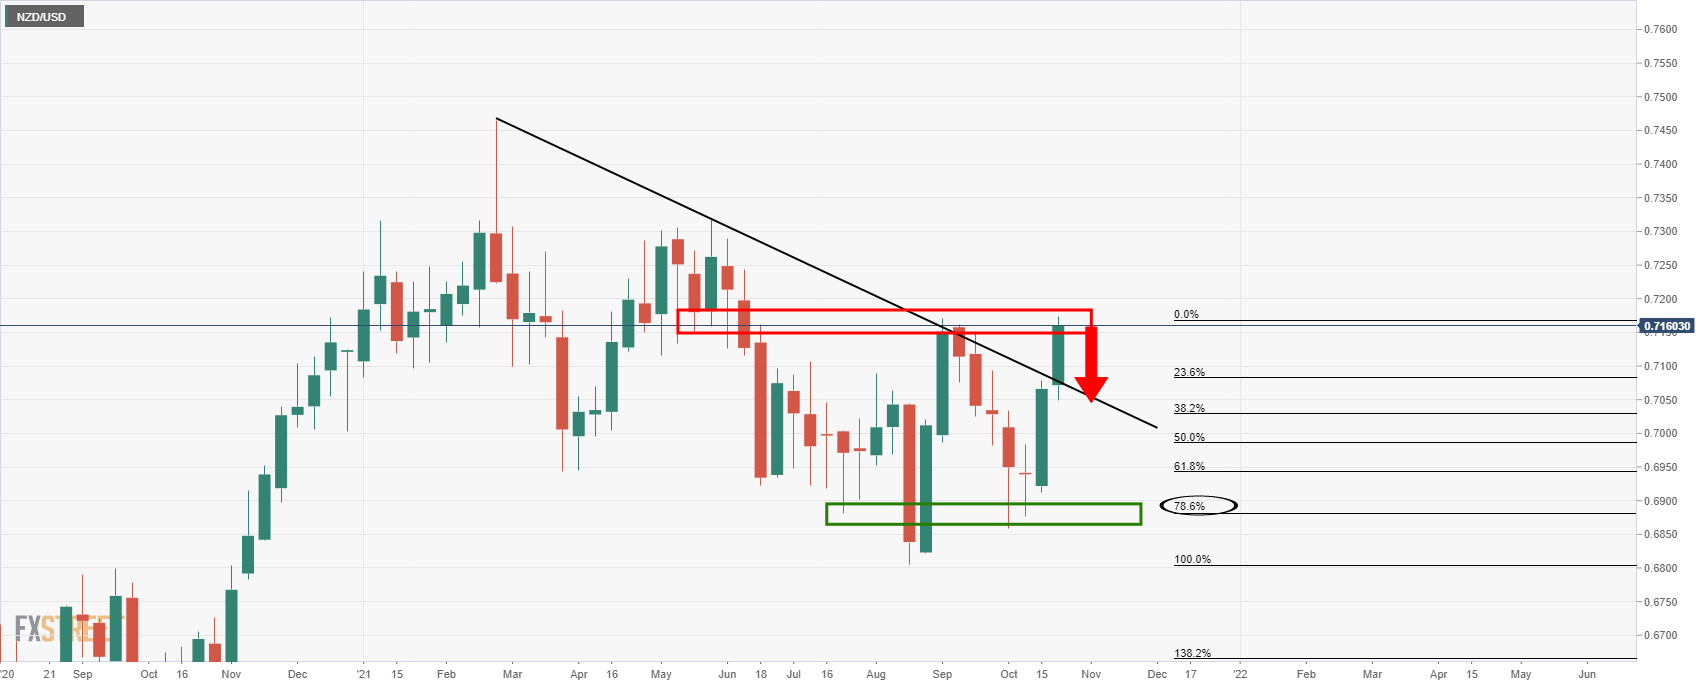
- NZD/USD runs into weekly and daily resistance, eye son the downside.
- 0.7050 is a confluence level of support to target.
The NZD/USD price has extended beyond the weekly resistance line as it was illustrated as a possibility in the analysis from Monday's North American session, NZD/USD Price Analysis: Meeting resistance and W-formation is bearish:
NZD/USD weekly chart, before & after
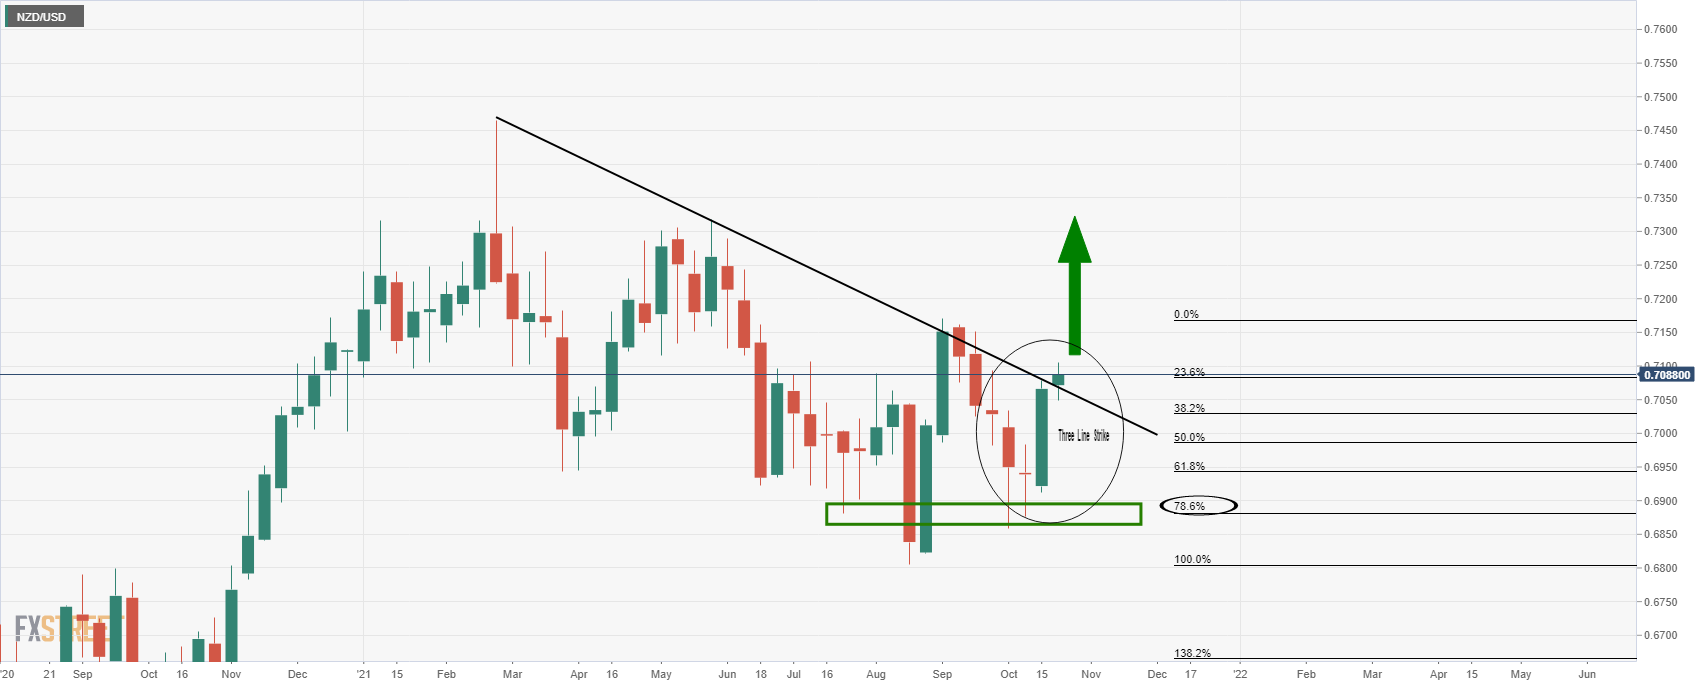
''Meanwhile, from a weekly perspective, the price has corrected deeply to a 78.6% Fibonacci from trendline resistance. It then shot higher in a three-line strike as pe the bodies of the candles. In any case, the bullish engulfing rally has penetrated the resistance line so there are prospects of a breakout, in contrast to the daily chart's W-formations.''
After ...
The price has rallied into a wall of resistance which could now serve as a supply zone that will reject NZD/USD for a restest the old dynamic resistance line as counter-trendline support.
NZD/USD daily W-formations
This would rhyme with the bearish reversion W-formations on the daily chart, as illustrated in Monday's daily chart analysis:
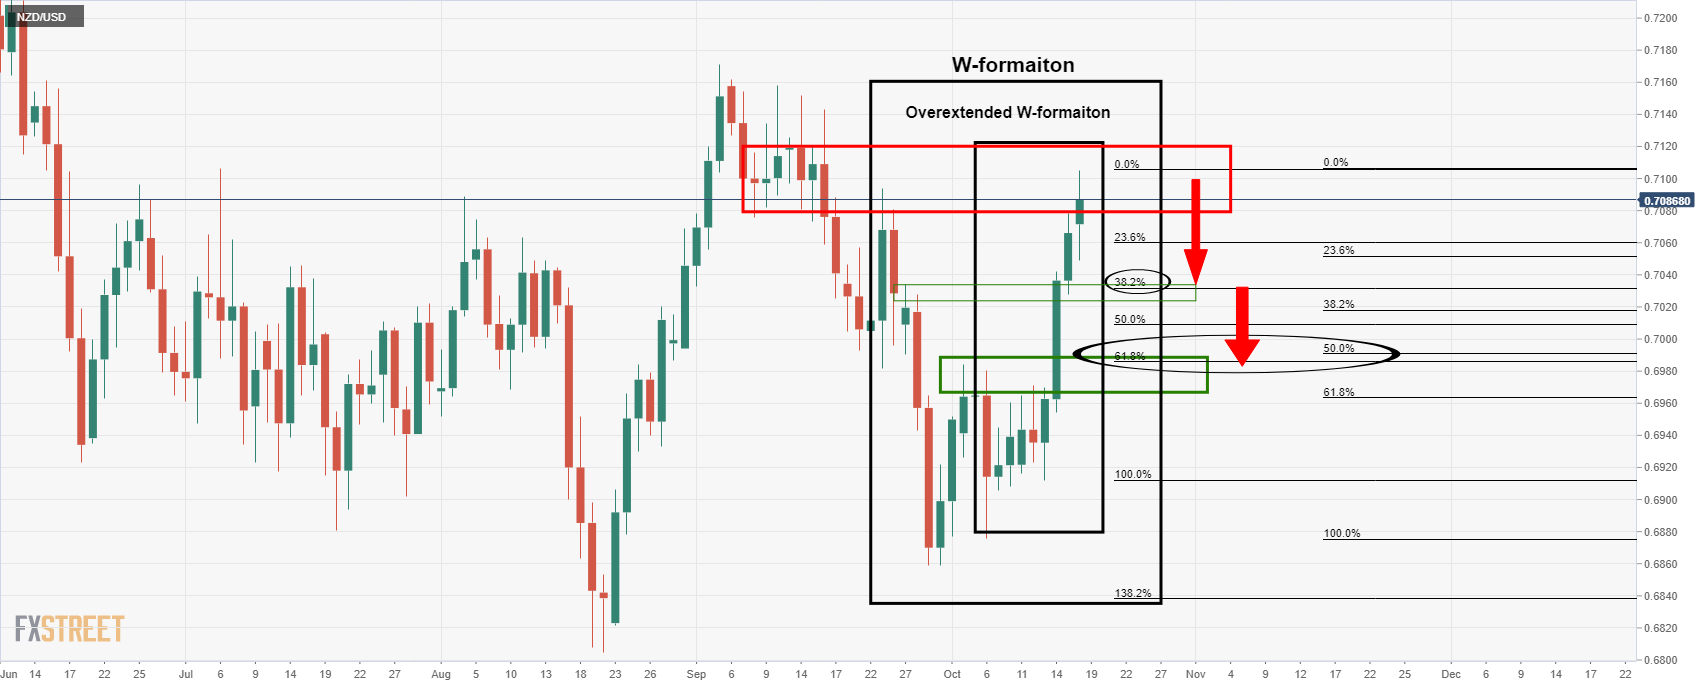
However, given the bullish extension, the analysis needs to be adjusted as follows:

The 38.2% Fibonacci channel between Wi and Wii offers a target area between 0.7080 and 0.7050 as the closest round numbers, the latter being aligned to the weekly counter trendline.
Federal Reserve Governor Christopher Waller was making remarks on Tuesday and outlining the case for why Fed officials may have misdiagnosed the current pace of price increases as temporary.
''If high inflation continues through the end of the year the Fed may have to adopt a more aggressive policy response to control it,'' he said.
Waller also said he too still believes the economy has seen the worst of the current coronavirus wave, that labour and other supply shortages will ease over time, and that "the escalation of inflation will be transitory.
''I still see supply and demand working here to moderate price increases so that inflation moves back toward 2%," the Fed's established target. That would mean any change in the Federal Reserve's key policy interest rate "is still some time off."
Waller said he feels the risks are shifting, and he is now "greatly concerned" the current fast rise in prices may continue.
"The next several months are critical for assessing whether the high inflation numbers we have seen are transitory," Waller said in remarks prepared for delivery at the Stanford Institute for Economic Policy Research.
"If monthly prints of inflation continue to run high through the remainder of this year, a more aggressive policy response than just tapering may well be warranted in 2022."
"Firms are reporting that they have more pricing power now than they have had in many years, as consumers seem to be accepting higher prices," he said.
Market implications
The greenback has struggled against its rivals as measured by the DXY index. These currencies, such as GBP, have been recently boosted by expectations of sooner-than-previously expected interest rate hikes. Additionally, US yields have appeared to stabilize on which has likely reduced demand for the greenback.
- EUR/GBP is range-bound during the New York session, trapped around the 0.8430-60 range.
- Central bank policy divergence will ultimately benefit the British pound.
- EUR/GBP: A break below 0.8400 could open the door for a test of 2020 lows around 0.8340.
The EUR/GBP edges lower during the New York session, losing 0.25%, trading at 0.8435 at the time of writing. Investors’ appetite for riskier assets is on, as US stock indices rise between 0.43% and 0.67%, on the back of good US Q3 corporate earnings, which seem to ease markets’ worries about inflation.
Central bank policy divergence boosts the British pound
Over the weekend, ECB President Christine Lagarde reiterated that inflation is transitory. Meanwhile, her counterpart BoE’s Governor Andrew Bailey commented that the Bank of England “Will have to act” to curb inflationary pressures.
EUR/GBP Price Forecast: Technical outlook
The EUR/GBP daily chart shows the pair is in a downtrend, but testing support at 0.8430, which was unsuccessfully tested two times. The Relative Strength Index (RSI), a momentum indicator, is at 34, edging lower, indicating downward pressure on the cross.
For British pound buyers, a breach below the 2021 lows could send the pair tumbling towards the 2020 lows of February 18, 2020, at 0.8348, followed by the 0.8300 figure. Nonetheless, cautions is warranted, as the RSI at 34 suggests the EUR/GBP pair could reach oversold levels that could trigger a correction before resuming the previous trend.
For euro buyers, a daily close above 0.8500 would be necessary to challenge EUR/GBP sellers. In that outcome, the first resistance level would be the confluence of the 50 and the 100-day moving averages (DMA’s) around the 0.8540-0.8555 area. A clear break of the before-mentioned could spur a rally towards the convergence of a downward slope trendline, with the 200-DMA and 0.8600 psychological level.
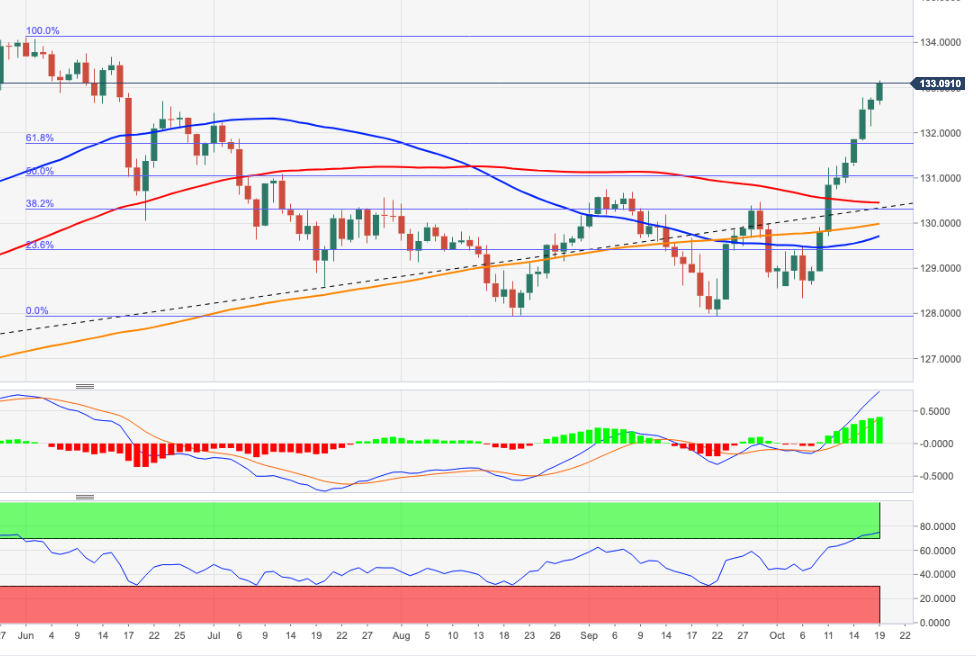
- The euro advances higher to reach four-month highs above 133.00.
- The yen remains sold across the board.
- EUR/JPY's rally might extend to 137.51 – Commerzbank.
The euro keeps trading higher against a weaker Japanese yen on Tuesday, buoyed by a higher risk appetite and broad-based yen weakness. The pair is set to extend its rally for the ninth consecutive day, reaching fresh four-month highs above 133.00.
The yen remains weak across the board
The EUR/JPY maintains its bid tone intact after having rallied about 3.5% over the last two weeks, favored by a weaker yen amid a combination of factors. The positive market mood, triggered by strong quarterly earnings by Johnson & Johnson and Travelers has supported the euro, to the detriment of the safe-haven yen, although the JPY is suffering longer-standing issues.
The yen has slumped to three-year lows against the US dollar, with the market positioning for an imminent announcement of QE tapering by the Federal Reserve and speculation about rate hikes in 2022 increases. These expectations have boosted US T-Bond yields, while the Bank of Japan maintains its yield control curve, ultimately crushing the yen’s appeal for the investors.
Beyond that, the surging price of energy, which the country has to import, is threatening to thwart the post-pandemic recovery, which is adding negative pressure on the JPY.
EUR/JPY’s rally could extend towards 137.51 – Commerzbank
From a technical perspective, Karen Jones, Team Head FICC Technical Analysis Research at Commerzbank, remains bullish on the pair and sees scope for a run to levels past 137.00: “EUR/JPY has maintained its gains. We look for a move to 132.69/80, the 23rd June high, and 78.6% retracement. This is regarded as the last defense for the 134.12 June peak (…) Longer-term, a break above here is favored and will introduce scope to 137.51.”
Technical levels to watch
- Precious metals are supported as the US dollar gives background to rival currencies.
- The stagflation theme is alive and well for the precious metals hedge.
- Silver prices are in a bullish cycle since bursting out from the Reverse Head and Shoulders formation.
The price of silver is firm on Tuesday as the US dollar gives back some ground while rival currencies play catch up due to their central banks taking part in the lift-off theme. At the time of writing, XAU/USD is trading at $23.7590, rising 2.44% on the day and travelling from a low of $23.1882 to a high of $24.1237.
The US dollar has struggled against its rivals on Tuesday in a bout of profit-taking that had otherwise benefitted by expectations of sooner-than-previously expected interest rate hikes. Additionally, US yields have appeared to stabilize on which has likely reduced demand for the greenback.
''Market pricing for Fed hikes is far too hawkish,'' analysts at TD Securities argued. ''The aggressive bear flattening trend in the US yield curve highlights the market's intense focus on pricing the Fed's exit. However, market pricing for Fed hikes fails to consider that a rise in inflation tied to a potential energy shock and lingering supply chain shortages would be unlikely to elicit a Fed response,'' the analysts said.
USD's rival currencies catching up
Moreover, currencies, including the Great British pound and the New Zealand dollar, are benefiting from rising interest rate increase expectations. The Bank of England has been sounding the inflation warnings and its intention to act while NZ's inflation report came in super hot this week also. As a result, the British pound rallied 0.60% to $1.3810 as money markets priced in a cumulative 35 basis points in rate hikes by the end of the year and the New Zealand dollar has gained 0.95% to $0.7152 after data on Monday showed the fastest consumer-price inflation in more than a decade.
Additionally, there has been a rise in short-term bond yields, with short-dated yields climbing comparatively more than in the United States, exposing the US dollar to profit-taking this week. This in turn has helped precious metals to stabilise and recover come ground with silver leading the way.
Silver technical analysis
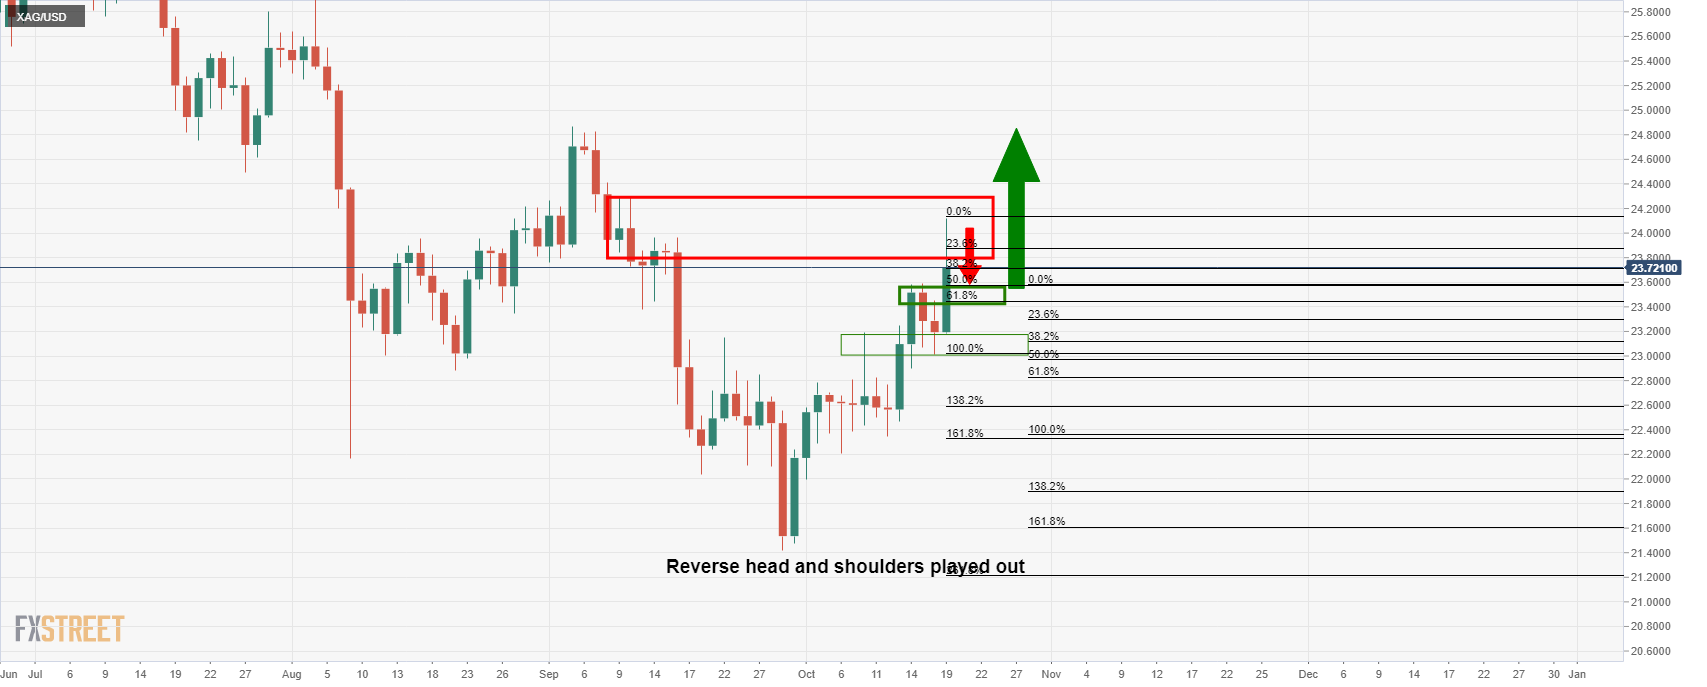
The price is silver has rallied from the daily head and shoulders set-up and in a classic breakout scenario, the price corrected to old resistance before the next push higher. At this juncture, the price is meeting the resistance of the old structure and would be expected to retrace to restest old resistance near 23.60 and where it meets a 61.8% Fibonacci retracement level. From there, a fresh bullish impulse could emerge.
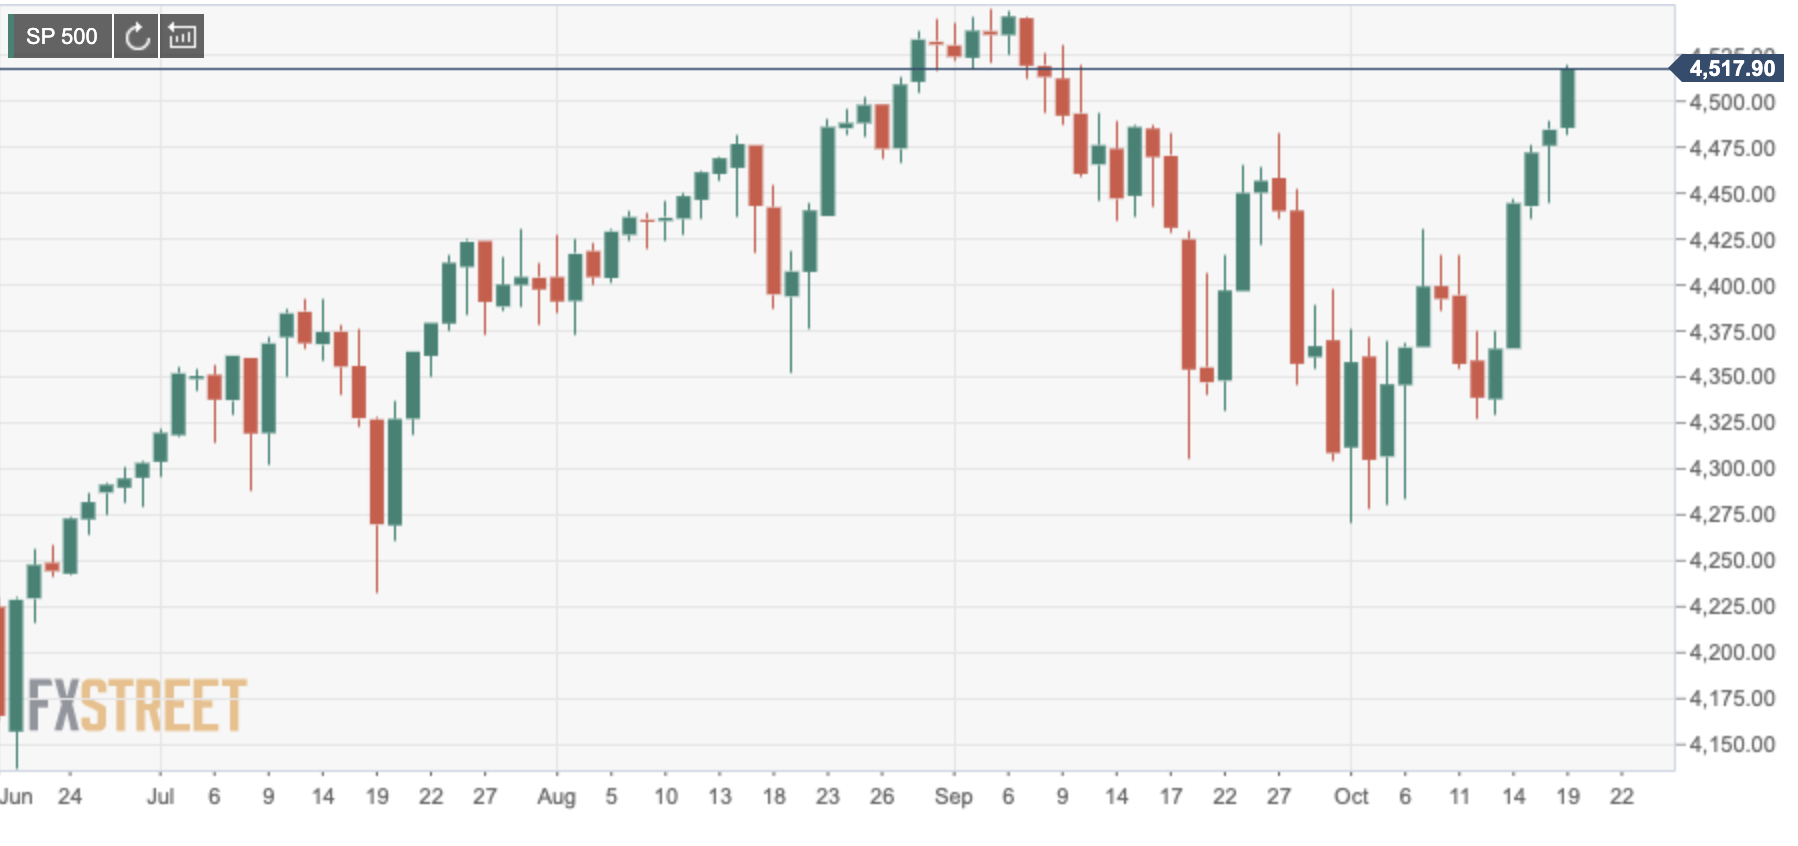
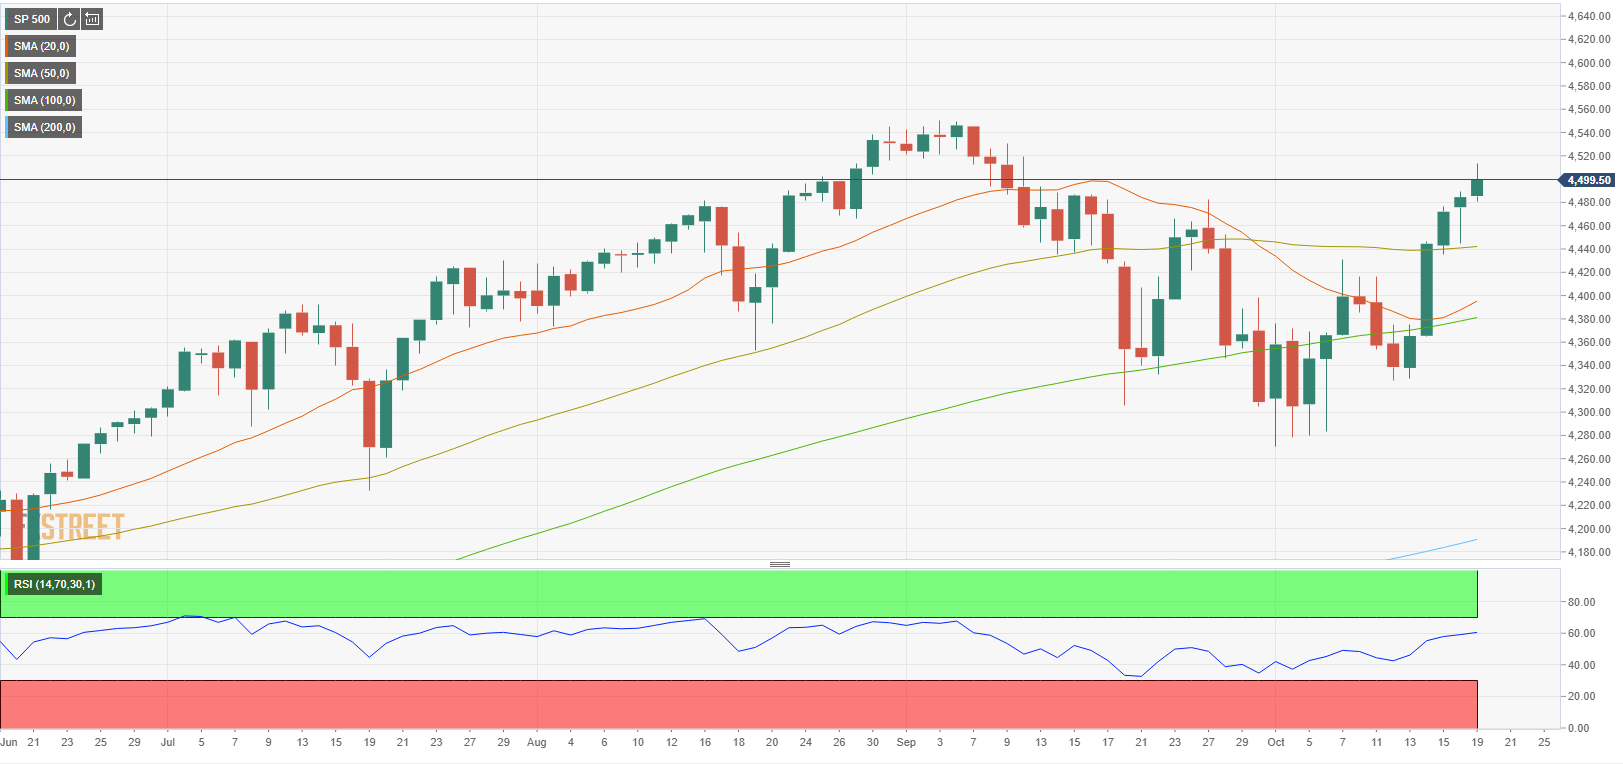
- The S&P 500 Index advances beyond 4.500 on a five-day rally.
- Upbeat quarterly earnings have boosted risk appetite.
The main Wall Street indexes are trading higher on Tuesday, with the S&P 500 reaching levels past 4,500 following a five-day rally. The positive quarterly earnings reported by Johnson and Johnson and Travelers have revived investors’ optimism seen last week after the upbeat results in the financial sector, with concerns about high inflation and supply chain disruptions fading into the background.
Johnson and Johnson’s shares are 4.10% up today after the company reported a 10.7% year-on-year increase in sales in the third quarter. Travelers Companies’ shares are 2.51% buoyed by better than expected sales results.
Down to sectors, the biggest winners are the Energy and Healthcare, up 1.37% and 1.22% up respectively, with the Consumer Staples sector 0.41% down as the worst-performing sector today.
On the macroeconomic front, US homebuilding activity contracted unexpectedly in September, revealing that shortages in raw materials and labor are starting to squeeze the sector. Housing starts declined by 1.6% in September, while building permits contracted at a 7.7% pace, casting doubt over the possibility of an immediate recovery.
S&P 500 daily chart
- The Australian dollar surges almost 1% as central banks around the globe normalize monetary policy.
- An upbeat market sentiment boosts the commodity currencies, like the AUD and the NZD.
- The RBA last meeting minutes confirmed that they would not hike rates to cool off the real estate market.
The AUD/USD is soaring during the New York session, gaining 0.99%, trading at 0.7484 at the time of writing. A positive market mood surrounds the financial markets, as US stock earnings ease concerns around elevated prices. The largest US stock indexes rise between 0.50% and 0.82%, while the greenback weakens across the board.
The Reserve Bank of Australia would not hike rates to cool off the real estate market
On Tuesday, the Reserve Bank of Australia unveiled the minutes of the last meeting. They said that higher interest rates would help lower upward prices in the real estate market, though it would come at the cost of fewer jobs and weaker wages growth. Furthermore, the minutes revealed that such a move would distance the bank from achieving monetary policy goals – namely, full employment and inflation around the 2-3% target.
RBA policymakers have been vocal about not raising rates to help them cool off of the real estate market, as they try to increase the pace of wages growth and return inflation to the 2-3% target on a sustainable basis.
Despite the abovementioned, investors have increased the odds of a 2022 interest rate hike. The Bank of England and other developed economies see their central banks switching towards a normal monetary policy. The outcome of those bets is the price action of the day, with commodity currencies like the Australian and the New Zealand dollar printing fresh highs against the greenback.
Meanwhile, the US economic docket featured the Housing Starts and the Building Permits for September. Housing Starts rose to 1.555M lower than the 1.62M expected. In contrast, the Building Permits, which measures the construction sector, increased to 1.589M, lower than the 1.68M, due to a shortage of skilled employees and elevated raw materials costs.
AUD/USD Price Forecast: Technical outlook
In the daily chart, the AUD/USD shows the spot price is above the September 3 high at 0.7477, which supports the upward move, but it would require a daily close above it to confirm the break of structure towards the upside.
In that outcome, the first resistance would be the psychological 0.7500. A breach of the latter would expose the 200-day moving average (DMA) at 0.7564, immediately followed by a downward slope trendline that confluences around the 0.7600 psychological resistance.
On the flip side, failure at 0.7477 would expose the AUD/USD to downward pressure that could tumble the pair towards 0.7400 and beyond.
Federal Reserve Governor Michelle Bowman said on Tuesday that the US may see inflation lasting longer than expected a few months ago.
Bowman did not comment on her outlook for monetary policy in remarks prepared for a virtual event hosted by the Richmond Fed.
However, she noted the obstacles making it difficult for many women to work, combined with an increase in retirements. She explained that this could hinder the labour market recovery and be a drag on the US economy.
''Women with young children left the labour force at a higher rate than other workers and some are still struggling to find childcare they can afford'', Bowman said.
''And many of the older workers who left the labour force during the pandemic, including a high share of women, may not return,'' Bowman added.
"The loss of these workers will limit the productive capacity of the economy, and may make it harder, or even impossible in the near term, to return to the high level of employment achieved before the pandemic," Bowman said in remarks prepared for the event.
Bowman did not comment on her outlook for monetary policy in the prepared remarks.
Market implications
Meanwhile, the US dollar has struggled against its rivals which have been recently boosted by expectations of sooner-than-previously expected interest rate hikes. Additionally, US yields have appeared to stabilize on which has likely reduced demand for the greenback.
- The US Dollar, steady above 113.85 returns near multi-year highs.
- The yen remains heavy on the back of Treasury yields' differentials.
- USD/JPY: Weakness seen as corrective while above 112.40 – Credit Suisse.
The US dollar has regained lost ground, after a weak opening against the Japanese yen on Tuesday. The pair retreated from the three-year high at 114.45 hit on Monday, to session lows at 113.85 before bouncing up and returning to the 114.30 area.
Risk appetite and flat US yields have weighed on the USD
The JPY attempted to bounce up, after having depreciated nearly 5% over the last four weeks. A higher risk appetite on the back of upbeat quarterly earnings results at Johnson and Johnson and Travelers had revived appetite for risk, while the consolidation of US T-Bond yields curbed demand for the USD offering some respite to its main rivals.
The yen’s rebound, however, has been short-lived. The Japanese currency, particularly sensitive to monetary policy differentials, remains heavy while the market positions for an imminent announcement that the Federal Reserve starts to taper its massive stimulus program. These expectations have been widening the treasury yield gap between the US and Japan -whose central bank maintains the 10-year note near zero through a yield control curve- which is crushing investors’ appeal for the yen.
USD/JPY: Weakness seen as corrective while above 112.40 – Credit Suisse
From a technical point of view, the FX Analysis team at Credit Suisse sees the pair biased higher while 112.40 support remains intact: “With a major base in place above the 112.40 high of 2019, we maintain our view that weakness will be corrective and temporary only. A clear break of 113.99 should mark a near-term top to add weight to our view for a setback to 113.81/61 initially, with fresh buyers expected here for now. A break can see a deeper retreat towards 113.08/04 but this will ideally prove the limit of the downturn.”
Technical levels to watch
- The dollar bounces up from multi-month lows at 1.2310.
- The pause on US bond yield's rally has weighed on the greenback.
- USD/CAD might reach 1.22 by year-end – Scotiabank.
The US dollar is trimming losses against its Canadian counterpart after having bottomed at 3, ½-month lows at 1.2310 earlier on Wednesday. The pair has returned to 1.2350, yet still about 0.25% down on the day.
The USD dips again as US yields’ rally stalls
The greenback has given away the mild recovery posted on Monday, weighed by a pause on US T-Bond yields’ rally and a higher appetite for risk. US yields have stalled near multi-year highs on Tuesday, after having surged over the last two weeks, with the investors positioning for an imminent announcement of QE tapering by the Federal Reserve.
Additionally, the better than expected earnings reports by Johnson & Johnson and Travellers have improved the market mood. These figures follow a string of bright results in the financial sector last week, to boost appetite for risk, weighing on demand for the safe-haven USD.
On a broader picture, the commodity-sensitive Canadian dollar remains buoyed by the solid rally on crude prices. The US benchmark WTI oil is trading at multi-year highs, beyond $83, which has pushed the CAD nearly 4% higher against the greenback over the last four weeks.
Macroeconomic data has not been of any help to the USD either, US building activity contracted unexpectedly in September, revealing that shortages in raw materials and labor are starting to squeeze the sector, and triggering concerns about its potential impact on the economic growth. Housing starts declined 7.7% in September, and August’s reading has been revised down to a 5.6% growth from the 6% previously estimated.
USD/CAD: Seen at 1.2200 ahead of the year-end – Scotiabank
From a technical perspective, the FX Analysis Team at Scotiabank observe further downside potential in the pair: “If the USD manages to steady around 1.2365/70 into this week, a modest correction could develop. We expect USD gains to remain limited to the low/mid 1.24s, however, with daily and weekly trend momentum signals aligned bearishly for the USD (…) We think USD/CAD can print a 1.22 handle ahead of year-end.”
Technical levels to watch
- Gold recovers after Friday’s crash, up 18% during the New York session.
- Risk-on market sentiment fueled some flows towards the non-yielding metal, weakening the greenback.
- XAU/USD: Strong resistance at $1,800 threatens to push gold prices towards the 2021 year low.
Gold (XAU/USD) climbs during the New York session, up 0.18%, trading at $1,768.11 at the time of writing. Investors’ mood is in risk-on mode, as solid US corporate earnings show that the US economy is strong, easing concerns about higher inflation. Furthermore, central banks around the globe tightening monetary policy conditions may help to bring down elevated prices.
Meanwhile, gold, the hedge against inflation, recovered some of its brightness since the Friday crash, which saw the yellow metal tumbling $32.00 on the back of a good US Retail Sales Report.
The US 10-year Treasury yield edges higher three and a half basis points (bps), sits at 1.620, whereas the greenback falls 0.25%, currently at 93.748, as risk appetite decreases the safe-haven status of the buck.
XAU/USD Price Forecast: Technical outlook
In the daily chart, XAU/USD briefly touched the 50-day moving average (DMA) at $1,778.43 but retreated due to intense selling pressure. Around the $1,800 area, the 100 and the 200-DMA’s confluence and a downward slope trendline add stress on gold.
Failure to break above the 100, 200-DMA, and the downward slope trendline, could send gold tumbling towards the October 6 low at $1,765.09. A breach of the latter would expose crucial support levels, as the September 29 low at $1,745.56, followed by the August 9 low at $1,687.78
On the flip side in the outcome of an upside break above the psychological $1,800 could pave the way for further gains, but there would be some hurdles on the way. The first resistance would be September 3 high at $1,834.02, followed by the June 11 high at $1,903.03.
- The euro retreats to 1.1640 from three-week highs at 1.1640.
- The dollar loses ground as US bond yields' rally stalls.
- EUR/USD: Above 1.1665, the pair might reach the mid-range of 1.17 – Scotiabank.
The euro has extended its recovery on Tuesday, fueled by a positive market mood, to reach the upper range of 1.1600 for the first time since late September. The pair has pulled back afterwards, to consolidate well above 1.1600, putting some distance from the 15-month low hit last week, at 1.1520 area.
US dollars weakness is giving a breather to the euro
The common currency has been buoyed by a weaker greenback on Tuesday. The US dollar is losing ground, weighed by a pause on the US T-Bond yields’, which had surged to multi-month highs over the last weeks, amid the increasing expectations of QE tapering by the Federal Reserve.
Furthermore, the brighter market sentiment, with Johnson & Johnson’s and Travellers posting better than expected quarterly earnings, have revived the optimism observed last week on the back of upbeat reports from the major banks, which has increased demand for riskier assets. The US Dollar Index, as a result, is trading about 0.25% lower on the day, after having bottomed at 93.45, its lowest level in the last three weeks.
On the macroeconomic front, US building activity has shown an unexpected contraction in September, revealing that shortages in raw materials and labour are starting to squeeze the construction sector and may have a negative impact on the third quarter's economic growth. Housing starts declined 7.7% in September, and August’s reading has been revised down to a 5.6% growth from the 6% previously estimated.
EUR/USD: Breach of 1.1665 could send the pair to the mid-range of 1.17 – Scotiabank
The FX Analysis team at Scotiabank sees the pair trading near a key resistance level that might offer a fresh impulse to the EUR/USD’s recovery: The EUR/USD rally has extended to retest 1.1665 resistance so it will be pivotal in determining whether this EUR rebound extends or starts to fizzle out (…) A push above 1.1665 will drive the EUR on to the mid-1.17s.”
Technical levels to watch
- The British pound recovers on the back of a hawkish BoE as investors increase the odds of a December’s rate hike.
- Positive market sentiment spurred by US corporate earnings and “stable” energy prices weaken the buck.
- Rising US T-bond yields reinforce the market’s expectations of a bond taper announcement at the Fed’s November meeting.
The GBP/USD stage a recovery of Monday’s losses, advances 0.53%, trading at 1.3799 during the New York session at the time of writing. Solid corporate earnings, stability around energy prices, and central banks tightening monetary policy keep investors on a positive tone.
The abovementioned triggered a dollar sell-off, witnessed by the US Dollar Index that measures the greenback’s performance against six peers, slides 0.30%, sits at 93.71, well below the 94.00 threshold, despite increasing odds of a bond tapering announcement by the Federal Reserve.
Meanwhile, the US 10-year Treasury yield climbs three basis points, up to 1.614%, reinforcing the markets expectations of the Federal Reserve tightening monetary conditions.
BoE and Fed monetary policy divergence, favors the British pound
Nonetheless, the Bank of England (BoE) and the Federal Reserve (Fed) diverge in their monetary policies. The BoE is already reducing its bond purchasing program, while the Fed could announce it in the November meeting. But as of the last couple of weeks, BoE policymakers like Michael Saunders and Governor Andrew Bailey have been vocal about higher prices, signaling that the bank could hike rates before the end of the year, giving an edge to the British pound over the greenback.
The US macroeconomic front featured the September Housing Starts for September, which rose to 1.555M lower than the 1.62M expected, trailing the August 1.58M. Further, the Building Permits increased to 1.589M shorter than the 1.68M foreseen by analysts.
The fall in the reading is due to supply-chain constraints, shortages of skilled employees, and elevated material costs that continue to challenge builders.
GBP/USD Price Forecast: Technical outlook
The GBP/USD pair reached a daily high around 1.3833 which tested the 200-day moving average (DMA) at 1.3843 but retreated the move below the 100-DMA that lies at 1.3806. The Relative Strength Index (RSI) at 61 indicates the pair still has upward pressure but is under heavy selling pressure, as dollar bulls defend the 1.3800-50 area.
For GBP/USD buyers to lift the pound higher, they will need a daily close above the 100 and the 200-DMA. In that outcome, the first resistance would be 1.3900. A breach of the latter could propel the pair towards the 1.4000 figure.
On the flip side, failure around the 1.3800-50 area could open the way for downward pressure that can tumble the pair, firstly towards the 50-DMA at 1.3710, and then the October 11 high at 1.3673 support.
European Central Bank (ECB) chief economist Philip Lane said on Tuesday that it is challenging to reconcile the market rate pricing with forward guidance, as reported by Reuters.
"Markets may not have fully absorbed the ECB's forward guidance," Lane added.
Market reaction
The shared currency came under modest selling pressure after these comments. As of writing, the EUR/USD pair, which touched a multi-week high of 1.1670 earlier in the day, was trading at 1.1632, where it was up 0.2% on a daily basis.
- Wall Street's main indexes continue to edge higher.
- Healthcare shares post strong gains after the opening bell.
Major equity indexes in the US opened in the positive territory on Tuesday as the market mood remains upbeat ahead of key quarterly earnings figures. As of writing, the S&P 500 was up 0.3% on the day at 4,500, the Dow Jones Industrial Average was rising 0.2% at 35,310 and the Nasdaq Composite was gaining 0.4% at 15,079.
Among the 11 major S&P 500 sectors, the Healthcare Index is up 0.8% as the top gainer after the opening bell. On the other hand, the Consumer Staples Index is losing 0.4%.
Earlier in the day, the data from the US showed that Building Permits and Housing Starts decreased by 7.7% and 1.6%, respectively, in September but these prints don't seem to be having a noticeable impact on risk sentiment.
Wake Up Wall Street: Risk is back, memes on the attack, but is Netflix set to crack?
S&P 500 chart (daily)
EUR/USD has repeatedly failed to hold below the 1.1550 area this month. Some pullback or consolidation is not exceptional, therefore, economists at Rabobank stick to the view of lower EUR/USD ahead.
EUR/USD still seen at 1.15 on a three-month view
“We are viewing the current pullbacks in the USD as corrective and continue to expect the USD to push higher over the medium-term.”
“While the recent sell-off in the EUR suggests it may be more sensitive to hawkish remarks from ECB members in the build-up to forthcoming ECB meetings, the cautious stance of the policy guidance from the central bank suggests that room for a concerted recovery in the EUR is still limited.”
“On the margin, the approach of the French Presidential election next year and the tensions regarding the rule of law between the EU and Poland and Hungary may also weigh on the EUR going forward.”
“We retain our three-month forecast of EUR/USD 1.15.”
The GBP/USD pair is making some clear headway above the 1.38 area. A test of the 200-day moving average (DMA) at 1.3848 is on the radar, economists at Scotiabank report.
Short-term cable bullish
“OIS pricing does reflect a minor check in the recent firming in rate hike expectations but this likely reflects broader market moves rather than any real doubts about the BoE outlook at this point we remain constructive on the GBP on the crosses.”
“We are cautious about reading too much into developments but the GBP enjoys the backing of solid trend oscillators on the intraday and daily studies and is trading well through key, short-term MA signals which puts the 200-DMA at 1.3848 on the radar.”
“Key resistance is 1.3913, the mid-September high.”
- USD/TRY clinches new all-time peak around 9.3700.
- The lira remains under heavy pressure ahead of the CBRT.
- Investors see the CBRT cutting rates on Thursday.
Another day, another all-time high in USD/TRY. This time, the pair advanced to the 9.3700 area after losing some upside traction.
USD/TRY keeps looking to the CBRT
Curiously, the lira now manages to regain some composure and forces USD/TRY to abandon the area of recent all-time highs near 9.3700 and head lower towards the 9.3200 zone on Tuesday.
The selloff in the greenback in combination with extreme overbought levels of the pair might have combined to spark the ongoing knee-jerk in spot, although it should be considered temporary, as the risk for TRY remains tilted well to the downside for the time being.
Indeed, the broad consensus among investors expects the Turkish central bank (CBRT) to reduce further (100 bps?) the One-Week Repo Rate at its event on Thursday. It is worth recalling that the depreciation in the lira gathered unusual pace after President Erdogan removed three CBRT officials earlier in the month, undermining further the credibility around the monetary authority (if there still was some left).
However, prospects for a reduction of the policy rate have been growing since CBRT Governor S.Kavcioglu announced some weeks ago that the core inflation rate will now be used to set the level of the key interest rate. So, all in all, the September’s interest rate cut should not have surprised anybody…
USD/TRY key levels
So far, the pair is losing 0.13% at 9.3163 and a drop below 9.0873 (10-day SMA) would aim for 8.9588 (20-day SMA) and finally 8.8317 (monthly low Oct.4). On the other hand, the next up barrier lines up at 9.3699 (all-time high Oct.19) followed by 10.0000 (round level).
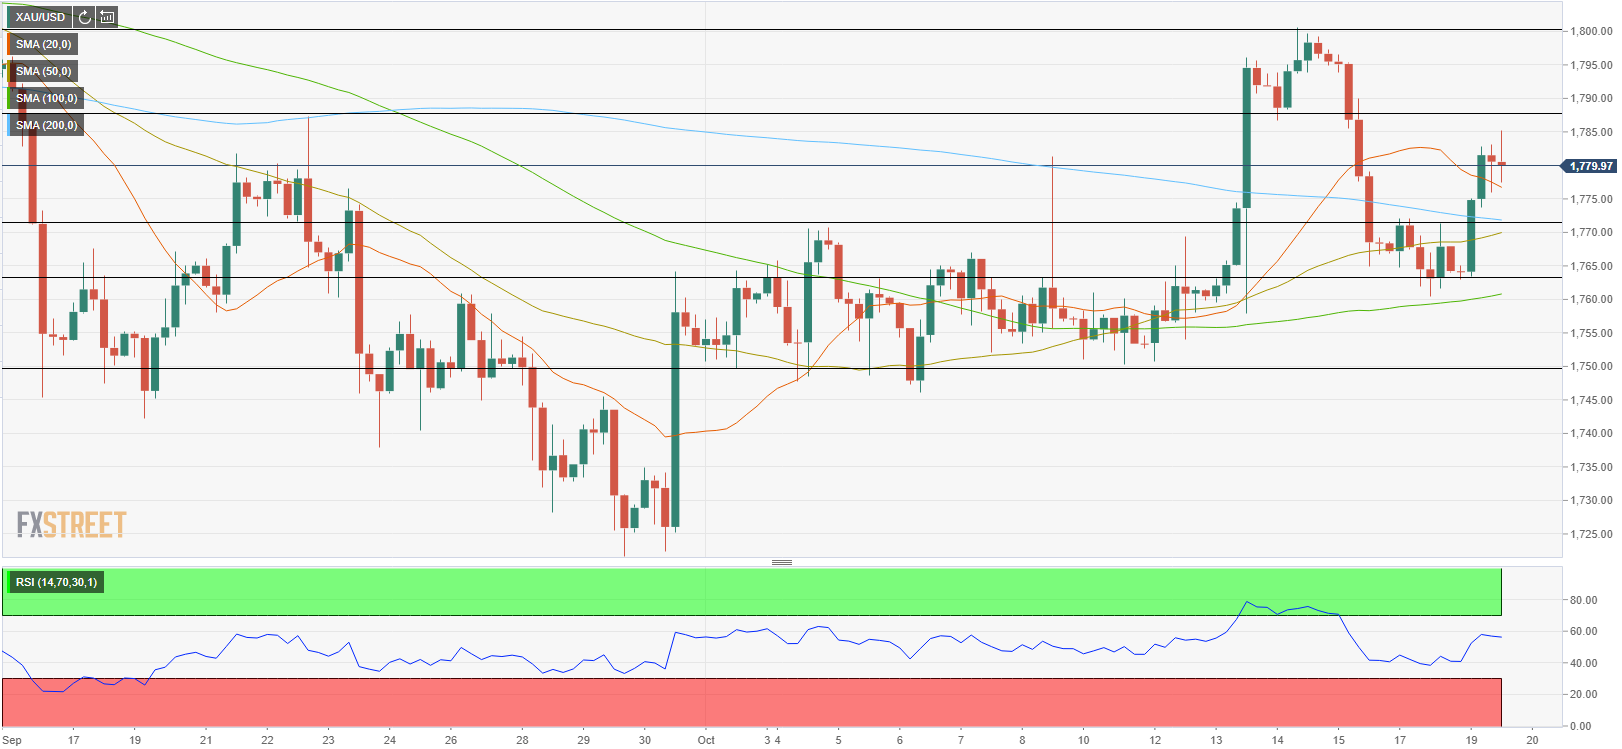
- Gold is trading above $1,780 in early American session.
- 10-year US Treasury bond yield rose into the positive territory above 1.6%.
- Greenback remains on the back foot after disappointing US data.
The XAU/USD pair broke above $1,770 in the European session and climbed to a daily high of $1,785 in the last hour before edging slightly lower. As of writing, the pair was up 0.85% on the day at $1,780.
Earlier in the day, the broad-based selling pressure surrounding the dollar and falling US Treasury bond yields fueled the gold's rally.
With risk flows dominating the financial markets, the US Dollar Index (DXY) dropped to a multi-week low of 93.50. The data from the US showed on Tuesday that Housing Starts and Building Permits fell by 1.6% and 7.7%, respectively, in September. Although the initial market reaction to these readings was largely muted, the dollar started to find some demand on the back of recovering US T-bond yields.
At the moment, the benchmark 10-year US T-bond yield is up 0.5% on the day at 1.61% and the DXY is down 0.28% at 93.68, capping gold's upside for the time being.
Meanwhile, major equity indexes in the US remain on track to open in the negative territory, suggesting that the greenback is likely to remain on the back foot if the market mood remains upbeat in the second half of the day.
There won't be any high-tier data releases from the US in the remainder of the day and investors will remain focused on the risk perception and yields.
Gold technical outlook
The Relative Strength Index (RSI) indicator on the four-hour chart is holding near 60, suggesting that there is more room on the upside before gold becomes technically overbought. Additionally, the previous two candles on the same chart closed above the 200-day SMA, confirming the bullish bias.
The initial resistance is located at $1,787 (September 22 high) ahead of $1,800 (psychological level, static resistance). On the downside, $1,770 (former resistance, 200-period SMA) aligns as the first support before $1,763/60 (static level, 100-period SMA) and $1,750 (static level).
EUR/USD’s bounce tests 1.1665 key resistance. Above here, the world’s most popular currency pair would move to the mid-1.17s but ECB policymakers stay dovish, limiting euro’s upside potential, economists at Scotiabank report.
ECB members remark the cautious stance of the policy guidance
“ECB’s Rehn and Villeroy were speaking earlier and both senior policymakers reiterated the ECB’s dovish policy outlook. The broader dovishness among ECB policymakers gives us little confidence that the EUR rally will extend significantly in the near to medium term.”
“The EUR/USD rally has extended to retest 1.1665 resistance so it will be pivotal in determining whether this EUR rebound extends or starts to fizzle out.”
“A push above 1.1665 will drive the EUR on to the mid-1.17s.”
- Building Permits in US fell sharply in September.
- US Dollar Index stays in the negative territory, holds above 93.50.
Housing Starts in the US declined by 1.6% on a monthly basis in September after rising by 1.2% in August, the data published jointly by the US Census Bureau and the US Department of Housing and Urban Development showed on Tuesday.
Further details of the publication revealed that Building Permits, which rose by 5.6% in August, plunged by 7.7% in the same period.
Market reaction
The US Dollar Index managed to recover modestly from daily lows after the data and was last seen losing 0.3% on a daily basis at 93.65.
The International Monetary Fund said on Tuesday that it expects the Chinese economy to grow by 8% in 2021 but added that the economic recovery remains unbalanced, as reported by Reuters.
Additional takeaways
"Asia's economy to expand 5.7% in 2022, up 0.4% from April forecast."
"Untimely policy normalization or misconstrued policy communications' by the US could trigger capital outflow, push up borrowing costs for Asian emerging economies."
"Risks to Asia growth tilted down on pandemic uncertainty, supply chain disruptions, potential spillovers from fed policy normalisation."
"Asia's economy to expand 6.5% in 2021, down 1.1% from April forecast."
Market reaction
This report doesn't seem to be having a noticeable impact on market mood. As of writing, the S&P Futures were up 0.5% at 4,500.
- EUR/USD advances for the second session in a row above 1.1600.
- The 1.1700 level and the 55-day SMA at 1.1719 come next.
EUR/USD accelerates gains to the 1.1670 region on Tuesday, opening the door at the same time for the continuation of the move higher.
That said, and after surpassing the previous top at 1.1624 (October 14), the pair could now attempt to retake the round level at 1.1700 the figure ahead of the interim hurdle at the 100-day SMA, today at 1.1719. Further north comes the short-term resistance line around 1.1740. A breakout of the latter should see the selling pressure mitigated and therefore allow for extra gains to the next relevant resistance in the mid-1.1700s.
In the meantime, the near-term outlook for EUR/USD is seen on the negative side below the key 200-day SMA, today at 1.1924.
EUR/USD daily chart
- AUD/USD is clinging to strong daily gains on Tuesday.
- Upbeat market mood is helping AUD find demand.
- US Dollar Index remains on the back foot ahead of mid-tier data.
After managing to close near 0.7400 on Monday, the AUD/USD pair regained its traction during the Asian trading hours on Tuesday and climbed to its highest level since early September at 0.7476 before going into a consolidation phase. As of writing, the pair was up 0.78% on a daily basis at 0.7468.
DXY turns south as risk flows return
The positive shift witnessed in market sentiment seems to be boosting AUD/USD on Tuesday. Reflecting the upbeat mood, US stock index futures are up between 0.4% and 0.5%, suggesting that Wall Street's main indexes remain on track to open in the positive territory. On the flip side, the greenback is struggling to find demand as a safe haven and the US Dollar Index (DXY) is losing 0.4% at 93.57.
Earlier in the day, the Reserve Bank of Australia's (RBA) meeting minutes didn't offer any fresh insights into the bank's policy outlook. The RBA reiterated that the economic activity is expected to return to pre-pandemic levels in the second half of 2022 and added that they don't expect to reach the inflation target until 2024.
Later in the session, September Housing Starts and Building Permits data from the US will be looked upon for fresh impetus.
On Wednesday, the Westpac Leading Index for September will be featured in the Australian economic docket.
Technical levels to watch for
- DXY accelerates losses and retests the 93.50 zone on Tuesday.
- There is an interim support at the 93.18, the 55-day SMA.
DXY extends the downside for the fifth consecutive session on Tuesday and visits again the 93.50 region, where some initial contention turned up so far.
In case the selling impulse gathers further steam, the 55-day SMA at 93.18 should offer some minor contention ahead of a deeper pullback to the 93.00 neighbourhood (low September 23). Further south comes the 100-day SMA, today at 92.57.
Looking at the broader picture, the constructive stance on the index is seen unchanged above the 200-day SMA at 91.82.
DXY daily chart
In an interview with Reuters on Tuesday, European Central Bank (ECB) policymaker Bostjan Vasle said there are early signs that wage pressures in the euro area could become material and pose inflation risks.
Additional takeaways
"ECB should end the Pandemic Emergency Purchase Program (PEPP) in March if economic trends continue."
"Real financing conditions remain favourable despite nominal yield rises."
"Open to discussion on keeping some but not all of PEPP's flexibility."
Market reaction
The EUR/USD pair consolidates its impressive daily gains ahead of the American session and was last seen rising 0.45% on the day at 1.1660.
- GBP/USD preserves its bullish momentum during the European session.
- US Dollar Index continues to push lower toward 93.50.
- Wall Street's main indexes remain on track to open higher.
The GBP/USD pair continued to push higher during the European trading hours and reached its strongest level in a month at 1.3832. As of writing, the pair was up 0.75% at 1.3828.
USD selloff picks up steam
The heavy selling pressure surrounding the greenback on Tuesday seems to be fueling the pair's rally. In the absence of high-tier macroeconomic data releases, the risk-positive market environment is making it difficult for the dollar to find demand. The US Dollar Index was last seen losing 0.42% on the day at 93.55.
Later in the session, September Housing Starts and Building Permits data will be featured in the economic docket. In the meantime, the US stock index futures are up between 0.35% and 0.45%, suggesting that risk flows are likely to continue to dominate the financial markets in the second half of the day.
On the other hand, increasing Bank of England rate hike expectations ahead of Wednesday's September UK inflation report is allowing the British pound to outperform its rivals.
UK September CPI Inflation Preview: Will rising price pressures boost British pound?
Technical levels to watch for
Quek Ser Leang at UOB Group’s Global Economics & Markets Research noted that USD/IDR is unlikely to breach the key support at 14,000 for the time being.
Key Quotes
“We highlighted last Monday (11 Oct, spot at 14,210) that ‘downward momentum has increased’. We added, ‘a break of September’s low at 14,170 would not be surprising but the next major support at 14,120 is unlikely to come under threat’. We underestimated the downward momentum as USD/IDR cracked both 14,170 and 14,120 (USD/IDR dropped to 14,050 on Friday before extending its decline earlier today). Not surprisingly, the rapid drop is severely oversold but with no signs of stabilization just yet, further weakness is not ruled out.”
“That said, in view of the deeply oversold conditions, a break of the round-number support at 14,000 appears unlikely. On the upside, a breach of 14,140 would indicate that the current weakness has stabilized.”
- EUR/JPY’s needle-like rally remains everything but abated on Tuesday.
- There is now scope for a visit to the 2021 highs past 134.00 near term.
EUR/JPY extends the upside momentum and already surpasses the key barrier at 133.00 the figure on turnaround Tuesday.
The sharp move higher shows no signs of exhaustion so far, although the current overbought condition of the cross could trigger some consolidation or even a corrective move in the short-term horizon. Once digested one or the other, the cross should be able to resume the uptrend and attempt an assault to the YTD high at 134.12 recorded on June 1.
In the broader scenario, while above the 200-day SMA at 129.94, the outlook for the cross is expected to remain constructive.
EUR/JPY daily chart
EUR/USD has started to push higher. Analysts at Credit Suisse look for a deeper corrective rebound to 1.1671, then the 55-day average at 1.1720.
See: EUR/USD set to see further gains towards the 1.1750 level – SocGen
Support at 1.1608 to hold
“EUR/USD’s strong rebound suggests a more concerted but still corrective recovery can emerge with resistance seen next at the 38.2% retracement of the September/October fall and price resistance at 1.1663/71. Whilst this should be allowed to cap at first our bias is now for a break in due course for a move to what we look to be tougher resistance from the 55-day average at 1.1720. We would start to look for signs of a fresh peak here.”
“Support is seen at 1.1625/20 initially, then 1.1608 which now ideally holds to keep the immediate bias higher. Below 1.1571/66 though is needed to suggest the rebound is over for a fall back to 1.1529/24, then our 1.1495 first objective.”
USD/JPY has been capped at the 2018 highs at 114.55 as suspected and a pullback is seen underway. With a major base seen in place, weakness stays seen as corrective only ahead of an eventual break in due course for 117.12, economists at Credit Suisse report.
A setback is looked for
“With a major base in place above the 112.40 high of 2019, we maintain our view that weakness will be corrective and temporary only. A clear break of 113.99 should mark a near-term top to add weight to our view for a setback to 113.81/61 initially, with fresh buyers expected here for now. A break can see a deeper retreat towards 113.08/04 but this will ideally prove the limit of the downturn.”
“Resistance is seen at 114.36 initially. Above 114.45/55 can quickly reassert the uptrend for the 114.73 high of November 2017 next ahead of the 78.6% retracement of the December 2016/March 2020 fall at 114.92 and then 117.12 in due course, the long-term downtrend from April 1990.”
Tin (LME) is seen trading in new all-time highs. Axel Rudolph, Senior FICC Technical Analyst at Commerzbank, sees the metal striving for the psychological 40000 mark.
Key support is located at the 31305/31250 area
“Tin is trading in new all-time highs and is fast approaching the minor psychological level at 40000 with a 161.8% Fibonacci extension of the 2005-2008 advance projected higher from the 2008 low coming in at 41601.10.”
“Support can be found between the August and September highs at 36830/35955. Further support comes in between the late August high and the 55-day moving average at 34640/34615.10.”
“Key support remains to be seen between the August and September lows at 31305/31250.”
- A combination of factors pushed GBP/JPY to fresh multi-year tops on Tuesday.
- The recent hawkish signals from BoE continued underpinning the British pound.
- The risk-on mood undermined the safe-haven JPY and contributed to the rally.
The GBP/JPY cross added to its intraday gains and shot to the highest level since June 2016, around the 157.60 region during the first half of the European session.
Following the previous day's consolidative price moves, the GBP/JPY cross caught fresh bids on Tuesday and resumed its strong bullish momentum witnessed since the beginning of this month. This marked the ninth day of a positive move in the previous ten and was supported by a combination of factors.
The British pound was underpinned by the recent hawkish remarks from the Bank of England officials, signalling an imminent interest rate hike later this year. In fact, the BoE Governor Andrew Bailey said that the UK central bank will have to act amid increasing risks to medium-term inflation expectations.
This comes on the back of a positive Brexit development, which continued acting as a tailwind for the sterling and provided a strong lift to the GBP/JPY cross. It is worth recalling that the European Union agreed to scrap most checks on goods arriving into Northern Ireland from the rest of the UK.
On the other hand, the underlying bullish sentiment in the financial markets undermined the Japanese yen's relative safe-haven status. This was seen as another factor that contributed to the GBP/JPY pair's bullish trajectory, taking along some trading stops placed near the 157.35-40 area.
In the absence of any major market-moving economic releases, the GBP/JPY cross seems all set to extend its appreciating move. However, extremely overbought conditions on short-term charts warrant some caution for bullish traders ahead of the latest UK consumer inflation figures on Wednesday.
Technical levels to watch
USD/MYR should keep the range bound theme unchanged between 4.1480 and 4.1760 so far, suggested Quek Ser Leang at UOB Group’s Global Economics & Markets Research.
Key Quotes
“Last Monday (11 Oct, spot at 4.1670), we highlighted that ‘downward pressure has increased’. We added, ‘there is room for USD/MYR to break 4.1600 but the next support at 4.1530 could be out of reach’. While our view for a weaker USD/MYR was not wrong, the subsequent weakness exceeded our expectations as USD/MYR plummeted to 4.1450 last Thursday (14 Oct).”
“The rebound from the low amid oversold shorter-term conditions suggest that there is little scope for USD/MYR to break the next major support at 4.1400 (rising trend-line that started in April). For this week, USD/MYR is more likely to consolidate and trade between 4.1480 and 4.1760.”
Analysts at Commerzbank view the August peak at 8.8549 as an interim high for the USD/SEK pair. They look for a slide back to the base of the channel at 8.3253.
USD/SEK has already failed at the 8.8549 August high
“Market has failed at the top of its one year channel and August high at 8.8549.”
“We would allow for a slide back to the base of the channel at 8.3253.”
Base metals continue to look bid. Copper (LME) is seen surging higher towards its all-time high at 10747.50, Axel Rudolph, Senior FICC Technical Analyst at Commerzbank, reports.
Dips to find support around the 9924.00/9755.50 region
“LME Copper’s surge higher last week has taken us by surprise with the May all-time high at 10747.50 being within reach. If bettered, the minor psychological 11000.00 level would be in focus. Further up a 261.8% Fibonacci extension can be found at 12303.50.”
“Slips should find support between the July and September highs at 9924.00/9755.50. Further minor support comes in between the early July and late August lows at 9632.50/9546.50 as well as at the 9431.00 late September high.”
NZD/USD has broken above the 2021 downtrend and its 200-day moving average at 0.7101/04. The kiwi is expected to rally to the 0.7462/0.7559 long term pivot, according to Karen Jones, Team Head FICC Technical Analysis Research at Commerzbank.
NZD/USD has reversed from its 200-week ma
“NZD/USD yesterday broke above the 2021 downtrend and its 200-day ma and its 55-week ma at 0.7101/04, this was one tough nut to crack and the break above here should lead to some further dollar weakness.”
“Target 0.7462/0.7559 long-term pivot.”
“Based ahead of the 200-week ma at 0.6765.”
- A combination of factors prompted fresh selling around USD/CAD on Tuesday.
- The downfall has now dragged the pair to descending trend-channel support.
- Slightly oversold conditions warrant caution before placing fresh bearish bets.
The USD/CAD pair continued losing ground through the first half of the European session and fell to the 1.2320 region, or over three-month lows in the last hour.
The dominant risk-on mood in the financial markets prompted aggressive selling around the safe-haven US dollar, which fell to three-week lows on Tuesday. Conversely, a fresh leg up in crude oil prices underpinned the commodity-linked loonie and exerted some downward pressure on the USD/CAD pair.
From a technical perspective, the pair has been trending lower along a downward sloping channel from September monthly swing highs, around the 1.2900 mark. Bearish trades might now wait for a sustained break through the channel support before placing fresh bets amid near-term oversold conditions.
A convincing break below the trend-channel support, currently around the 1.2325 region, will set the stage for an extension of the depreciating move. The USD/CAD pair might then turn vulnerable to break below the 1.2300 mark and accelerate the slide towards the next relevant support near mid-1.2200s.
On the flip side, any attempted recovery move might now confront immediate resistance near the 1.2370-75 region. This is closely followed by the overnight swing highs, around the 1.2400-1.2410 area, which if cleared decisively might trigger a near-term short-covering move around the USD/CAD pair.
That said, any subsequent move up might still be seen as a selling opportunity and runs the risk of fizzling out rather quickly near the key 1.2500 psychological mark. The latter represents a confluence barrier comprising of the very important 200-day SMA and the top end of the mentioned channel.
USD/CAD daily chart
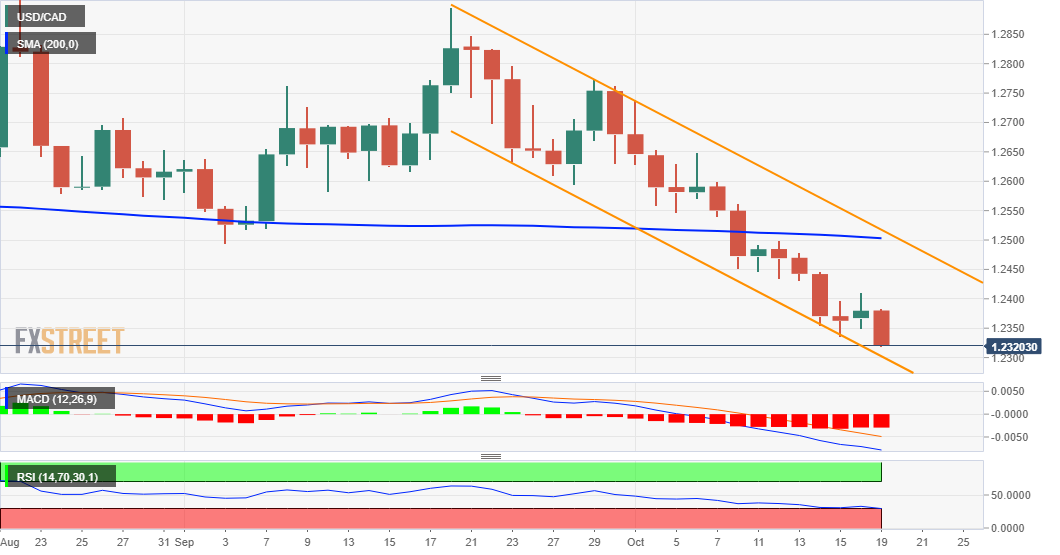
Technical levels to watch
The European Central Bank (ECB) Governing Council Member Olli Rehn made some comments on the inflation and economic outlook on Tuesday.
Key quotes
In Europe still plenty of economic slack.
Euro area inflation still mostly transitory.
Some components partly more persistent than previously thought.
If elevated inflation lasts much longer, it will likely have effect on expectations.
Evidence speaking for transitory inflation is quite convincing.
Core inflation still subdued.
No major evidence of 2nd round effects.
ECB leans on side of not overreacting.
In its latest policy paper, the Organisation for Economic Co-operation and Development (OECD) warned that the world is likely to face massive fiscal difficulties in the coming decades, worse than the bloated public debt seen during the Covid-19 pandemic.
Key takeaways
“According to its long-term scenario, a deceleration in large emerging economies, demographic change and slowing productivity gains will drag trend economic growth among the OECD’s 38 members and the Group-of-20 nations to 1.5% in 2060 from around 3% currently. “
“At the same time, states will face rising costs, particularly from pensions and health care.”
“To maintain public services and benefits while stabilizing debt in that environment, governments would have to raise revenues by nearly 8% of gross domestic product.”
“Secular trends such as population aging and the rising relative price of services will keep adding pressure on government budgets.”
“Fiscal pressure from these long-run trends dwarf that associated with servicing Covid-legacy public debt.”
Related reads
- Forex Today: Dollar loses ground as risk flows dominate markets
- OECD trims global growth forecast to 5.7% for 2021 from 5.8% in May
- Gold price jumps 1% as the US dollar keeps losing ground across the board.
- Retreat in Treasury yields, risk-on mood aid the rebound in gold price.
- Gold: Sellers defend $1,800, all eyes on US T-bond yields.
Gold price is rebounding 1% so far this Tuesday, reversing half the sell-off seen since Friday, as bulls aim for the $1800 barrier once again. The relentless decline in the US dollar across the board is helping gold price stage an impressive turnaround. The risk-on flows are weighing heavily on the dollar’s safe-haven demand, underpinning gold price. Expectations of strong corporate earnings reports from the US, especially from the tech sector, has overshadowed the concerns over rising inflation and global economic growth. The retreat in the US Treasury yields is also boding well for gold price amid a data-light Tuesday.
Read: Gold Price Forecast: XAU/USD rebounds towards key $1795 barrier but downside risks remain intact
Gold Price: Key levels to watch
According to the Technical Confluences Detector, gold is on a steady road to recovery, now challenging the convergence of the pivot point one-day R3 and the previous high four-hour at $1783.
The next stop for gold bulls is seen around $1791, where the Fibonacci 23.6% one-week coincides with the Fibonacci 61.8% one-month.
Further up, the critical SMA200 one-day at $1795 will come into play. At that level, the pivot point one-week R1 intersects.
The previous week’s high at $1801 will then test the bearish commitments.
However, rejection at higher levels could recall the sellers to test the immediate support around $1778, the confluence of the SMA50 one-day and Bollinger Band four-hour Middle.
The next crucial cushion is seen at $1772, the meeting point of the previous day’s high and SMA200 four-hour.
A dense cluster of healthy support levels are placed around $1770, which will limit the additional downside in gold price.
The demand area is comprised of the Fibonacci 61.8% one-week, SMA50 four-hour and SMA200 one-hour.
The line in the sand for gold buyers appears at $1765, the convergence of the Fibonacci 38.2% one-month and one-day.
Here is how it looks on the tool
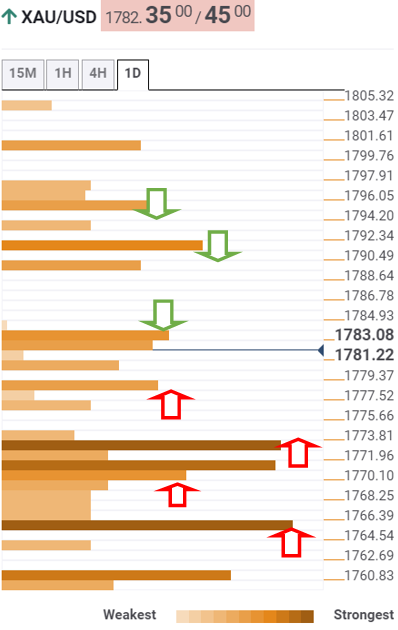
About Technical Confluences Detector
The TCD (Technical Confluences Detector) is a tool to locate and point out those price levels where there is a congestion of indicators, moving averages, Fibonacci levels, Pivot Points, etc. If you are a short-term trader, you will find entry points for counter-trend strategies and hunt a few points at a time. If you are a medium-to-long-term trader, this tool will allow you to know in advance the price levels where a medium-to-long-term trend may stop and rest, where to unwind positions, or where to increase your position size.
- GBP/USD regained strong positive traction on Tuesday amid a broad-based USD weakness.
- The recent hawkish BoE signals underpinned the British pound and remained supportive.
- A sustained move beyond 100-day SMA will set the stage for a further appreciating move.
The USD remained heavily offered through the first half of the European session and pushed the GBP/USD pair to one-month tops, closer to the 1.3800 mark in the last hour.
Following the previous day's modest downtick, the GBP/USD pair caught some fresh bids on Tuesday and built on its recent strong rebound from the vicinity of the 1.3400 mark touched in late September. This marked the fourth day of a positive move in the previous five and was sponsored by aggressive selling around the US dollar.
The greenback was weighed down by the overnight pullback in the US Treasury bond yields and dismal US Industrial Production data, which fell by the most in seven months. Apart from this, the dominant risk-on flow dragged the safe-haven USD to three-week lows and was seen as a key factor that provided a strong lift to the GBP/USD pair.
Meanwhile, the ongoing USD corrective decline suggests that the markets have fully priced in the prospects for an early policy tightening by the Fed. It is worth recalling that the FOMC meeting released last Wednesday reaffirmed that the Fed remains on track to begin rolling back its massive pandemic-era stimulus by the end of 2021.
On the other hand, the British pound was underpinned by the recent hawkish remarks from the Bank of England officials, signalling that an imminent interest rate hike later this year. In fact, the BoE Governor Andrew Bailey said that the British central bank will have to act amid increasing risks to medium-term inflation expectations.
With the latest leg up, the GBP/USD pair has now moved back closer to 100-day SMA pivotal resistance, currently around the 1.3805 region. A sustained move beyond will be seen as a fresh trigger for bullish traders and set the stage for additional gains amid absent relevant market-moving economic releases, either from the UK or the US.
That said, traders might take cues from scheduled speeches from the BoE Governor Andrew Bailey and BoE chief economist Catherine Mann for some impetus. Apart from this, comments by Fed Governor Michelle Bowman could influence the USD price dynamics and produce some short-term trading opportunities around the GBP/USD pair.
Technical levels to watch
EUR/CHF pivots away from 1.07. However, the down move could persist with next support levels seen at 1.0660 and the 1.05 2020 low, economists at Société Générale report.
Short-term bounce is on the cards
“An initial bounce is not ruled out however daily Ichimoku cloud near 1.0830 should contain.”
“Next potential support levels are at 1.0660 and 2020 low of 1.0500.”
EUR/USD has reclaimed the 1.1650 level as a bounce is under way. Economists at Société Générale expect the pair to extend its advance to the 1.1750 region.
Next hurdle on the upside sits at 1.1670
“The pair could attempt a rebound towards 1.1670 and perhaps even towards 1.1750, the upper limit of a multi month descending channel.”
“August/September high of 1.1910/1.1940 remains an important resistance zone near-term.”
“First support is located at 1.1570.”
Quek Ser Leang at UOB Group’s Global Economics & Markets Research sees USD/THB navigating within the 33.20-33.70 range for the time being.
Key Quotes
“We highlighted last Monday (11 Oct, spot at 33.79) that ‘upward momentum has waned further and the chance for USD/THB to break the rising trend-line support has increased’. We added, ‘a break of the trend-line would indicate that the USD/THB strength from early September has run its course’.”
“While our view for a break of the rising trend-line was not wrong, we did not anticipate the subsequent sharp sell-off that sent USD/THB plummeting to 33.15. Note that 33.15 was close to the 55-day exponential moving average.”
“The rebound from 33.15 amid oversold shorter-term conditions indicates that USD/THB is unlikely to weaken further. For this week, USD/THB is more likely to trade between 33.20 and 33.70.”
- EUR/USD adds to Monday’s gains north of the 1.16 mark.
- The greenback loses traction across the board on Tuesday.
- ECB-speak, US housing data, Fedspeak next in the docket.
The single currency extends the optimism seen at the beginning of the week and lifts EUR/USD to fresh tops past 1.1650 on turnaround Tuesday.
EUR/USD up on USD-selling
EUR/USD advances for the second session in a row and clinches new monthly peaks at the same time on the back of the continuation of the offered stance around the greenback, which forced the US Dollar Index (DXY) to record new monthly lows near 93.60.
The broad-based retracement in US yields put the dollar under extra pressure and encouraged risk takers to return to the markets, motivating spot to extend the weekly rebound and leave behind former October peaks around 1.1640.
Earlier in the session Bank of France’s F.Villeroy said he finds no reason for the ECB to raise rates before end of the next year, while he sees the French economy returning to pre-pandemic figures at some point by year end.
In the calendar, ECB’s Board members F.Elderson, F.Panetta and P.Lane will all speak later in the session. Across the pond, housing data will take centre stage in the docket along with speeches by FOMC’s Daly, Waller, Bowman and Bostic.
What to look for around EUR
EUR/USD finally managed to close a session above 1.1600 on Monday and now moves further north to new monthly peaks near 1.1660. While the improvement in the sentiment surrounding the risk complex lent extra wings to the par, price action is expected to keep looking to dollar dynamics for the time being, where tapering chatter remains well in centre stage. In the meantime, the idea that elevated inflation could last longer coupled with the loss of momentum in the economic recovery in the region, as per some weakness observed in key fundamentals, are seen pouring cold water over investors’ optimism as well as bullish attempts in the European currency.
Key events in the euro area this week: Final EMU CPI (Wednesday) – Preliminary PMIs in the euro zone (Friday).
Eminent issues on the back boiler: Asymmetric economic recovery post-pandemic in the region. Sustainability of the pick-up in inflation figures. Probable political effervescence around the EU Recovery Fund. Investors’ shift to European equities in the wake of the pandemic could lend extra oxygen to the euro. ECB tapering speculations.
EUR/USD levels to watch
So far, spot is gaining 0.36% at 1.1651 and faces the next up barrier at 1.1657 (monthly high Oct.19) followed by 1.1718 (55-day SMA) and finally 1.1755 (weekly high Sep.22). On the other hand, a break below 1.1571 (low Oct.18) would target 1.1524 (2021 low Oct.12) en route to 1.1495 (high Mar.9 2020).
- NZD/USD gained strong traction for the fifth consecutive session on Tuesday.
- Sustained break through the 0.7100 confluence hurdle favours bullish traders.
- Overbought conditions warrant some caution before placing fresh bullish bets.
The NZD/USD pair continued scaling higher through the early European session and shot to over one-month tops, around the 0.7145-50 region in the last hour.
The safe-haven US dollar witnessed aggressive selling on Tuesday and sank to three-week lows amid the dominant risk-on flow. This, in turn, provided a strong boost to the perceived riskier kiwi and assisted the NZD/USD pair to gain strong follow-through traction for the fifth successive day.
The momentum confirmed a bullish breakout through the 0.7100 confluence, comprising the very important 200-day SMA and a descending trend-line extending from YTD tops touched in February. A subsequent move beyond the 50% Fibonacci level of the 0.7466-0.6805 downfall has set the stage for further gains.
Meanwhile, technical indicators on hourly charts are already flashing overbought conditions. Moreover, RSI on the daily chart has moved on the verge of breaking into the overstretched territory, warranting some consolidation or a modest pullback before the next leg up for the NZD/USD pair.
From current levels, September monthly swing highs, around the 0.7170 region, seems to act as immediate resistance. A sustained move beyond has the potential to push the NZD/USD pair towards the 0.7200 round-figure mark en-route the 61.8% Fibo. level, around the 0.7215-20 area.
On the flip side, any meaningful retracement slide could attract some dip-buying near the 0.7100 confluence hurdle breakpoint. This, in turn, should help limit the downside near the 0.7070-60 region, which coincides with the 38.2% Fibo. level and act as a strong base for the NZD/USD pair.
NZD/USD daily chart
-637702284843146828.png)
Technical levels to watch
A deeper pullback is expected once USD/CNH clears 6.4240, commented FX Strategists at UO Group.
Key Quotes
24-hour view: “Yesterday, we held the view that USD ‘could retest the 6.4230 level before stabilization can be expected’. Our expectations did not materialize as USD dropped to 6.4254 before closing little changed at 6.4289 (-0.08%). Downward momentum is beginning to improve and USD could weaken to 6.4180 but it is left to be seen if it could maintain a foothold below this level (next support is at 6.4100). Resistance is at 6.4300 followed by 6.4350.”
Next 1-3 weeks: “Our view from last Thursday (14 Oct, spot at 6.4340) still stands. As highlighted, downward momentum is beginning to build but USD has to close below 6.4240 before a sustained decline can be expected (next support is at 6.4100). The chance for USD to close below 6.4240 is quite high as long as it does not move above the ‘strong resistance’ level at 6.4450 (level previously at 6.4540).”
The UK rate market moved to price in more front loaded rate hikes from the Bank of England (BoE) following the hawkish comments from Governor Bailey over the weekend which has seen cable rise back to within touching distance of the 1.3800-level. Nonetheless, economists at MUFG Bank still expect GBP/USD to move downward into year-end due to slow growth and high inflation.
BoE setting up rate hike at next policy meeting
“The GBP is still not fully benefiting as much as expected from the ongoing sharp rise in UK yields. The UK rate market continued to adjust sharply higher yesterday to fully price in a rate hike by the BoE at their next policy meeting in November.”
“We have brought forward our forecast for the timing of the first BoE rate hike to November when we expect the first 15 point hike to be delivered which we expect to be followed by a 0.25 point hike in February.”
“The faster pace of tightening poses some upside risk to our pound forecasts in the near-term. However, we are still sticking to our view that the GBP is more likely to weaken heading into year-end given the more challenging backdrop of slowing global growth, higher inflation and tightening liquidity conditions which should be less supportive for risk assets and high beta currencies like the pound.”
“More front-loaded BoE tightening could also be viewed as more of a policy mistake if the UK economy slows more notably heading into year end triggering a weaker pound.”
Gold traded sharply higher, as US Treasury yields and the USD slipped after the US CPI release but further gains over the near term may be limited, in the view of analysts at HSBC. A gradually stronger USD, following the Fed’s path towards normalisation, may weigh mildly on the yellow metal.
Gold faces gradual withdrawal of monetary and fiscal support
“The latest US CPI data indicates that the inflation level remained elevated in September. While the CPI data, in addition to easing in US Treasury yields and the USD, may be supportive of gold, the degree to which gold rallied is a little hard to explain. As such, further gains over the near term may be hard to come by, short of a steeper decline in US Treasury yields or the USD.”
“Comments on inflation from groups like the International Monetary Fund (IMF) may lend support to gold as they appear to be becoming more frequent. However, the scare over inflation could aid gold if US Treasury yields do not rise. Should yields move higher to offset inflation, the impact on gold would likely be more negative.”
“Global monetary and fiscal policies are no longer outright supportive of gold in the US or globally. With the era of ultra-loose monetary policies coming to an end and fiscal stimulus being pulled back, gold investment is down.”
“We still believe the USD is gradually transitioning to a stronger path due to the slowdown in global growth and the Fed’s path towards normalisation. A gradually stronger USD could be mildly negative for gold.”
The US dollar has continued to weaken amidst fresh uncertainty over Fed policy. Disclosure documents reveal that the spectacle of Fed officials personally trading stocks extended to the chair himself. As Powell reappointment is a close call, this story could end tip the balance, potentially damaging the greenback, economists at MUFG Bank report.
Fed Chair Powell faces reappointment amid tumult
“The probability of Chair Powell being given a second term dropped yesterday on PredictIt.org to 65% from around 80% 24 hours earlier. At one point the probability dropped to an intra-day low just below 60%. It was triggered by an online report on Fed Chair Powell’s personal stock account dealings.”
“Chair Powell remains the clear favourite to remain Fed Chair after his term ends in February of next year, which is our base case scenario supporting our outlook for stronger US dollar heading into next year. However, the decision does not appear as much as a done deal as before which has increased uncertainty and downside risks for the US dollar.”
- DXT losses the grip further and re-visits the 93.60 area.
- US 10-year yields ease to the 1.57% region on Tuesday.
- Building Permits, Housing Starts, Fedspeak next on tap.
The greenback, when tracked by the US Dollar Index (DXY), added to recent losses and drops to new 3-week lows around 93.60.
US Dollar Index weaker on risk-on mood
The index extends the bearish move further and drops to the 93.60 region on turnaround Tuesday.
The continuation of the downtrend in the dollar comes in response to the move lower in US yields across the curve, with the front end slipping back to sub-0.40% levels, the belly hovering around 1.60% and the long end flirting with the 2.04%.
In addition, further improvement in the risk complex weighs on the buck, as the profit-taking mood surrounding the dollar appears still unabated.
In the US docket, housing data due later in the session will include Building Permits and Housing Starts for the month of September along with speeches by San Francisco Fed M.Daly (voter, centrist), FOMC’s Governors M.Bowman and C.Waller (permanent voters, centrists) and Atlanta Fed R.Bostic (voter, centrist).
What to look for around USD
The index keeps correcting lower following new 2021 highs past 94.50 on October 12, with initial support so far emerging around 93.60. Supportive Fedspeak, an anticipated start of the tapering process, higher yields and the rising probability that high inflation could linger for longer continue to prop up the sentiment around the buck for the time being and keep sustaining the case for the resumption of the uptrend in DXY in the relatively short-term horizon.
Key events in the US this week: Building Permits, Housing Starts (Tuesday) – Initial Claims, Philly Fed Index, CB Leading Index, Existing Home Sales (Thursday) – Flash Manufacturing PMI (Friday).
Eminent issues on the back boiler: Persistent uncertainty around Biden’s multi-billion Build Back Better plan. US-China trade conflict under the Biden’s administration. Tapering speculation vs. economic recovery. Debt ceiling debate. Geopolitical risks stemming from Afghanistan.
US Dollar Index relevant levels
Now, the index is losing 0.31% at 93.65 and a break above 94.56 (2021 high Oct.12) would open the door to 94.74 (monthly high Sep.25 2020) and then 94.76 (200-week SMA). On the flip side, the next down barrier emerges at 93.58 (monthly low October 19) followed by 93.18 (55-day SMA) and finally 92.98 (weekly low Sep.23).
Treasury yields have risen across the curve since the end of September. For bond investors, a difficult investing environment has just gotten more difficult. Economists at Charles Schwab continue to suggest keeping average duration low due to the expectation for yields to push higher.
Rising bond yields is not a reason for bond investors to be blue
“We see the potential for 10-year Treasury yields to move up to 1.75% this year and above 2% in the first half of next year.”
“Over the next six to 12 months, we suggest investors look for opportunities to extend duration if yields move higher, as anticipated.”
“Over the long run, we don’t see rising bond yields as a reason for bond investors to be blue. Higher yields – in real terms – are good for income investors.”
- Silver rallied to over one-month tops during the early European session on Tuesday.
- The momentum seems strong enough to push the XAG/USD beyond the $24.00 mark.
Silver caught aggressive bids on Tuesday and shot to one-month tops, around the $23.70 region during the early European session.
From a technical perspective, the XAG/USD showed some resilience below the 200-period SMA on the 4-hour chart and managed to defend the $23.00 mark for the second consecutive session on Monday. The subsequent positive move validated the recent bullish breakout through an inverted head and shoulders neckline. This, in turn, supports prospects for a further near-term appreciating move.
Silver 4-hour chart
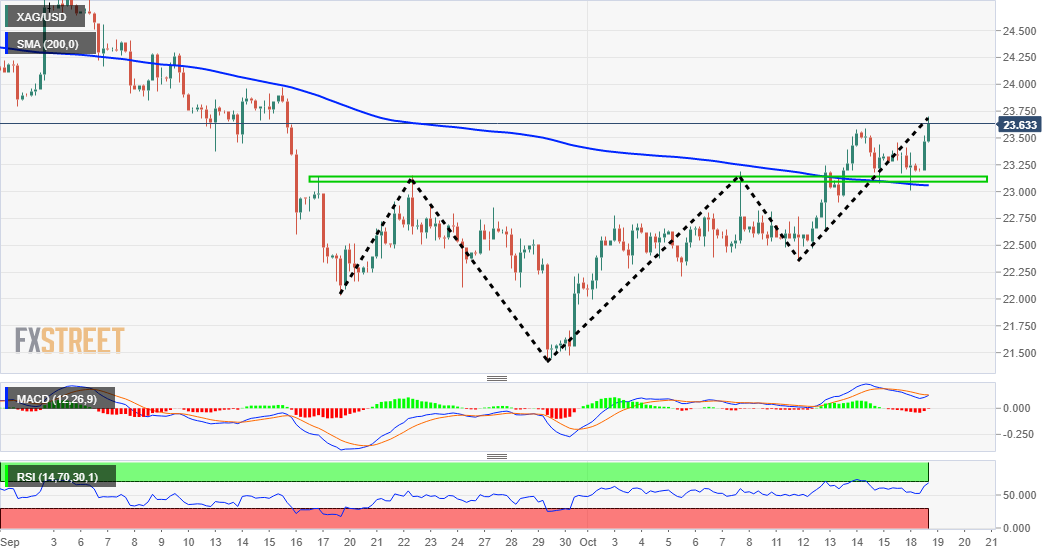
The constructive setup is reinforced by the fact that technical indicators on the daily chart have just started moving into the bullish territory and are still far from being in the overbought zone. Bulls might now be looking to build on the momentum further beyond a downward-sloping trend-line resistance, extending from July monthly swing highs, around the $26.75-80 region.
Silver daily chart
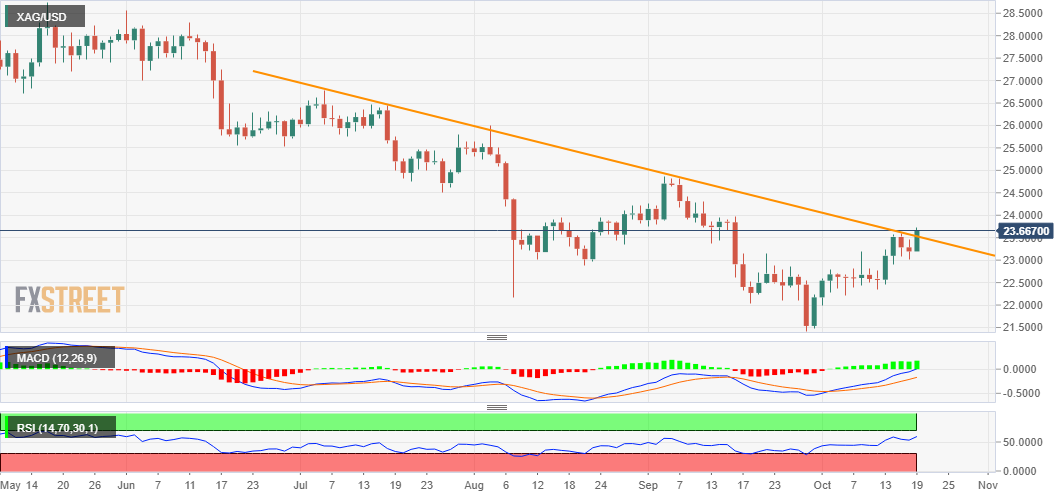
Nevertheless, the XAG/USD seems all set to extend its recent recovery move from YTD lows and aim to reclaim the $24.00 round-figure mark. This is followed by resistance near the $24.15-20 region, above which the momentum could further get extended towards the next relevant hurdle around the $24.75-80 region. The white metal could eventually climb to the key $25.00 psychological mark.
On the flip side, the $23.50 region now seems to protect the immediate downside. Any subsequent pullback might still be seen as a buying opportunity near the $23.00 mark, which should act as a strong near-term base for the XAG/USD and a key pivotal point for traders. A convincing break below might prompt some technical selling and accelerate the corrective fall towards the $22.75-70 region.
Technical levels to watch
GBP/AUD has cratered from its late September 1.8961 highs. But any onward decline runs into a layer of robust support broadly in the 1.8304-1.8235 patch, Benjamin Wong, Strategists at DBS Bank, reports.
Prior overbought indicators are waning
“The bearish divergences spotted on the technical indicators oiled the decline. However, the same set of indicators are now hinting of a likely turnaround in the cross’ fortunes.”
“The 200-DMA at 1.8304 lurks just below recent 1.8417 lows, and in its proximity also rests the support offered by the 61.8% Fibonacci retracement of the 1.9154-1.7741 range grip that calibrates 1.8281. Both of these levels are buffered by 50-week and 200-week moving averages at 1.8235 and 1.8282, respectively. Hence, there is a layer of support coming into the 1.8304-1.8235 zone.”
“A further decline is also likely to be tempered by the congestion zone we saw going through in June. That approximates and has barricaded a 1.82-1.85 support range, but of interest to us is where it runs into the trend support arising from 1.7417 lows. That axes 1.8330, while itself the trendline support is in a cradle position with 200-dma at 1.8304.”
Indonesia’s central bank, Bank Indonesia (BI), announced no changes to the benchmark 7-day reverse repo, leaving it at 3.50% during the October monetary policy meeting held this Tuesday.
The central bank governor Perry Warijyo said that “global economic recovery is expected lower than previously estimated due to rising cases of COVID-19, higher energy prices.”
Additional comments
Global recovery to continue in 2022 but disruption in global supply chain needs to be monitored.
Domestic economy shows continued improvement after COVID-19 curbs eased.
Domestic economic recovery supported by high exports, improving consumption after easing COVID-19 restrictions.
Keeps 2021 GDP growth outlook at 3.5% to 4.3%.
Q3 current account balance seen in surplus.
Continue to make sure rupiah reflects fundamentals.
AUD/USD is the top gainer of the day so far alongside the kiwi. The aussie is trading close to the September high at 0.7477. Above here, the pair would target the 200-day moving average at 0.7567, Karen Jones, Team Head FICC Technical Analysis Research at Commerzbank ,reports.
AUD/USD maintains upside pressure
“AUD/USD held steady yesterday and remains well-placed to tackle the September peak at 0.7477. The 55-week ma lies at 0.7513 and the 200-day ma 0.7567.”
“Very near-term we would allow for a small retracement, but this is indicated to hold around 0.7350/25.”
“Dips should find interim support at 0.7313 (20-day ma) and this guards the 29th September low at 0.7171.”
The S&P 500 rose 1.8% last week, its best weekly advance since July. Economists at UBS still believe the optimism in equity markets is justified, given robust economic growth and earnings.
Solid start to the US earnings season
“We expect a drag on earnings per share from supply chain problems of just 1% for 2021 – a modest hit relative to our projection for 45% profit growth for the year.”
“We continue to believe the Fed will look through the current spike in inflation. US average inflation data suggests the Fed doesn’t need to act: On two, three, and five-year rolling averages, core PCE inflation remains well below 2%.”
“As the labor market continues to recover we expect yields to rise to 1.8% this year, a gradual increase that has historically been consistent with rising equities.”
“Although the third quarter earnings season won’t match the second, we still expect roughly 30% earnings growth in the third quarter, representing a 5% beat of consensus expectations.”
The 55-day moving average (DMA) at 0.9208 is about to give way. Subsequently, Karen Jones, Team Head FICC Technical Analysis Research at Commerzbank, expects the USD/CHF pair to tick down towards the 2020-2021 uptrend at 0.9076.
Offered below 0.9313
“USD/CHF’s bounce from the 55-DMA at 0.9208 has proved tepid and downside risks remain. The 55-DMA is about to give way and this leaves the market vulnerable to a deeper corrective sell off to the 0.9138 200-DMA and potentially the 2020-2021 uptrend at 0.9076.”
“Rallies are expected to remain capped by the 0.9313 mid-October high. This guards 0.9357/69 (recent high).”
The Kiwi has recovered from yesterday’s dip. NZD/USD trades at fresh multi-week highs and is up nearly 1%. Rapidly rising expectations for more OCR hikes are set to underpin the New Zealand dollar, economists at ANZ Bank report.
The RBNZ is at the front of the pack in the global monetary tightening phase
“Given some of the themes ripping through global markets like stagflation, tapering and spiraling energy prices, more volatility is likely.”
“The rise in inflation will keep the RBNZ at the beginning of the pack in this hiking cycle, which should cement rather than question its commitment to low and stable inflation, and growing market expectations of more OCR hikes will likely help rather than hinder the NZD.”
“There is no talk of letting inflation run, and temporarily high inflation shouldn’t weigh on the NZD.”
- AUD/USD gained strong positive traction on Tuesday amid a broad-based USD weakness.
- Slightly overbought conditions on hourly charts warrant some caution for bullish traders.
The USD selling bias picked up pace heading into the European session and pushed the AUD/USD pair back closer to September monthly swing highs, around the 0.7470-75 region in the last hour.
The resource-linked Australian dollar remained well supported by the recent widespread rally in commodity prices. This, along with the emergence of aggressive US dollar selling, assisted the AUD/USD pair to gain strong positive traction during the first half of the trading action on Tuesday.
The greenback was weighed down by the overnight pullback in the US Treasury bond yields and dismal US Industrial Production data, which fell by the most in seven months. Apart from this, a positive risk tone further undermined the safe-haven USD and benefitted the perceived riskier aussie.
Meanwhile, technical indicators on hourly charts are already flashing overbought conditions. Moreover, RSI (14) on the daily chart have moved on the verge of breaking about the 70 mark. This, in turn, warrants some caution for bulls and before positioning for any further appreciating move.
That said, some follow-through buying should pave the way for an extension of the recent strong positive move witnessed over the past four weeks or so. The momentum, however, could pause at higher levels and struggle to lift the AUD/USD pair further beyond the key 0.7500 psychological mark.
On the flip side, any meaningful pullback now seems to find decent support near the 0.7435 region. This is followed by the 0.7400 round-figure mark and the overnight swing lows, around the 0.7380-75 region, which should act as a strong near-term base for the AUD/USD pair.
The latter coincides with a short-term ascending trend-line support, which if broken will negate the positive bias and prompt some technical selling. The AUD/USD pair might then accelerate the fall towards the 0.7320-15 strong resistance breakpoint turned support en-route the 0.7300 mark.
AUD/USD daily chart
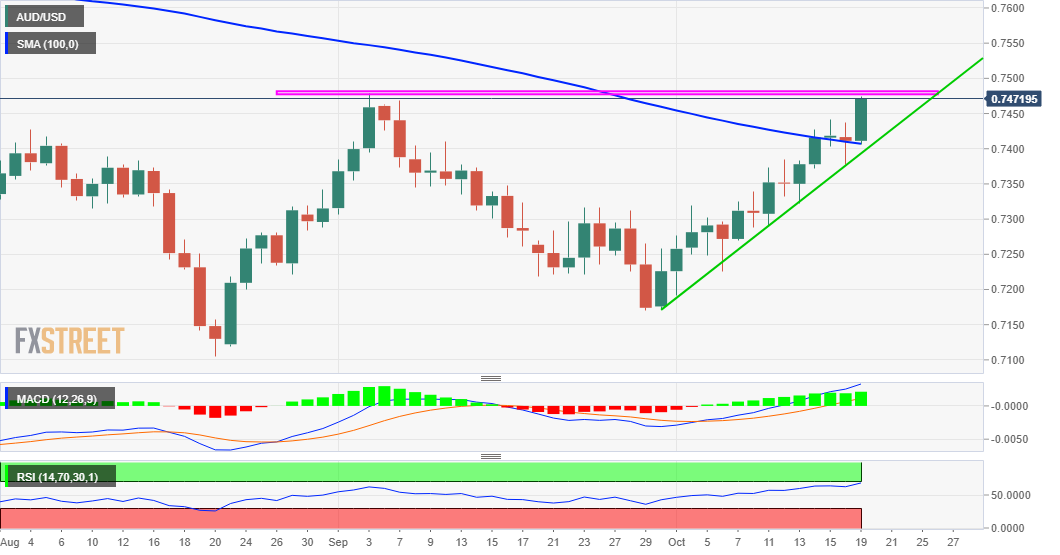
Technical levels to watch
The Reserve Bank of Australia (RBA) has been among the central banks where market pricing has diverged to a clearly more hawkish path compared to the official forward guidance. The aussie was little affected by the RBA’s October meeting Minutes, heading higher. However, economists at Danske Bank expect the AUD/USD pair to edge lower.
No rate hikes until 2024
“In its October minutes, RBA dovishly stated that while wage pressures were emerging in certain parts of the world, this was not the case in Australia.”
“It continues to signal no rate hikes until 2024, even though market prices in the first hike already by H2 2022”
“We continue to see market pricing as too aggressive, and expect to see lower AUD/USD also on the back of Chinese-driven weakness in key Australian export commodity prices and broad USD strength.”
Governor Andrew Bailey’s comments over the weekend made clear that a hike to Bank Rate is coming soon. Subsequently, economists at Standard Chartered expect a 15bps hike in November. They also see two further 25bps hikes in February and May, taking base rate to 0.75% by end-2022.
Hawks speak loudest
“We bring forward our expectation of a 15bps rate hike to 4 November (from February 2022 prior), taking the base rate to 0.25% by end-2021 (0.10% previously).”
“We do think there is now scope for two more 25bps rate hikes next year (likely in February and May), taking the base rate to 0.75% by end2022 (0.50% previously); but this is still well below what the market is pricing in (base rate at 1.25% by end-2022.”
“Despite inflation likely exceeding 4% by year-end, we think the BoE will be constrained from moving further or faster than our forecasts. The two metrics the MPC will be following closely remain underlying wage growth and inflation expectations – these will provide the strongest indication of any adjustment in thinking.”
There is no reason that the European Central Bank (ECB) should increase rates between now and the end of next year, the central bank Governing Council member and Bank of France Head Francois Villeroy de Galhau said on Tuesday.
Further comments
“There is still big difference in terms of rising energy prices and overall total inflation.”
“Total overall inflation should get back to below 2 percent by end of next year.”
“We remain very vigilant on inflation.”
Market reaction
The above comments are weighing slightly on the euro, as EUR/USD eases back below 1.1650.
At the time of writing, EUR/USD is trading at 1.1645, now gaining 0.34% on the day.
Here is what you need to know on Tuesday, October 19:
As risk flows return to markets early Tuesday, the greenback continues to weaken against its rivals with the US Dollar Index dropping to fresh three-week lows near 93.60. Moreover, the benchmark 10-year US Treasury bond yield is down more than 1%, putting additional weight on the USD’s shoulders. September Housing Starts and Building Permits will be featured in the US economic docket. Christopher J. Waller and Michelle Bowman, members of the Board of Governors of the Fed, will be delivering speeches as well. Nevertheless, investors will remain focused on the US T-bond yields and the overall risk perception.
Supported by strong gains seen in the Consumer Discretionary, Technology and Communication Services sectors, the S&P 500 rose 0.35% on Monday and the tech-heavy Nasdaq added 0.85%. The Nikkei 225 and the Shanghai Composite indexes rose 0.75% and 0.68%, respectively, on Tuesday, mirroring the improving market mood.
Gold started the week on the back foot and spent the majority of the day moving sideways above $1,760. However, falling the US T-bond yields seem to be helping XAU/USD gain traction on Tuesday. At the time of press, the pair was up more than 0.7% at $1,778.
EUR/USD managed to hold above 1.1600 during the Asian trading hours and started to push higher. Currently, the pair is trading at its highest level since late September around 1.1650. August Construction Output data from the Eurozone will be published later in the session but the dollar's valuation is likely to continue to drive the pair's action.
GBP/USD is edging higher toward 1.3800 on Tuesday. The UK and the EU will be discussing the Northern Ireland Protocol later in the week and the UK’s Office for National Statistics will release the September Consumer Price Index data on Wednesday, which could have a significant impact on the Bank of England’s rate hike expectations.
Risk-sensitive AUD/USD and NZD/USD are the top gainers of the day so far. Both of these pairs were trading at fresh multi-week highs and were up nearly 1% in the early European session.
USD/JPY reached its highest level in three years at 114.47 on Monday but reversed its direction pressured by the falling US T-bond yields. However, the risk-positive market atmosphere is not allowing JPY to continue to gather strength, causing USD/JPY to stay in a consolidation phase around 114.00.
Cryptocurrencies: Bitcoin trades above $60,000 and continues to close in on the all-time high it set near $65,000 back in April. Ethereum keeps the bullish bias in the near term but needs to clear $4,000 in order to target a new record top.
The European Central Bank (ECB) Governing Council member and Bank of France Head Francois Villeroy de Galhau said that the French economy should get back to pre-pandemic levels of activity by year-end.
Additional quotes
“Reaffirms earlier French economic growth forecast.”
“French auto sector underperforming but other areas of the economy are doing well.”
“Some French companies highlighting difficulties in hiring staff.”
Market reaction
At the time of writing, EUR/USD is sitting close to three-week highs of 1.1659, adding 0.38% on the day.
Yao Jingyuan, a special researcher at the Counselor’s Office of the State Council said on Tuesday, the People’s Bank of China (PBOC) has room to lower the Reserve Requirement Ratio (RRR) and, therefore, should cut the ratio to support the economic growth.
Key quotes
The reserve requirement ratio “can be lowered by 1 percentage point in the fourth quarter.”
“We don’t need to worry about whether releasing more money will push inflation higher because we still have room.”
“Consumer inflation is likely to be 1% for the full year.”
“A 1 percentage-point cut would unleash 1 trillion yuan ($156 billion) of liquidity. Based on on-the-ground investigations, the liquidity condition of companies remains generally quite tight.”
Related reads
- PBOC’s Yi: China can ‘contain’ the risk from Evergrande
- PBOC unlikely to alter the RRR this year – Goldman Sachs
EUR/USD has eroded its accelerated downtrend. Karen Jones, Team Head FICC Technical Analysis Research at Commerzbank, expects the pair to head towards the 1.1746 four-month downtrend.
Accelerated downtrend eroded
“EUR/USD has broken higher through the accelerated downtrend as suspected.”
“The intraday Elliott wave counts remain positive and we would allow for a deeper retracement to 1.1746 four-month downtrend.”
“Dips lower are indicated to hold around 1.1565. Below 1.1522 (last week's low) lies the 50% retracement of the move from 2020 and the March 2020 high at 1.1492/95.”
“Key support is the previous downtrend (from 2008) which is now located at 1.1395.”
- EUR/USD is breaking higher from a three-week-old descending triangle on the daily chart.
- Tuesday’s close is critical to unleashing additional upside towards the 50-DMA at 1.1715.
- Daily RSI pierces through the midline, recaptures 50.00 and backs more gains.
EUR/USD is consolidating around 1.1650, having staged an impressive bounce from the daily lows of 1.1610, as the pullback in the US dollar amid the risk-on mood underpinned the pair.
The major extends its recovery from 15-month lows of 1.1524 into the fifth straight day on Tuesday, as the bulls remain in complete control.
EUR/USD’s daily chart shows that the price has broken higher from a three-week-old descending triangle formation, although the bulls need a daily closing above the falling trendline resistance at 1.1602 to confirm an upside breakout from the pattern.
The 14-day Relative Strength Index (RSI) has pierced through the midline, now back onto the positive territory, suggesting that there is more room to the upside.
The triangle confirmation will trigger a fresh advance towards the downward-sloping 50-Daily Moving Average (DMA) at 1.1715.
Ahead of that the 1.1700 round number could be a tough nut to crack for the EUR bulls.
EUR/USD: Daily chart
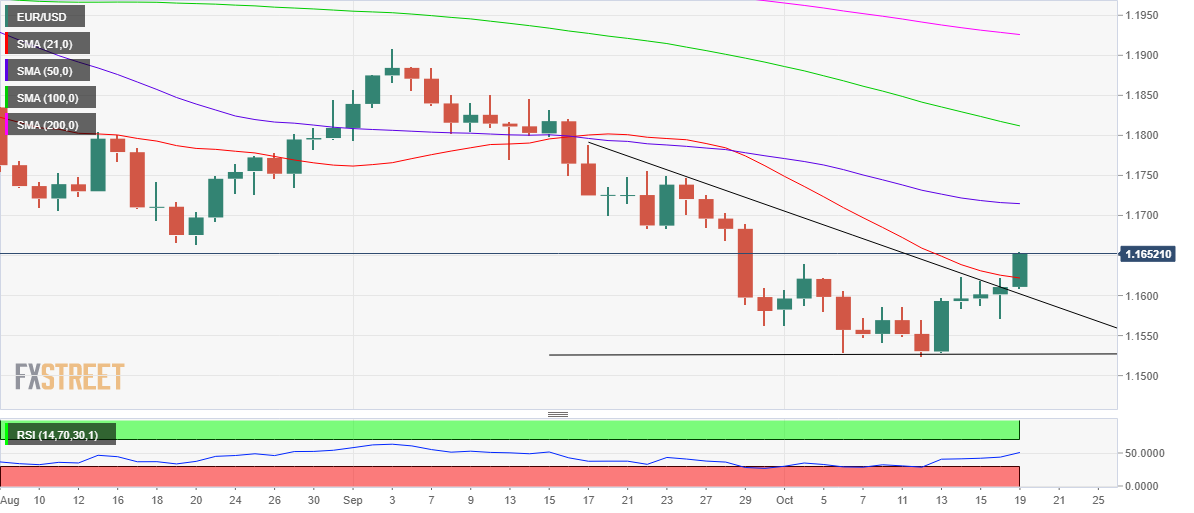
Meanwhile, any retracement will meet the 21-DMA support at 1.1622, below which the triangle resistance now support at 1.1602 would be tested once again.
Further south, Monday’s low of 1.1571 could be threatened if the selling pressure intensifies.
EUR/USD: Additional levels to consider
USD/JPY could move into a consolidative phase in the near term ahead of a probable move to 115.00, noted FX Strategists at UOB Group.
Key Quotes
24-hour view: “We highlighted yesterday that ‘deeply overbought conditions coupled with some early signs of slowing momentum suggest that USD is unlikely to strengthen much further’ and we expected USD to ‘trade sideways between 113.90 and 114.50’. USD subsequently traded between 114.00 and 114.44. The underlying tone has improved somewhat and USD could edge higher from here. That said, the major resistance at 114.55 is unlikely to come into the picture. Support is at 114.00 followed 113.85.”
Next 1-3 weeks: “There is not much to add to our update from yesterday (18 Oct, spot at 114.20). As highlighted, USD is still strong but overbought conditions could lead to consolidation first. The next resistance is at 114.55 followed by 115.00. The current USD strength is deemed intact as long as 113.50 (no change in ‘strong support’ level from yesterday) is not breached.”
Open interest in natural gas futures markets went down by around 8.7K contracts at the beginning of the week, reaching the second daily drop in a row considering advanced prints from CME Group. In the same line, volume resumed the recent downside and dropped by around 11.5K contracts.
Natural Gas looks supported around $4.70
Natural gas prices extended the corrective downside and broke below the $5.00 mark per MMBtu on Monday. The strong pullback came in tandem with diminishing open interest and volume, removing momentum from further downside and instead allowing for a rebound in the very near term. Prices of the commodity, in the meantime, remain supported by the $4.70 region per MMBtu.
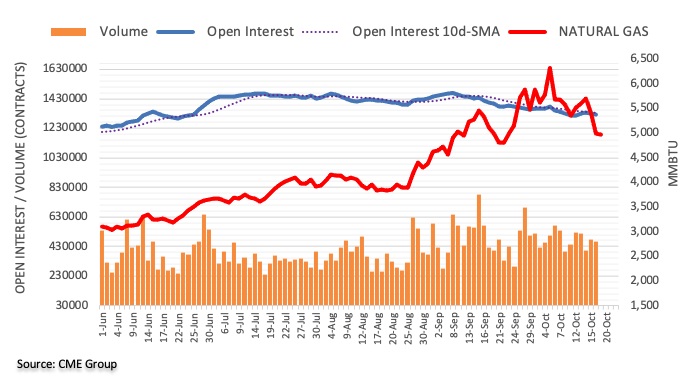
Gold price managed to defend the critical rising trendline support at $1765, despite a brief dip below it, as the bulls found fresh bids at the horizontal 21-Daily Moving Average (DMA) at $1760. Although XAU/USD rebounds towards the key $1795 barrier, downside risks remain intact, according to FXStreet’s Dhwani Mehta.
Bullish potential appears limited due to impending bear cross
“The broader market sentiment and the yields’ price action will be closely watched for placing fresh bets on gold price.”
“On the road to recovery, XAU/USD is likely to face immediate resistance at the horizontal 50-DMA at $1778. A sustained move above the latter could call for a retest of the 100 and 200-DMAs confluence zone at $1795. However, an impending bear cross, with the 100-DMA set to cut the 200-DMA from above, warrants caution for gold bulls.”
“If the 21-DMA support at $1760 gives way convincingly, then the previous week’s demand area at $1750-$1745 would be back into play. Further south, the multi-week lows of $1722 could be on the sellers’ radars.”
- USD/JPY stalls the previous three sessions’ gains on Tuesday in the European session.
- The formation of the evening star on Monday indicates the upcoming downside momentum.
- The Momentum oscillator holds onto the overbought zone warrants caution for the pair.
USD/JPY intensifies the selling downside momentum as the European trading hours begin. The pair remained under pressure since it touched November, 2018 highs on Friday. At the time of writing, USD/JPY is trading at 114.12, down 0.17% so far.
USD/JPY daily chart
-637702202727748814.png)
On the daily chart, the USD/JPY pair has been riding higher after testing the low of 109.12 on September 22. The pair rallied toward a four-year high near 114.50. The divergence in the Relative Strength Index (RSI) forces bulls to take a step back. If the price sustains below the Intraday’s low it would test the 113.50 horizontal support level.
A break below the 23.6% Fibonacci retracement, which extends from the low of the mentioned level at 113.12, will bring the possibility of the 112.50 horizontal level followed by the psychological 112.00 mark.
Alternatively, on the reverse side, a daily close above 114.50 would bring November, 2017 high at 114.73 back in action, allowing bulls to dominate the trade again.
USD/JPY additional levels
Further upside in NZD/USD is expected to face the next hurdle at the 0.7130 level in the next weeks, suggested FX Strategists at UOB Group.
Key Quotes
24-hour view: “NZD traded between 0.7050 and 0.7105 yesterday, narrower than our expected sideway-trading range of 0.7040/0.7110. Upward momentum has firmed somewhat but the bias for NZD is on the upside. However, any advance is unlikely to challenge the major resistance at 0.7130 (minor resistance is at 0.7110). Support is at 0.7075 followed by 0.7060.”
Next 1-3 weeks: “There is not much to add to our update from yesterday (18 Oct, spot at 0.7080). As highlighted, while NZD is still strong, the recent rapid rise is overbought and the pace of any further advance is likely to be slower. The next resistance is at 0.7130. The upside risk is deemed intact as long as NZD does not move below 0.7020 (‘strong support’ was at 0.7000 yesterday).”
According to flash data from CME Group for crude oil futures markets, traders scaled back their open interest positions by around 7.7K contracts on Monday, reversing the previous daily build. Volume, instead, went up by around 201K contracts after four consecutive daily pullbacks.
WTI focused on $84.00 and above
After hitting fresh 2021 highs at the beginning of the week, prices of the WTI ended up in the negative territory amidst shrinking open interest. That said, a sustainable retracement appears out of favour for the time being while the commodity re-targets the $84.00 mark per barrel and above in the near term.
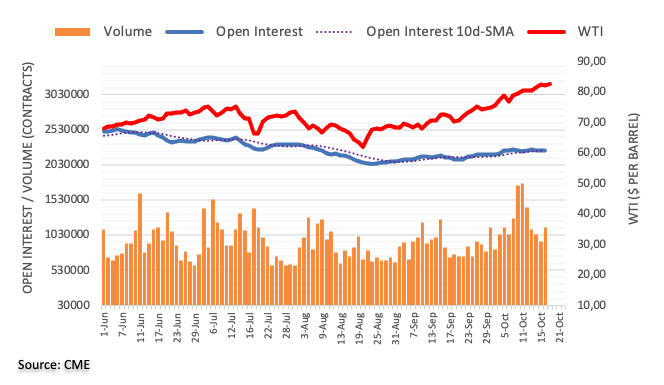
FX option expiries for October 19 NY cut at 10:00 Eastern Time, via DTCC, can be found below.
- EUR/USD: EUR amounts
- 1.1545-55 876m
- 1.1600 559m
- 1.1670 428m
- GBP/USD: GBP amounts
- 1.3525 738m
- 1.3685 774m
- USD/JPY: USD amounts
- 113.50 370m
- 114.00 300m
- USD/CHF: USD amounts
- 0.9270 757m
- AUD/USD: AUD amounts
- 0.7350 664m
- USD/CAD: USD amounts
- 1.2550 751m
In opinion of FX Strategists at UOB Group, Cable could edge higher and re-visit 1.3800 ahead of 1.3850 in the short-term horizon.
Key Quotes
24-hour view: “Yesterday, we highlighted that ‘the rapid advance appears to be running ahead of itself and GBP is unlikely to strengthen much further’ and we expected GBP to ‘trade between 1.3710 and 1.3780’. Our view was not wrong even though GBP traded within a narrower range than expected (1.3710/1.3765). The underlying tone has improved somewhat but while GBP could edge higher, it is unlikely to break the resistance at 1.3770. Support is at 1.3710 followed by 1.3690.”
Next 1-3 weeks: “There is not much to add to our update from yesterday (18 Oct, spot at 1.3765). As highlighted, GBP is likely to advance further to 1.3800. Further extension to 1.3850 is not ruled out but the odds are not high for now. Only a break of the ‘strong support’ at 1.3655 (no change in level from yesterday) would indicate that GBP is not ready to head higher to 1.3800.”
CME Group’s preliminary readings for gold futures markets noted open interest shrank for the second session in a row on Monday, this time by nearly 3K contracts. Volume, followed suit and dropped by around 51.2K contracts.
Gold re-targets $1,800 near-term
Monday’s downtick in gold prices met support around $1,760 amidst shrinking open interest and volume. That said, further losses appear unlikely, and a rebound could gather traction with the next target at the key $1,800 mark per ounce troy.
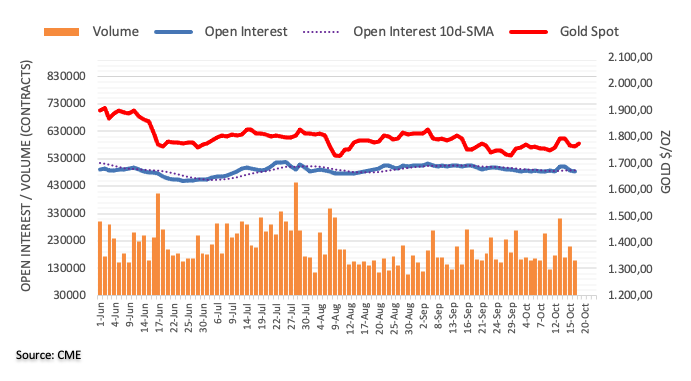
FX Strategists at UOB Group still remain of the view that EUR/USD could extend the upside momentum in the next weeks.
Key Quotes
24-hour view: “We expected EUR to ‘trade sideways between 1.1575 and 1.1620’ yesterday. EUR subsequently traded within a range of 1.1570/1.1622 before closing little changed at 1.1609. Upward momentum has improved a tad and the bias for today is on the upside. That said, a break of the major resistance at 1.1640 appears unlikely. Support is at 1.1595 followed by 1.1580.”
Next 1-3 weeks: “Our latest narrative from last Thursday (14 Oct, spot at 1.1595) still stands. As highlighted, EUR is likely trade with an upward bias towards 1.1640. Further advance is not ruled out but 1.1640 may not be easy to crack. The upward bias is deemed intact as long as EUR does not move below 1.1540 (no change in ‘strong support’ level). Looking ahead, the next resistance above 1.1640 is at 1.1680.”
- GBP/USD records fresh daily gains on Tuesday in the early European trading hours.
- Lower US Treasury yields undermine the demand for the US dollar.
- Sterling enjoys increasing bet of BOE rate hike expectation and Brexit optimism led gains.
GBP/USD shrugs of the previous session’s dull performance and trades higher on Tuesday. The pair jumped nearly 50-pips after opening lower as the trading session began. At the time of writing, GBP/USD is trading at 1.3771, up 0.32% for the day.
The move is primarily sponsored by the selling pressure in the greenback. A number of factors assisted the recent pullback in the buck. A weaker US data along with global rate hike expectations weigh on the prospects of the US dollar. The US Industrial Production fell 1.3% in September due to supply-chain constraints and Hurricane Ida. The US benchmark 10-year bond yields retreat toward 1.57% as investors digested Fed’s tapering.
On the other hand, the British pound gained following the hawkish comments from the Bank of England (BOE) Governor Andrew Bailey. He was quoted as saying that the Bank of England (BOE) is set to raise interest rates as inflation risks arise. Nevertheless, BOE’s members Silvana Tenreyro and Catherine Mann retreated their view on inflation as “transitory”.
Meantime, UK’s Prime Minister Borris Johnson promised to fix a solution to Brexit’s Northern Ireland Protocol. This, in turn, uplift the British pound in recent trades.
As for now, traders keep their focus on the US Building Permits, Housing Starts to gauge market sentiment.
GBP/USD additional levels
- USD/CAD edged lower on Tuesday and dropped back closer to multi-month lows.
- A combination of factors weighed on the USD and exerted pressure on the major.
- The recent run-up in oil underpinned the loonie and contributed to the selling bias.
The USD/CAD pair extended its steady intraday descent through the Asian session and dropped back closer to over three-month lows touched last Friday. The pair was last seen trading just below mid-1.2300s, down over 0.20% for the day.
Having struggled to preserve the overnight recovery gains to levels beyond the 1.2400 mark, the USD/CAD pair met with some fresh supply on Tuesday and was pressured by a combination of factors. The recent strong bullish run in crude oil prices continued underpinning the commodity-linked loonie. This, along with the emergence of fresh selling around the US dollar, exerted some downward pressure on the major.
The markets now seem to have fully priced in the prospects for an imminent Fed taper announcement later this year. Apart from this, Monday's weaker US data – showing that Industrial Production fell by the most in seven months in September – and a modest pullback in the US Treasury bond yields acted as a headwind for the USD. Bulls even shrugged off a softer risk tone, which tends to benefit the safe-haven greenback.
Meanwhile, fears about a faster-than-expected rise in inflation have been fueling speculations about a Fed rate hike move in 2022. This might help limit any deeper USD losses and extend some support to the USD/CAD pair amid slightly oversold conditions on short-term charts. This, in turn, warrants some caution for bearish traders and before positioning for an extension of a near one-month-old downward trajectory.
In the absence of any major market-moving economic releases from the US, traders on Tuesday will take cues from a scheduled speech by Fed Governor Michelle Bowman later during the US session. This, along with the US bond yields and the broader market risk sentiment, might influence the USD. Apart from this, oil price dynamics should provide some impetus to the USD/CAD pair and allow traders to grab some short-term opportunities.
Technical levels to watch
- GBP/JPY remains firm on Tuesday towards the initial European session.
- Bulls negate the previous day’s sluggish momentum.
- The momentum oscillator holds onto the overbought zone, throws caution for aggressive bids.
The GBP/JPY cross-currency pair edges higher on Tuesday. The pair remains pressured below 157.40. At the time of writing, GBP/JPY is trading at 157.11, up 0.11% for the day.
GBP/JPY daily chart
-637702128930476335.png)
On the daily chart, the GBP/JPY cross currency pair had been trading in a broad trading range of 149.00 and 154.00 for six months, before breaking the range on October 11. The pair peaked near to a fresh four-year high of 157.41 in just a span of five days on Friday.
If the price breaks above the intraday’s high it could again test 157.41. The Moving Average Convergence and Divergence (MACD) trades in the overbought zone. Any uptick in the MACD would bring the June 2016 high of 160.67 nearer to the GBP/JPY bulls.
Alternatively, on the reverse side of the trade, the downside target appears at 156.00 and the 155.00 horizontal support zone. Next, the GBP/JPY bears would seek Thursday’s low around 154.65.
GBP/JPY additional levels
- EUR/USD catches fresh bids in early Asia after finding support near 1.1610.
- The pair cheers risk-on mood-led decline in the USD, Treasury yields pullback.
- Focus on ECB and Fedspeak as poor US data tempers hawkish Fed’s expectations.
Fresh bids emerged near 1.1610 in early Asia, triggering a fresh upswing in EUR/USD towards 1.1650, as the US dollar runs into fresh supply amid the risk-on market mood.
The Asian markets cheer the Wall Street tech advance amid prospects of robust corporate earnings reports, which cooled off concerns over rising inflationary risks and thier impact on the economic recovery.
The retreat in the US Treasury yields and a pause in the yield curve flattening, in the face of disappointing American Industrial Production data, add legs to the recovery momentum in the main currency pair.
However, the divergent monetary policy outlooks between the Fed and the European Central Bank (ECB) could likely pose a downside risk to EUR/USD’s further upside. The Fed is well on track to withdraw the pandemic stimulus as early as November while the ECB calls for keeping a high degree of flexibility in the post-crisis stimulus measures.
“I think flexibility should remain -- we certainly have to discuss how to adjust our purchase programs,” ECB policymaker Ignazio Visco said on Monday.
In the day ahead, the pair will remain at the mercy of the US dollar price action and the risk trends amid a data-light economic calendar. The speeches from the ECB and Fed policymakers will hog the limelight.
EUR/USD: Technical levels to consider
- AUD/USD caught some fresh bids on Tuesday amid a broad-based USD weakness.
- Monday’s disappointing US data, Retreating US bond yields undermined the USD.
- A softer risk tone might cap any meaningful upside for the perceived riskier aussie.
The emergence of fresh selling around the USD pushed the AUD/USD pair to near six-week tops, closer to mid-0.7400s during the Asian session.
Following the previous day's two-way price moves, the AUD/USD pair caught some fresh bids on Tuesday and now seems all set to prolong a near three-week-old bullish trajectory. The US dollar was pressured by retreating US Treasury bond yields and the overnight data, showing that US Industrial Production fell by the most in seven months in September. This, in turn, was seen as a key factor that provided a goodish lift to the major.
This comes on the back of the recent widespread rally in commodity prices, which was seen as another factor that continued underpinning the resources-linked Australian dollar. That said, a combination of factors might hold bullish traders from placing aggressive bets and keep a lid on any runaway rally for the AUD/USD pair. A softer risk tone might act as a headwind for the perceived riskier aussie amid hawkish Fed expectations.
Fears that a faster-than-expected rise in inflation could derail the global economic recovery weighed on investors' sentiment. The concerns were further fueled by Monday's disappointing Chinese data, showing that the economic growth decelerated sharply from 7.9% to 4.9% during the third quarter. Moreover, growing acceptance for an early policy tightening by the Fed could help limit the USD losses and cap the AUD/USD pair.
The FOMC meeting minutes released last Wednesday reaffirmed that the Fed remains on track to begin rolling back its massive pandemic-era stimulus by the end of this year. The markets might have also started pricing in the possibility of an interest rate hike in 2022 to counter growing inflation risks. Nevertheless, the AUD/USD pair still seems poised to retest September monthly swing highs, around the 0.7475-80 region.
In the absence of any major market-moving economic releases from the US, trades on Tuesday will take cues from a scheduled speech by Fed Governor Michelle Bowman. This, along with the US bond yields and the broader market risk sentiment, might influence the USD price dynamics and produce some trading opportunities around the AUD/USD pair.
Technical levels to watch
- Western Texas Intermediate (WTI) pares part of its initial losses on Tuesday.
- Demand worries and OPEC’s failure to add more supply weigh on crude oil.
- US Dollar Index records fresh daily low around 93.73, US yields retreat too.
Western Texas Intermediate (WTI) consolidates gains on Tuesday in the Asian session. After recording a fresh 7-year high, WTI closed lower in the previous session. At the time of writing, WTI is trading at $81.62, up 0.04% for the day.
Crude oil prices fail to sustain the upside momentum after the US and China data highlighted the risk of the global growth recovery, ultimately affecting the demand scenario. China’s Gross Domestic Product (GDP) expanded by 4.9% in Q3 on yearly basis amid significant headwinds from power shortages and the coronavirus outbreak, which hindered the supply chain. China’s daily crude oil production rate fell again in the previous month to the lowest level since May 2020.
In addition to that, the US Factory Output dropped 1.3% in September, the most in the seven months, resulting from the impact of Hurricane Ida.
Furthermore, OPEC and its allies have been struggling to add crude back to the market as oil cuts fell slightly to 115% in Septembember. Angola and Nigeria failed to add more production due to lack of investment and exploration.
As for now, the US dollar dynamics and the demand-supply constraint continue to influence WTI prices.
WTI additional levels
- NZD/USD gained strong follow-through traction for the fifth consecutive session on Tuesday.
- Retreating US bond yields prompted fresh USD selling and provided a goodish lift to the pair.
- A softer risk tone did little to hinder the momentum beyond the 0.7100 confluence barrier.
The NZD/USD pair surged past the 0.7100 round figure during the Asian session and shot to one-month tops, around the 0.7125 region in the last hour.
The pair built on its recent strong rally from the vicinity of the 0.6900 mark and gained strong follow-through traction for the fifth consecutive session on Tuesday. Following the previous day's two-way price moves, the US dollar met with some fresh supply amid a further pullback in the US Treasury bond yields. This, in turn, was seen as a key factor that provided a goodish lift to the NZD/USD pair.
Bulls seemed rather unaffected by a generally softer tone around the equity markets, which tends to undermine the perceived riskier kiwi. Fears that a faster-than-expected rise in inflation could derail the global economic recovery weighed on investors' sentiment. The concerns were further fueled by Monday's disappointing Chinese data, showing that the economic growth decelerated sharply from 7.9% to 4.9% during the third quarter.
Nevertheless, the NZD/USD pair finally broke through a confluence barrier, comprising of the very important 200-day SMA and a downward sloping trend-line extending from YTD tops touched in February. This could be seen as a fresh trigger for bullish traders and might have already set the stage for a further near-term appreciating move.
That said, prospects for an early policy tightening by the Fed might help limit any deeper USD losses and cap the upside for the NZD/USD pair. Investors seem convinced that the Fed will begin tapering its bond purchases in 2021 and have been pricing in the possibility of a rate hike in 2022 to counter growing inflation risks.
This, in turn, warrants some caution for aggressive bullish traders amid absent relevant market-moving economic releases on Tuesday. Traders now look forward to a scheduled speech by Fed Governor Michelle Bowman. This, along with the US bond yields and the broader market risk sentiment, might influence the USD and provide some impetus to the NZD/USD pair.
Technical levels to watch
| Raw materials | Closed | Change, % |
|---|---|---|
| Brent | 84.05 | -1.64 |
| Silver | 23.173 | -0.61 |
| Gold | 1764.368 | -0.15 |
| Palladium | 2004.98 | -3.43 |
Japanese Prime Minister Fumio Kishida confirmed in a statement on Tuesday, “North Korea fired two ballistic missiles.”
He added: “Regrettable North Korea has fired missiles successively since last month.”
Read: N. Korea fires unidentified projectile towards East Sea
Market reaction
The futures tied to the S&P 500 index are trading almost unchanged on the day near 4,485, unfazed by the North Korea headlines.
Meanwhile, USD/JPY is easing to 114.20, at the time of writing, down 0.09% on a daily basis.
-
USD/JPY consolidates near multi-month highs around 114.30
- Gold gained some positive traction on Tuesday and snapped two days of the losing streak.
- Retreating US bone yields undermined the USD and extended some support to the metal.
- Hawkish Fed/BoE might cap gains and warrants some caution for aggressive bullish traders.
Gold edged higher during the Asian session on Tuesday and moved back above the $1,770 level in the last hour. The XAU/USD, for now, seems to have snapped two days of the losing streak and was supported by a combination of factors. The uptick was sponsored by the emergence of fresh selling around the US dollar, which tends to benefit dollar-denominated commodities, including gold. Following the previous day's good two-way price moves, the USD met with some fresh supply amid a modest pullback in the US Treasury bond yields. This, in turn, was seen as a key factor that acted as a tailwind for the dollar-denominated commodity.
Apart from this, a generally softer tone around the equity markets extended additional support to the safe-haven precious metal. Worries that the recent widespread rally in commodity prices will stoke inflation and derail the global economic recovery continued weighing on investors' sentiment. The market concerns were further fueled by Monday's disappointing Chinese macro data, showing that the economic growth decelerated sharply from 7.9% to 4.9% during the third quarter. That said, hawkish signals by major central banks might hold traders from placing aggressive bullish bets around the non-yielding gold and cap gains.
Market participants seem convinced that the Fed will begin rolling back its massive pandemic-era stimulus by the end of this year. Investors have also started pricing in the possibility of an interest rate hike in 2022 amid fears about a faster than expected rise in inflation. Adding to this, the Bank of England Governor Andrew Bailey sent a fresh signal that the British central bank is gearing up to raise interest rates to counter growing inflation risks. Growing market acceptance about the prospects for a policy tightening by the Fed/BoE warrants some caution before positioning for any further appreciating move for gold.
There isn't any major market-moving economic data due for release on Tuesday, leaving gold at the mercy of the broader market risk sentiment and bond yields. That said, scheduled speeches by BoE MPC Member Catherine Mann and Governor Andrew Bailey might provide some impetus to gold. Later during the US session, comments by Fed Governor Michelle Bowman will influence the USD price dynamics and produce some meaningful trading opportunities around gold.
Technical outlook
From a technical perspective, last week's sharp rejection slide from the 100/200-day SMA confluence near the $1,800 mark stalled near the $1,760 static support. This makes it prudent to wait for some follow-through selling before confirming that the recent move up has run out of steam and placing fresh bearish bets. The next relevant support is pegged near the $1,750 region, below which gold prices could accelerate the fall towards September monthly swing lows, around the $1,722-21 zone.
On the flip side, immediate resistance is pegged near the $1,780-82 region, which if cleared decisively should allow bulls to make a fresh attempt to conquer the $1,800 mark. Some follow-through buying has the potential to lift the XAU/USD back towards the $1,832-34 heavy supply zone. The $1,810 area, followed by the $1,818 region could act as an intermediate hurdle on the way up.
Gold daily chart
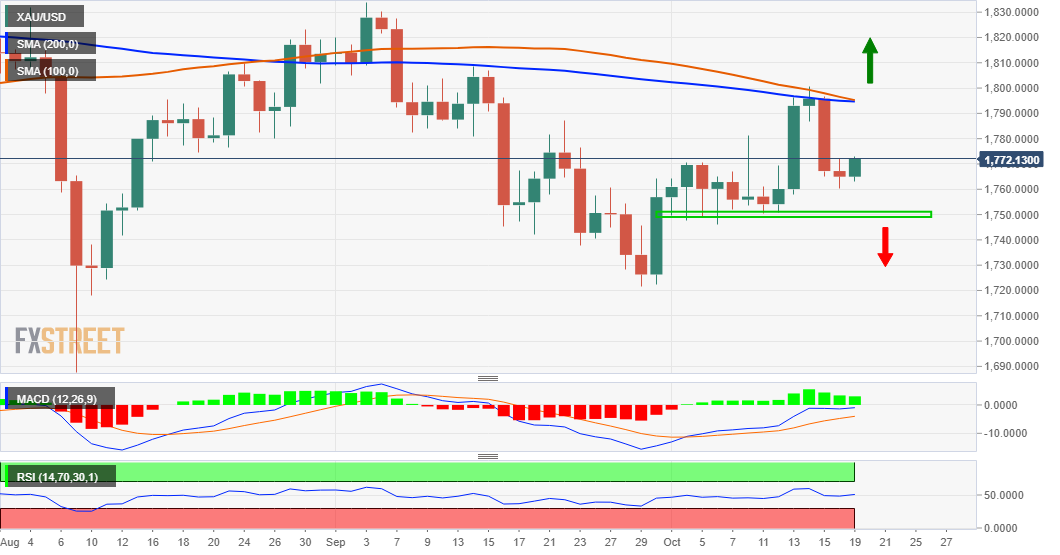
The Goldman Sachs economist predicts three rate hikes at alternate meetings from next month, taking BOE’s benchmark rate to 0.75% by May, before a move to 1% by the end of next year, per Bloomberg.
Key quotes
"I continue to believe that higher inflation will be temporary because it is in the nature of the underlying causes.”
“But the energy story particularly means that it will last longer and it will, of course, get into the annual numbers for longer as a consequence of that.”
“And that, of course, raises for central banks the fear and concern of embedded inflation expectations.”
“As I've said before, monetary policy cannot solve supply-side problems, but it will have to act and must do so if we see a risk particularly to medium-term inflation and to medium-term inflation expectations, and that is why we at the BOE have signaled - and this is another such signal - that we will have to act.”
“But of course, that action comes in our monetary policy meetings."
-
UK 2-year gilt yield jumps to highest level since May 2019 at 0.74%
- USD/INR bulls move in for the kill and eye a fresh daily high.
- USD/INR stalled at firm support and bulls stay in control.
As per the prior analysis, ''USD/INR Price News: Rupee firms at critical daily resistance, eyes 75 the figure,'' the price has continued to deteriorate as forecasted as follows, but has now moved higher in what would be expected to lead to a fresh daily higher high:
USD/INR prior daily analysis
-637696866727985348.png)
-637701201381854707.png)
The price of USD/INR met the daily support zone and was in the process of consolidation. It was stated that if the price fails to move higher from here, there would be an argument for a long term consolidation with 74.50 eyed as a downside target.
USD/INR daily chart
-637702049094717729.png)
However, the price has indeed moved higher and this is a bullish development from critical support that will be monitored for prospects of a higher daily high for the forthcoming days, if not next week.
- GBP/USD edges higher on Tuesday in the Asian trading hours.
- The pair faces strong resistance near the 1.3770-1.3780 zone below the bearish slopping line.
- MACD signals upside momentum with the underlying bullish sentiment.
GBP/USD trades on a higher note on Tuesday. The pair opened lower but swiftly recovered to claim 1.3750, where it currently hovers.
GBP/USD daily chart
-637702040610283363.png)
On the daily chart, the GBP/USD pair has been in the continuous downward trend since the high made on July 30 at 1.3983. The descending trendline from the mentioned level act as a strong barrier for GBP/USD. The spot trades above the 50-day Simple Moving Average (SMA) at 1.3716 makes bulls hopeful of some recovery.
If the pair sustains above the intraday high along with the break of the bearish slopping line that would mean GBP/USD bulls can test the psychological 1.3800 mark. A successful break of the 100-day SMA at 1.3812 could pave way for the 1.3850 horizontal resistance level.
The Moving Average Convergence Divergence (MACD) indicator holds onto the oversold zone. Any uptick in the MACD could bring some upside momentum for the spot. The bulls would approach the psychological 1.3900 level in that case.
Alternatively, a daily close below the 50-day SMA at 1.3714 would result in the continuation of the prevailing trend, with the first downside target at Friday’s low of 1.3667, followed by the 1.3555 horizontal support zone.
Next, the bears would not mind to takeout the 1.3500 horizontal support level.
GBP/USD additional levels
In another demonstration of military might, N. Korea fires yet another unidentified projectile towards East Sea.
More to come...
In recent trade today, the People’s Bank of China (PBOC) set the yuan (CNY) at 6.4307 vs the estimated 6.4275 and the prior 6.4300.
About the fix
China maintains strict control of the yuan’s rate on the mainland.
The onshore yuan (CNY) differs from the offshore one (CNH) in trading restrictions, this last one is not as tightly controlled.
Each morning, the People’s Bank of China (PBOC) sets a so-called daily midpoint fix, based on the yuan’s previous day closing level and quotations taken from the inter-bank dealer.
- AUD/USD prints gain on Tuesday in the initial Asian session.
- The US Dollar Index breaks 94.00 amid risk-on sentiment.
- RBA minutes, higher commodity prices, and risk-on mood aid aussie gains.
AUD/USD is picking up the bid, following the release of the Reserve Bank of Australia (RBA) minutes. The pair opens lower and touched an intraday high of 0.7248 before testing the low of 0.7406. At the time of writing, AUD/USD is trading at 0.7421, up 0.12% for the day.
The Reserve Bank of Australia (RBA) in its latest monetary policy meeting minutes showed that the central bank remained optimistic about the economic growth. The economy is expected to recover by December 2021 and to the pre-pandemic level in the second half of 2022. The board members acknowledged that the delta variant interrupted the economic recovery. Despite higher growth projects, the central bank retreated its no interest hike rate stance until the inflation is stable within the 2-3% target band.
In addition to that, China’s growth concerns weighed on the sentiment. Chinese Q3 Gross Domestic Product (GDP) fell 4.9% on a YoY basis, falling below the market consensus of 5.2%. Nevertheless, higher commodity prices provide some support as AUD held six-week highs on the back of higher commodity prices. It is worth noting that the S&P 500 Futures is trading at 4,477, up 0.02% for the day.
The US Dollar Index (DXY), which tracks the performance of the greenback against its six major rivals fell briefly below 94.00.
As for now, traders await US Housing Start, and Building Permits to gauge the market sentiment.
AUD/USD additional levels
The RBA’s October meeting Minutes have stated that the inflation target of 2-3% that is required before the central bank will lift the cash rate will not be until 2024. AUD/USD is giving back short term gains.
RBA Minutes
Delta variant of covid-19 had interrupted the recovery of the Australian economy
In the central scenario, the economy would return to growth in the December quarter and to its pre-delta path in the second half of 2022.
Economic recovery was likely to be slower than in late 2020/early 2021.
Members agreed that, while less accommodative monetary policy would, all else equal, see lower housing prices and credit growth, it would result in fewer jobs and lower wages growth.
AUD/USD technical analysis
Earlier, the bulls took out the resistance on the retest and now bears need another break of 0.7410/0.7400 of face stringer bullish momentum from trendline support:
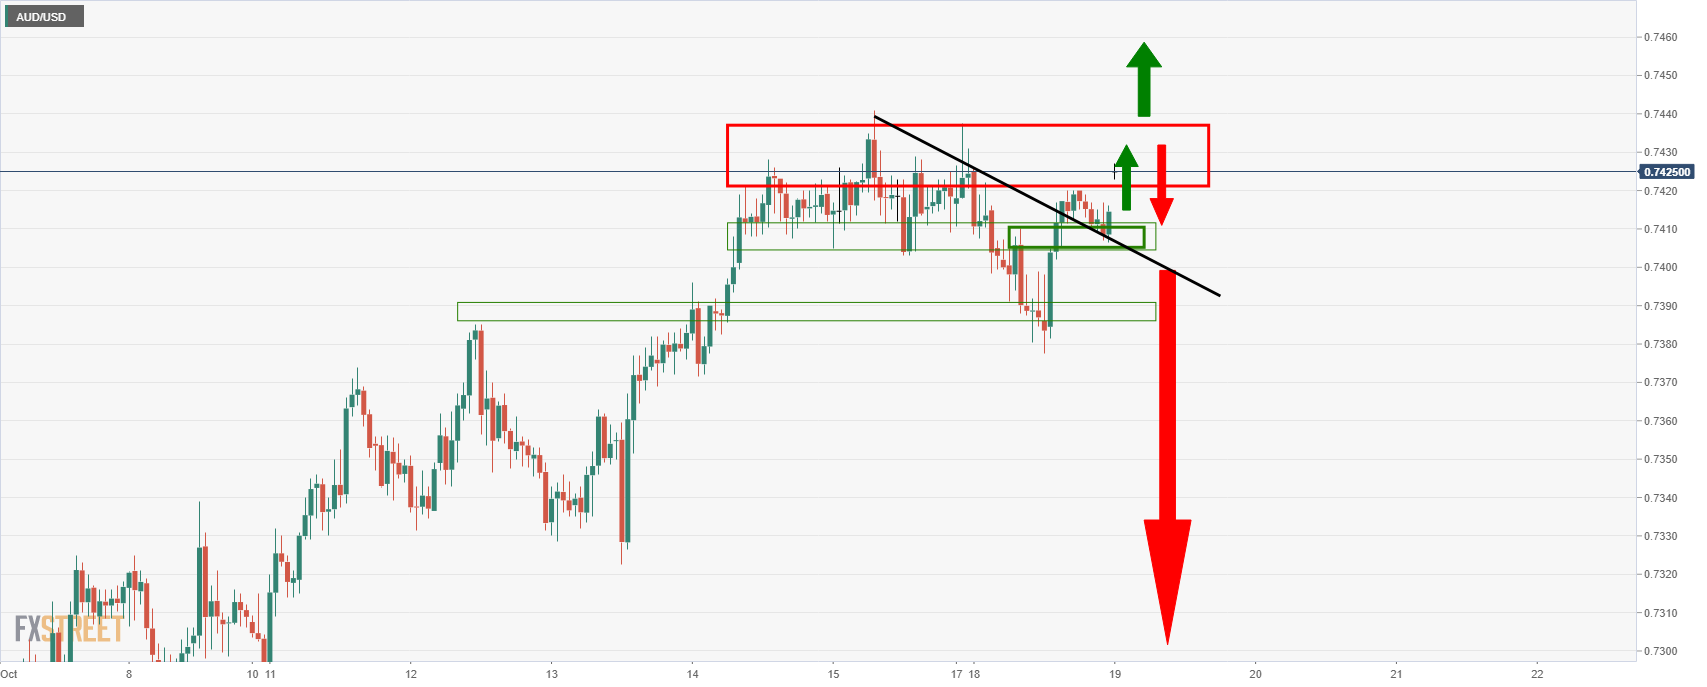
Further bullish AUD reading: AUD/NZD Price Analysis: Traders, don't get caught out!
About the Minutes
The minutes of the Reserve Bank of Australia meetings are published two weeks after the interest rate decision. The minutes give a full account of the policy discussion, including differences of view. They also record the votes of the individual members of the Committee. Generally speaking, if the RBA is hawkish about the inflationary outlook for the economy, then the markets see a higher possibility of a rate increase, and that is positive for the AUD.
| Time | Country | Event | Period | Previous value | Forecast |
|---|---|---|---|---|---|
| 01:30 (GMT) | Australia | RBA Meeting's Minutes | |||
| 06:00 (GMT) | Switzerland | Trade Balance | September | 4.5 | |
| 09:00 (GMT) | Eurozone | Construction Output, y/y | August | 3.3% | |
| 12:05 (GMT) | United Kingdom | BOE Gov Bailey Speaks | |||
| 12:30 (GMT) | U.S. | Housing Starts | September | 1.615 | 1.62 |
| 12:30 (GMT) | U.S. | Building Permits | September | 1.721 | 1.68 |
| 15:00 (GMT) | U.S. | FOMC Member Daly Speaks | |||
| 17:15 (GMT) | U.S. | FOMC Member Bowman Speaks | |||
| 18:50 (GMT) | U.S. | FOMC Member Bostic Speaks | |||
| 23:50 (GMT) | Japan | Trade Balance Total, bln | September | -635.4 | -519.2 |
- USD/CHF edges lower, erasing the previous session’s gains.
- Higher US Treasury yields underpin the demand for the US dollar.
- Fed tapering and higher inflationary concerns influence traders' decisions.
USD/CHF accumulated mild losses on Tuesday in the early Asian session. After testing the high near 0.9280 in the US session, the pair traded lower to close below 0.9250. At the time of writing, USD/CHF is trading at 0.9233, down 0.05% for the day.
The US benchmark 10-year Treasury yields trade at 1.59% with 0.88% gains. The greenback follows the US bond yields and remains steady near 94.00. Investors reacted to the prospects of higher interest rates by selling across the board global government bonds. Higher energy prices along with the existing supply-chain bottlenecks and labor shortages check traders nerves.
On the other hand, the Swiss franc loses momentum as traders turn to the riskier asset in the anticipation of higher returns. It is worth noting that, S&P 500 Futures is trading at 4,478, up 0.01% for the day.
As for now, traders are looking for the US Housing Starts, and Building Permits data to take fresh trading insight.
USD/CHF additional levels
The RBA’s October meeting Minutes will provide additional colour around emerging risks as well as their baseline views.
However, the focus for markets and the AUD will remain on global front ends and offshore equities. With that being said, the Aussie has ridden on the coattails of New Zealand's surprise inflation data yesterday that came in much hotter than expected and highest in a decade. The Consumers Price Index rose 2.2 per cent in the September 2021 quarter, the biggest quarterly movement since a 2.3 per cent rise in the December 2010 quarter. Nonetheless, analysts at ANZ Bank are not so sure that this can be expected of the Australian economy just yet:
''We are not anticipating Australia’s inflation to be anywhere near as strong as New Zealand’s,'' the analysts said. ''If trimmed mean inflation surprises on the upside, then the composition of the price increases will matter. If most of the strength was driven by tradable prices rather than non-tradable, the RBA will likely be more willing to look through it rather than take it as an indication that we are starting to see evidence of more widespread sustained inflation.''
The RBA reiterated its dovish stance in the Oct statement that it does not expect to hike the cash rate before 2024 and the Minutes today should not surprise. Instead, more focus will be on the Governor's panel participation on "Central Bank Independence, Mandates and Policies" on Thurs/Fri which likely makes for a mundane event around the Minutes today as traders hold off for bigger fish and more meat on the bone.
How might the Minutes impact AUD?
The event is unlikely to move the dial too much, but surprises can happen. Nevertheless, AUD/USD is at the mercy of external factors more so as the markets have priced in the RBA for the meanwhile. For instance, in yesterday's preview ahead of the Chinese data, it was explained that AUD/USD is technically on the verge of a run to test the daily chart's 61.8% Fibonacci that meets territory near 0.7300:
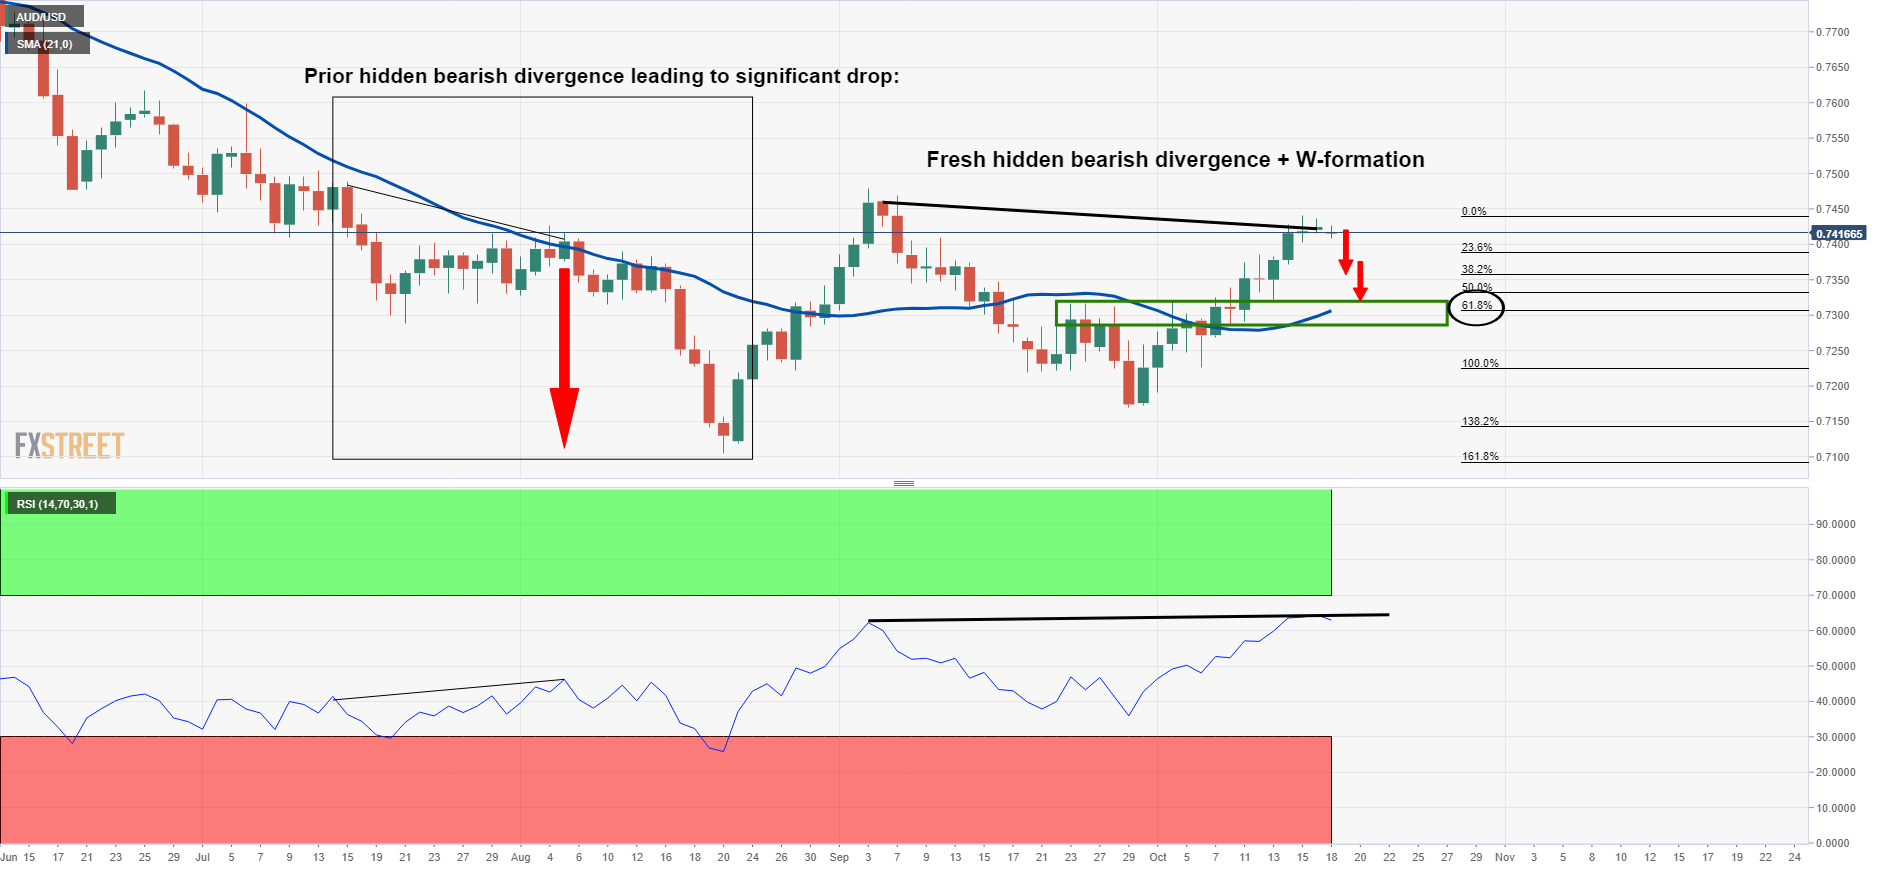
From an hourly point of view, it was illustrated as follows:
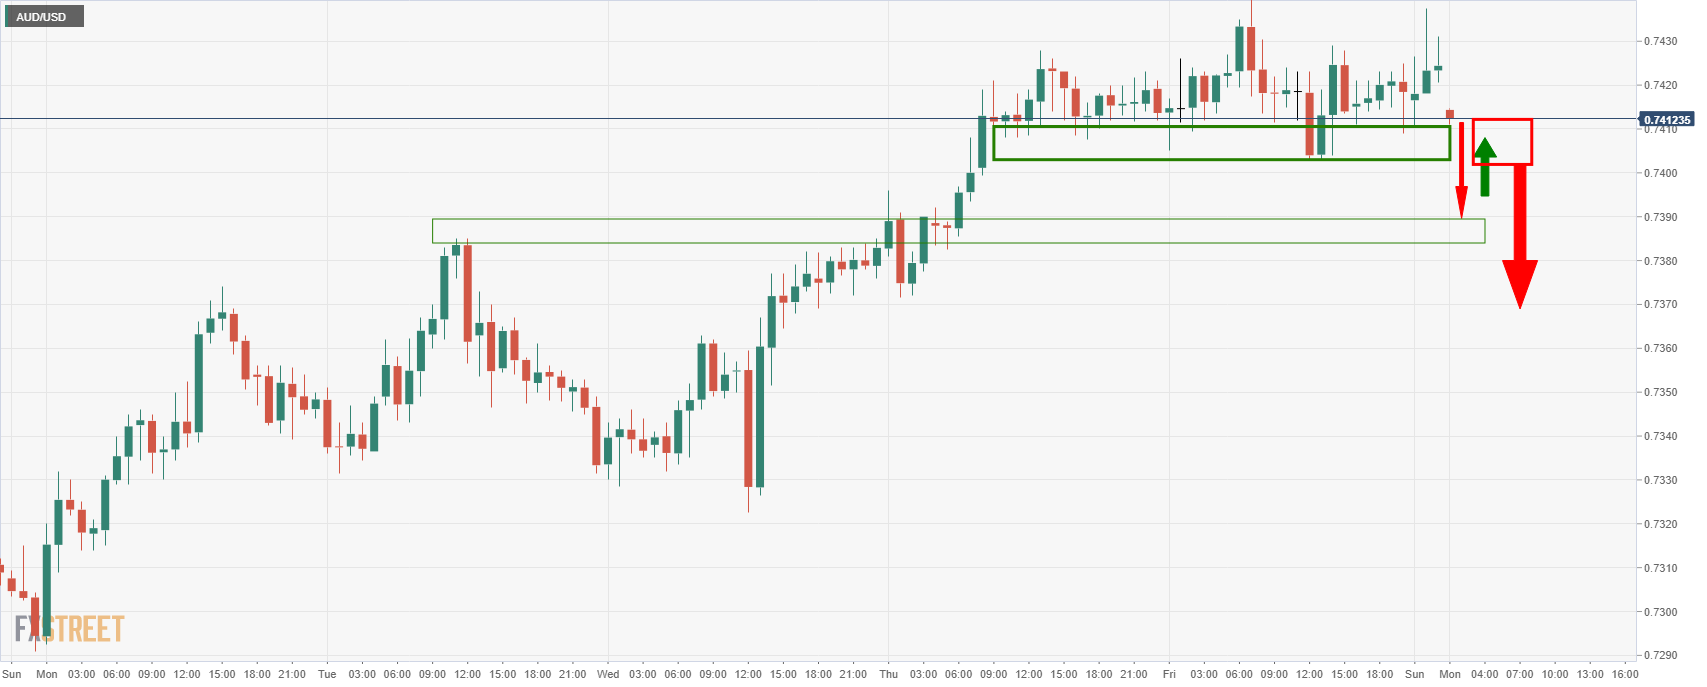
However, the price action did not quite follow as forecasted. We did see the drop sometime after the data, albeit the bulls took out the resistance on the retest and now bears need another break of 0.7410/0.7400 of face stringer bullish momentum from trendline support:

Further bullish AUD reading: AUD/NZD Price Analysis: Traders, don't get caught out!
About the Minutes
The minutes of the Reserve Bank of Australia meetings are published two weeks after the interest rate decision. The minutes give a full account of the policy discussion, including differences of view. They also record the votes of the individual members of the Committee. Generally speaking, if the RBA is hawkish about the inflationary outlook for the economy, then the markets see a higher possibility of a rate increase, and that is positive for the AUD.
| Pare | Closed | Change, % |
|---|---|---|
| AUDUSD | 0.74105 | -0.08 |
| EURJPY | 132.685 | 0.18 |
| EURUSD | 1.16079 | 0.08 |
| GBPJPY | 156.913 | -0.09 |
| GBPUSD | 1.37261 | -0.18 |
| NZDUSD | 0.70796 | -0.08 |
| USDCAD | 1.23693 | 0.1 |
| USDCHF | 0.92377 | 0.12 |
| USDJPY | 114.306 | 0.1 |


© 2000-2026. All rights reserved.
This site is managed by Teletrade D.J. LLC 2351 LLC 2022 (Euro House, Richmond Hill Road, Kingstown, VC0100, St. Vincent and the Grenadines).
The information on this website is for informational purposes only and does not constitute any investment advice.
The company does not serve or provide services to customers who are residents of the US, Canada, Iran, The Democratic People's Republic of Korea, Yemen and FATF blacklisted countries.
Making transactions on financial markets with marginal financial instruments opens up wide possibilities and allows investors who are willing to take risks to earn high profits, carrying a potentially high risk of losses at the same time. Therefore you should responsibly approach the issue of choosing the appropriate investment strategy, taking the available resources into account, before starting trading.
Use of the information: full or partial use of materials from this website must always be referenced to TeleTrade as the source of information. Use of the materials on the Internet must be accompanied by a hyperlink to teletrade.org. Automatic import of materials and information from this website is prohibited.
Please contact our PR department if you have any questions or need assistance at pr@teletrade.global.
transfers