- Analytics
- News and Tools
- Market News
CFD Markets News and Forecasts — 21-10-2021
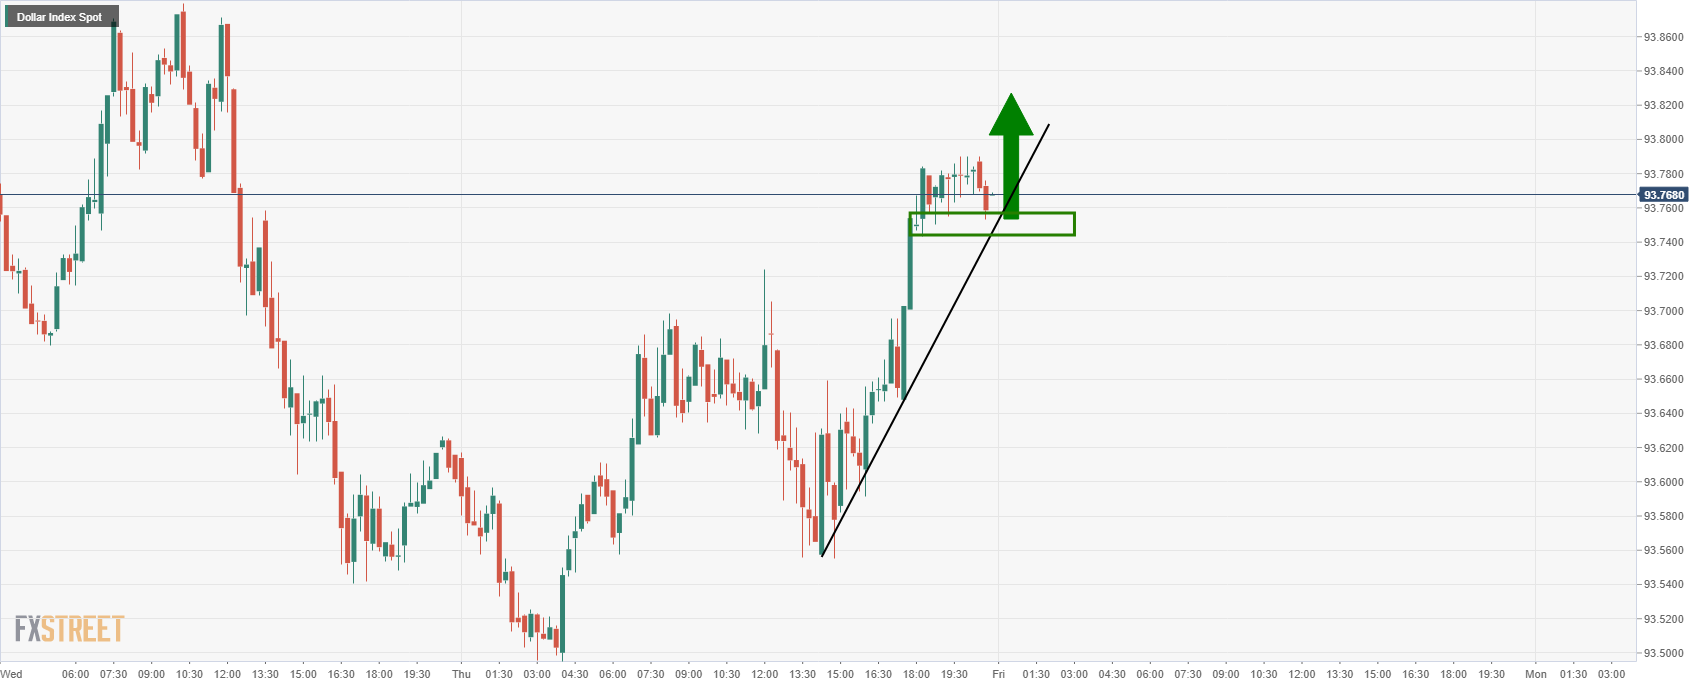
- DXY grinds higher following its bounce off three-week low.
- Short-term moving averages, seven-week-old previous support line probe upside amid bearish MACD signals.
US Dollar Index (DXY) bulls pause around 93.75 after the strongest up-move in over a week. That being said, the greenback gauge seesaws in a choppy range, following its U-turn from the monthly low, by the press time of Friday’s Asian session.
Although monthly horizontal support triggered the DXY rebound, a confluence of 10-DMA and 21-DMA, as well as the support-turned-resistance line from early September, offer a strong resistance around the 94.00 threshold.
Also challenging the upside momentum are the bearish MACD signals and 23.6% Fibonacci retracement level (Fibo.) of September-October advances.
Hence, US Dollar Index buyers need validation from the 94.00 round figure for conviction, a break of which will challenge the monthly peak of 94.56.
Alternatively, a downside break of the stated horizontal support near 93.50 won’t hesitate to recall the DXY sellers targeting 61.8% Fibo. near 92.95. It’s worth noting that the 93.00 round figure may add strength to the stated support.
US Dollar Index: Daily chart

Trend: Pullback expected
Boris Johnson would be prepared to accept a limited role for the European Court of Justice in a bid to unlock a deal with Brussels over the Northern Ireland protocol, government figures say, as The Times reports.
'In public Johnson and Lord Frost, the Brexit minister, have insisted that the EU must agree to drop any role for the court. But senior figures have privately raised the prospect of a compromise that would allow a limited role for the ECJ in interpreting the application of EU law in Northern Ireland.''
''Under the plan, disputes would go to an independent arbitration panel, with the ECJ asked to interpret narrow matters of EU law as a last resort if dispute resolution failed.''
Market implications
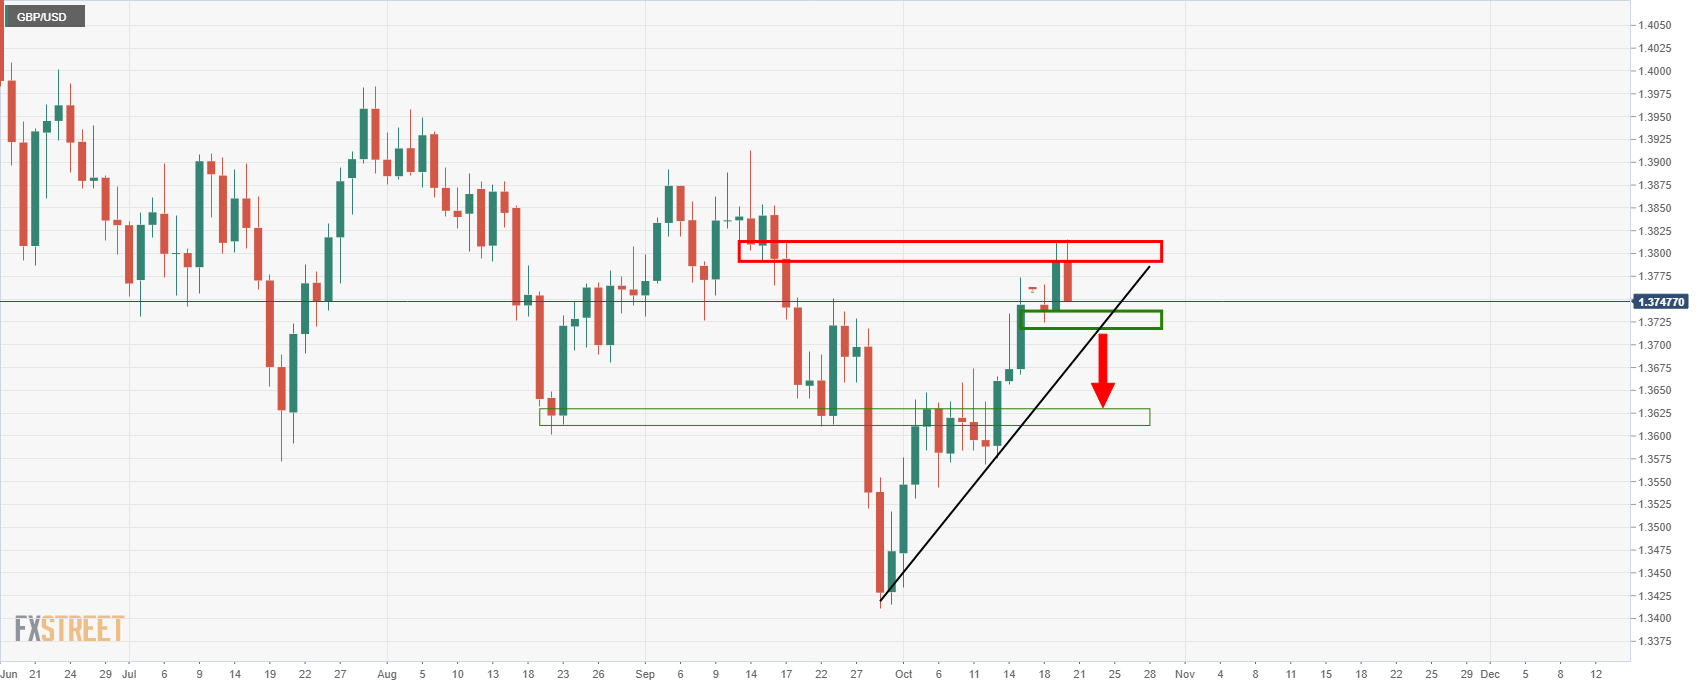
This is a welcome update for GBP although the rising US dollar and yields could hamstring GBP/USD to the downside in the immediate future. The DXY, an index that measures the greenback vs a basket of currencies, is potentially above to make a move to the upside again in an extension of the recovery from 93.50 support.
Meanwhile, GBP/USD is testing daily support but it could remain trapped for the meanwhile. A break of the dynamic trendline would open prospects of a run towards the neckline of the W-formation near 1.3620.
- GBP/JPY remains quiet on Friday in the early Asian trading hours.
- The cross-currency pair surrenders gain near 158.20.
- Momentum oscillators hold onto the overbought zone, throwing caution for aggressive bids.
The GBP/JPY cross-currency stays relatively quiet on Friday. The pair remains pressured near 158.22. At the time of writing, GBP/JPY is trading at 157.18, down 0.1% for the day.
GBP/JPY daily chart
-637704567602213079.png)
On the daily chart, the GBP/JPY cross currency pair seems exhausted near a fresh six-year high made on Wednesday. The double top near 158.22 prompts bears to take some action. If the price breaks below the intraday low it could fall back to Monday’s low at 156.61.
A break of the 156.00 psychological level, which coincides with the 23.6% Fibonacci Retracement from the lows of 149.23 could mean a low of October 15 at 155.42 for the pair. Furthermore, the Moving Average Convergence and Divergence (MACD) trades in the overbought zone. Any downtick in the MACD would bring the 154.75 horizontal support level back into the picture.
Alternatively, on the reverse side of the trade, the upside target appears at the previous day’s high of 158.21. Next, the GBP/JPY bulls seek the June 2016 high of 160.67.
GBP/JPY additional levels
US inflation expectations, as measured by the 10-year breakeven inflation rate per the St. Louis Federal Reserve (FRED) data jumped to the highest levels last seen during 2012 by the end of Thursday’s North American trading.
In doing so, the risk barometer extends recovery moves from late September while flashing 2.64% at the latest.
The same favors US Treasury yields that recently track reflation fears to rally, the 10-year coupon pokes a five-month high around 1.70% at the latest. This phenomenon underpins the US dollar’s safe-haven demand amid Fed tapering chatters.
It’s worth noting that the US dollar witnessed a rally in the past when the US 10-year Treasury yields crossed the 1.70% mark.
On Thursday, Federal Reserve Governor Christopher Waller said that the next few months will be critical to see whether inflation is transitory, as reported by Reuters. Before that, Federal Reserve Governor Randal Quarles and Cleveland Fed President Loretta Mester highlighted inflation fears.

It should be noted, however, be observed that the 2.64% level of the stated inflation gauge is the tough resistance and hence a cautious view is needed for a sustained break of the 2.64% level for the US dollar bulls, which in turn could weigh on gold prices.
Read: Gold Price Forecast: XAU/USD steady around $1,780.00 capped by high US T-bond yields
- WTI keeps pullback from multi-day top, retreats of late.
- Immediate falling trend line, downbeat Momentum line favor sellers.
- Weekly support line adds to the downside filters.
WTI fades late Thursday’s bounce off $80.60, following its U-turn from a seven-year high, during Friday’s Asian session. That said, the quote drops back to $82.00 by the press time.
The black gold tracks a nearby descending trend line, coupled with a falling Momentum line, to suggest further weakness.
However, 200-HMA and an upward sloping support line, respectively around $81.30 and $81.10, challenge short-term declines of the commodity prices.
Also acting as a downside filter is the 61.8% Fibonacci retracement of October 13-21 upside, near $80.70, as well as the $80.00 psychological magnet.
Alternatively, an upside break of the nearby resistance line, around $82.40 at the latest, will recall the WTI buyers and direct them to the latest top surrounding $83.70.
Though, Monday’s top near $83.15 and multiple lows marked during November 2012 near $84.10-20 act as extra resistances to watch during the quote’s fresh upside.
WTI: Hourly chart
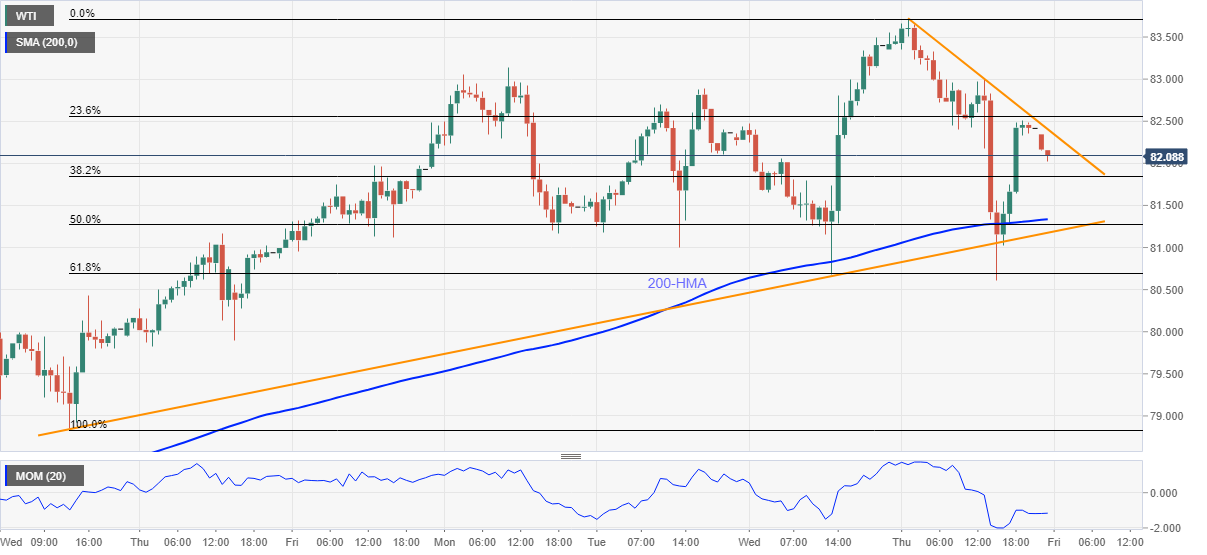
Trend: Further weakness expected
- AUD/NZD remains in consolidation as supply battles with demand.
- AUD/USD bulls appear to be buying into supply which could lead to a breakout.
- The daily M-formation's neckline is compelling as an upside target.
The following is an update of the prior analyst as follows AUD/NZD Price Analysis: Accumulation is occurring, bulls are taking over. The market is moving sideways and a trapped environment between hourly support and resistance but there are prospects of a bullish breakout to test the neckline of the following daily M-formation at 1.0524:
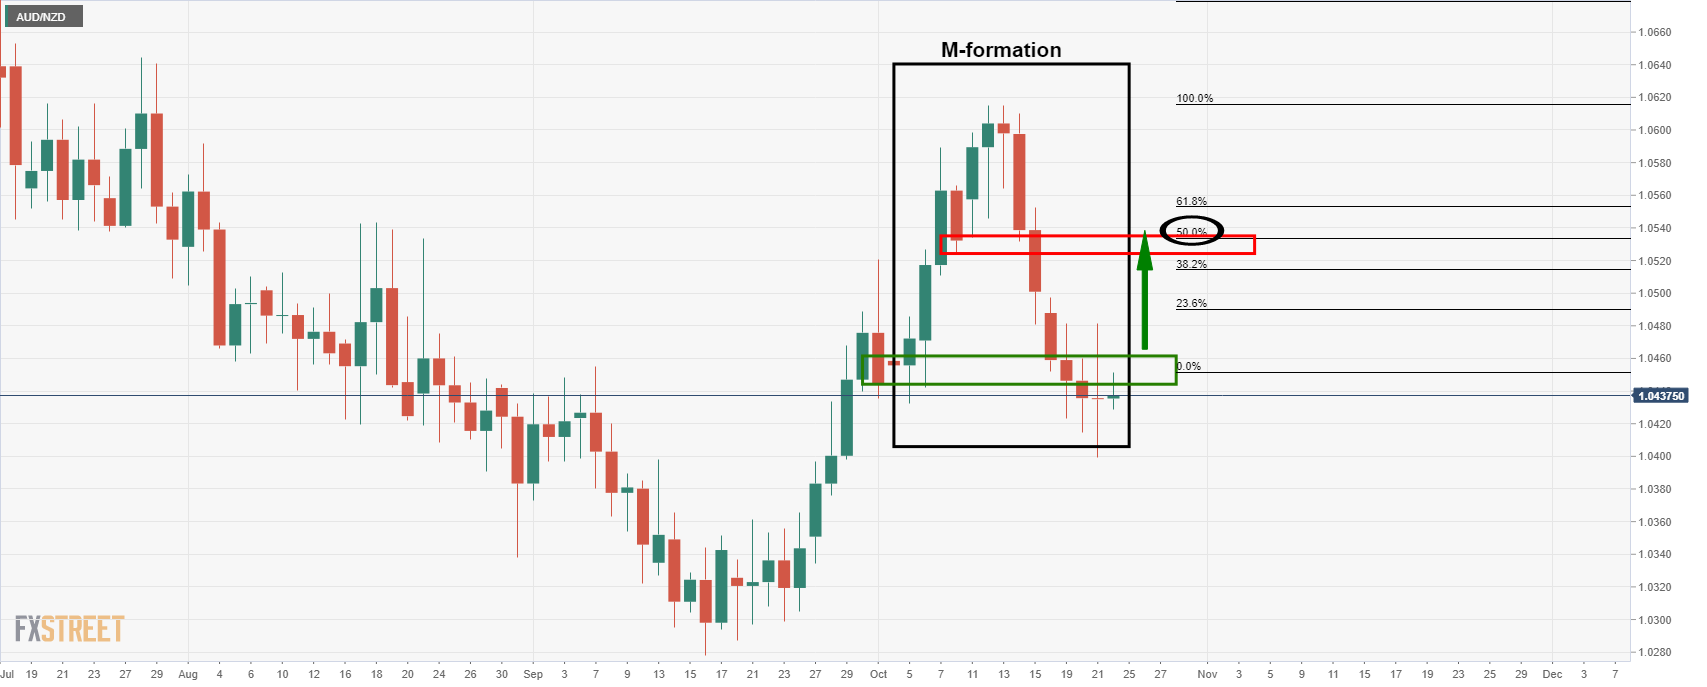
Meanwhile, on the hourly chart, the Wycoff theory is put to test on the following chart which has been updated from this in yesterday's analysis...
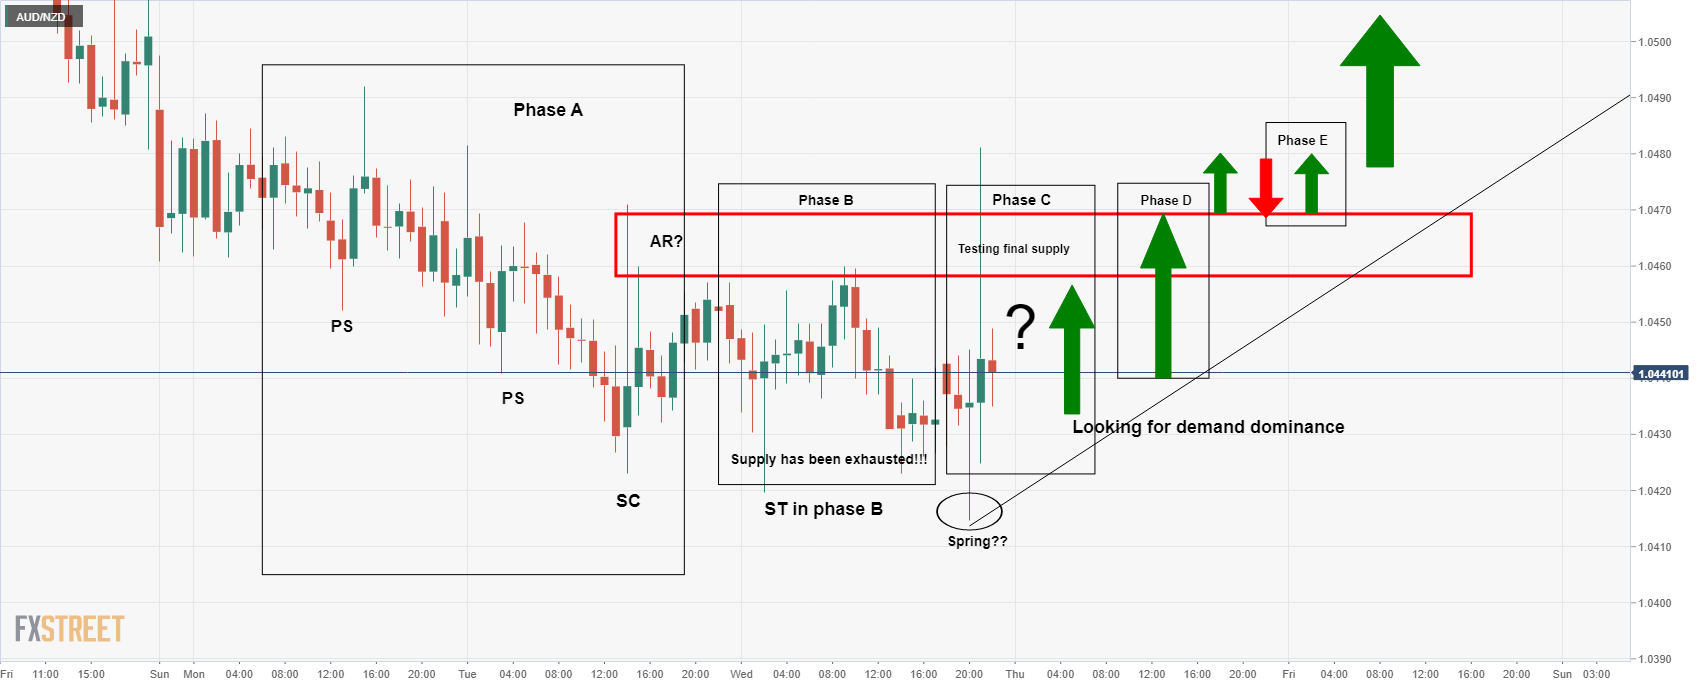
...to the following...
In this updated version in today's live market analysis, we can see that the supply was still not exhausted and that the market was not ready to move higher. However, we could now be seeing those final offers being accumulated in what would be expected to result in a move to resistance and demand dominance:
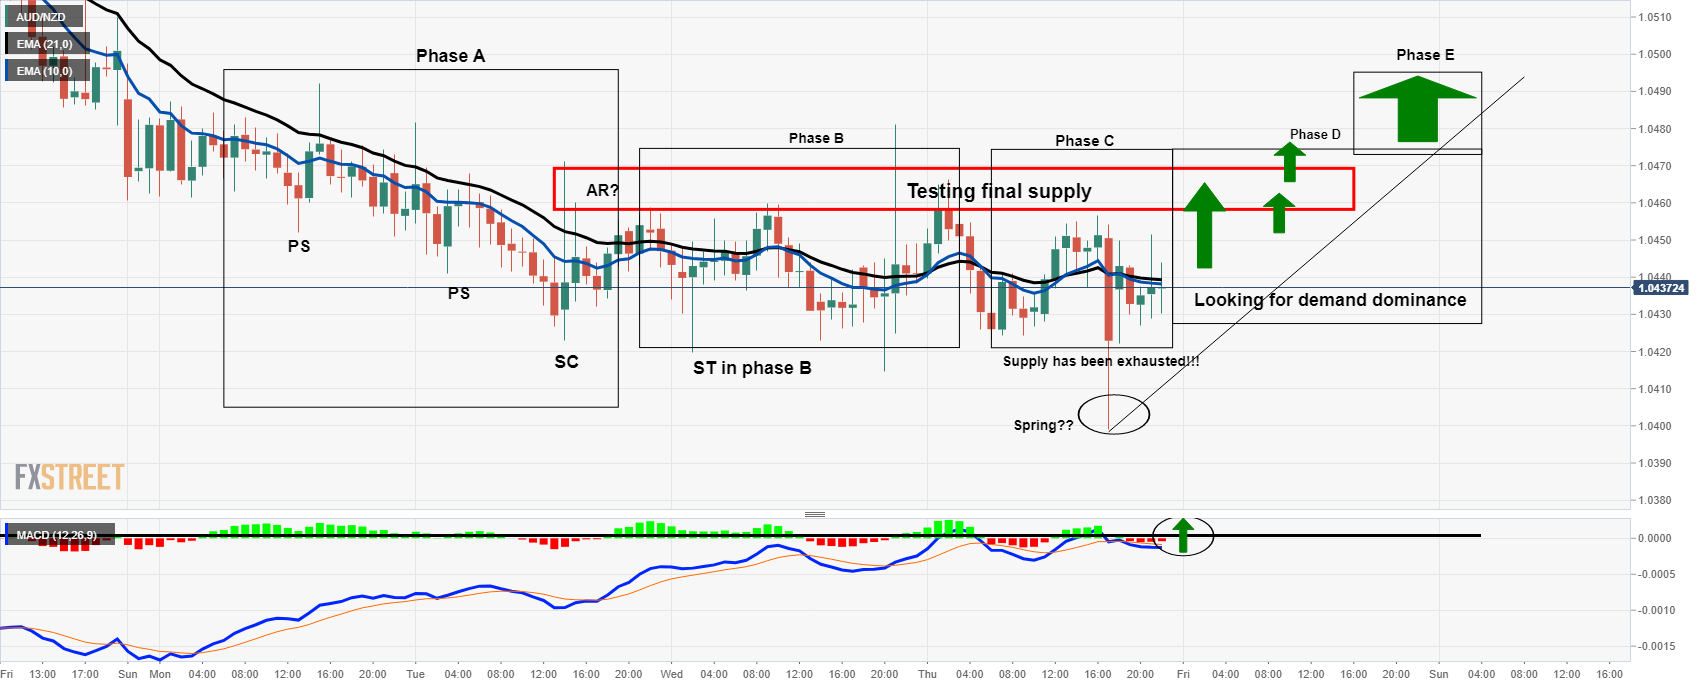
If the spring has been identified correctly this time around, then this is the end of phase C and a breakout is imminent. MACD zero line cross and the 10/21 EMA crossover are useful to determine the bias. While there have been a couple of false signals since yesterday, ideally they should be accompanied by a break of resistance structures within the accumulation. So far, we have not seen this.
- USD/JPY remains muted on the last day of the week in the initial Asia session.
- The US dollar trades below 94.00 tracks higher US T-bond yields.
- The Japanese yen gains amid a risk-off mood.
USD/JPY continues to extend the previous session’s sluggish momentum on Friday. The pair stayed in a relatively narrow price band of 114.00 and 114.50. At the time of writing, USD/JPY is trading at 114.01, up 0.05% for the day.
The US benchmark 10-year Treasury bond yields trade at 1.69%, following a better-than expected jobless claims data. Investors continue to anticipate the Fed’s tapering next month tracing strong corporate earnings, which boosted hopes of a continued economic recovery. The US Initial Jobless Claims reported at 290K below the market forecast of 300K.
Atlanta Federal Reserve President Raphael Bostic said he expected an interest rate hike in the later part of 2022 amid higher inflation concerns as well economic growth.
On the other hand, the Japanese yen managed to gain on the back of its safe-have appeal. Investors' sentiment was dented following the renewed China’s Evergrande default risk. In addition to that, the US is planning to hold a virtual meeting between US President Joe Biden and China’s President XI-jinping. It is worth noting that, S&P 500 Futures is trading at 4,531, down 0.23% for the day.
As for now, traders are waiting for Japanese Inflation data, US Markit Manufacturing Purchasing Managers Index (PPI) to gauge the market sentiment.
USD/JPY additional levels
- USD/CAD struggles to keep the bounce off four-month low.
- Oil prices dwindle amid inflation-led risk aversion, China-linked fears.
- Canada data came in softer, US ones were mixed as well.
- Canada Retail Sales, US PMIs are eyed but USD may benefit from safe-haven demand.
USD/CAD grinds higher past 1.2350 following its rebound from early June lows to post the strongest daily run-up in October. That said, the quote seesaws near 1.2370 by the press time of the initial Asian session on Friday.
Alike other currency pairs, USD/CAD also portrayed the US dollar’s recovery moves, the first in seven, while taking a U-turn from the multi-day low the previous day.
The US Dollar Index (DXY) rebound could be linked to the inflation-led fears and the China woes that dragged down the market sentiment and commodities, offering a double-down weigh on the Canadian Dollar. The reason could be linked to Canada’s heavy reliance on WTI crude oil as an export income.
Federal Reserve Governor Christopher Waller said on Thursday that the next few months will be critical to see whether inflation is transitory, as reported by Reuters. Previously, Federal Reserve Governor Randal Quarles and Cleveland Fed President Loretta Mester highlighted inflation fears.
Further, China’s troubled reality firm Evergrande managed to get an extension on a defaulted $260 million bond but the global rating giant Fitch cites property stress from Beijing to join the macro policy trade-off risks. This came after it failed to seal an asset sale deal with Hopson and flashed another red signal to the investors. Additionally, power cuts in China remain the key problem for the world’s biggest industrial player even as the government restarts some of the coal mines to battles energy shortages.
Against this backdrop, equities stalled and the US 10-year Treasury yields jump to a fresh high since early April. Also, WTI crude oil prices took a U-turn from a seven-year high recently pressured around $82.50.
It’s worth mentioning that the second-tier data from Canada, mainly linked to employment and housing came in softer while US economics were mixed, which in turn helped the USD/CAD to recover.
Looking forward, Canadian Retail Sales for August will precede the US PMIs for October to entertain the USD/CAD traders. However, major attention will be on the risk catalysts for fresh impulse.
Technical analysis
Despite bouncing off multi-day low, 10-DMA and a horizontal area comprising lows marked since early July, respectively around 1.2395 and 1.2425-30, guard short-term USD/CAD recovery moves. Meanwhile, June’s low near 1.2350 limits nearby declines.
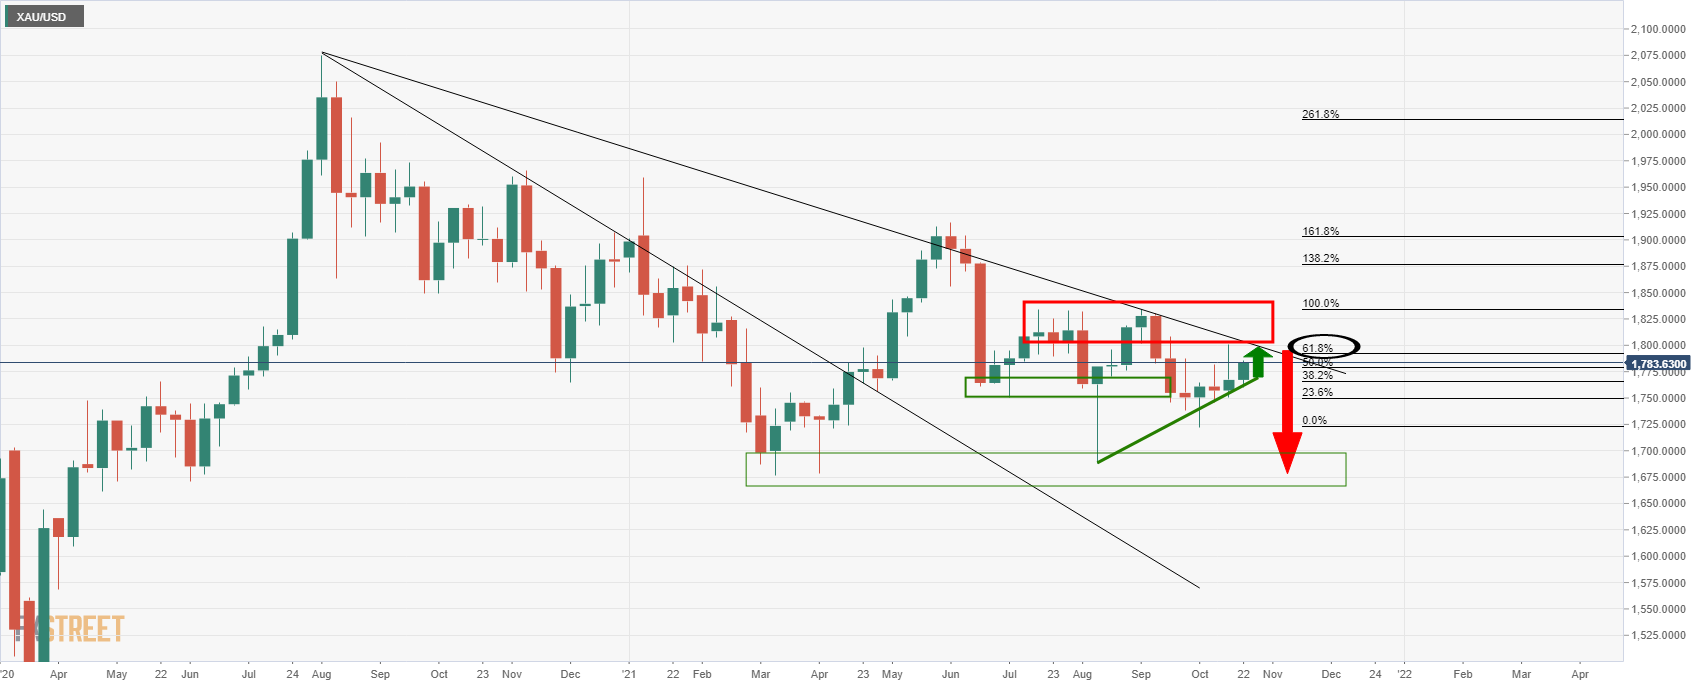
- Gold is range-trading within the $1,767-88 area awaits a fresh catalyst.
- The market sentiment is dismal due to inflation worries clouding the financial markets.
- XAU/USD: It is tilted to the upside in the short term but will face strong resistance at $1,800.00.
On Thursday, gold (XAU/USD) seesawed around $1,767-88, subject to the movement in US T-bond yields. As the Asian session begins, the non-yielding metal is barely up 0.08%, trading at $1,783.50 during the day at the time of writing. During the New York session, the market sentiment improved as the Wall Street close approached, ending with a positive mood; however, as the Asian session opened, conditions have worsened, as portrayed by falling equity futures.
Based on the abovementioned, factors like inflation, mentioned by most central bank policymakers around the globe, dented the market sentiment as it remains the main narrative for the day. Throughout the week, robust US corporate earnings kept up investors’ spirits, despite higher CPI reading like in New Zealand, which boosted the antipodean currencies against the greenback. On the softer tone was the UK inflation figure, which trailed the estimated by analysts.
The consequence of elevated prices spurred a sell-off in the bond market as bond yields rose. In the case of the US, the 10-year benchmark note rate rose to 1.68% on Thursday, the highest level since the 1.78% March high, which reflects investors confidence that the Federal Reserve will need to hike rates soon, to curb inflation. That jump in the US yield capped gold upside move in its attempt towards $1,800.00.
XAU/USD Price Forecast: Technical outlook
The 1-hour chart depicts that gold (XAU/USD) has been up and down, failing to challenge the $1,800.00 level. At press time, it is trading above the hourly moving averages (HMA’s), indicating an upside bias, but the slope of the before mentioned is flat, so the non-yielding metal is range-bound.
The Relative Strength Index (RSI), a momentum indicator, is at 52 with a downward slope, but it supports the upward trend as it remains above the 50-midline.
Gold (XAU/USD) buyers will need a break of the $1,790.00 level to challenge $1,800.00. In case of that outcome, key resistance levels would be exposed. The first one would be the September 14 swing highs around $1,808.50, followed by the September 7 swing highs around $1,827.00.
- EUR/USD holds lower grounds inside fortnight-old rising channel formation.
- Convergence of Fibonacci retracements, channel’s support restricts immediate downside.
- Descending RSI joins double tops around 1.1665-70 to keep bears hopeful.
EUR/USD fades bounce off 1.1620 amid a quiet start to Friday’s Asian session. In doing so, the major currency pair remains near crucial support confluence following its rejection from an important short-term Fibonacci retracement (Fibo.) level, namely 61.8% Fibo. of September 22 to October 12 downturn.
Given the descending RSI conditions and a double top around 1.1665-70, not to forget sustained trading below 200-SMA, EUR/USD prices are likely to remain weak.
However, the support line of a two-week-old ascending trend channel joins 38.2% Fibonacci retracement of the stated short-term moves, also 23.6% Fibo. level of a decline from early September, restrict the quote’s immediate downside around 1.1620-15.
Hence, a clear break of the stated support level becomes necessary for the EUR/USD bears to aim for the yearly low surrounding 1.1525. Though, the 1.1570 level may act as a buffer during the fall.
Meanwhile, recovery moves remain less important until crossing the 1.1665-70 level. Also challenging the EUR/USD bulls are the 200-SMA level of 1.1675 and the stated channel’s resistance line close to 1.1690.
Should the EUR/USD buyers manage to cross the 1.1690 hurdle, the late September highs near 1.1755 will be in focus.
EUR/USD: Four-hour chart
Trend: Further weakness expected
“The Reserve Bank of Australia (RBA) is closely watching a spike in inflation,” said the RBA Governor Philip Lowe, per Reuters, while speaking at a conference hosted by the Universidad de Chile on early Friday morning in Asia.
The policymaker adds that he did not think the rise would be sustained unless it led to sustainably higher wages growth.
Key quotes
Policymakers broadly understood why the spike in inflation was occurring.
Whether it turned into a permanent lift depended on whether it fed through to the labor market.
Is it going to reset expectations about what type of wage growth people should get, or will the spike dissipate and we will go back to the type of labor market outcomes we’ve seen before the pandemic?
So there is quite a lot of uncertainty around that issue, but we are watching very carefully.
Read: AUD/USD: Bear’s return eyes 0.7420 amid inflation-linked fears, China woes
"Vaccinations are our armor," said New Zealand (NZ) PM Jacinda Ardern while unveiling the new measures, the easy one, to battle the coronavirus during Friday morning in Asia.
“In a suite of announcements that establish a pathway out of restrictions the Government is also providing up to $940 million per fortnight to support businesses through the challenging period, particularly those in Auckland,” said NZ Herald.
“A new $120m fund has also been established to help lift Māori vaccination rates,” the news adds.
While red, orange and green tags term the measures are “traffic light”, some additional details are as follows:
- Vaccination passports - to visit bars and visit close business settings, you will need to be vaccinated.
- Highly targeted and localized lockdowns may be used if needed.
- First step is with high vaccination rates, target is 90% full vaccinated for each DHB in NZ.
- Auckland will move into the red setting as soon as all three DHBs (District Health Boards) hit the 90 percent fully vaccination target.
Read: NZD/USD bears step in and heavy daily candle expected to contain the bulls
- AUD/USD remains pressured after reversing from a three-month high.
- Fed tapering chatters, fears of higher inflation propelled US Treasury yields, RBA's Lowe cited inflation woes as well.
- China-led risk-off also underpins US dollar’s safe-haven demand.
- Preliminary PMIs for October are eyed for fresh impulse, risk catalysts are the key.
AUD/USD holds lower ground near 0.7460, following the U-turn from a multi-day high to end-up marking the heaviest daily fall in October. That said, the quote seesaws inside a choppy range as traders await fresh clues during early Friday morning in Asia.
The US Federal Reserve’s (Fed) “transitory” tag for inflation joins the European Central Bank’s (ECB) woes that the reflation wave is in for a strong run to renew rate hike calls and underpinned the Treasury yields, which in turn recalled the US dollar bulls. Also, sentiment-negative headlines from China weighed on the commodities and antipodeans, exerting an additional burden on the AUD/USD prices.
Federal Reserve Governor Christopher Waller said on Thursday that the next few months will be critical to see whether inflation is transitory, as reported by Reuters. On the same line, European Central Bank (ECB) Governing Council member Ignazio Visco said on Thursday that supply bottlenecks are starting to weigh on the Italian economy and added that they could last for longer than expected, per Reuters. At home, the RBA Governor Philip Lowe also spoke for inflation fears as Reuters reports, "The Reserve Bank of Australia is closely watching a spike in inflation, with Governor Philip Lowe saying on Friday he did not think the rise would be sustained unless it led to sustainably higher wages growth."
Elsewhere, China’s Evergrande managed to get an extension on a defaulted $260 million bond but the global rating giant Fitch cites property stress from Beijing to join the macro policy trade-off risks. The troubled real-estate firm also failed to seal an asset sale deal with Hopson and flashed another red signal to the investors Further, power cuts in China remain as the key problem for the world’s biggest industrial player even as the government restarts some of the coal mines to battles energy shortages.
Talking about data, Aussie NAB Business Confidence dropped to -1 from 17 in Q3 while US Philadelphia Fed Manufacturing Survey data also softened to 23.8 versus 25 expected and 30.7 prior. Additionally, US weekly Initial Jobless Claims weakened to 290K but the Existing Home Sales rose 7.0% versus a prior contraction of 2.0%.
Amid these plays, equity bulls stalled and the US 10-year Treasury yields jump to a fresh high since early April, helping the US Dollar Index (DXY) to snap a six-day downtrend despite renewing a three-week low earlier on Thursday.
Looking forward, headlines concerning inflation and China will be hot to direct short-term AUD/USD moves ahead of the preliminary activity numbers for October from the US. Should the PMIs arrive as stronger, the reflation fears can exert additional downside pressure on the quote.
Technical analysis
AUD/USD bulls got a rejection from a nearly seven-month-old horizontal resistance area surrounding 0.7530-35 amid overbought RSI conditions. The following weakness also broke multiple supports established since June near 0.7480-75. Even so, bears remain cautious until the quote stays beyond the monthly support line near 0.7420. Meanwhile, an upside clearance of 0.7535 will escalate the north-run towards late June’s peak of 0.7617.
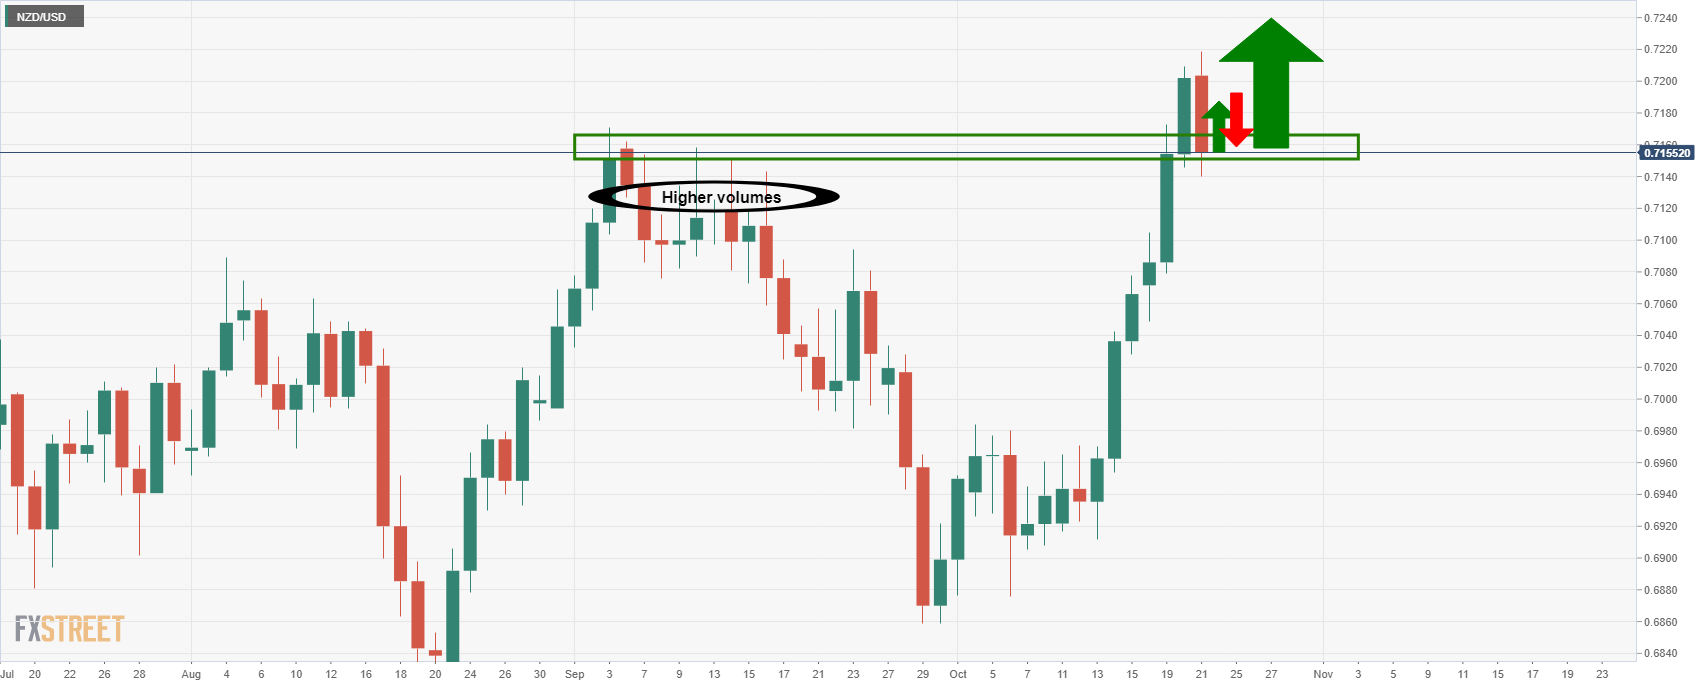
- NZD/USD bulls taking profits ahead of the weekend.
- The correction is strong and could keep the kiwi down for days to come ahead of next major data release.
- RBNZ is price sin for a 25bp hike, risk is if bank does more.
NZD/USD is trading around -6% lower on the day after falling in a short correction from a high of 0.7218 to a low of 0.7140. The US dollar is little changed but US yields have moved higher again in the bullish cycle and from a technical perspective, there could be more upside to follow shortly.
Meanwhile, the focus has been on the inflation for New Zealand with the Q3 CPI inflation data arriving at a much faster than expected 4.9% YoY has been the trigger for the latest spate of fears around RBNZ policy. As it is, the money market is fully priced for a 25 bps move before the end of this year and partly priced for a more significant amount of tightening. The market is assuming that a 25 bps rate hike is a done deal.
''This implies that the key element for markets in the coming weeks surrounds the risk of a larger move,'' analysts at Rabobank argued. ''The release of New Zealand’s Q3 labour data on November 2 will be watched closely in particular for any signs of a pick-up in wage inflation. Also key in the coming weeks will be the decision by the government regarding the loosening of lockdown restrictions in Auckland.''
US yields in focus
Meanwhile, market-implied expectations for US inflation for the next five years have surged to the highest in 15 years as measured by breakevens, Bloomberg reported.
US yields on Thursday have indeed moved higher on Thursday with the 10-year printing a fresh 1.682% high on the approach to the March highs of 1.774% from a technical perspective:
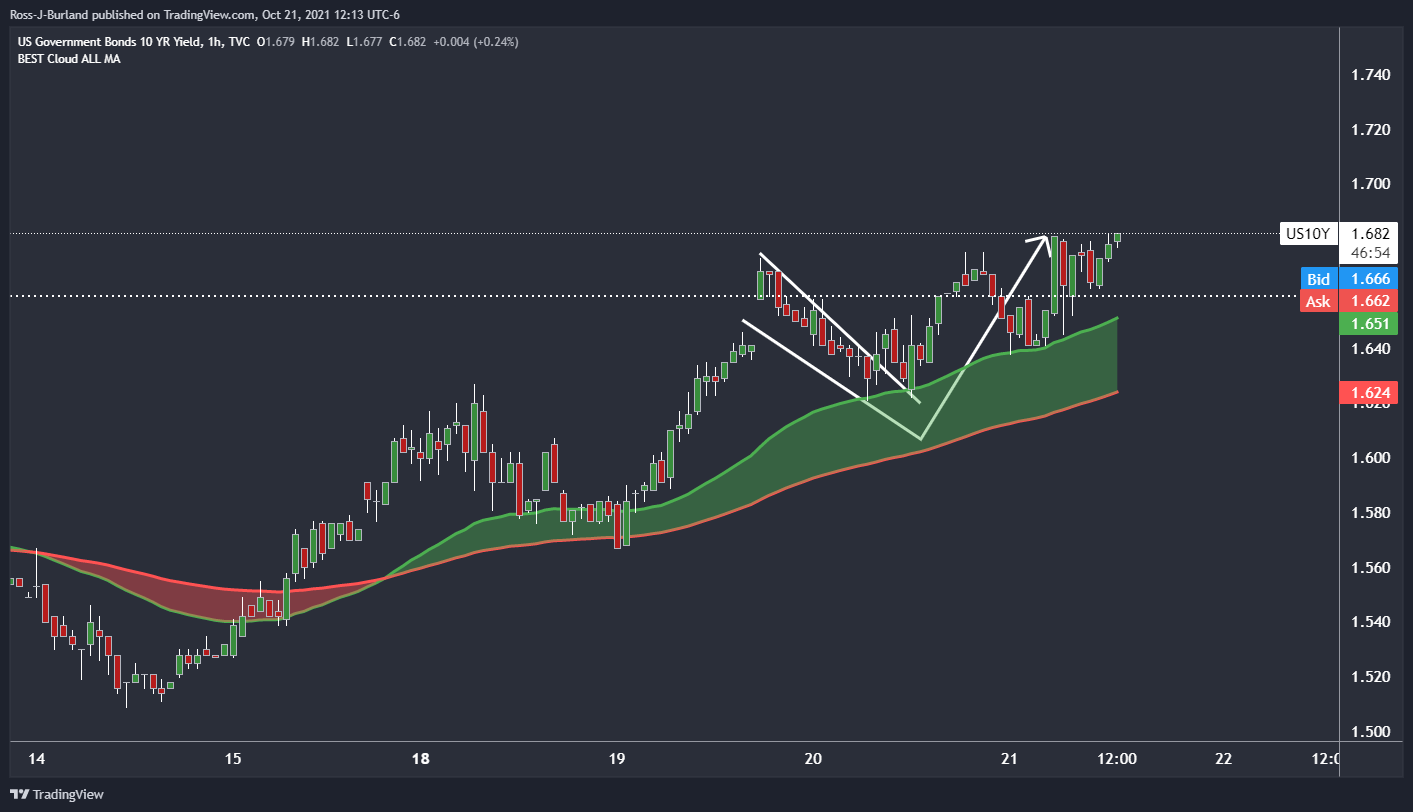
From a daily perspective, there are prospects of a move beyond the daily highs towards a -272% Fibonacci retracement of the current daily flag's range:

Looking forward, analysts at ANZ Bank still think the NZD will benefit from higher interest rates, affirming both carry and confidence in the Reserve Bank of New Zealand’s inflation credentials. ''Amid rising global inflation, it’s logical that the NZD should strengthen, softening the blow,'' the analysts added.
NZD/USD technical analysis
''The Kiwi is about 3/4 of a cent off yesterday’s peak, having experienced the biggest correction since the current rally started just over a week ago,'' analysts at ANZ Bank explained.''
''At this stage, it looks more like a rebalancing rather than the start of a fresh downtrend.''
The price is meeting an area of strong support and high volumes there and below which could equate to a move to the upside if it holds. However, the corrective candle is very strong so the momentum could give the price pinged to the floor especially as the weekend approaches.
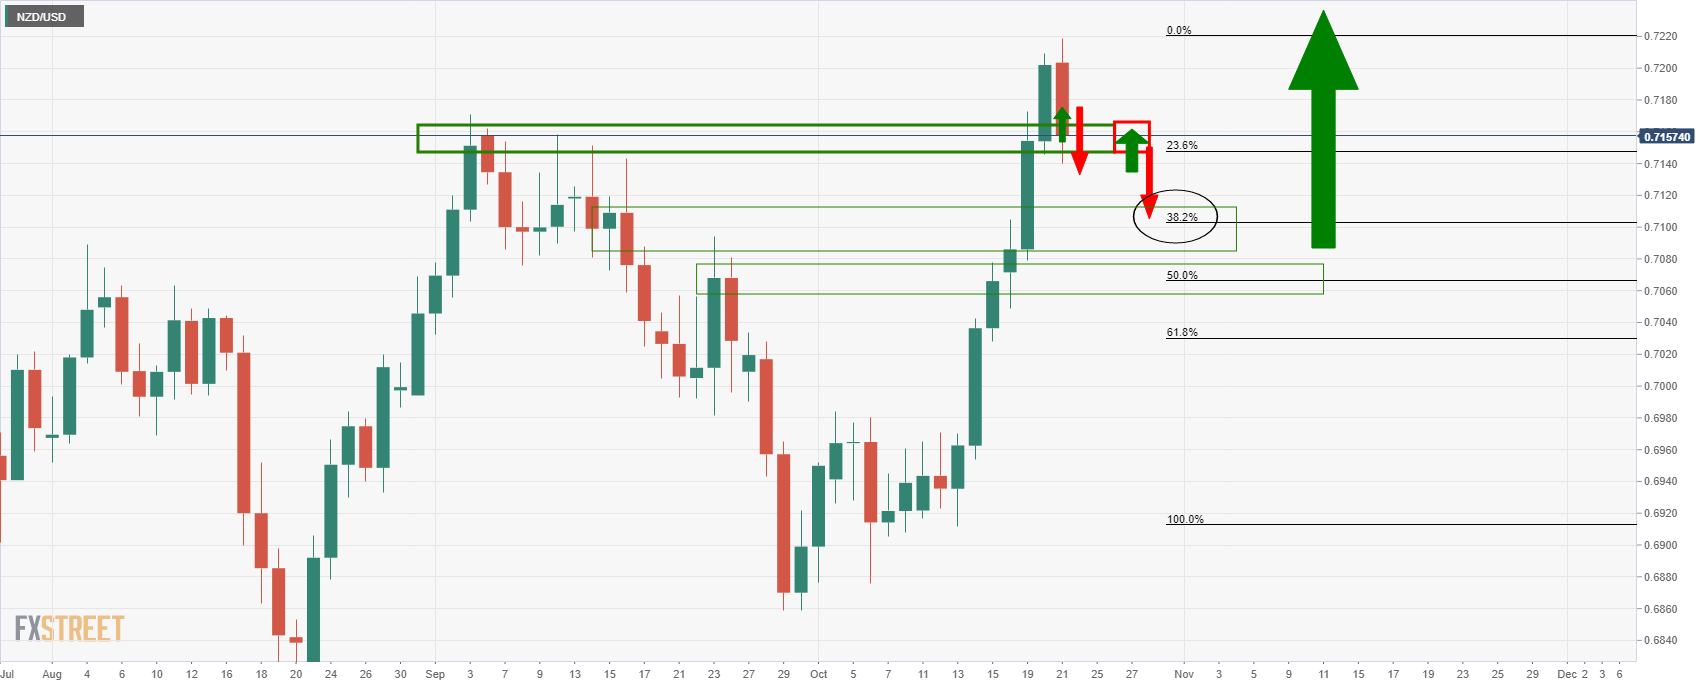
If the support breaks, the price could easily move through the volumes to reach at least 38.2% Fibonacci retracement of the bullish impulse. This will be the last defence for the 50% mean reversion target.
- The US Dollar is firmly up on the back of inflation concerns.
- US Initial Jobless Claims drop for the second-consecutive week, at 290K.
- GBP/USD: Will finish the year around 1.3800 – Scotiabank.
The British pound extends its slide below 1.3800 during the New York session, losses 0.26%, trading at 1.3788 at the time of writing. As portrayed by US stocks indices rising between 0.19% and 0.58%, the market mood has slightly improved, except for the Dow Jones Industrial, dropping 0.12%.
DXY recovers from early week losses
The US Dollar Index, which measures the greenback’s performance against a basket of six peers, advances firmly 0.17%, currently at 93.722, uplifted by higher US T-bond yields, which rallied on the expectations that high inflation in the country, might force the Federal Reserve to react, hiking interest rates, sooner than later.
Meanwhile, the US 10-year Treasury yield climbs four basis points, sitting at 1.677% at press time.
On the macroeconomic front, in the UK, the Public Sector Net Borrowing for September, at £21.014B, was lower than the £27.152B expected
On the US economic docket, US data was mixed. Weekly jobless claims have dropped to their lowest levels in 19 months and existing home sales increased 7.0% to 6.29 million in September, the highest reading since January. Contrarily, the Philadelphia Fed Manufacturing survey slid to 23.8 from 30.7 in the previous month.
GBP/USD: Will finish the year around 1.3800 – Scotiabank
The FX Analysis team at Scotiabank expects the pair to end the year around 1.3800:
“The GBP remains well supported by hawkish BoE expectations that should prevent sustained declines under 1.36, but we think there is likely more downside than upside risk to market expectations for BoE tightening as already over 100bps in hikes are priced in between now and end-2022.”
“We think the GBP/USD will struggle to make a push toward a test of 1.40 despite the high probability of at least one hike shortly and think it more likely that the pound closes the year near the 1.38 level.”
What you need to know on Friday, October 22:
Risk turned off on Thursday, with the dollar making the most out of it. The American currency appreciated against most major rivals, except safe-haven CHF and JPY. There was no particular catalyst behind the dismal sentiment, although renewed inflation concerns may be part of it. The closely watched 10-year US Treasury yield hit yet another multi-month high of 1.683%, finishing the day around 1.67%.
The EUR/USD pair pulled lower and trades near a critical Fibonacci support level at 1.1615. GBP/USD failed once again around 1.3830, and settled in the 1.3780 price zone. AUD/USD retreated from a fresh 3-monht high and settled around 0.7460, while USD/CAD bounced to the 1.2370 price zone.
Gold finished the day pretty much unchanged around $ 1782 a troy ounce, while crude oil prices plunged after hitting three-year highs. A forecast for a warmer winter in the US offset supply concerns. WTI settled at $82.50 a barrel.
The US Federal Reserve banned stock trading and restricted other investing activities by top officials. The movement came after chair Jerome Powell sold up to $5 million worth of stock from his personal account in early October.
European and Asian indexes closed mostly in the red, although Wall Street managed to recover ahead of the close, with US indexes ended the day mixed.
Friday will bring the preliminary estimates of October PMIs for most major economies.
Dogecoin remains the king of all memecoins as analysts expect DOGE to resume its bull run
Like this article? Help us with some feedback by answering this survey:
- The Dow Jones Industrial Average is down 0.17% to 35,442.5.
- The S&P 500 is just shy of a record close Wednesday. The Nasdaq rose 0.5%.
- US yields are making fresh cycle highs with more to come.
US stocks are on Thursday while government bond yields have touched a fresh five-month high after initial jobless claims fell to their latest low since the start of the pandemic.
The Dow Jones Industrial Average is down 0.17% to 35,442.53 the low on the day after setting an intraday high, while the S&P 500 added 0.18% after six straight gains that left it just shy of a record close Wednesday. The Nasdaq rose 0.5%. The S&P 500 posted 51 new 52-week highs and no new lows; the Nasdaq Composite recorded 93 new highs and 33 new lows. Consumer discretionary shares have fared best so far, while materials and energy lagged.
Seven of the 11 major S&P 500 sectors were trading lower, with energy stocks declining the most. Consumer discretionary was the biggest percentage gainer among the S&P sectors so far, with help from Amazon.com Inc. Meanwhile, analysts are expecting S&P 500 third-quarter earnings to rise 33.7% year-on-year, according to Refinitiv.
In the economic calendar, Initial jobless claims fell to 290,000 in the US during the week ended Oct. 16 from an upwardly revised 296,000 in the previous week. The four-week moving average fell by 15,250 to 319,750, a new low since the start of the COVID-19 pandemic. In other data, the US existing home sales climbed 7% in September to a seasonally adjusted annual rate of 6.29 million from 5.88 million in August, exceeding expectations for a rise to 6.1 million.
Meanwhile, market-implied expectations for US inflation for the next five years have surged to the highest in 15 years as measured by breakevens, Bloomberg reported.
US yields on Thursday have indeed moved higher on Thursday with the 10-year printing a fresh 1.682% high on the approach to the March highs of 1.774% from a technical perspective:
From a daily perspective, there are prospects of a move beyond the daily highs towards a -272% Fibonacci retracement of the current daily flag's range:
S&P 500 technical analysis
-637704399854184329.png)
The S&P 500 is a compelling technical picture given the counter-trendline and combination of the W-formation. Both are bearish as the counter-trendline would be expected to act as resistance on a restest and the W-formaiton is a reversion pattern. The price would be expected to test the neckline of the W-formation at 4,483 following a restest of the counter trendline.
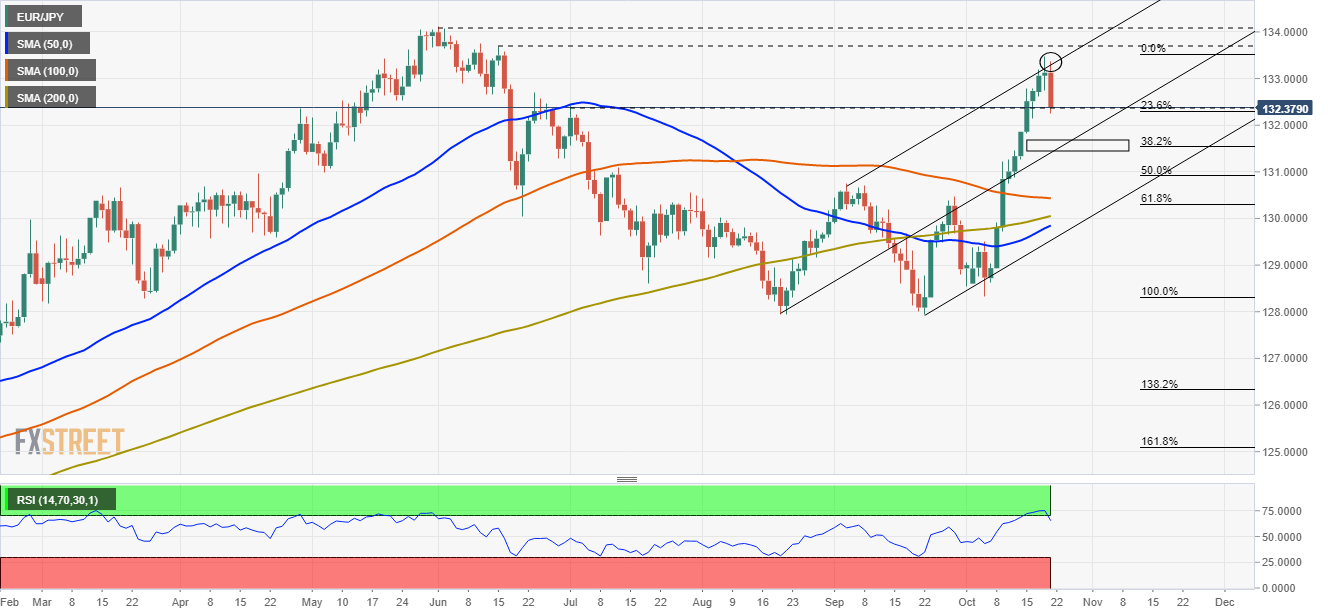
- EUR/JPY breaks below 133.00 amid risk-off market due to US high inflation concerns.
- EUR/JPY: Stall at a confluence of a previous daily high and a Pitchfork’s top-line, in line with a correction move.
- EUR/JPY: A move towards the critical support area around 131.50 is on the books.
The EUR/JPY declines during the New York session, down 0.56%, trading at 132.38 at the time of writing.
The market sentiment is dismal, as portrayed by falling US stock indices falling between 0.06% and 0.41%, except the Nasdaq Composite, which rises 0.27%. Meanwhile, the US T-bond 10-year benchmark coupon rallies almost five basis points, sitting at 1.681%, the highest level since March 2021. The market seems convinced that high inflation will force the Federal Reserve to act faster than expected.
EUR/JPY Price Forecast: Technical outlook
Daily chart
The daily chart depicts the cross-currency stalled at 133.37, briefly up of the Andrew’s Pitchfork indicator top-line, retreating the upside move, testing the July 1 high at 132.43, which was previous resistance, turned support. Nevertheless, despite the abovementioned, the EUR/JPY has an upward bias confirmed by the daily moving averages (DMA’s) remaining below the spot price.
A Thursday daily close below 132.43 could spur a move towards the confluence of the 38.2% Fibonacci retracement with the mid-line of Andrew’s Pîtchfork indicator around the 131.55 area, which could find dip-buyers, as the confluence of two indicators would exert upward pressure around the area. However, in the outcome of breaking lower, a dip towards the 50% Fibonacci retracement at 130.93 is on the books before resuming the upward move.
The Relative Strength Index (RSI), a momentum indicator, is at 65, aiming lower, suggesting that a correction might be underway before turning north in line with the prevalent trend.
- The euro dips further end hits session lows near 1.1600.
- The USD firms up on inflation fears.
- EUR/USD is expected to return below 1.1600 – Scotiabank.
The euro has extended its reversal from week-highs at 1.1665 to hit fresh session lows at 1.1600 during Thursday's late US session. The pair is giving away gains, after a three-day rally, weighed by higher demand for USD amid a sourer market sentiment.
The US dollar picks up on inflation concerns
The common currency has been trading on a soft tone as the risk rally witnessed on previous days faded. Quarterly earnings have failed to lift spirits and concerns about the surging inflation and supply chain disruptions have returned to the spotlight, boosting demand for safe assets against riskier currencies like the euro.
Furthermore, US T-Bond yields have resumed their rally, with the US benchmark 10-year note hitting 4-month highs at 1.68%. The market is assuming that the persistently high inflation will force the Federal Reserve to accelerate its monetary policy normalization plan, which has provided additional support to the greenback.
On the macroeconomic front, US data has been mixed. Weekly jobless claims have dropped to their lowest levels in 19 months and existing home sales increased 7.0% to 6.29 million in September, the highest reading since January. On the other hand, The Philadelphia Fed Manufacturing survey dropped to 23.8 from 30.7 in the previous month.
EUR/USD: Seen returning below 1.1600 – Scotiabank
The FX Analysis team at Scotiabank, e3xpects the pair to decline further on Friday, to end the week below 1.1600: “Friday’s release of preliminary PMIs in the eurozone that will likely reflect the impact of high energy prices in the region. However, with the hit to manufacturing generally expected, only a large data miss could see the EUR/USD fall under the key 1.16 level. (…) The intraday low of ~1.1635 is support followed by 1.1600/15. Resistance is 1.1665/85.”
Technical levels to watch
A broad set of other restrictions on the investing activities of Federal Reserve officials has been implemented by the US Federal Reserve on Thursday that has banned individual stock purchases. This follows reports from around six weeks ago of active trading by some senior policymakers triggered an ethics uproar, Reuters reported.
''The new rules will limit the types of financial securities the Fed’s top officials can own, including an outright ban on purchases of individual stocks or holding individual bonds. It also requires advance notice and approval of any transactions, and stipulates investments be held for at least a year.''
“These tough new rules raise the bar high in order to assure the public we serve that all of our senior officials maintain a single-minded focus on the public mission of the Federal Reserve,” Federal Reserve Board Chair Jerome Powell said a statement.
Market implications
While not necessarily impactful, the new rules come after two of the 12 regional Federal Reserve bank presidents resigned after reports of their active trading during 2020.
- The US dollar bounces up from 0.9170 and approaches 0.9200 area.
- The Swiss franc appreciates as market sentiment sours.
- USD/CHF: Below 0.9215, further corrective weakness is likely– Credit Suisse.
The US dollar is attempting to set a bottom at 0.9170 five-week lows on the late US trading session. The pair has pared previous losses, returning to 0.9185 and trading nearly flat on daily charts.
Risk aversion buoys the Swiss franc
The Swiss Franc appreciated earlier today, favored by the adverse market sentiment. Unlike previous sessions, quarterly earnings have failed to distract the market from the risks of surging inflation pressures and supply chain bottlenecks, which has reflected in higher demand for safe havens like the Swiss franc and the Japanese yen.
Macroeconomic data has been unable to lift the greenback, with releases from the US sending mixed signals. On the one hand, weekly jobless claims have declined against expectations, to reach 19-month lows, and existing home sales increased 7% to 6.29 million in September, the highest level since January. The Philadelphia Fed Manufacturing index, however, deteriorated in September, due, in part to supply shortages.
USD/CHF: Confirmation below 0.9215 would increase bearish pressure – Credit Suisse
From a technical perspective, the FX Analysis team at Credit Suisse points out to key support at 0.9215: “Whilst our core outlook stays bullish, we cannot rule out further corrective weakness whilst below 0.9274 and more important support if the market does manage to close below 0.9214 is at the 200-day average at 0.9139, which is expected to hold if reached.”
Technical levels to watch
- Gold is firmly bid and riding weekly dynamic trendline support.
- Inflation concerns are being weighed by investors and priced into the markets.
- US dollar finding support on rising US yields and prospects of higher highs.
The price of gold on Thursday remains in familiar ranges, consolidated in the region of $1.780 and supported as investors weigh the probabilities of the Federal Reserve tapering and the likely hood of earlier than first anticipated rate hikes from the US central bank. At the time of writing, XAU/USD is trading at $1,779.81 and has travelled in a narrow range between $1,776.55 and $1,789.46.
US 10-yields in focus
In prior analysis, it was explained the 10-year US yields were on the verge of a break higher: ''...they could be about to surge to the upside from a technical perspective as the yield spikes from the 21-50 hour SMMA cloud.''
Prior analysis:
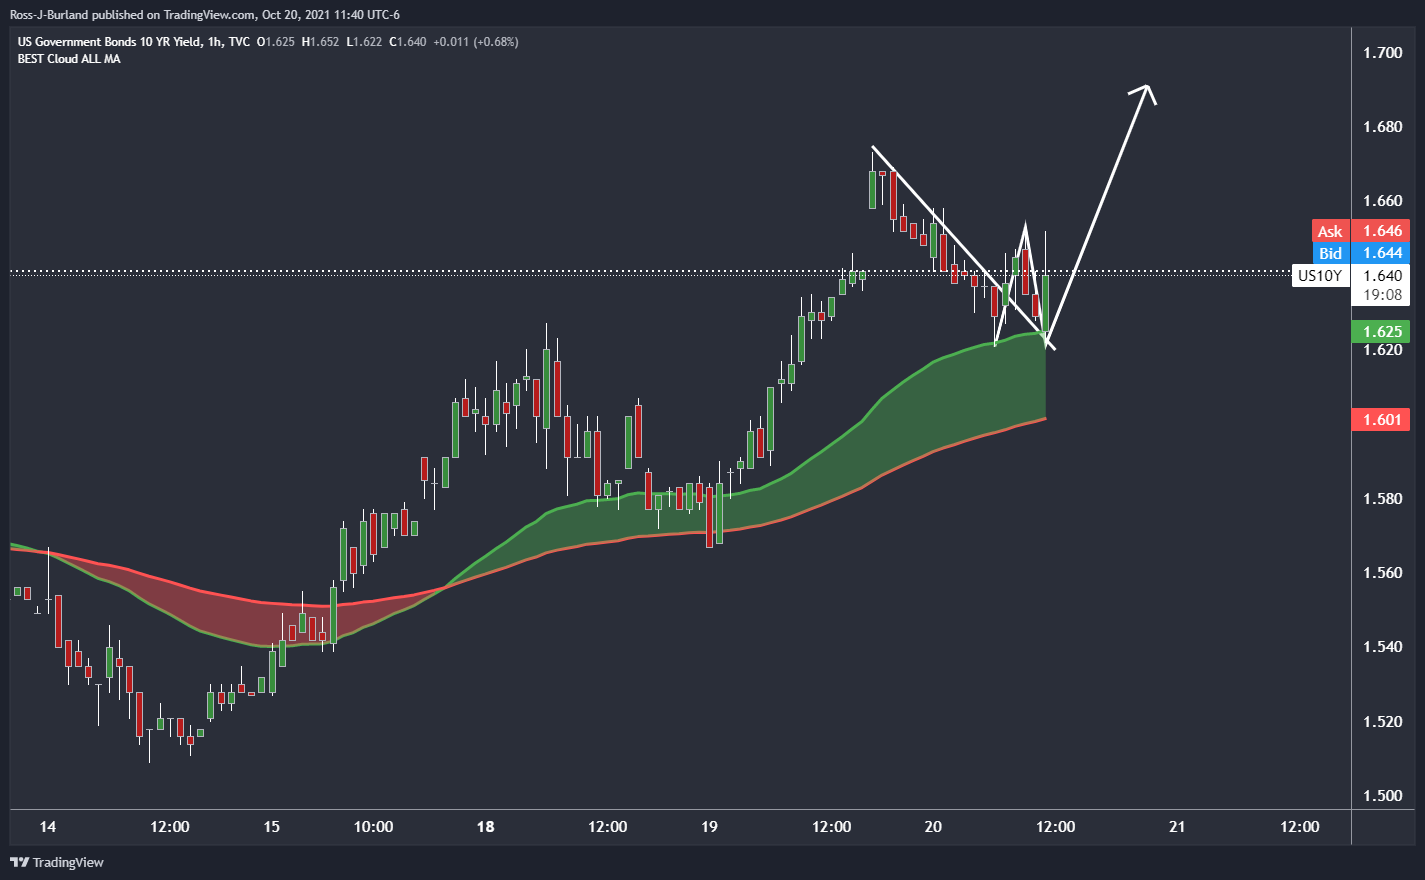
US yields on Thursday have indeed moved higher on Thursday with the 10-year printing a fresh 1.682% high on the approach to the March highs of 1.774% from a technical perspective:
From a daily perspective, there are prospects of a move beyond the daily highs towards a -272% Fibonacci retracement of the current daily flag's range:
In turn, the US dollar is finding support and the combination of prospects of the Federal Reserve raising rates sooner for fear of prolonged and sticky inflation is proving to be a headwind for gold prices.
US dollar on tenterhooks
The US dollar index was 0.15% higher at the time of writing around the highs of the day at 93.72 and holding nicely above Tuesday's three-week low of 93.501. However, it has declined 1.1% from a 15-month peak that hit last week. Expectations that the Fed could soon scale back pandemic-era stimulus has underpinned the dollar over the past few months. However, in recent times, other central banks have been sounding the inflation alarms.
Central banks, such as the Bank of England and the Reserve Bank of New Zealand, are seemingly about to put peddle to the metal and deal with inflation headwinds by raising rates, jumping the queue in front of the Fed. This has given rise to strength elsewhere and enabled precious metals to advance over the past couple of weeks.
Moreover, the Federal Reserve, while widely expected to announce the tapering of its bond purchase at a policy meeting in early November, it is expected to distance itself from future rate hikes for now. Money markets are pricing in just one US rate hike in 2022 after the Fed is expected to have finished its tapering process in the middle of next year.
''While gold prices remain relatively range-bound, they are facing tremendous pressure as market pricing for Fed hikes continue to firm into 2022,'' analysts at TD Securities said. ''Yet, we argue that market pricing for Fed hikes remains far too hawkish, as it fails to consider that a rise in inflation tied to a potential energy shock and lingering supply chain shortages would be unlikely to elicit a Fed response,'' the analysts argued.
''The market is increasingly pricing in a policy mistake which is unlikely to take place, considering that central banks are likely to look past these disruptions as their reaction functions have been historically more correlated to growth than inflation. Reasons to own the yellow metal are growing more compelling as Fed pricing is likely to unwind.''
Gold technical analysis
For an in-depth technical analysis of gold, see here: Gold Chart of the Week: XAU hit the $1,800 target, now what?
The price rides the dynamic trendline support towards the resistance as illustrated below. However, a move beyond $1,800 is required if the bulls are going to take charge again, or otherwise, a break below the trendline support and then $1,750 will open the risk of a downside continuation.
This can be illustrated better from a weekly perspective, as follows:
The price has met a 61.8% Fibonacci retracement of the prior bearish impulse but stays bid for another attempt.
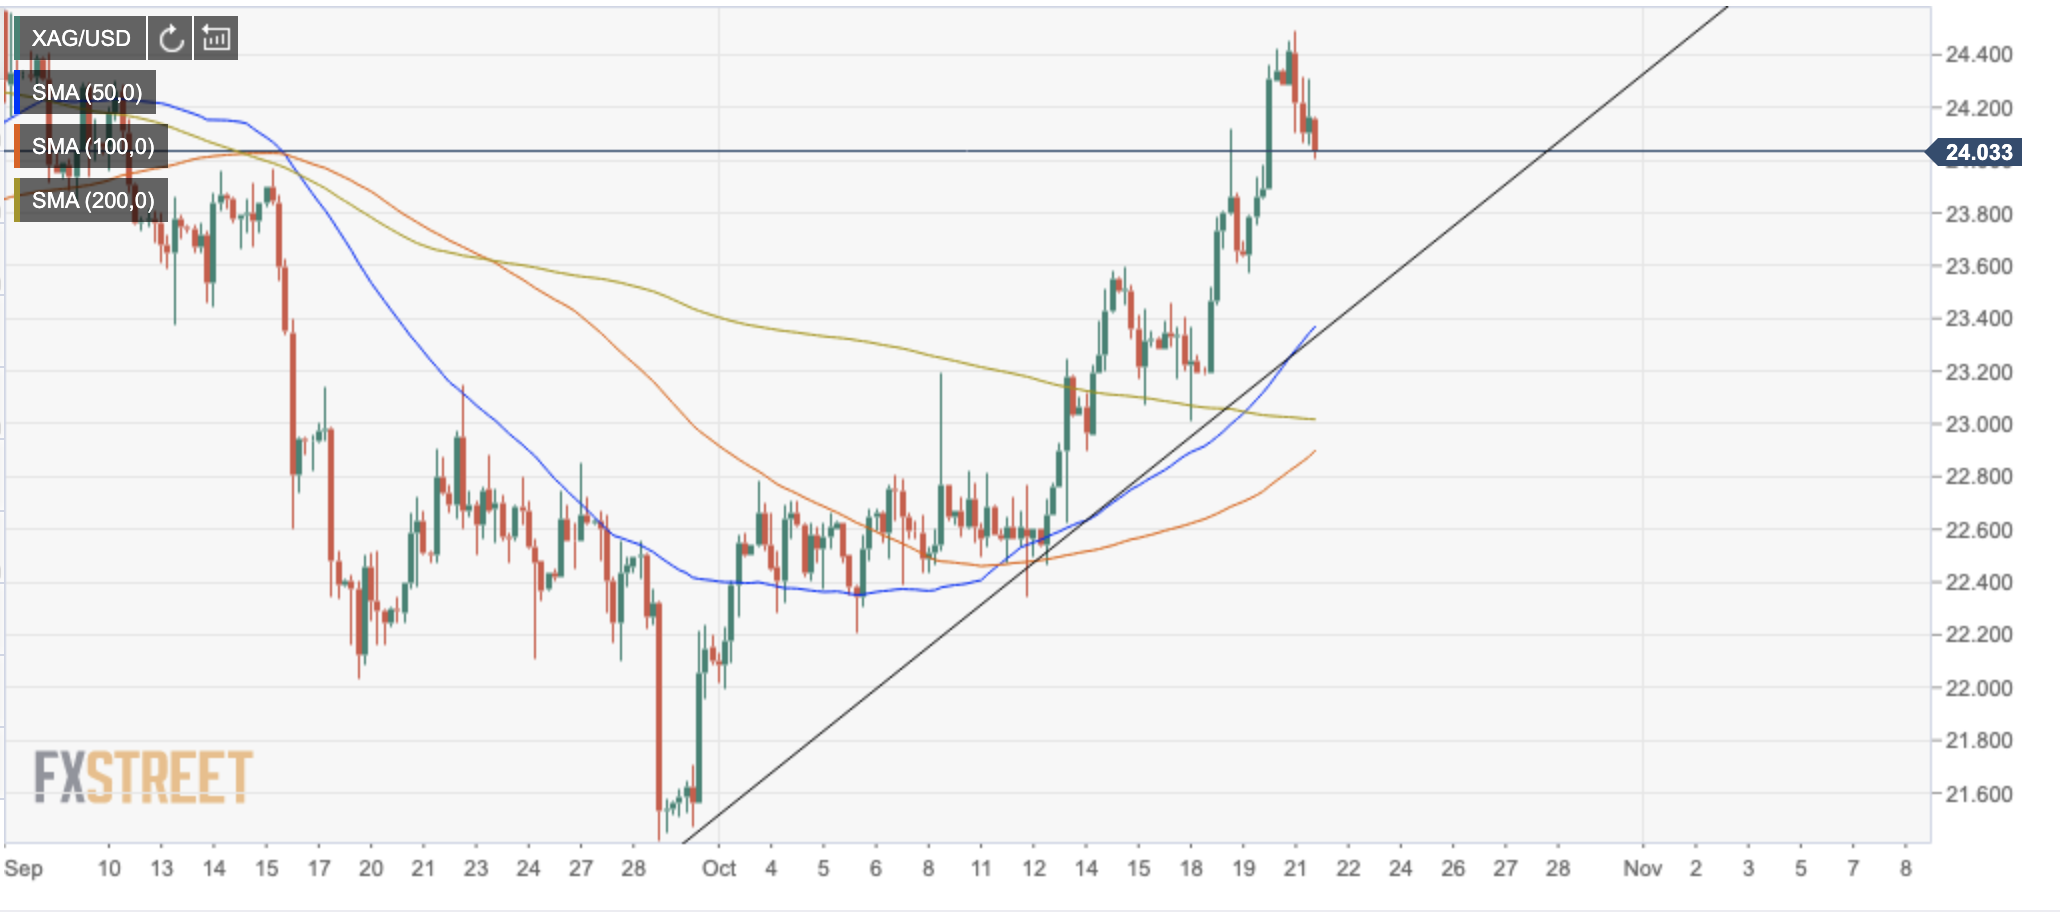
- Silver retreats from $24,50 highs and tests support at $24.00 area.
- Precious metals dip with the USD picking up on inflation concerns.
- XAG/USD remains positive while above $23.40.
Silver futures are testing support at $24.00 after pulling back from six-week highs near $.24.50 weighed by a stronger US dollar with the risk rally coming to an end.
Metal prices pull back on inflation fears
Precious metals are trading lower on Friday, as higher inflation pressures have returned to the market, pushing US Treasury bond yields higher and ultimately buoying demand for the US dollar.
The US benchmark 10-year bond yield has edged up to fresh 4-month highs at 1.68% on Thursday, with the investors assuming that the persistently high inflation will force the Federal Reserve to accelerate its monetary policy normalization plan.
The US Dollar Index, which measures the value of the dollar against a basket of the most traded currencies, has edged up about 0.2% today, following a five-day decline from year-to-date highs at 94.54.
XAG/USD: remains positive while above $23.40
In a broader view, silver futures remain positive while above $23.40, where trendline support from late-September lows and the 50-period SMA meet. Below here, the next potential targets might be $23.00 (October 18 low), and 22.20/35 (October 6 and 12 lows).
On the upside, a bullish reaction past $24.45 (Intra-day high) would open the path towards early September highs at $24.80 and $25.20 (August 3, 4 lows).
XAG/USD 4-hour chart
Technical levels to watch
- The market sentiment is downbeat as riskier assets weaken against the US dollar safe-haven status.
- AUD/USD falls on higher US T-bond yields, showing investors seem convinced that rising inflation will force the Fed to act fast.
- AUD/USD: Will dip towards support at 0.7427 and 0.7338 – Commerzbank.
The AUD/USD slides for the first time on the week, down 0.65%, trading at 0.7467 during the New York session at the time of writing.
The pair retreated from the 200-day moving average at around 0.7545 due to an adverse market sentiment surrounding the financial markets, triggered by the Chinese real-estate giant Evergrande, which dented investors’ market appetite for riskier assets.
Furthermore, the US 10-year Treasury yield advances four basis points, sits at 1.674%, just short of 2021 high, provides additional support to the greenback. The market seems convinced that rising inflation will force the Fed to act faster than expected, despite how vocal have Fed policymakers have been lately.
In the meantime, the US Dollar Index, which tracks the greenback’s performance against six rivals, rises a decent 0.06%, currently, at 93.66, weighing on the AUD/USD.
US Initial Jobless Claims fell more than expected, showing an improvement in the labor market
On the macroeconomic front, the Australian economic docket was absent.
On the US front, the Initial Jobless Claims for the week ending on October 16 fell to 290,000, better than the 300,000 estimated by analysts, showing that the labor market is resilient, as it is starting to accelerate the pace moderately. Moreover, the 4-week moving average decreased by 122,000, to sit at 2,481,000 in the week ending on October 9.
AUD/USD Price Forecast: To dip towards support at 0.7427 and 0.7338 – Commerzbank
According to Karen Jones, Team Head FICC, an analyst at Commerzbank said: “AUD/USD’s rally has reached the 55-week ma at 0.7516, above here lies the 200-day ma 0.7565. We would expect to see some profit taking in this vicinity (…) Very near term, we would allow for a small retracement.”
Further added, “Dips should find interim support at 0.7427 the 4th August high and 0.7338 (20-day ma), and this guards the 29th September low at 0.7171.”
- The sterling retreats from 158.20 to test levels below 157.00.
- The yen appreciates on risk aversion.
- GBP/USD: Heading towards 163.91 while above 156.60 – Credit Suisse.
The British pound has given away all the ground taken over the last two days, against a stronger JPY, favored by a deteriorated market sentiment. The pair has pulled back from multi-year highs at 158.20 to test prices right below 157.00
The yen appreciates on risk aversion
The risk-sensitive sterling remains sold on Thursday, with the yen building up as the investors run to safe assets. With US corporate earnings failing to extend the positive mood witnessed on previous days, concerns about supply chain disruptions and the timing of the Fed’s monetary policy normalization have returned to the limelight.
US stock markets are trading mixed on Thursday. The Dow Jones and the S&P 500 indexes are 0.4% and 0.36% down respectively while the Nasdaq Index appreciates 0.38%. Disappointing quarterly earnings from the technological firm IBM have dampened sentiment and fuelling demand for the safe-haven yen.
On the macroeconomic docket, in absence of key releases in the UK and Japan, better than expected US weekly jobless claims and the strong US home sales figures have been offset by the downbeat Philadelphia Fed Manufacturing Survey, which has reactivated concerns about the economic impact of supply bottlenecks.
GBP/JPY: Heading to 163.91 while above 156.60 – Credit Suisse
From a technical perspective, the FX Analysis team at Credit Suisse maintains their positive bias while support at 156.60 holds: “With a major base already established in February 2021, we look for a move to next resistance at 159.80, then 163.91 (…) The broken 156.62/06 highs should now floor the market over the medium-term.”
Technical levels to watch
- WTI falls almost $3 due to an optimistic weather announcement by the National Oceanic and Atmospheric Administration.
- Beijing’s signal to intervene in the coal market added further pressure on crude oil prices.
- Bank of America and Iraq oil minister, see crude oil topping at $100.00 by the first half of 2022.
Western Texas Intermediate (WTI) falls around 2.57% during the New York session, trading at $81.26 at the time of writing. Mixed market sentiment surrounds the financial markets due to Evergrande’s woes once again on the headlines, weaker than expected IBM earnings, and inflationary pressures.
US crude oil benchmark WTI retreated from the 2021 high at $86.00 on the back of an announcement by the National Oceanic and Atmospheric Administration. According to Reuters, the report said that “winter weather in much of the US is expected to be warmer than average.”
Furthermore, in China, coal prices fell 11%, as Beijing signaled that it might intervene to cool the market, which also exerted downward pressure on the black gold.
Despite the fall in oil prices, the Iraq oil minister Ihsan Abdul Jabbar said that crude prices could hit the triple digits for the first time since 2014, in the first six months of 2022. Additionally, Bank of America said that the energy crisis could propel oil prices above $100, according to Bloomberg.
WTI Price Forecast: Technical outlook
Daily chart
WTI is tilted to the upside, as depicted by the daily moving averages well below the price. However, the Relative Strength Index (RSI) at 64 exiting from overbought levels spurred a violent correction of $3 from the 2021 top.
Wednesday low at $80.77 is the first support, but a daily close below the latter could trigger a correction before resuming the upward trend in crude oil prices. In that outcome, WTI could slide to the October 13 low at $79.40, which is the first demand zone. If that level is broken, would leave the July 6 high at $77.00 as the next place to “buy the dip.”
- The New Zealand dollar closes a six-day rally, pulling back from 0.7215
- The USD picks up, favored by a moderate risk aversion.
NZD/USD: Upside bias remains positive while above 0.7160/70.
The New Zealand dollar is about to put an end to a six-day rally against its American counterpart, weighed by a weaker sentiment. The pair has retreated from four-month lows at 0.7215 and is looking for support above previous highs at 0.7160/70.
Risk aversion weighs on the kiwi
The NZD/USD is losing momentum on the back of sourer market sentiment on Thursday as the optimism triggered by the upbeat earnings reports released earlier this week, has faded. Wall Street is trading mixed following disappointing earnings data by the technological firm IBM which has revived concerns about supply chain disruptions.
Beyond that, ongoing concerns about Evergrande’s crisis in China extending into the country’s property sector are keeping demand for the risk-sensitive kiwi restrained. The threat of a deeper liquidity crisis continues gripping the sector; with news about more defaults popping up which is triggering declines on the bonds of most companies of the sector.
NZD/USD: Support art 0.7160/70 maintains the positive bias intact
From a technical perspective, the pair remains strong while above 0.7160/70 (September 3, 10 high). Below there, a further retreat below the 200-day SMA, at 0.7090 area would increase negative pressure and might send the pair to test the psychological level at 0.7000.
On the upside, immediate resistance remains at 0.7220 (Intra-day high) and then 0.7240 (Jun. 7 high), which would clear the path towards 0.7315 (May 23 high).
Technical levels to watch
Analysts at Rabobank expect the European Central Bank (ECB) to keep its monetary policy on hold until December. According to them, October’s meeting will reflect the increased uncertainty surrounding inflation.
Key Quotes:
“The October meeting will probably pass without any policy changes. Nonetheless, the ECB may further steer expectations towards the December policy recalibration. In light of new inflation concerns, the market is now even pricing in a rate hike for 2022. The Council may want to reiterate that the recent inflation shocks have not changed their plans of a transition phase after the end of PEPP in order to keep financing conditions favourable.”
“Speaking of that transition phase, we do not expect to get any details on the design aspects that the ECB is exploring at next week’s meeting. The workshops in which the Council discusses the available options will likely not take place until next month. In the meantime, leaks or trial balloons can certainly expected. In fact, we have already seen a few.”
“With the ECB looking to keep its options open, that leaves the route of verbal intervention: the ECB needs to stress that it is taking a different stance than most other central banks, and that the Council continues to look through the current inflation surge.”
Growth has slowed down during the third quarter in China amid a number of headwinds, including regulatory storms, default risk of real estate giant, the electricity crunch and the authorities’ new campaign of “common prosperity” and social equality, points out the Research Department at BBVA.
Key Quotes:
“Economic structure remains unbalanced as the economy depends too much on exports while domestic consumption and investment keep lackluster.”
“Compared with high inflation pressure in US and the EU, China’s CPI is still at bay, with a weak pass-through effect from PPI to CPI.”
“Diverging with the QE Tapering in the advanced economies, China’s monetary policy will be more easing to deal with growth slowdown.”
“We lower our 2021 GDP prediction to 8% y/y from 8.2% previously; we also lower our 2022 GDP forecast from 5.5% to 5.2%.”
- The euro consolidates around 1.1640 after rejection at 1.1665.
- The pair loses steam as risk appetite wanes.
- EUR/USD: Failure at 1.1750 might send the pair down to 1.1495 – SocGen.
The euro has put an end to a three-day recovery and remains moving back and forth between 1.1630 and 1.1650, after pulling back from session highs at 1.1665 reached during Thursday’s Asian session.
A risk-off mood weighs on the euro
The pair is looking for direction, with the US dollar firming up and most stock markets trading in the red as the risk rally witnessed earlier this week has cooled. With inflation concerns back to the table, investors are looking for safety in the US dollar and the Japanese yen to the detriment of riskier currencies like the euro.
Corporate earnings, one of the main triggers of risk appetite over the last two days, have disappointed on Thursday, with the technological giant IBM posting weaker than expected quarterly results.
The macroeconomic calendar has been sending mixed signals on Thursday. US weekly jobless claims have dropped to their lowest levels in 19 months, with 296,000 new applicants last week, and existing home sales increased 7.0% to 6.29 Million in September, the best reading since January. On the other hand, The Philadelphia Fed Manufacturing survey dropped to 23.8 from 30.7 in the previous month in yet another evidence that supply chain disruptions are squeezing economic acivity.
EUR/USD: Failure at 1.1750 might send the pair down to 1.1495 – SocGen
According to the FX Analysis team at Société Générale, the pair should rise above 1.1750 to confirm recovery: “EUR/USD has staged a bounce from 1.1525 and could head towards a multi-month descending channel at 1.1750 (…) Failure to cross this can result in further pullback towards March 2020 peak of 1.1495/1.1450.”
Technical levels to watch
- US dollar strengthens versus commodity currencies as stocks and crude oil slide.
- USD/CAD extends gains during the American session, upside still seen as corrective.
The USD/CAD is rising on Thursday after posting on Wednesday the lowest daily close since early July. The pair bottomed at 1.2288 on Asian hours and then bounced to the upside. During the American session it printed a fresh daily high at 1.2353 and then pulled back to 1.2345.
The main trend in USD/CAD continues to point to the downside and the current move higher could be seen as corrective. The pair needs a daily close under 1.2300 to suggest bears are still in control.
The US dollar is holding onto daily gains across the board, except versus the Japanese yen. The DXY is up by 0.03%, ending a six-day negative streak. Higher US yields and a deterioration in market sentiment helped the greenback. The USD/CAD also finds support from a correction in crude oil prices. The WTI barrel is pulling back from multi-year highs, and trades under $81.00.
US economic data showed a decline in Initial Jobless Claims to the lowest since March 2020 below 300K. On the negative front, the Philly Fed retreated from 30.7 to 23.8 (consensus: 25). Existing Home Sales rebounded more than expected by 7% in September. Home prices rose 0.4% in September in Canada.
On Friday, preliminary Markit PMI is due in the US and in Canada the August retail sales report with preliminary numbers for September.
Technical levels
- GBP/USD stalls at 1.3838 for the third day in a row.
- Investors bets increase on a Bank of England hike rate by November’s meeting.
- US Initial Jobless Claims drop for the second-consecutive week, at 290K.
The British pound edges lower during the New York session, stalls around 1.3811, loses 0.09%, trading at 1.3817 at the time of writing.
The market sentiment is a mixed bag, depicted by falling European equity indices. At the same time, all US stock indices post moderated gains, except for the Dow Jones Industrial that is losing 0.24%, due to worse than expected IBM earnings. Furthermore, the oil rally stalled, while Evergrande’s worries surround the financial markets once more, as its shares plunged 11.6% after a $2.6 billion stake sell fell through, and the risk of a possible spillover remains. Safe-haven currencies like the US Dollar and the Japanese yen rose against most G8 currencies.
The US Dollar Index that tracks the greenback’s performance against a basket of six peers is up 0.02% at 93.62, while the US 10-year Treasury yield rallies four basis points, up to 1.673%, almost ten basis points short of 2021 high.
GBP/USD found a wall at 1.3838 for the third time in the week
The British pound stalled once again at the 1.3838 resistance for the third consecutive day. Investors bets on a Bank of England hiking rates had increased since October 9. Two policymakers expressed concerns about elevated prices, signaling that the BoE will step up and act to curb inflationary pressures.
However, despite what the UK’s central bank has been vocal about inflation, there are some variables that the BoE has to account for. COVID-19 cases are increasing, and with the furlough program coming to an end, some bank analysts and strategists are starting to become more neutral on the British pound, according to Bloomberg.
Moreover, the North Ireland protocol discussions between the UK and the Eurozone threaten to begin a trade war, severely hurting the UK economy.
On the macroeconomic front, in the UK, the Public Sector Net Borrowing for September, at £21.014B, was lower than the £27.152B expected
On the US economic docket, the Initial Jobless Claims for the week ending on October 16 fell to 290K, lower than the 300K foreseen by analysts, showing the labor market is starting to accelerate the pace moderately. Further, the 4-week moving average decreased by 122K, to sit at 2,481K in the week ending on October 9.
That said, the GBP/USD main driver would be the Bank of England decision, but also the Fed’s bond taper announcement and the market sentiment could hold back investors to open new positions in the pair.
- Yen among top performers on Thursday, recovers recent lost ground.
- USD/JPY down despite higher US bond yields.
- The rejection from above 114.00 suggests some upside exhaustion.
The USD/JPY is retreating on Thursday after hitting the highest level in years. Recently it dropped to 113.63, the lowest level in a week. The move lower took place even as US yields printed fresh monthly highs and amid a stronger dollar. The yen is among the top performers as US stocks trade mixed.
Economic data from the US showed Initial Jobless Claims dropped more than expected to the lowest since March 2020. On the negative front, the Philly Fed pulled back from 30.7 to 23.8, below expectations. Existing Home Sales rebounded more than expected. The greenback did not benefit from the numbers.
Rejection from above 114.00 points to some consolidation
If USD/JPY fails to rise back above 114.00 and post a weekly close below it would suggest some consolidation or even an extension of the current correction before the next move. After rising during four consecutive weeks and reaching a long–term barrier around 114.00, the rally could need to take a pause.
The initial support stands around 113.60 followed by 113.20 and then 112.10. A weekly close well above 114.00 should clear the way to more gains.
Technical levels
Democratic US Senator Joe Manchin said on Thursday that Democratic lawmakers are moving closer to an agreement on a "topline" figure for the spending bill, as reported by Reuters.
"Negotiations are ongoing, we're still talking to the White House," Manchin added. "The child tax credit is being negotiated, the program already in place through 2025."
On a similar note, US Senate Democratic Leader Chuck Schumer that they were "getting closer" to US President Joe Biden's agenda bill.
It's worth noting that Biden has reportedly lowered the spending bill target to between $1.75 trillion and $1.9 trillion.
Market reaction
These comments don't seem to be having a noticeable impact on market sentiment. As of writing, the S&P 500 Index was virtually unchanged on the day at 4,535.
There shouldn't be a big market shock when the Federal Reserve starts reducing its asset purchases, Federal Reserve Governor Christopher Waller said on Thursday, as reported by Reuters.
Additional takeaways
"There is no theory of how large a central bank's balance sheet should be."
"Current size of the balance sheet has caused no problems for financial market or macroeconomy."
"We can run off our balance sheet by quite a margin over the next couple of years if we want to."
"I have always favored market-based surveys of inflation expectations."
"You have still got to pay attention to household inflation surveys though."
"I am looking at both sets of data on inflation expectations."
Market reaction
The US Dollar Index continues to move sideways around 93.60 after these comments.
- Consumer Confidence Indicator for euro area edged lower in October.
- EUR/USD continues to fluctuate around 1.1650 on Thursday.
Consumer confidence in the euro area weakened in October with the European Commission's Consumer Confidence Indicator falling to -4.8 (flash) from -4 in September. This reading came in slightly better than the market expectation of -5. Moreover, the Consumer Confidence Indicator in the EU declined to -6.1 (flash) from -5.2.
Market reaction
This report doesn't seem to be having a noticeable impact on the common currency's performance against its major rivals. As of writing, the EUR/USD pair was posting small daily losses at 1.1642.
- The upside momentum in EUR/JPY faltered near 133.50.
- The yen regains traction as US yields grind lower.
- US Initial Claims rose by 290K, Philly Fed Index disappoints.
The recovery in the Japanese yen motivates the sharp rally in EUR/JPY to enter a pause mode after hitting fresh tops in the mid-133.00s on Wednesday.
EUR/JPY off 4-month peaks
Despite the ongoing corrective pullback, EUR/JPY manages to cling to the positive territory for the third week in a row and sheds ground for the first time after ten consecutive daily advances. In addition, the cross has almost fully retraced the January-August drop.
In fact, yields of the key US 10-year benchmark note and the long end of the curve recede from recent tops, prompting the Japanese yen to regain some ground lost vs. its American counterpart. Yields in the front end of the curve, in the meantime, reverse two daily decline and retake the 0.40% level.
In the docket, US weekly Claims rose by 290K in the week to October 16, while the Philly Fed Index came in short of expectations at 23.8 for the current month. Later, Existing Home Sales and the CB Leading Index will close the daily calendar.
EUR/JPY relevant levels
So far, the cross is losing 0.51% at 132.44 and a surpass of 133.48 (monthly high Oct.20) would expose 133.76 (high Jun.10) and then 134.12 (2021 high Jun.1). On the downside, the next support comes at 131.85 (10-day SMA) followed by 131.02 (Fibo level) and finally 130.38 (100-day SMA).
- The risk-off impulse in the markets extended some support to the safe-haven gold.
- Elevated US bond yields, a modest USD strength capped the upside for the metal.
- Bulls need to wait for a move beyond the $1,800 mark before placing fresh bets.
- Gold Price Forecast: Will XAU/USD find acceptance above channel hurdle at $1791?
Gold reversed an early North American session dip to the $1,776 area and turned positive for the third successive day, though remained below weekly tops touched earlier this Thursday. Currently hovering around the $1,782-83 region, the risk-off impulse in the markets turned out to be a key factor that acted as a tailwind for the safe-haven precious metal.
Investors turned nervous amid fresh concerns about potential contagion from China Evergrande's debt crisis. The heavily indebted developer said on Wednesday that a $2.6 billion stake in its property services unit failed. However, the market reaction, so far, has been limited amid reports that Evergrande has won more than a three-month extension to the maturity of a $260 million bond. Moreover, Chinese officials that the trouble in the sector would not be allowed to escalate into a full-blown crisis.
This, along with a goodish US dollar rebound from three-week lows, kept a lid on any meaningful gains for the dollar-denominated commodity. The greenback drew some support from a fresh leg up in the US Treasury bond yields. In fact, the yield on the benchmark 10-year US government bond moved back to the 1.67% mark, or the highest level since May amid expectations for an early policy tightening by the Fed. This was seen as another factor that contributed to cap the upside for the non-yielding gold, at least for now.
Despite signs of weakening economic activity, market players seem convinced that the Fed would be forced to adopt a more aggressive policy response to contain stubbornly high inflation. The speculations seemed unaffected by the overnight comments by Fed Governor Randal Quarles, saying that it would be premature to start raising interest rates in the face of high inflation that is likely to recede next year. Nevertheless, investors have been pricing in the possibility of a potential interest rate hike in 2022.
On the economic data front, the US Weekly Initial Jobless Claims dropped to 290K during the week ended October 15 as against expectations for a modest rise to 300K from 296K previous. This, to a larger extent, helped offset a weaker than anticipated Philly Fed Manufacturing Index, which fell to 23.8 for the current month from 30.7 in September and did little to influence the USD price dynamics. Thursday's US economic docket also features the release of Existing Home Sales data, though is unlikely to provide any impetus to gold prices.
Technical outlook
From a technical perspective, bulls might still wait for a sustained move beyond the $1,800 confluence hurdle before placing fresh bets. The mentioned handle comprises technically significant 100/200-day SMAs, which if cleared decisively will set the stage for additional gains. The next relevant barrier is pegged near the $1,808-10 region, above which gold seems all set to accelerate the momentum towards challenging the $1,832-34 heavy supply zone.
On the flip side, any meaningful pullback is likely to find decent support near the $1,775 area. Some follow-through weakness could drag gold prices back towards the $1,763-60 region. Failure to defend the mentioned support levels would negate any near-term positive bias and prompt aggressive technical selling. This, in turn, will expose the $1,750 support zone before the XAU/USD eventually drops further towards September monthly swing lows, around the $1723-21 region.
Levels to watch
Economists at TD Securities think a modest bounceback in the yen is starting to look a bit more likely. EUR/JPY looks stretched – this should weigh on USD/JPY but 112 looks to be formidable support.
There is a solid case for yen weakness
“As much as yen weakness is likely to persist over the medium-term, we think there is scope for a tactical reprieve as front-end receivers look more attractive in our view.”
“EUR/JPY has stalled around 133, which is just shy of its cyclical high around 134.”
“Given our view on the ECB and our bias for the EUR to remain relatively soggy, a retracement to 131 seems probable. This would also coincides with the 50% retracement of the high/lows since June. This should help pull USD/JPY lower, though we are inclined to think that 112 should be rather solid support.”
Federal Reserve Governor Christopher Waller said on Thursday that the next few months will be critical to see whether inflation is transitory, as reported by Reuters.
Waller further noted that he expects inflation to retreat toward the Fed's goal of 2% in 2022.
"The Fed may have to act faster if inflation remains too high," he added. "I've always had a very optimistic outlook for the US economy and there are no signs of a credit-fuelled bubble."
Market reaction
These remarks don't seem to be having a noticeable impact on the dollar's performance against its rivals. As of writing, the US Dollar Index was posting small daily gains at 93.63.
The Central Bank of the Republic of Turkey (CBRT) surprised by lowering its policy (one-week repo) rate by 200 basis points to 16% from 18%. Consequently, the lira fell a further 2% immediately after the announcement, and USD/TRY peaked at 9.4867. Economists at TD Securities think that the USD/TRY trajectory will continue to be upwards.
CBRT cuts deeper against the odds
“The CBRT surprised by cutting the benchmark one-week repo rate by 200bps to 16% today. This leads us to add an additional 50bps of easing for the remainder of 2021 . But the pace and magnitude will strictly hinge on the lira performance.”
“We think that the USD/TRY trajectory will continue to be upwards, but we do not exclude temporary drops that can embolden the CBRT to act more resolutely in cutting.”
“We continue to forecast USD/TRY at 9.15 in Q4 and 9.75 in Q1 2022. We for now hold onto these forecasts, but see an increasing risk that the lira may weaken much faster and bring forward to 2022 (if not earlier) the breach of the historical 10 mark.”
- AUD/USD witnessed an intraday turnaround from multi-month tops touched earlier this Thursday.
- The risk-off impulse, elevated US bond yields revived the USD demand and exerted some pressure.
- The lack of follow-through selling warrants some caution before positioning for any corrective slide.
The AUD/USD pair remained on the defensive through the early North American session, albeit has managed to rebound from pips from daily swing lows. The pair was last seen trading just below the key 0.7500 psychological mark, down over 0.25% for the day.
The pair struggled to capitalize on its early positive move to the highest level since early July and witnessed an intraday turnaround from the 0.7535 area. The corrective pullback was sponsored by a goodish pickup in demand for the US dollar, which drew some support from the risk-off impulse and elevated US Treasury bond yields.
Investors turned nervous amid renewed worries about potential contagion from China Evergrande's debt crisis. The heavily indebted developer said on Wednesday that a $2.6 billion stake in its property services unit failed. This, in turn, tempered investors' appetite for perceived riskier assets and benefitted the safe-haven USD.
Meanwhile, the yield on the benchmark 10-year US government bond held steady near the 1.67% mark, or the highest level since May and extended additional support to the greenback. Investors seem convinced that a faster than expected rise in inflation might force the Fed to adopt a more aggressive policy response in 2022.
On the economic data front, the US Weekly Initial Jobless Claims dropped to 290K during the week ended October 15 as against expectations for a modest rise to 300K from 296K previous. This, to a larger extent, helped offset a weaker than anticipated Philly Fed Manufacturing Index, which fell to 23.8 for the current month from 30.7 in September.
The USD bulls seemed rather unaffected by mixed economic data, instead took cues from an extension of the recent rally in the US bond yields. In fact, the yield on the yield on the benchmark 10-year US government bond held steady near the 1.67% mark, or the highest level since May amid expectations for an early policy tightening by the Fed.
This week's dismal US macro releases – Industrial Production and housing market data – pointed to weakening economic activity. Investors, however, seem convinced that a faster than expected rise in inflation might force the Fed to adopt a more aggressive policy response and have been pricing in the possibility of a rate hike in 2022.
It will now be interesting if the AUD/USD pair can attract fresh buying at lower levels or the pullback suggests that the recent strong positive move witnessed from September swing lows has run out of steam. Nevertheless, the lack of any strong follow-through selling warrants some caution before confirming that the pair has topped out.
Technical levels to watch
- Philly Fed Manufacturing Index edged lower in October.
- US Dollar Index stays in the positive territory above 93.60.
The Federal Reserve Bank of Philadelphia reported on Thursday that the headline Manufacturing Activity Index of the Manufacturing Business Outlook Survey declined to 23.8 in October from 30.7 in September. This reading came in weaker than the market expectation of 25.
Further details of the publication revealed that the New Orders Index improved to 30.8 from 15.9, the Employment Index edged higher to 30.7 from 26.3 and the Prices Paid Index rose to 70.3 from 67.3.
Market reaction
The US Dollar Index showed little to no reaction to this report and was last seen posting small daily gains at 93.64.
- Weekly Initial Jobless Claims in US declined by 6,000.
- US Dollar Index clings to modest daily gains above 93.60.
There were 290,000 initial claims for unemployment benefits in the US during the week ending October 16, the data published by the US Department of Labor (DOL) revealed on Thursday. This reading followed the previous print of 296,000 (revised from 293,000) and came in better than the market expectation of 300,000.
Market reaction
There was no immediate market reaction to this report and the US Dollar Index was last seen posting modest daily gains at 93.67.
Additional takeaways
"The 4-week moving average was 319,750, a decrease of 15,250 from the previous week's revised average."
"The advance seasonally adjusted insured unemployment rate was 1.8% for the week ending October 9."
"The advance number for seasonally adjusted insured unemployment during the week ending October 9 was 2,481,000, a decrease of 122,000 from the previous week's revised level."
- EUR/USD gives away some gains after testing 1.1670.
- Further up comes the 55-day SMA at 1.1711.
EUR/USD falters once again in the area of recent multi-week highs around 1.1670 on Thursday.
If this area if cleared, then the pair could attempt to take out the round level at 1.1700 the figure ahead of the interim hurdle at the 55-day SMA, today at 1.1711. Further north comes the short-term resistance line near 1.1730. A breakout of the latter should see the selling pressure mitigated and therefore allow for extra gains to the next relevant resistance in the mid-1.1700s.
In the meantime, the near-term outlook for EUR/USD is seen on the negative side below the key 200-day SMA, today at 1.1918.
EUR/USD daily chart
Economists at Scotiabank forecast USD/CAD at 1.20 by mid-2022. They have upgraded their Bank of Canada expectations and see the BoC hiking 100bps next year.
BoC tightening expectations upgraded
“Higher than expected Canadian inflation data yesterday and perhaps even our own, upgraded forecasts for the BoC (we now expect 100bps of tightening in H2 next year and a further 100bps in 2023) have served to bolster market confidence in monetary policy tightening risks in Canada.”
“We expect the CAD the strengthen a little more in the medium-term, reaching 1.20 in H2 next year, and to stay stronger for a little longer as a consequence of our upgraded BoC forecast.”
“We look for the CAD to retain a firm undertone over the next few days but more cautious trading could develop ahead of Thursday’s policy decision.”
- USD/CHF failed to capitalize on its modest intraday uptick to levels just above the 0.9200 mark.
- The risk-off impulse in the markets benefitted the safe-haven CHF and exerted some pressure.
- Elevated US bond yields revived the USD demand and helped limit further losses for the major.
The USD/CHF pair retreated over 25 pips from the early European session swing highs and dropped to the lowest level since mid-September, around the 0.9180 region in the last hour.
The pair struggled to preserve its modest intraday gains to levels just above the 0.9200 mark and has now drifted into the negative territory for the third successive day. The risk-off impulse in the markets benefitted the safe-haven Swiss franc, which, in turn, was seen as a key factor that prompted fresh selling around the USD/CHF pair on Thursday.
Worries about potential contagion from China Evergrande's debt crisis resurfaced after the heavily indebted developer said on Wednesday that a $2.6 billion stake in its property services unit failed. This, in turn, tempered investors' appetite for perceived riskier assets and drove flows towards traditional safe-haven currencies, including the CHF.
Meanwhile, the intraday pullback seemed rather unaffected by a modest pickup in the US dollar demand, which drew some support from elevated US Treasury bond yields. In fact, the yield on the benchmark 10-year US government bond held steady near the 1.67% mark, or the highest level since May amid expectations for an early policy tightening by the Fed.
This week's dismal US macro releases – Industrial Production and housing market data – pointed to weakening economic activity. Investors, however, seem convinced that a faster than expected rise in inflation might force the Fed to adopt a more aggressive policy response and have been pricing in the possibility of a rate hike in 2022.
Hence, it will be prudent to wait for a strong follow-through selling before placing fresh bearish bets and positioning for an extension of the recent leg down witnessed over the past three weeks or so. Next on tap will be the US economic docket – featuring the releases of the Philly Fed Manufacturing Index and the usual Weekly Initial Jobless Claims.
This, along with a scheduled speech by Fed Governor Christopher Waller and the US bond yields, might influence the USD price dynamics. Traders will further take cues from the broader market risk sentiment to grab some short-term opportunities around the USD/CHF pair.
Technical levels to watch
EUR/USD is steady in mid-1.16s ahead of key PMIs tomorrow. Economists at Scotiabank do not expect the pair to slide below 1.16 unless the eurozone posts awful data.
Initial support seen at the 1.1635 dayly low
“Friday’s release of preliminary PMIs in the eurozone that will likely reflect the impact of high energy prices in the region. However, with the hit to manufacturing generally expected, only a large data miss could see the EUR/USD fall under the key 1.16 level.”
“The intraday low of ~1.1635 is support followed by 1.1600/15.” “
“Resistance is 1.1665/85.”
The GBP/USD pair is struggling to hold on to the 1.38 handle. Economists at Scotiabank expect the cable to end the year around this level despite Bank of England's rate hike expectations.
Cable likely to close 2021 around 1.38
“The GBP remains well supported by hawkish BoE expectations that should prevent sustained declines under 1.36 but we think there is likely more downside than upside risk to market expectations for BoE tightening as already over 100bps in hikes are priced in between now and end-2022.”
“We think the GBP/USD will struggle to make a push toward a test of 1.40 despite the high probability of at least one hike shortly and think it more likely that the pound closes the year near the 1.38 level.”
S&P 500 has extended its rally as looked for to retest the record high at 4546. Whilst a fresh setback from here should be allowed for, analysts at Credit Suisse continue to look for a sustained break to new highs in due course.
Bullish bias whilst above 4448/38
“The steady move higher in the S&P 500 has extended as looked for to just shy of the 4546 record high. Given the importance of 4546 a fresh pause here should be allowed for, but our core view remains bullish and we continue to look for a clear break to new highs in due course.”
“We would see resistance next at 4574 ahead of the beginning of what we continue to see as its ‘typical’ extreme (10% above the 200-day average) at 4592/4601.”
“Support from the price gap from yesterday morning at 4524/20 needs to hold to keep the immediate risk higher. Below can see a setback to 4496, then 4486/76, with fresh buyers expected here.”
“We shall maintain a tactical bullish bias whilst above the 13 and 63-day averages and price/gap support at 4448/38.”
See – S&P 500 Index: Equity market optimism is justified – UBS
- USD/CAD staged a modest recovery from multi-month lows touched earlier this Thursday.
- The risk-off impulse, elevated US bond yields provided a goodish lift to the safe-haven USD.
- Retreating crude oil prices undermined the loonie and remained supportive of the momentum.
The USD/CAD pair showed some resilience below the 1.2300 round-figure mark and stage a goodish intraday bounce from four-month lows touched earlier this Thursday. The pair held on to its modest recovery gains through the mid-European session and was last seen hovering near daily tops, just below mid-1.2300s.
The risk-off impulse in the markets helped revive demand for the safe-haven US dollar, which further benefitted from elevated US Treasury bond yields. Apart from this, a modest pullback in crude oil prices from multi-year tops weighed on the commodity-linked loonie and triggered a short-covering around the USD/CAD pair.
From a technical perspective, oversold RSI (14) on the daily chart prompted bearish traders to take some profits off the table near the lower boundary of a short-term descending channel. The mentioned support, around the 1.2290-85 area, should act as a pivotal point for traders and help determine the near-term trajectory.
A convincing break below will mark a fresh bearish breakdown and turn the USD/CAD pair vulnerable to prolong its bearish trend witnessed over the past one month or so. The subsequent slide could get extended towards the next relevant support near mid-1.2300s before the pair eventually drops to the 1.2300 round-figure mark.
On the flip side, any further recovery is likely to confront resistance near the 1.2375-80 region ahead of the 1.2400 mark. Some follow-through buying should pave the way towards a confluence hurdle near the key 1.2500 psychological mark, comprising of the very important 200-day SMA and the top end of the mentioned channel.
USD/CAD daily chart
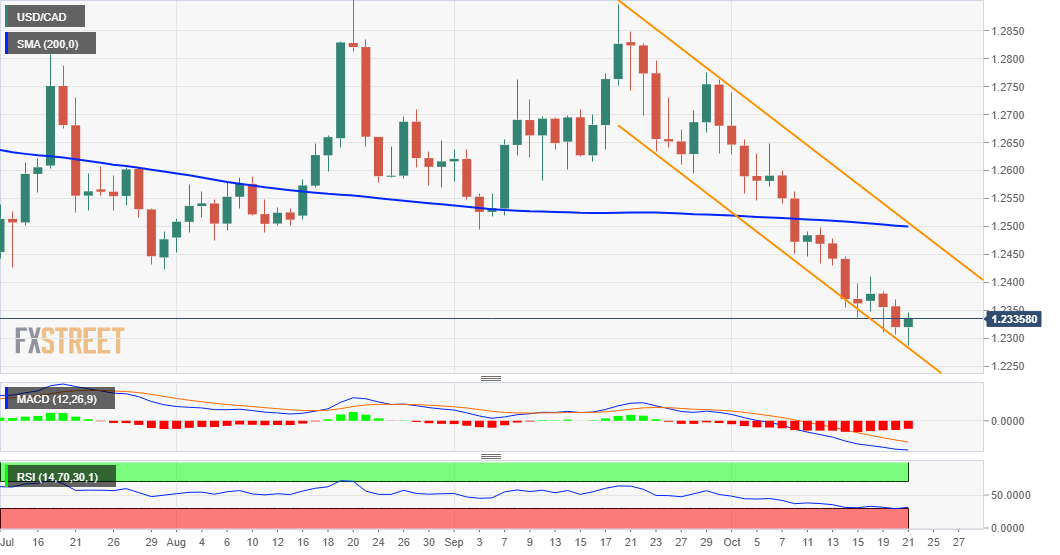
Technical levels to watch
- USD/TRY moves sharply higher and approaches 9.5000.
- The CBRT reduced the One-Week Repo Rate by 200 bps.
- Turkey’s Consumer Confidence eased to 76.8 in October.
The Turkish lira resumes the downside and pushes USD/TRY to new all-time highs around 9.50 on Thursday.
USD/TRY higher post-CBRT
The capacity of the Turkish central bank (CBRT) to surprise everybody remained intact on Thursday.
Indeed, USD/TRY pops to fresh all-time highs after the CBRT caught markets off guard and reduced the One-Week Repo Rate by an unexpected 200 bps to 16.00%, even below the latest level of the Core CPI recorded in September (16.98%).
In the statement, the central bank reiterated that the current elevated inflation is mainly due to transitory factors. These temporary factors behind high consumer prices, according to the bank, leave limited room to reduce the policy rate further in the next months… (wait, what?)'
In the meantime, futures of USD/TRY trade around 9.5800.
USD/TRY key levels
So far, the pair is up 2.16% at 9.4147 and a drop below 9.2467 (10-day SMA) would aim for 9.0107 (20-day SMA) and finally 8.8317 (monthly low Oct.4). On the other hand, the next up barrier lines up at 9.4707 (all-time high Oct.21) followed by… the moon.
The Central Bank of the Republic of Turkey (CBRT) announced on Thursday that it lowered its policy (one-week repo) rate by 200 basis points to 16% from 18%. The market expectation was a rate cut of 100 basis points to 17%.
Market reaction
With the initial market reaction, the USD/TRY pair show higher and was last seen gaining 2.5% on the day at 9.4440.
Key takeaways from policy statement as summarized by Reuters
"Supply-side transitory factors leave limited room for the downward adjustment to the policy rate."
"Assessed that inflation effects are due to transitory factors."
"Tight policy started to have a higher than envisaged contractionary effect on commercial loans."
"Will use decisively all available instruments until strong indicators point to a permanent fall in inflation."
"Stability in the general price level will foster macroeconomic stability."
"Leading indicators show that domestic economic activity remains strong, with the help of robust external demand."
"Demand for durable consumer goods slows down, recovery is observed in non-durable consumer goods."
The next Riksbank policy meeting is due on November 24. The central bank is likely to vindicate a cautious stance again. Subsequently, the EUR/SEK pair should grind higher, in the opinion of economists at Rabobank.
Riksbank is unlikely to be a leader in the rate hiking cycle
“Sweden is a small, open economy and is unlikely to desire a significantly stronger value of the SEK vs. the EUR, given the potential impact on trade.”
“Given the likelihood that the Riksbank reiterates a dovish position in this meeting, there is room for some upward correction in EUR/SEK towards the 10.10/10.05 area on a one-to-three month view”
- Silver was seen consolidating its recent strong move up to multi-week tops.
- The set-up favours bullish traders and supports prospects for further gains.
- Any slide below the $24.00 mark could be seen as a dip-buying opportunity.
Silver now seems to have entered a bullish consolidation phase and was seen oscillating in a range just below mid-$24.00s, or six-week tops touched earlier this Thursday.
From a technical perspective, the overnight strong follow-through positive move validated this week's breakthrough a downward-sloping trend-line extending from July monthly swing highs. This comes on the back of the recent inverted head and shoulders bullish breakout and supports prospects for additional near-term gains.
The constructive set-up is reinforced by bullish technical indicators, which are still far from being in the overbought zone. That said, slightly overbought RSI (14) on the 4-hour chart failed to assist the XAG/USD to capitalize on its move beyond the 38.2% Fibonacci level of the $28.75-$21.42 downfall, at least for now.
Nevertheless, the bias remains tilted firmly in favour of bullish traders. Hence, a subsequent move towards testing September monthly swing highs, around the $24.80-85 region, remains a distinct possibility. Bulls might eventually aim to reclaim the key $25.00 psychological mark, which coincides with the 50% Fibo. level.
On the flip side, the $24.00 round-figure mark now seems to protect the immediate downside. Any subsequent decline could be seen as a buying opportunity near the $23.75-70 region. This, in turn, should help limit the corrective pullback near the mentioned trend-line support breakpoint, around the $23.50-45 region.
Silver daily chart
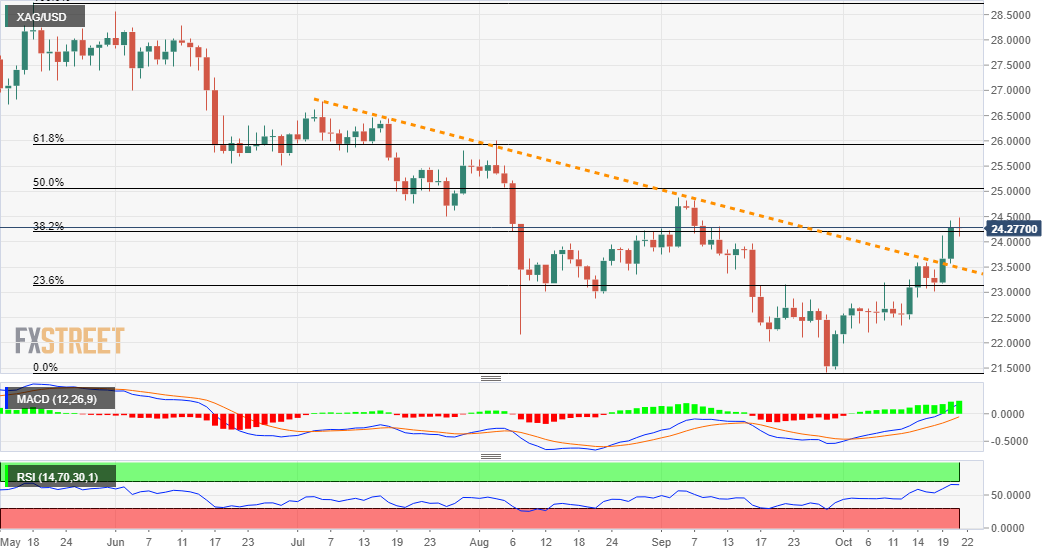
Technical levels to watch
- The downside pressure in DXY remains unable to breach 93.50.
- Extra recovery looks on the cards above the mid-93.00s.
DXY stays under pressure but manages to hold on pretty well above the 93.50 level for the time being.
If sellers cannot drag the index further south of recent low at 93.50 in the near term, then the rebound in DXY could gather extra steam and challenge, initially, the 94.00 zone, where the 10- and 20-day SMAs coincide so far. Further up, there are no hurdles of note until the 2021 high at 94.56 (October 12).
Looking at the broader picture, the constructive stance on the index is seen unchanged above the 200-day SMA at 91.85.
DXY daily chart
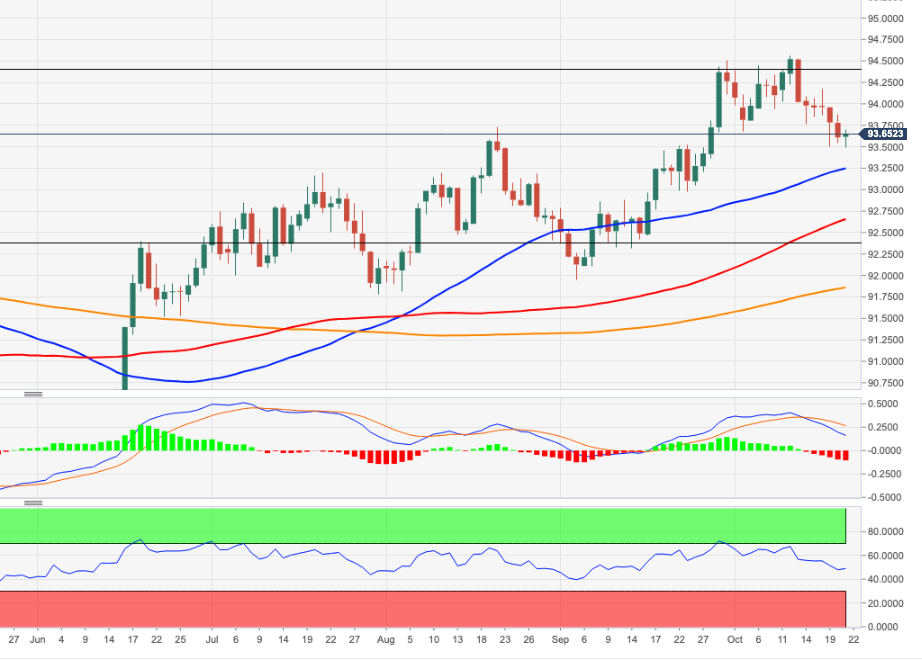
- The sharp move higher in EUR/JPY meets resistance near 133.50.
- Bets for a near-term test of 2021 high remain well in place.
EUR/JPY’s needle-like upside seems to have met some decent hurdle in the vicinity of 133.50 on Thursday.
In light of the ongoing price action and recent overbought levels, some correction in the cross should be in the pipeline in the short-term horizon. However, the positive outlook allows for the continuation of the uptrend once a corrective move is digested. That said, there are minor hurdle at 133.68 (June 15) and 133.76 (June 10) ahead of the more relevant YTD high at 134.12 recorded on June 1.
In the broader scenario, while above the 200-day SMA at 130.01, the outlook for the cross is expected to remain constructive.
EUR/JPY daily chart
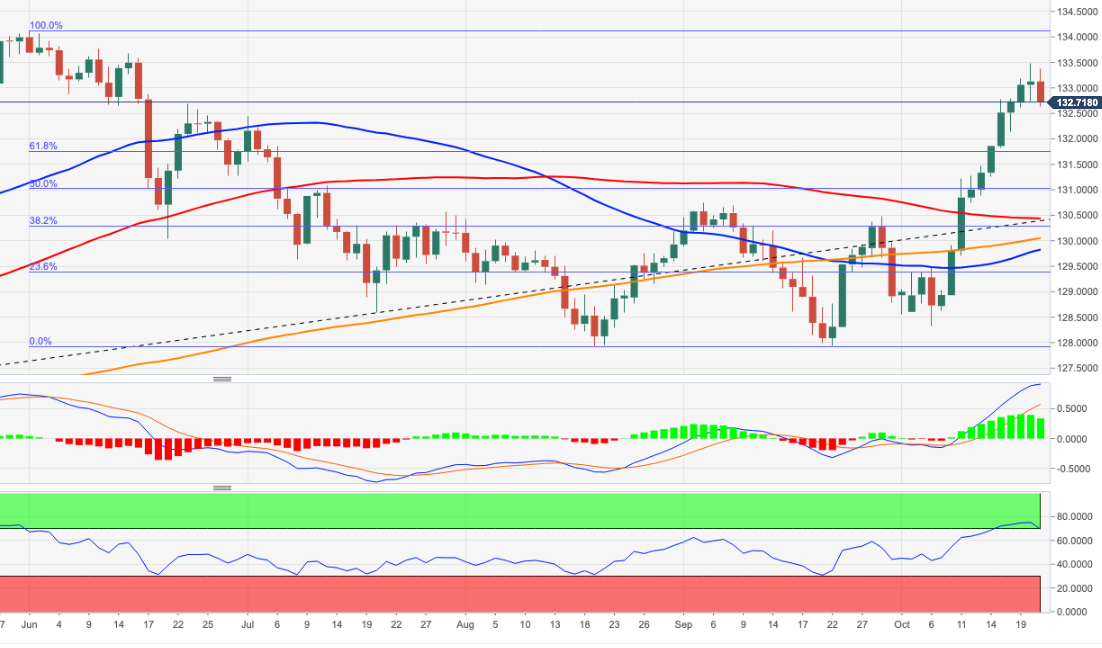
Citing sources familiar with the matter, Reuters reported on Thursday that the Bank of Japan is discussing phasing out the emergency pandemic loan scheme if coronavirus infections continue to fall.
Sources further noted that there was no consensus within the BoJ whether to extend the March deadline of the scheme.
"The decision on extending the BoJ COVID-19 loan scheme is expected as early as December," Reuters added. "Ending the loan scheme in March would defy market expectations that the BoJ will extend the deadline again."
Market reaction
The USD/JPY pair edged slightly lower on this headline and was last seen losing 0.23% on a daily basis at 114.00.
- Manufacturing activity in UK weakens sharply in October.
- GBP/USD trades in the negative territory around 1.3800.
According to the latest manufacturing trend survey of the Confederation of British Industry (CBI), the Manufacturing Order Book Balance dropped to 9 in October, the lowest level since April, from 22 in September. This reading missed the market expectation of 18 by a wide margin.
Further details of publication revealed that the Manufacturing Price Expectations Balance jumped to its highest level since 1980 at 59. The Manufacturing Export Orders Balance declined to -7 from -2 and the Manufacturing Business Optimism Balance worsened to 2 from 27 in July.
Market reaction
The GBP/USD pair remains on the back foot after this report and was last seen losing 0.2% on the day at 1.3795. Meanwhile, the UK's FTSE 100 Index is down 0.37% at 7,196.
- EUR/GBP staged a modest recovery following an early dip to fresh YTD lows.
- The formation of a rectangle could be seen as a bearish consolidation phase.
- A move beyond the 0.8460 resistance is needed to negate the negative bias.
The EUR/GBP cross reversed an early dip to fresh YTD lows and was last seen trading with modest gains, around the 0.8435-40 region.
The British pound's relative underperformance through the first half of the European session could be attributed to some long-unwinding trade amid a goodish pickup in the US dollar demand. That said, expectations for an imminent rate hike by the Bank of England later this year should act as a tailwind for the sterling and cap gains for the EUR/GBP cross.
Looking at the technical picture, the recent range-bound price action witnessed since the beginning of this week constitutes the formation of a rectangle on short-term charts. Given the recent sharp rejection slide from the very important 200-day SMA, the rectangle could be categorized as a bearish continuation phase amid slightly oversold conditions.
Meanwhile, the top boundary of the mentioned trading range, around the 0.8460 region, now coincides with 200-hour SMA. This should now act as a pivotal point for short-term traders. A sustained move beyond will suggest that the EUR/GBP cross has bottomed out in the near term and might trigger an aggressive short-covering move amid absent relevant fundamental catalyst.
The EUR/GBP cross might then aim back to reclaim the key 0.8500 psychological mark. The recovery momentum could further get extended towards the next relevant hurdle near the 0.8525-20 supply zone. Some follow-through buying will set the stage for a further near-term appreciating move and lift the cross further towards mid-0.8500s en-route the 0.8575-80 region.
On the flip side, the 0.8420-15 region, or the lower boundary of the weekly trading range, now seems to have emerged as immediate strong support. Bearish traders should wait for a sustained weakness below the mentioned support before placing fresh bets. The EUR/GBP cross might then turn vulnerable to break below the 0.8400 mark and slide to the 0.8335 support zone.
EUR/GBP 1-hour chart
-637704076606586278.png)
Technical levels to watch
Citing Kuwait News Agency (KUNA), Reuters reported on Thursday that Kuwait began increasing its crude oil production in accordance with the OPEC+ agreement.
Commenting on its development, Kuwait's oil minister that their plan to increase crude oil production covers the shared zone with Saudi Arabia.
Market reaction
This headline doesn't seem to be having a significant impact on crude oil prices. As of writing, the barrel of West Texas Intermediate (WTI), which reached a multi-year high of $83.93 earlier in the day, was down 0.85% on a daily basis at $82.80.
- GBP/JPY retreated over 100 pips from multi-year tops amid reviving demand for the safe-haven JPY.
- A stronger USD weighed on the British pound, which further contributed to the intraday selling bias.
- Expectations that the BoE will hike interest rates in 2021 should help limit any deeper corrective slide.
The GBP/JPY cross maintained its offered tone through the first half of the European session, albeit has managed to hold its neck above the daily swing lows. The cross was last seen trading just below mid-157.00s, still down around 0.40% for the day.
The cross struggled to find acceptance above the 158.00 round figure for the second successive day and witnessed a modest pullback on Thursday, from the highest level since June 2016. The risk-off impulse in the markets benefitted the safe-haven Japanese yen, which, in turn, was seen as a key factor that prompted some selling around the GBP/JPY cross.
Worries about potential contagion from China Evergrande's debt crisis resurfaced after the heavily indebted developer said on Wednesday that a $2.6 billion stake in its property services unit failed. This, in turn, tempered investors' appetite for perceived riskier assets and drove flows towards traditional safe-haven currencies, including the JPY.
Meanwhile, the global flight to safety assisted the US dollar to stage a modest bounce from three-week lows and exerted some pressure on the British pound. This was seen as another factor that contributed to the GBP/JPY pair's slide of over 100 pips. That said, rising bets for an imminent rate hike by the Bank of England in 2021 helped limit deeper losses.
Wednesday's softer UK consumer inflation figures might have forced investors to trim their bets for an immediate BoE rate hike move in November. Investors, however, seem convinced that the decline will be temporary and that the BoE will eventually hike interest rates from record lows before the end of this year, which might act as a tailwind for the sterling.
Hence, it will be prudent to wait for a strong follow-through selling before confirming that the recent strong bullish trajectory witnessed since the beginning of this month has run out of steam. From current levels, the daily lows, around 157.10 area, might protect the immediate, which if broken might prompt some technical selling around the GBP/JPY cross.
Levels to watch
- Gold price stalls its three-day uptrend, as USD recovers ground broadly.
- Gold’s retreat remains capped by easing Treasury yields amid risk-off mood.
- Gold: Sellers defend $1,800, all eyes on US T-bond yields.
Gold price is consolidating the three-day winning streak, although the bulls appear to lack follow-through upside amid a rebound in the US dollar across the board. Mixing European earnings reports and China’s property sector woes are weighing on the investors’ sentiment, boding well for the safe-haven dollar while capping the upside in gold price. Going forward, the broader risk sentiment will continue to remain the market driver, impacting the USD valuations, in turn, gold’s.
Read: Gold Price Forecast: Will XAU/USD find acceptance above channel hurdle at $1791?
Gold Price: Key levels to watch
The Technical Confluences Detector shows that gold is heading back towards the daily highs of $1789, where the Fibonacci 23.6% one-week aligns.
If that barrier is crossed on a sustained basis, then gold bulls will target the next crucial resistance at $1791, the confluence of the Fibonacci 61.8% one-month and pivot point one-day R1.
Further up, gold will face another critical resistance at $1795, the convergence of the pivot point one-week R1, SMA100 and 200 one-day.
The last line of defense for gold sellers is the intersection of the previous week’s high and pivot point one-day R2 at $1801.
On the flip side, a dense cluster of support levels awaits around $1780, where the Fibonacci 38.2% one-week meets with the Fibonacci 38.2% one-day.
The next cushion is placed at $1776, the confluence of the Fibonacci 61.8% one-day and SMA5 one-day.
$1769 will challenge the bullish commitment, as the SMA10 one-day, pivot point one-day S1 SMA200 four-hour and Fibonacci 61.8% one-week coincide at that level.
Here is how it looks on the tool
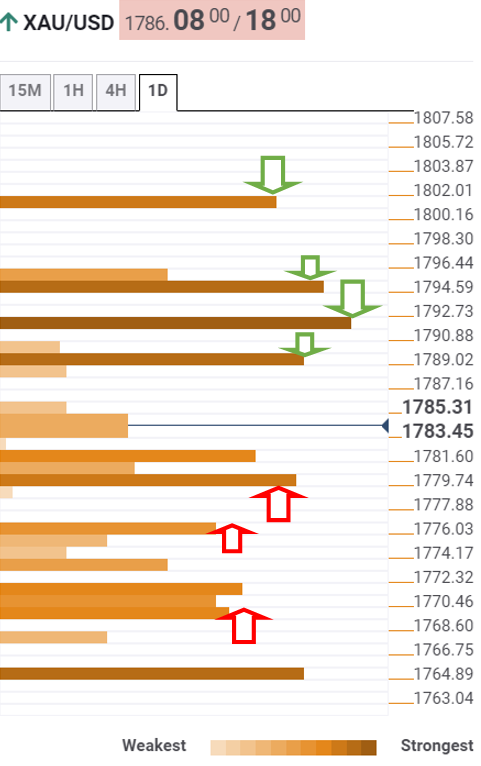
About Technical Confluences Detector
The TCD (Technical Confluences Detector) is a tool to locate and point out those price levels where there is a congestion of indicators, moving averages, Fibonacci levels, Pivot Points, etc. If you are a short-term trader, you will find entry points for counter-trend strategies and hunt a few points at a time. If you are a medium-to-long-term trader, this tool will allow you to know in advance the price levels where a medium-to-long-term trend may stop and rest, where to unwind positions, or where to increase your position size.
European Central Bank (ECB) Governing Council member Ignazio Visco said on Thursday that supply bottlenecks are starting to weigh on the Italian economy and added that they could last for longer than expected, per Reuters.
Additional takeaways
"Household and business bank deposits have increased by more than 200 billion euros, will decrease as consumption resumes."
"European Union should consider joint management of at least the last two years of countries' debt, with sink fund to purchase national bond offers."
"Pandemic showed limits of the European Union without a common budgetary capacity."
"Public debt crucial to counter the crisis but cannot be used to finance current expenditure."
Market reaction
The shared currency remains on the back foot after these comments and the EUR/USD pair was last seen losing 0.1% on the day at 1.1640.
EUR/CHF fades again after experiencing an initial rebound. Economists at Société Générale note that the pair is near the 1.07 support and the down move could be extended while below the 1.0840 level.
Bounce limited after probing August low near 1.0700
“Near-term support is at 1.0700.”
“Daily Ichimoku cloud at 1.0840 remains a near-term hurdle.”
“Holding below th1.0840 mark, the down move could extend towards 1.0660.”
EUR/USD idles at 1.1650 after six days of gains. Economists at Société Générale expect the world’s most popular currency pair to see a retracement to the 1.1495/50 region on failure at 1.1750.
EUR/USD heading towards 1.1750
“EUR/USD has staged a bounce from 1.1525 and could head towards a multi month descending channel at 1.1750.”
“Failure to cross this can result in further pullback towards March 2020 peak of 1.1495/1.1450.”
For the first time since 7 October, USD/TRY did not scale a new high yesterday. Still, economists at Société Générale expect the pair to extend its uptrend towards the 9.67/72 region.
The 9.15/11 zone to cushion USD/TRY dips
“Currently a pullback is underway, however, 10-DMA at 9.15/9.11 should provide support.”
“Ongoing uptrend is likely to persist towards next projections located at 9.44 and 9.67/9.72.”
- AUD/USD witnessed a turnaround from multi-month tops touched earlier this Thursday.
- The risk-off impulse benefitted the safe-haven USD and prompted some long-unwinding.
- A strong follow-through selling is needed to confirm that the pair has topped out already.
The AUD/USD pair extended its corrective pullback from multi-month tops and weakened further below the key 0.7500 psychological mark during the early European session. The pair was last seen trading near daily lows, around the 0.7485-80 region, down 0.40% for the day.
The pair struggled to capitalize on its early positive move to the highest level since July and witnessed an intraday turnaround from the 0.7535 region. The risk-off impulse in the markets assisted the safe-haven US dollar to stage a goodish rebound from three-week lows and prompted some long-unwinding around the AUD/USD pair.
Worries about potential contagion from China Evergrande's debt crisis resurfaced after the heavily indebted developer said on Wednesday that a $2.6 billion stake in its property services unit failed. This, in turn, tempered investors' appetite for riskier assets and benefitted traditional safe-haven currencies, including the USD.
The greenback was further underpinned by elevated US Treasury bond yields, which seemed unaffected by the moderation of Fed rate hike expectations. This week's dismal US macro releases – Industrial Production and housing market data – pointed to weakening economic activity and tempered market expectations for an early policy tightening by the Fed.
This was further reinforced by the overnight comments from Fed Governor Randal Quarles, saying that that it would be premature to start raising interest rates in the face of high inflation that is likely to recede next year. Quarles, however, reaffirmed that it is time for the Fed to begin dialling down its massive pandemic-era bond-buying program.
From a technical perspective, Thursday's downfall could still be attributed to some profit-taking following the recent strong rally from late September swing lows. This makes it prudent to wait for a strong follow-through selling before confirming that the AUD/USD pair has topped out in the near term and positioning for any further depreciating move.
Market participants now look forward to the US economic docket – featuring the releases of the Philly Fed Manufacturing Index and the usual Weekly Initial Jobless Claims. This, along with a scheduled speech by Fed Governor Christopher Waller and the US bond yields, might influence the USD price dynamics and provide some impetus to the AUD/USD pair.
Technical levels to watch
Economist at UOB Group Enrico Tanuwidjaja and Yari Mayaseti comment on the latest BI meeting.
Key Takeaways
“Bank Indonesia (BI) left its benchmark rate unchanged at record low of 3.50% at its October 2021 monetary policy meeting (MPC) as the economy continued to recover from the country’s worst COVID-19 wave. The benchmark rate has been at that level since February, and BI has signalled the central bank could remain on hold at least until year-end. Consequently, BI maintained the Deposit Facility rate at 2.75%, as well as the Lending Facility rate at 4.25%. BI stated that the decision is consistent with the need to maintain the exchange rate and financial system amid low inflation, projected low inflation and efforts to revive economic growth.”
“With the daily Covid-19 cases now more under control, the recovery pace is getting back on track. Besides, the inflation is still below the Central Bank’s target range of 2%-4%; BI will have the policy space to remain accommodative to support the economic recovery. We keep our BI rate forecast to stay at current level of 3.50% for the rest of the year, while we also forecast that BI will start to hike its benchmark interest rates in the latter half of 2022.”
USD/JPY is ticking down for the second successive day. Economists at OCBC expect the pair to enter a period of consolidation within a 113.80-114.80 range.
Topside limited by broad USD sogginess
“Dips have been shallow and well-cushioned at 114.00. Topside limited by broad USD sogginess.”
“Retain view for consolidation between 113.80 and 114.80 in the upcoming sessions.”
“Upward extension in front and back-end UST yields is still the main driver for upside.”
Brent Oil has further extended its uptrend after breaking above July peak ($78.00). Strategists at Société Générale expect to see a gradual advance towards $88.50 and $90.60.
Limited downside
“Brent Oil is in vicinity to 2016 levels of $86.75. This can result in a pause however a large downside is not envisaged; lower limit of a steeper ascending channel at $83.60/83.00 and $81.90 are immediate support levels.”
“Holding above $83.60/83.00, Brent could gradually head higher towards next objectives at projections of $88.50 and $90.60.”
- EUR/USD reverses the recent weakness and revisits the 1.1640 zone.
- The greenback claws back some ground lost and bounces off lows.
- Italian Industrial Sales expanded 0.8% MoM in August and 13.8% YoY.
The single currency now faces some selling pressure and forces EUR/USD to recede to the 1.1640 region on Thursday.
EUR/USD offered on USD recovery
After three consecutive daily advances, EUR/USD now gives away part of those gains after faltering once again in the area of recent peaks near 1.1670.
The modest recovery in the greenback prompts the pair and the rest of the risk complex to shed some ground in light of the recent strong advance.
Indeed, the better sentiment surrounding the riskier assets coupled with speculations that many G10 central banks could be mulling the idea of a sooner-than-anticipated return to the normalization of the monetary policy weighed on the buck in past sessions and sponsored quite a strong leg lower in the US Dollar Index.
In the data space, Industrial Sales in Italy expanded at a monthly 0.8% during August and 13.8% from a year earlier. In France, the Business Confidence stayed unchanged at 107 for the current month.
Across the pond, the usual weekly Claims are due seconded by the Philly Fed Index, housing data, the CB Leading Index and the speech by FOMC’s C.Waller.
What to look for around EUR
EUR/USD advanced further and clinched fresh October peaks near 1.1670 earlier in the week. While the improvement in the sentiment surrounding the risk complex lent extra wings to the par, price action is expected to keep looking to dollar dynamics for the time being, where tapering chatter remains well in centre stage. In the meantime, the idea that elevated inflation could last longer coupled with the loss of momentum in the economic recovery in the region, as per some weakness observed in key fundamentals, are seen pouring cold water over investors’ optimism as well as bullish attempts in the European currency.
Key events in the euro area this week: Preliminary PMIs in the euro zone (Friday).
Eminent issues on the back boiler: Asymmetric economic recovery post-pandemic in the region. Sustainability of the pick-up in inflation figures. Probable political effervescence around the EU Recovery Fund in light of the rising conflict between the EU, Poland and Hungary. Investors’ shift to European equities in the wake of the pandemic could lend extra oxygen to the euro. ECB tapering speculations.
EUR/USD levels to watch
So far, spot is losing 0.08% at 1.1638 and faces the next up barrier at 1.1669 (monthly high Oct.19) followed by 1.1711 (55-day SMA) and finally 1.1755 (weekly high Sep.22). On the other hand, a break below 1.1607 (20-day SMA) would target 1.1571 (low Oct.18) en route to 1.1524 (2021 low Oct.12).
- GBP/USD faced rejection near a confluence hurdle amid a modest pickup in the USD demand.
- Rising bets for a BoE rate hike in 2021 should help limit any deeper losses for the British pound.
- The technical set-up favours bullish trades and supports prospects for further near-term gains.
The GBP/USD pair witnessed some selling on Thursday and dropped to sub-1.3800 levels during the first half of the trading action, though lacked any follow-through.
The risk-off impulse in the markets – amid fresh worries about a credit crunch in China's real estate sector – assisted the US dollar to stage a modest bounce from three-week lows. This, in turn, was seen as a key factor that exerted some downward pressure on the GBP/USD pair.
The pair, for now, seems to have snapped two days of the winning streak, though the downside is likely to remain limited. Moderation of Fed hike expectations, along with growing acceptance that the BoE will hike rates before the end of this year should act as a tailwind for the GBP/USD pair.
From a technical perspective, the recent strong move up from the vicinity of the 1.3400 mark stalled near the very important 200-day SMA. This coincides with the top boundary of a three-week-old ascending channel and a downward sloping trend-line extending from late July.
The mentioned confluence hurdle, just ahead of mid-1.3800s, should now act as a key pivotal point for short-term traders. A convincing breakthrough will set the stage for a further near-term appreciating move and allow bulls to aim back to reclaim the 1.3900 round-figure mark.
Meanwhile, bullish technical indicators on the daily chart support prospects for a further near-term appreciating move. That said, bulls might still wait for a sustained break through the mentioned confluence hurdle – just ahead of mid-1.3800s – before placing aggressive bets.
The GBP/USD pair might then accelerate the momentum and aim back to reclaim the 1.3900 mark. Some follow-through buying beyond September monthly swing highs, around the 1.3915 region, will be seen as a fresh trigger for bullish traders and push the pair towards the 1.3960-65 region.
On the flip side, any meaningful slide below the 1.3800 round figure might still be seen as a buying opportunity. This should help limit the downside near the overnight swing lows, around the 1.3735-30 area, which is followed by the 1.3700 mark, or the lower end of the ascending channel.
A convincing break below will negate the positive bias, rather shift the bias in favour of bearish traders and prompt aggressive technical selling. The subsequent downfall has the potential to drag the GBP/USD pair to intermediate support near mid-1.3600s en-route the 1.3600 mark.
GBP/USD daily chart
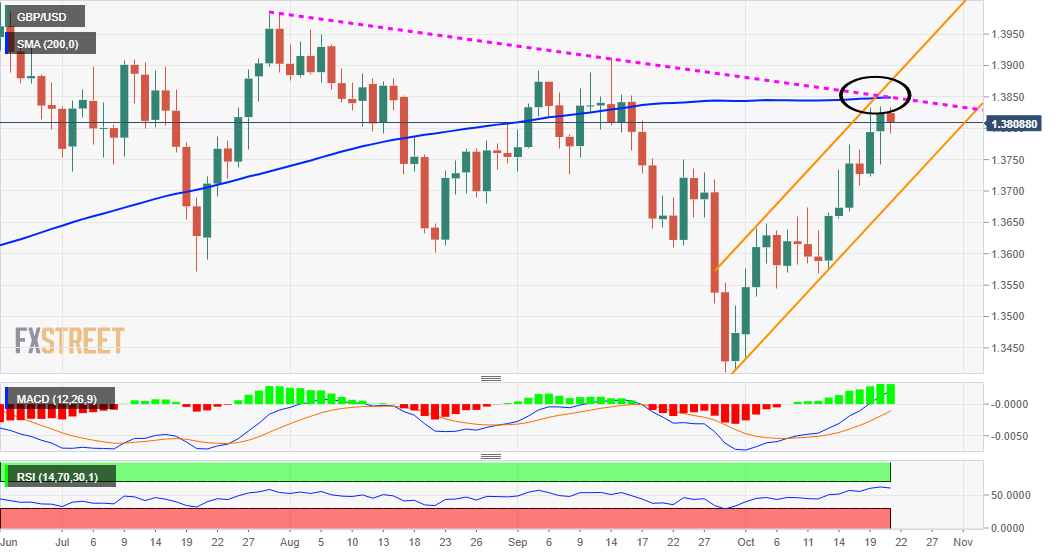
Technical levels to watch
UOB Group’s FX Strategists believe USD/CNH could still grind lower to the 6.3525 level in the next weeks.
Key Quotes
24-hour view: “Our expectations for USD to ‘weaken further’ yesterday were incorrect as it traded between 6.3733 and 6.3950. We still detect a weak underlying tone and we see room for USD to edge lower. That said, any decline is unlikely to break Tuesday’s low of 6.3685. Resistance is at 6.3960 followed by 6.4040.”
Next 1-3 weeks: “Our view from yesterday (20 Oct, spot at 6.3780) still stands. As highlighted, while the outsized sell-off on Tuesday is overdone, there is scope for USD to drop to May’s low near 6.3525. Looking ahead, USD has to close below this support before further weakness can be expected. The downside risk is intact as long as USD does not move above the ‘strong resistance’ level at 6.4200.”
- DXY regains some composure and retests 93.70.
- US 10-year yields faltered above 1.67% once again.
- Weekly Claims, Philly Fed Index next of note in the docket.
The greenback, in terms of the US Dollar Index (DXY), looks to finally regain some buying interest and leave behind the ongoing multi-session negative streak.
US Dollar Index focuses on yields and data
The index posts modest gains early in the European morning following six consecutive daily pullbacks. The moderate leg lower has so far met quite decent contention around the 93.50 zone.
Price action around the dollar has been under pressure on the back of the firm improvement in the risk complex in past sessions, while the lack of sustainability in the recent move higher in US yields also added to the downside in the buck.
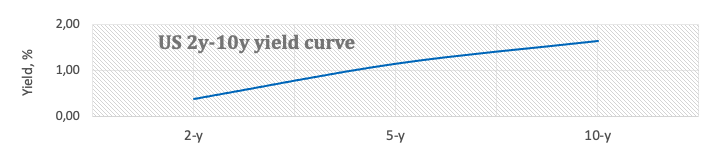
Later in the US calendar, Initial Claims and the Philly Fed Index will take centre stage seconded by the CB Leading Index, Existing Home Sales and the speech by FOMC’s Governor C.Waller (permanent voter, centrist).
What to look for around USD
The leg lower in the index has so far met support around 93.50 so far this week. The corrective move in the dollar came in response to the repricing of several central banks particularly in light of elevated inflation and the firm improvement in the risk complex. Supportive Fedspeak, an anticipated start of the tapering process, higher yields and the rising probability that high inflation could linger for longer remain as the exclusive factors behind the constructive outlook for the buck in the near-to-medium term.
Key events in the US this week: Claims, Philly Fed Index, CB Leading Index, Existing Home Sales (Thursday) – Flash Manufacturing PMI (Friday).
Eminent issues on the back boiler: Persistent uncertainty around Biden’s multi-billion Build Back Better plan. US-China trade conflict under the Biden’s administration. Tapering speculation vs. economic recovery. Debt ceiling debate. Geopolitical risks stemming from Afghanistan.
US Dollar Index relevant levels
Now, the index is gaining 0.05% at 93.64 and a break above 94.17 (weekly high Oct.18) would open the door to 94.56 (2021 high Oct.12) and then 94.74 (monthly high Sep.25 2020). On the flip side, the next down barrier emerges at 93.49 (monthly low October 21) followed by 93.24 (55-day SMA) and finally 92.98 (weekly low Sep.23).
- NZD/USD witnessed a modest pullback from multi-month tops touched earlier this Thursday.
- A softer risk tone, elevated bond yields benefitted the safe-haven USD and exerted pressure.
- Rising bets for an additional RBNZ rate hike warrants caution for aggressive bearish traders.
The NZD/USD pair extended its retracement slide from multi-month lows and was last seen hovering near the lower end of the daily trading range, around the 0.7175 region.
Having climbed to the highest level since June 11 earlier this Thursday, the NZD/USD pair witnessed an intraday turnaround from the 0.7220 area amid a modest pickup in the US dollar demand. Fresh worries about a credit crunch in China's real estate sector tempered investors' appetite for perceived riskier assets. This, in turn, assisted the safe-haven USD to stage a modest bounce from over three-week lows and prompted some long-unwinding around the major.
The heavily indebted China Evergrande Group said on Wednesday that a $2.6 billion deal to sell the controlling stake in its property management business failed. The development took its toll on the global risk sentiment, which was evident from a generally weaker tone around the equity markets. Apart from this, the recent runaway rally in the US Treasury bond yields was seen as another factor that acted as a tailwind for the greenback.
The US bond yields have been scaling higher since late September amid prospects for an early policy tightening by the Fed. The FOMC meeting minutes released last Wednesday reaffirmed that the Fed remains on track to begin rolling back its massive pandemic-era stimulus as soon as November. The markets have also been pricing in the possibility of an interest rate hike in 2022 amid worries about a faster than expected rise in inflation.
That said, this week's US macro releases – Industrial Production and housing market data – pointed to weakening economic activity and moderated expectations for a more aggressive policy response by the Fed. This could keep a lid on any meaningful gains for the greenback and lend some support to the NZD/USD pair. This warrants some caution for bearish traders amid rising bets that the RBNZ will hike interest rates further to contain stubbornly high inflation.
Moreover, Thursday's pullback could still be attributed to some profit-taking against the backdrop of the recent strong rally of over 300 pips from the vicinity of the 0.6900 mark touched on October 13. This further makes it prudent to wait for a strong follow-through selling before confirming that the NZD/USD pair has topped out in the near term and positioning for any meaningful corrective slide.
Market participants now look forward to the US economic docket – featuring the releases of the Philly Fed Manufacturing Index and the usual Weekly Initial Jobless Claims. This, along with a scheduled speech by Fed Governor Christopher Waller and the US bond yields, might influence the USD later during the early North American session. Traders will further take cues from the broader market risk sentiment to grab some opportunities around the NZD/USD pair.
Technical levels to watch
- USD/CAD snaps a two-day downtrend as USD attempts a bounce.
- Risk-off mood extends into Europe amid renewed China Evergrande fears.
- WTI retreats from seven-year tops, undermines CAD, supporting the pair.
USD/CAD is staging a decent comeback from four-month lows of 1.2289, heading towards 1.2350, in response to a broad-based rebound in the US dollar.
The greenback is finding its feet against its major rivals, bouncing from three-week lows, as the risk appetite takes a hit amid the re-emergence of China Evergrande default fears after the indebted property development giant failed to clinch a property sale deal with Hopson Development Holdings.
Further, global energy crunch combined with rising inflationary pressures continues to sap investors’ confidence, putting a floor under the greenback’s recent corrective decline.
On the other hand, the risk-off market profile is weighing negatively on the higher-yielding WTI, as it retreats from fresh seven-week highs of $83.71, currently down 0.70% at $82.80. The pullback in oil prices is weighing on the resource-linked loonie, aiding the recovery in the currency pair.
Despite the rebound, risks remain skewed to the downside for USD/CAD, as hotter Canadian inflation data fans sooner-than-expected rate hike bets from the Bank of Canada (BOC). The country’s annual Consumer Price Index (CPI) rose by 4.4% in September vs. 4.3% expected.
Next of relevance for the major remains the US weekly Jobless Claims data and Fedspeak while the sentiment on the Wall Street will be closely followed amid the Q3 earnings season.
USD/CAD: Technical levels to watch out
China’s Commerce Ministry said in a statement on Thursday, Washington and Beijing should work together to create conditions for the implementation of the phase one trade deal.
This comes after Bloomberg report earlier on, “China’s goods imports from the US have only reached about 53% of the $200 billion worth of additional products and services it promised to buy under the trade deal signed last year.”
Market reaction
Amid growing China Evergrande worries, the US-Sino trade deal anxiety adds to the downside in the aussie.
AUD/USD is trading at 0.7486, down 0.37% on the day, at the time of writing. The spot hit multi-month highs at 0.7547 in early Asia.
Bank of England’s (BoE) expectations (as seen through SONIA futures) and the GBP took a dip after the miss in UK CPI on Wednesday. GBP/USD may move downward if this view persist, economists at OCBC Bank report.
1.3850 to cap the cable
“The GBP may struggle should the UK CPI miss turn into a catalyst for the market to turn more sane over expected BoE rate hikes.”
“1.3850 should cap the GBP/USD for now.”
“First downside targets at 1.3700/10.”
- USD/JPY edged lower for the second successive day amid reviving safe-haven demand.
- Renewed worries about China’s property sector extended support to the safe-haven JPY.
- Elevated US bond yields underpinned the USD and might help limit losses for the major.
A modest pickup in demand for the safe-haven JPY dragged the USD/JPY pair back closer to weekly lows, just below the 114.00 mark during the first half of the trading action on Thursday.
The pair extended the overnight retracement slide from the 114.70 region, or near four-year tops and edged lower for the second successive day. Investors turned cautious amid fresh worries about a credit crunch in China's real estate sector. This, in turn, drove some haven flows towards the Japanese yen and acted as a headwind for the USD/JPY pair.
The heavily indebted China Evergrande Group said on Wednesday that a $2.6 billion deal to sell the controlling stake in its property management business failed. The development raised concerns that the troubled property giant could officially go into default following the expiry of a 30-day grace period to make a dollar bond coupon payment over the weekend.
The market reaction, so far, has been limited amid reports that Evergrande has won a more than a three-month extension to the maturity of a $260 million bond. Moreover, Chinese officials that the trouble in the sector would not be allowed to escalate into a full-blown crisis. This, along with a modest US dollar rebound, might help limit losses for the USD/JPY pair.
The USD drew some support from elevated US Treasury bond yields, though lacked bullish conviction amid moderation of Fed rate hike expectations. This week's dismal US macro releases – Industrial Production and housing market data – pointed to weakening economic activity and forced investors to trim their bets for an early policy tightening by the US central bank.
This was further reinforced by the overnight comments from Fed Governor Randal Quarles, saying that that it would be premature to start raising interest rates in the face of high inflation that is likely to recede next year. Quarles, however, reaffirmed that it is time for the Fed to begin dialling down its massive pandemic-era bond-buying program.
Given the recent strong rally witnessed over the past one month or so, the mixed fundamental backdrop turned out to be a key factor that prompted traders to lighten their bullish bets. That said, it will still be prudent to wait for a strong follow-through selling before confirming that the USD/JPY pair has topped out and placing aggressive bearish bets.
Market participants now look forward to the US economic docket – featuring the releases of the Philly Fed Manufacturing Index and the usual Weekly Initial Jobless Claims. This, along with a scheduled speech by Fed Governor Christopher Waller and the US bond yields, might influence the USD. Traders will further take cues from the broader market risk sentiment to grab some short-term opportunities around the USD/JPY pair.
Technical levels to watch
USD/JPY has not closed above the 114.55 October 2018 peak. Subsequently, Karen Jones, Team Head FICC Technical Analysis Research at Commerzbank, looks for profit-taking – a retracement to the uptrend at 113.21 is expected.
Bullish bias while above the 113.21 uptrend
“USD/JPY has still not yet closed above the 114.55 October 2018 high, and we have a number of warning signals intraday. We would allow for a retracement towards 113.21 the short-term uptrend ahead of further strength.”
“Above 114.55 we have 115.60, the 61.8% retracement of the move down from 2015 and then the 117.06 the 1998-2021 resistance line.”
“The market stays bid above the accelerated uptrend at 113.21 and this guards 111.66 July high and 110.80 the mid-August high.”
EUR/USD closed firmer but was limited 1.1660. The pair seems to have gone into a consolidation phase around mid-1.1600s and would need to break above 1.1700 to see further gains, economists at OCBC Bank report.
Break below 1.1580 needed to negate upward momentum
“The inability to retest 1.1660/80 highs may put the bulls off somewhat, but a deeper retracement below 1.1580 may be needed to completely negate upward momentum.”
“Accelerated upward extension seen if 1.1700 breaks.”
“ECB’s Weidmann, possibly the most hawkish member, to resign – leaving any remnant hawkish camp within the ECB weakened further.”
The US dollar is the dominant international reserve currency, which gives the United States the privilege of issuing a reserve currency. But could the appeal of the dollar decline sharply, which would create a serious problem in financing the US? Such a decline in the appeal of the dollar could have several causes, economists at Natixis report.
The risk of a loss of the fiscal and external solvency of the US
“The US is characterised by twin deficits: fiscal deficit and external deficit. Investors may therefore be concerned about a parallel trend of loss of fiscal solvency and loss of external solvency. This concern appeared already from 2002 to 2008 and caused a sharp decline in the dollar’s exchange rate.”
A structural deterioration in the situation of the US economy
“In particular in the US, there has been a decline in productivity gains and in the participation rate, which we calculate in the same way in the US and the eurozone, and which may result from low skills, leading to the prospect of a marked decline in potential growth. Moreover, a policy of reducing dominant positions in the US would have the effect of pushing down share prices and reducing the attractiveness of the US for equity investors.”
The decline in the diplomatic and military role of the US
“Especially after the withdrawal from Afghanistan, and the US’ refusal now to intervene in other countries' organisation and political choices as long as they are not a threat to the US.”
The greater credibility of the euro
“The development of more cooperative policies between eurozone countries may result in Europeans’ savings financing investments in the eurozone instead of being lent to the rest of the world, particularly to the US.”
FX option expiries for October 21 NY cut at 10:00 Eastern Time, via DTCC, can be found below.
- EUR/USD: EUR amounts
- 1.1500 420m
- 1.1700 338m
- 1.1735 1.5b
- GBP/USD: GBP amounts
- 1.3550 429m
- USD/JPY: USD amounts
- 115.30 610m
- AUD/USD: AUD amounts
- 0.7395-0.7400 807m
- 0.7470-75 727m
- 0.7500 371m
- USD/CAD: USD amounts
- 1.2650 1b
- NZD/USD: NZD amounts
- 0.6775 2.3b
- 0.6950 2b
- EUR/GBP: EUR amounts
- 0.8460 610m
- 0.8550 801m
On Thursday, gold price added to Wednesday’s gains and hit four-day highs at $1789 before reversing slightly. Will XAU/USD find acceptance above channel hurdle at $1791? In the view of FXStreet’s Dhwani Mehta, the upside bias still remains in place in the near-term.
XAU/USD looks to retest rising channel hurdle
“China Evergrande's fears combined with the ongoing surge in the Treasury yields will likely limit the gold advance, as the sentiment will lead the way amid a lack of significant US economic release. Also, hawkish signals from the world’s major central banks could also keep a lid on the non-interest-bearing gold.”
“Immediate upside in gold price is seen capped at the rising trendline resistance at $1791. A sustained break above the latter will yield an upside breakout from the channel, opening doors towards the previous week’s high of $1801.”
“The bull cross, represented by the 21-Simple Moving Average (SMA) having cut the 50-SMA from above, adds credence to some additional gains.”
“Selling resurgence could see gold price falling back towards the confluence of the 21 and 50-SMAs at $1775. The next relevant downside target is aligned at the rising trendline support at $1771.”
See
EUR/JPY is near the June high of 134.12. Karen Jones, Team Head FICC Technical Analysis Research at Commerzbank, would allow for some profit-taking ahead of the June high of this level.
EUR/JPY targets the 137.51 2018 high in the long-term
“EUR/JPY is approaching the 134.12 June peak and this is expected to hold the initial test. We would allow for a near-term corrective set back.”
“Longer-term, a break above the June peak is favoured, and will introduce scope to 137.51.”
“Dips should find initial support at 130.74/46, the September highs and 128.74, the 6th October low and the 127.94/50, August and September lows and the February 2019 high.”
In its Financial System Report published on Thursday, the Bank of Japan (BOJ) said that Japan's financial system is stable as a whole though pandemic is having a big impact on the economy and finance.
Additional takeaways
Financial institutions in good shape as a whole, financial intermediation functioning smoothly.
Japan's financial system is likely to remain highly robust even in resurgence of covid-19, adjustment in global financial markets.
In event of substantial, rapid market adjustment, deterioration in financial institutions' soundness could pose further downward pressure on economy.
Attention should be paid to developments in real estate industry which increased lending since pre-pandemic.
Credit risk of overseas loans generally contained, but signs of deterioration in some portfolios severely affected by pandemic.
Potential destabilisation of foreign currency funding among risks to Japan’s financial system.
Even after pandemic subsides, low interest rates and structural factors will continue to exert downward pressure on financial institutions' profits.
Market reaction
USD/JPY is dropping to test 114.00, as the US Treasury yields recede gains amid worsening market mood. The spot was last seen trading at 114.01, down 0.20% on the day.
UOB Group’s FX Strategists remain of the view that USD/JPY still targets the 115.00 level in the near term.
Key Quotes
24-hour view: “Yesterday, we highlighted that ‘while USD moved above 114.55 during early Asian hours, upward momentum is not that strong and the next major resistance at 115.00 is unlikely to come under threat’. USD subsequently eased off to 114.06 before settling little changed at 114.26 (-0.09%). Upward pressure has eased and the current movement is viewed as part of a consolidation. In other words, USD is likely to trade sideways for today, expected to be between 114.00 and 114.55.”
Next 1-3 weeks: “There is not much to add to our update from yesterday (20 Oct, spot at 114.50). As highlighted, the focus now is at 115.00 even though deeply overbought conditions suggest that the odds for a sustained advance above 115.00 are not high. On the downside, a breach of 113.75 (no change in ‘strong support’ level from yesterday) would indicate that the USD strength that started about 2 weeks ago (see annotations in the chart below) has come to an end.”
Here is what you need to know on Thursday, October 21:
The risk-positive market environment makes it difficult for the dollar to find demand in the second half of the week but rising US Treasury bond yields continue to help the currency limit its losses against its major rivals. Ahead of mid-tier data releases from the US - weekly Initial Jobless Claims, Existing Home Sales and Philadelphia Fed Manufacturing Survey, the US Dollar Index holds above 93.50.
Macro data: The data from the euro area showed on Wednesday that the annual Consumer Price Index remained steady at 3.4% in September as expected. In Canada, the CPI climbed to 4.4% from 4.1% and beat the market expectation of 4.3%. The Federal Reserve's Beige Book showed that the US economy continued to grow at a "modest to moderate" pace in September and early October. “Many firms raised selling prices indicating a greater ability to pass along cost increases to customers amid strong demand,” the publication further revealed.
Wall Street: The S&P 500 Index gained 0.37% and stays within a touching distance of the record-high it set at 4,545 in early September. The Dow Jones Industrial Average rose 0.43% and the Nasdaq Composite closed virtually unchanged. It's also worth noting that US stocks futures are down between 0.3% and 0.4% in the early European session, suggesting that investors could look for an opportunity to book their profits ahead of the weekend. Additionally, the Nikkei 225 Index is down more than 1.5%. Meanwhile, Reuters reported that the Chinese real-estate giant Evergrande secured an extension on the defaulted $260 million worth of bonds.
The benchmark 10-year US Treasury bond yield, which closed the previous four days in the positive territory, is staying relatively quiet around 1.65%.
EUR/USD's slightly bullish bias remains intact but the pair seems to have gone into a consolidation phase around mid-1.1600s. The dollar's market valuation is likely to remain the primary driver of the pair's action.
GBP/USD staged a downward correction after the CPI data from the UK arrived below analysts' estimate but managed to return to 1.3800 area. The Bank of England's rate hike expectations support the British pound.
Once again, AUD/USD and NZD/USD capitalized on risk flows on Wednesday and registered impressive gains. A negative shift in market sentiment could trigger an overdue correction in those pairs.
Gold rose 0.7% on Wednesday and clings to small gains above $1,780 on Thursday. Key resistance for XAU/USD aligns at $1,800 and a daily close above that level could bring in additional buyers.
Cryptocurrencies: Bitcoin reached a new record high of $67,000 on Wednesday and edged lower toward $65,000 on Thursday. Institutional demand following the introduction of the first BTC ETF is expected to increase and support Bitcoin. Ethereum also capitalized on the upbeat sentiment surrounding cryptocurrencies and broke above $4,000.
AUD/USD’s rally has reached the 55-week ma at 0.7516, an interim target. Karen Jones, Team Head FICC Technical Analysis Research at Commerzbank, expect the aussie to correct lower in the short-term.
AUD/USD to see some profit taking around the 0.7516/0.7565 region
“AUD/USD’s rally has reached the 55-week ma at 0.7516, above here lies the 200-day ma 0.7565. We would expect to see some profit taking in this vicinity and have already covered long positions.”
“Very near-term we would allow for a small retracement.”
“The seven-month resistance line lies at 0.7625.”
“Dips should find interim support at 0.7427 the 4th August high and 0.7338 (20-day ma) and this guards the 29th September low at 0.7171.”
- AUD/USD reverses from three-month top, snaps two-day uptrend.
- Overbought RSI probes bulls below 200-DMA, sellers need monthly support line break to retake controls.
AUD/USD takes offers around 0.7500, down 0.21% intraday amid early European session on Thursday, following its run-up to the fresh high since July.
In doing so, the Aussie pair marks the heaviest daily losses in a week, not to forget mentioning that it snaps a two-day uptrend by the press time.
The pullback moves could be linked to the overbought RSI conditions as well as failures to cross the 200-DMA, around 0.7565 at the latest.
It should be noted, however, that the AUD/USD bears are less likely to be welcomed until the quote stays beyond an ascending support line from September 30, near 0.7425.
Also acting as immediate support is September’s high close to 0.7480.
Alternatively, an upside clearance of the 200-DMA level of 0.7564 will aim for late June’s top surrounding 0.7615-20.
However, any further advances will be questioned by the June 03 low near 0.7645.
AUD/USD: Daily chart
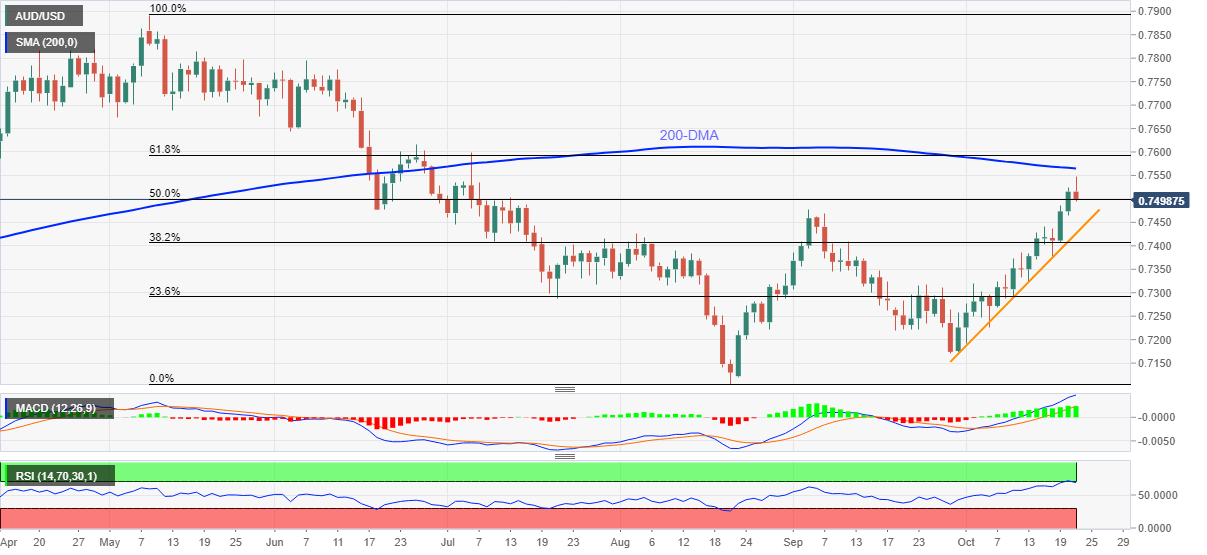
Trend: Pullback expected
- Gold pares weekly gains, eases from intraday high of late.
- Mixed headlines concerning China, firmer US Treasury yields confuse traders.
- US PMIs, risk catalysts in focus for fresh impulse.
- Extreme ratios point to gold and silver price readjustments
Gold (XAU/USD) eases from weekly top to $1,783, up 0.07% intraday as European traders brace for Thursday’s bell.
The yellow metal initially cheered the US dollar weakness to print a three-day high, also benefited from the bullish chart pattern. However, recently mixed catalysts probe the gold buyers afterward.
Firmer equities and hopes of US stimulus backed the US dollar weakness the previous day. Following that, an absence of fresh catalysts, despite Fed tapering chatters from Federal Reserve Governor Randal Quarles and Cleveland Fed President Loretta Mester, failed to recall USD bulls.
However, the recently mixed headlines concerning China’s Evergrande and risk emanating from Beijing’s stressed property market seem to probe the gold buyers of late.
That said, the US Dollar Index (DXY) benefits from the consolidation in the market sentiment, despite printing a seven-day downtrend to a fresh three-week low near 93.50, around 93.60 by the press time. It’s worth noting that the US 10-year Treasury yields retreat after refreshing a five-month high, recently up 1.8 basis points (bps) to 1.65%.
Moving on, risk catalysts and the second-tier US data concerning jobs and activities may entertain gold traders ahead of Friday’s preliminary readings of October PMIs. Overall, gold prices remain in the bearish consolidation mode unless the Fed tapering chatters wane, which becomes less likely considering the firmer US data and reflation fears.
Technical analysis
Multiple hurdles since early September probes gold buyers even as the golden cross, an upside break of 50-SMA to 200-SMA, favors the metal buyers.
Hence, a clear run-up beyond the $1,791 hurdle, also including 61.8% Fibonacci retracement (Fibo.) of September’s fall, becomes necessary for the gold bulls to justify the stated golden cross pattern.
Following that, the monthly peak near the $1,800 threshold adds to the upside filters before flagging the run-up towards the $1,834 key hurdle, tested twice since July.
On the flip side, the weekly rising trend line and 200-SMA, near $1,770 by the press time, restricts short-term declines of the gold prices.
In a case where gold sellers manage to conquer the $1,770 support convergence, multiple levels around $1,745 and $1,730 may entertain them ahead of the last monthly low near $1,721.
Gold: Daily chart
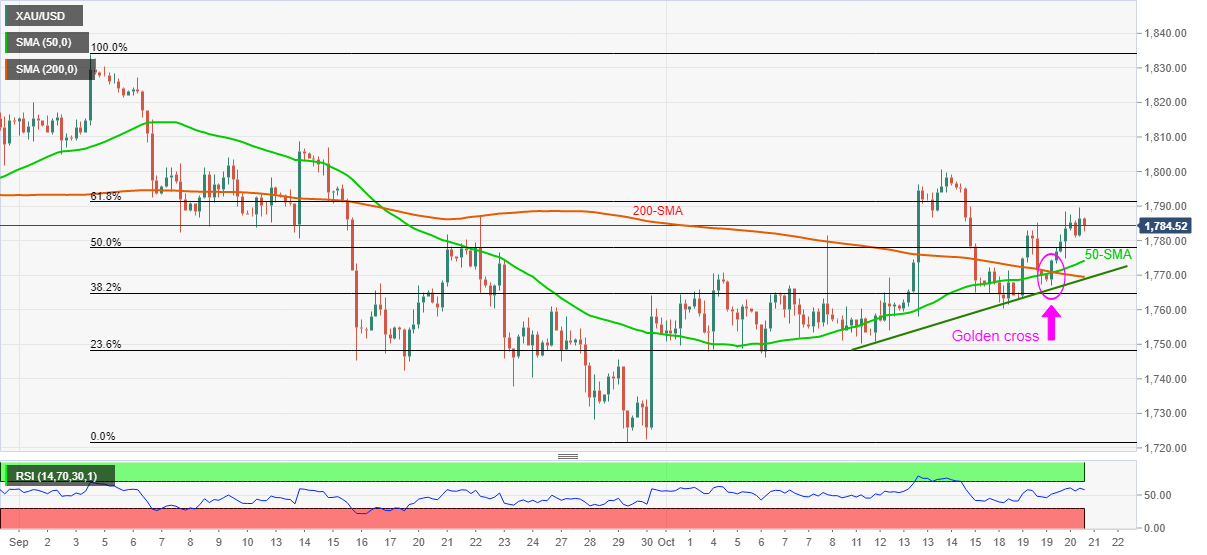
Trend: Further recovery eyed
In light of advanced prints from CME Group for natural gas futures markets, open interest dropped for the fourth consecutive session on Wednesday, this time by around 3.8K contracts. In the same line, volume went down for the third straight day, this time by around 37.4K contracts.
Natural Gas: Downside remains supported near $4.70
Wednesday saw another uptick in prices of natural gas, although this was amidst diminishing open interest and volume. That said, the current recovery in prices of the commodity appears out of favour in the very near term, while the continuation of the downtrend is still expected to meet some contention around the $4.70 region per MMBtu.
According to FX Strategists at UOB Group, NZD/USD could climb to the 0.7245 level in the near term.
Key Quotes
24-hour view: “Yesterday, we held the view that ‘the rapid rise in NZD could test 0.7180 first before easing’. We did not anticipate the strong surge that easily blew past 0.7180 as NZD soared to 0.7208. Robust momentum indicates that further NZD strength would not be surprising but overbought conditions suggest 0.7245 could be out of reach for today (there is another resistance at 0.7220). Support is at 0.7185 followed by 0.7160.”
Next 1-3 weeks: “We highlighted yesterday (20 Oct, spot at 0.7155) that conditions remain overbought but strong momentum suggests there is room for NZD to test the next major resistance at 0.7200. However, we did not anticipate the rapid manner by which NZD moved above 0.7200 (NZD rose to 0.7208 during NY session). Conditions remain overbought but strong momentum indicates that NZD could strengthen further to 0.7245. That said, it is left to be seen if NZD could maintain the current pace of advance. Overall, the NZD strength that started late last week is deemed intact as long as the ‘strong support’ at 0.7125 (level was at 0.7080 yesterday) is not breached.”
CME Group’s preliminary figures for crude oil futures markets noted traders added around 4.2K contracts to their open interest positions on Wednesday, reversing at the same time two consecutive daily drops. Volume, instead, shrank for the second straight session, now by around 90.8K contracts.
WTI looks for a breakout of $84.00
Wednesday’s decent gains in prices of the WTI were against the backdrop of increasing open interest, which is indicative that further gains remain on the cards. Against that, the rally in crude oil is unlikely to subside for the time being and immediately targets the $84.00 mark and above.
Early Thursday morning, global rating agency Fitch came out with an update on the risks emanating from China’s property market stress.
“China’s attempts to preserve strengthened risk controls over the property sector without magnifying a growth slowdown illustrate the difficult trade-offs its policymakers are facing,” said Fitch.
The rating agency adds, “Stress could spread to other parts of the economy and the financial system if policy easing is too cautious. However, a substantial loosening of credit conditions could raise system leverage and set back efforts to control financial risks.”
Key quotes
Contagion has surfaced across parts of China’s homebuilding sector, triggered by the distress of Evergrande and aggravated by subsequent credit events involving other developers.
We believe our current growth forecasts of 8.1% in 2021 and 5.2% in 2022 remain broadly intact given our expectations of the policy response outlined above.
FX implications
Following the news, AUD/USD reverses the early Asian session gains while declining towards 0.7500, down 0.15% on a day.
Also read: REDD: China Evergrande secures extension on defaulted $260 million bond
The outlook for Cable remains constructive with the next target at 1.3850 and beyond in the short-term horizon, suggested FX Strategists at UOB Group.
Key Quotes
24-hour view: “Yesterday, we expected GBP to ‘trade sideways within a 1.3765/1.3830 range’. However, GBP dropped to 1.3743 before rebounding sharply to 1.3833 during NY hours. Despite the rebound, upward momentum has not improved by all that much. However, there is room for GBP to edge above 1.3850. For today, the next major resistance at 1.3915 is not expected to come into the picture. Support is at 1.3790 followed by 1.3755.”
Next 1-3 weeks: “Our narrative from yesterday (20 Oct, spot at 1.3795) still stands. As highlighted, GBP is still strong and an advance to 1.3850 would not be surprising. While GBP is likely to break 1.3850, upward momentum is not that strong for now and 1.3915 may not come into the picture so soon. Overall, the GBP strength that started last Thursday (14 Oct, spot at 1.3665) is deemed intact as long as GBP does not move below 1.3720 (no change in ‘strong support’ level from yesterday).”
Having failed to clinch a property sale deal with Hopson Development Holdings, China’s Evergrande finally had good news to share.
Reuters rely on REDD updates on Thursday morning while saying, “China Evergrande Group has secured an extension on a defaulted bond, offering rare respite to the developer a day after a deal to sell a $2.6 billion stake in its property services unit failed.
“Evergrande has won a "more than three-month" extension to the maturity of a $260 million bond issued by joint venture Jumbo Fortune Enterprise and guaranteed by Evergrande beyond Oct. 3, after agreeing to provide extra collateral,” adds Reuters.
FX implications
The news should have ideally helped Asian stocks but firmer US Treasury yields weigh on the equities and stock futures by the press time.
Read: S&P 500 Futures ease from six-week high as Treasury yields refresh multi-day top
Open interest in gold futures markets increased for the second session in a row on Wednesday, this time by nearly 1.3K contracts considering flash data from CME Group. In the same direction, volume went up by around 13.4K contracts.
Gold still targets the $1,800 mark
Gold prices extended the weekly rebound on Wednesday and advanced to 2-day highs. The uptick in prices of the precious metal was amidst increasing open interest and volume, allowing for the continuation of the uptrend in the very near term at least. On the upside, the next target remains at the key barrier at the $1,800 mark per ounce troy.
- USD/INR struggles to keep rebound from two-week low.
- India vaccinates 1.0 billion population, US stimulus in the pipeline.
- US Treasury yields fail to underpin greenback strength despite Fed tapering chatters.
USD/INR fades bounce off a fortnight low, mildly bid around 74.87 heading into Thursday’s European session. The Indian rupee (INR) pair snaps two-day downtrend despite firmer fundamentals from India, the reason could be linked to the broad US dollar weakness.
India officially vaccinated over 1.0 billion people and takes a sigh of relief from the pandemic risk, at least for now. In addition to the strong jabbing, recent declines in the COVID-19 numbers and the virus-led data also favor the INR bulls. As per the latest data, coronavirus fatalities eased from 197 to 160 whereas the active cases dropped the most in a day since March the previous day.
On the other hand, the US Dollar Index (DXY) fails to benefit from the consolidation in the market sentiment, printing a seven-day downtrend to a fresh three-week low near 93.50 by the press time. That being said, the US 10-year Treasury yields remain firm around 1.67%, up three basis points (bps) to refresh the highest levels since May.
It should be noted that Evergrande’s ability to secure a one-month extension to the defaulted $260 million bond contrasts trade-off risk emanating from China’s property stress cited by the global rating agency Fitch to confuse traders. Tapering signals from Federal Reserve Governor Randal Quarles and Cleveland Fed President Loretta Mester have been the latest to pump the US 10-year Treasury yields.
As a result, USD/INR traders should wait for a clear direction and hence Friday’s preliminary reading of October’s activity numbers will be the key catalysts to watch.
Technical analysis
Unless crossing a seven-day-old descending resistance line near 75.15, USD/INR bears remain directed towards an upward sloping support line from early September, around 74.50 by the press time.
In opinion of FX Strategists at UOB Group, EUR/USD could be headed to the 1.1680 level in the next weeks.
Key Quotes
24-hour view: “We highlighted yesterday that ‘the rapid pullback from the high coupled with overbought conditions indicates that EUR is unlikely to strengthen further’ and we expected EUR to ‘trade sideways between 1.1605 and 1.1655’.EUR subsequently traded between 1.1615 and 1.1658. Upward momentum has improved just a tad and the bias for today is on the upside. That said, barring a surge in momentum, any advance is unlikely to challenge the major resistance at 1.1680. Support is at 1.1630 followed by 1.1615.”
Next 1-3 weeks: “Our view from yesterday (20 Oct, spot at 1.1630) still stands. As highlighted, EUR could consolidate for a couple of days first but it is likely to head to the next major resistance at 1.1680 later on. On the downside, a breach of 1.1590 (‘strong support’ level previously at 1.1570) would indicate that the EUR strength that started late last week has run its course. Looking ahead, if EUR breaks clearly above 1.1680, the next level to focus on is at 1.1710.”
- USD/TRY consolidates weekly losses near record top, sidelined of late.
- Fitch says Turkey’s ‘premature’ rate cut risks higher inflation.
- Turkish President Erdogan lauds global investor confidence in Turkey.
- CBRT is up for another rate cut, Turkish Consumer Confidence and US data important too.
USD/TRY picks up bids around $9.2430, up 0.33% intraday ahead of Thursday’s European session. In doing so, the Turkish Lira (TRY) pair pares weekly losses ahead of the key monetary policy meeting of the Central Bank of the Republic of Turkey (CBRT).
The pair’s rebound could be linked to the comments from the global rating agency Fitch. “Turkey's interest rate cut last month risks pushing inflation higher than Fitch Ratings' estimate of 17.2% by year end,” said Fitch per Reuters.
The news also mentions the fact that President Recep Tayyip Erdogan has abruptly ousted the last three central bank governors and last week he fired three bank policymakers including two seen to oppose the September rate cut.
It was additionally mentioned, “Sources close to the presidency have told Reuters that Erdogan had pushed for monetary stimulus for months with the aim of boosting lending, exports and jobs.”
Even so, Turkish President Erdogan said, per Reuters, “International investors place their trust in Turkey, believing in its potential and bright future. President Erdogan addressed the party members at the AK Party Adana Extended Provincial Consultative Meeting.”
The US Dollar Index (DXY), on the other hand, refreshes a three-week low amid market optimism and a lack of directives ahead of Friday’s preliminary reading of October’s PMI data.
Looking forward, USD/TRY moves rely on the CBRT Interest Rate Decision, expected 17.5% versus 18.0% prior. Also important will be Turkey’s monthly Consumer Confidence data for October, prior 79.7. Although its least expected that the CBRT will defy the market forecast of a rate cut any surprises won’t be taken lightly.
Following that, US Jobless Claims, Philadelphia Fed Manufacturing Index and Existing Home Sales may entertain the pair traders.
Technical analysis
Overbought RSI conditions challenge USD/TRY recovery towards the all-time high of $9.3765. On the contrary, the 10-DMA near $9.1670 offers immediate support.
The European Central Bank (ECB) is calling out banks to boost human and financial resources to enhance their post-Brexit operations in continental Europe, according to the latest story carried by the Financial Times (FT) on Thursday.
Key takeaways
“Bank executives, lawyers and supervisors all told the FT that the ECB is becoming increasingly forceful in its demands that lenders move more resources to the continent to run their European businesses in the aftermath of Brexit.”
“The fresh push is partly linked to the ECB’s recent decision to end temporary pandemic-era reprieves it granted banks on their timetable for moving staff and capital to the EU.
“One person familiar with the change said the ECB had been “realistic in light of the impediments to geographic moves, and granted extensions, but now that is over”.
Related reads
- GBP/USD sits at six-week highs above 1.3800 as US dollar licks its wounds
- UK economy to expand 5.0% in 2022 versus 5.5% September forecast – Reuters poll
- NZD/USD eases after refreshing four-month high, probes two-day uptrend.
- 61.8% Fibonacci retracement of February-August fall challenge bulls.
- September’s top restricts immediate downside ahead of 200-DMA.
- Overbought RSI also plays role in latest pullback.
NZD/USD drops back to 0.7200, taking a U-turn from a fresh multi-day high heading into Thursday’s European session.
In doing so, the Kiwi pair justifies overbought RSI conditions while stepping back from the 61.8% Fibonacci retracement level (Fibo.) of the quote’s downtrend from February to August 2021.
However, sellers are likely to wait for a downside break of the previous month’s high, near 0.7170, to take fresh entry.
Even so, 200-DMA and previous resistance line from February, respectively around 0.7100 and 0.7075, question NZD/USD declines.
On the contrary, a daily closing past 61.8% Fibo. of 0.7213 will head towards May’s top near 0.7315-20.
During the anticipated rally, RSI may play its role to portray intermediate pullbacks near 0.7280 and the 0.7300 levels.
NZD/USD: Daily chart
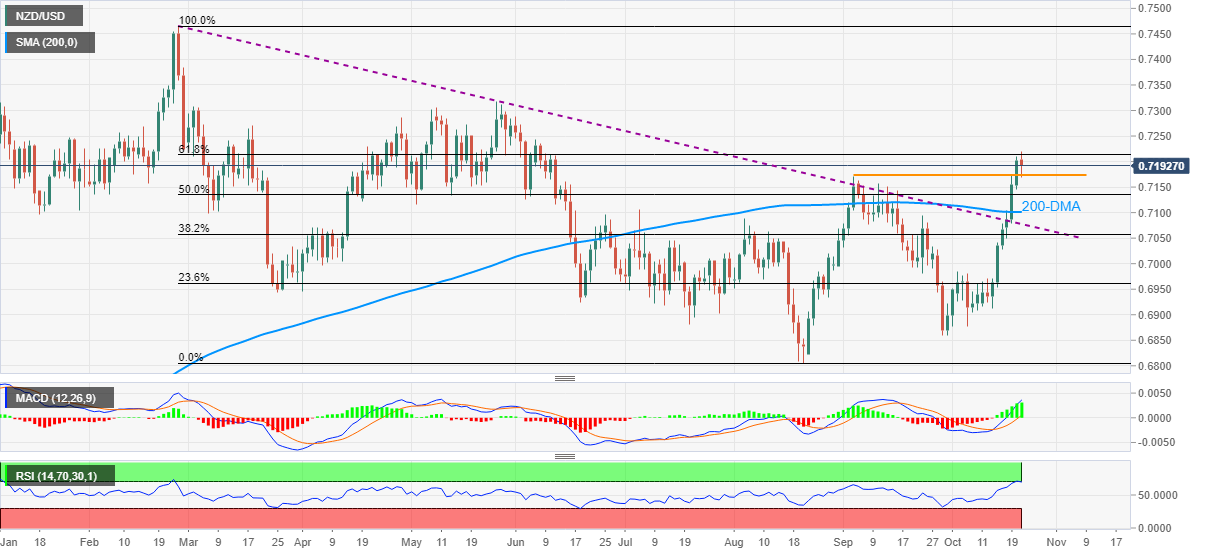
Trend: Pullback expected
- GBP/USD extends the recent uptrend to test six-week highs.
- The depressed US dollar underpins the cable amid firmer Treasury yields.
- Softer UK inflation shakes off Nov BOE rate hike bets, Brexit woes loom.
GBP/USD is holding higher ground above 1.3800, sitting at the highest levels in six weeks, as the US dollar licks its wounds amid a mixed market sentiment.
The US dollar is in a bearish consolidative mode across its main peers, extending its week-long correction from yearly tops of 94.56 reached last week, as investors continue to liquidate their long USD positions heading into a potential Fed’s tapering next month.
Further, strong US corporate earnings-induced record run on Wall Street indices add to the weight on the safe-haven dollar, boding well for higher-yielding currencies such as the cable.
Despite the upsurge, the bulls remain cautious amid the relentless rise in the US inflation expectations and Treasury yields. Meanwhile, looming Brexit concerns could also hamper GBP/USD’s run higher.
According to The Guardian, “a new report on trafficking in the UK has warned that Brexit and the Home Office’s new plan for immigration is increasing the risks to trafficking victims.”
Looking ahead, the dynamics in the US dollar and the yields will have a significant bearing on the major, as investors shrugged off an unexpected dip in the UK Consumer Price Index (CPI) in September, which arrived at 3.1% YoY vs. 3.2% expected.
Softer UK inflation doused the Bank of England (BOE) November rate hike expectations and briefly weighed on the pound a day before. Additionally, resurfacing concerns over a rising number of COVID-19 cases in the Kingdom also poses a threat to the pair’s upside.
Attention turns towards the US weekly Jobless Claims release and Fedspeak for fresh incentives on trading cable amid a relatively data-light week.
GBP/USD: Technical levels to consider
- EUR/USD prints seven-day uptrend, pokes monthly top of late.
- DXY keeps diverging from US Treasury yields amid Fed tapering, Evergrande headlines.
- ECB policymakers try to placate reflation fears but firmer data probes policy doves.
- Risk catalysts, second-tier US data and Eurozone Consumer Confidence eyed for fresh impulse.
EUR/USD flirts with the monthly high near the 1.1670 hurdle, taking rounds to 1.1665 ahead of Thursday’s European session. The major currency pair rises for the seventh consecutive day with this pattern as the US Dollar Index (DXY) refreshes a three-week low despite firmer Treasury yields.
The US Dollar Index (DXY) fails to benefit from the consolidation in the market sentiment, printing a seven-day downtrend to a fresh three-week low near 93.50 by the press time. That being said, the US 10-year Treasury yields remain firm around 1.67%, up three basis points (bps) to refresh the highest levels since May.
Tapering signals from Federal Reserve Governor Randal Quarles and Cleveland Fed President Loretta Mester have been the latest to pump the US 10-year Treasury yields. However, the same couldn’t help the EUR/USD sellers as firmer Euro-zone inflation figures dim the European Central Bank (ECB) policymakers’ efforts to tame the hawkish bets.
On Wednesday, the final reading of the bloc’s Consumer Price Index (CPI) for September grew past 0.4% initial estimate to 0.5% MoM while matching 3.4% forecasts. Following that, the ECB’s Francois Villeroy de Galhau and Pierre Wunsch tried their best to defy the monetary policy tightening but couldn’t convince markets.
It’s worth noting that US President Joe Biden’s attempts to convince markets of upcoming stimulus failed to recall the greenback buyers as upbeat equities derail the USD’s safe-haven demand.
Looking forward, US Jobless Claims, Philadelphia Fed Manufacturing Index and Existing Home Sales may entertain short-term EUR/USD traders ahead of the Eurozone’s preliminary Consumer Confidence data for October. Above all, Friday’s activity numbers and chatters surrounding the Fed, ECB and China will be the key for the pair. Additionally, the US Treasury yields should be watched carefully as a clear break of 1.70% triggered the US dollar rally in the past.
Technical analysis
EUR/USD needs a daily closing beyond 1.1670, comprising August lows, to aim for the September 22 swing bottom around 1.1685 and 50% Fibonacci retracement (Fibo.) of July-October upside near 1.1715. However, failures to do so may not necessarily recall the bears until the quote stays beyond 1.1615 support confluence including 21-DMA, as well as 23.6% Fibo.
- USD/CNH consolidates previous day’s rebound, confirms bearish chart pattern.
- 50-EMA guards immediate upside, convergence of 100-EMA, weekly resistance line becomes the key hurdle.
USD/CNH takes offers to $6.3850, confirming the bearish chart formation during early Thursday. In doing so, the Chinese currency (CNH) pair reverses the previous day’s rebound from the lowest since June.
Given the RSI line having a buffer before hitting the oversold territory, coupled with the rising wedge breakdown, USD/CNH may extend the latest south-run toward the recent multi-day low near $6.3685.
It’s worth noting that the yearly low surrounding $6.3525 will challenge the pair bears afterward, failing to do so can recall the year 2018 bottom close to $6.2360.
Meanwhile, 50-EMA near $6.3940 restricts corrective pullback ahead of the $6.4050-55 resistance confluence, including 100-EMA and a descending trend line from October 18.
Overall, USD/CNH remains in the bearish trajectory and the latest confirmation of the rising wedge adds strength to the seller’s view.
USD/CNH: Hourly chart
Trend: Further weakness expected
New Zealand’s Prime Minister Jacinda Ardern announced on Thursday, the South Island Pacific nation has clinched a historic Free Trade Agreement (FTA) with the United Kingdom.
Key details (via Xinhua News Agency)
“The FTA will see a boost of almost 1 billion NZ dollars (720 million US dollars) to New Zealand GDP and unprecedented access for Kiwi exporters to the British market.”
“The FTA will also see an elimination of all tariffs by Britain on New Zealand exports, with over 97 percent being removed the day the FTA comes into force.”
“The deal will also see significant increases for beef and sheepmeat market access.”
Separately, New Zealand Trade Minister Damien O'Connor said, “pre-COVID estimates also projected that New Zealand goods to Britain will increase up to 40 percent and that New Zealand GDP will benefit up to 970 million NZ dollars (699 million US dollars) due to the FTA.”
Market reaction
NZD/USD is holding higher ground amid a better appetite for riskier assets and the NZ-UK trade deal.
The spot is currently trading at 0.7213, adding 0.18% on the day.
| Raw materials | Closed | Change, % |
|---|---|---|
| Brent | 85.8 | 0.76 |
| Silver | 24.283 | 2.75 |
| Gold | 1781.868 | 0.72 |
| Palladium | 2065.1 | -1.7 |
“In case the US Federal Reserve alters its monetary policy stance, its impact on China's foreign exchange market is controllable,” Pan Gongsheng, Deputy Governor of the People's Bank of China (PBOC) said at the 2021 Annual Conference of Financial Street Forum held in Beijing.
more to come ...
Moody’s Investors Service, in its latest, underscored concerns over the ongoing supply-chain crisis in the US, adding that there seems no light at the end of the tunnel.
Key takeaways
Supply-chain headaches show no sign of subsiding just yet.
Early signs indicate another increase in the supply chain stress index for September.
Stress in US supply chains isn't abating.
None of the underlying measures are moving to show improvement.
It's likely to grow more slowly than previously forecast.
Risk the US economy barely registered any growth in Q3.
Related reads
- S&P 500 Futures ease from six-week high as Treasury yields refresh multi-day top
- DXY bears keep 93.20 on radar
- GBP/JPY remains sidelined around multi-day top during three-day uptrend.
- Treasury yields weigh on yen, UK-NZ trade deal gains criticism from Scotland.
- British covid conditions worsen, political imbalance feared in Japan.
GBP/JPY bulls flirt with five-year highs, defending the 158.00 threshold during early Thursday.
The cross-currency pair portrays broad Japanese yen (JPY) weakness due to the firmer US Treasury yields and political challenges in Tokyo. In doing so, the quote ignores downbeat UK data and qualitative factors like coronavirus and Brexit headlines from Britain.
Escalating doubts over Fumio Kishida’s future as Japanese Prime Minister (PM), as portrayed by the survey shared by Nikkei for October 31 elections, portrays political uncertainty in Japan. Also challenging the Asian nation is the acceptance of the energy challenges on hand by Japan's Industry Minister (Ministry of Economy, Trade and Industry).
On the other hand, the UK signs a landmark trade deal with New Zealand but Scotland highlights challenges for British farmers to criticize the pact. Also, cautious sentiment ahead of this week’s UK-EU meet in Brussels, to overcome the Brexit deal, challenges the British pound buyers. Additionally, the UK's National Health Service (NHS) warns to take another plan to tame the British covid infections as cases spike to daily high and the virus-led deaths jump to seven-month peak the previous day.
It’s worth mentioning that the UK’s inflation data came in softer than expected for September but the BOE’s rate hike expectations stay on the table, which in turn helps the GBP to remain firmer.
On a broader front, fears emanating from China’s Evergrande and Fed tapering underpin the US Treasury yields to remain firmer at the five-month top around 1.66%. The same weighs on the stock futures and yen.
Considering a lack of major data/events in both Japan and the UK, GBP/JPY traders need to track the US Treasury yields and risk catalysts for fresh direction ahead of Friday’s key PMI data and UK Retail Sales for September.
Technical analysis
Unless breaking the weekly support line around 157.55, not even short-term GBP/JPY sellers may take the risk of entries.
Markets are thinking twice about the contagion risks surrounding the embattled Chinese property company Evergrande. rescue efforts are being reported to have stalled and the property giant is seemingly on the brink of default.
The Guardian is warning of contagion through the country’s giant real estate sector, home prices and the economy.
''The problems enveloping Evergrande, which has eyewatering total debts of $305bn, have hung over global financial markets in recent weeks and helped curb China’s post-pandemic recovery,'' an article by the Guardian explained.
''But the crisis could deepen further if Evergrande fails to meet a deadline of Monday to stump up a $83.5m bond interest payment, triggering an official default.'
The article went on to say that ''Evergrande has already been given a 30-day grace period to make the repayment after missing the initial deadline back in September. It has since missed other key offshore, dollar-denominated bond payments worth another $193.3m. The clock is now ticking on those debts as well.''
Meanwhile, Reuters reported that in its Wednesday filing, ''Evergrande said it would continue to implement measures "to ease the liquidity issues" and would use best efforts to negotiate for the renewal or extension of its borrowings with its creditors.''
"In view of the difficulties, challenges and uncertainties in improving its liquidity, there is no guarantee that the group will be able to meet its financial obligations under the relevant financing documents and other contracts," it said.
Market implications
The Australian dollar has been a strong performer, shrugging off such risks of a Chinese economic meltdown. However, the nation is highly vulnerable to such an outcome and AUD/USD will take the brunt of it should traders acknowledge the hugely negative ramifications of Australia losing its Chinese export business.
So far, ''creditors have said there has been no contact from Evergrande despite weeks of effort on their behalf. Evergrande will officially be in default if it doesn't make an already overdue March 2022 bond coupon payment by Monday,'' Reuters reported.
- EUR/GBP maintains the bullish bias on Thursday in the Asian session.
- Additional losses for the pair if price decisively breaks 0.8430.
- The Momentum oscillator holds onto the oversold zone to hint at some correction on profit-booking.
EUR/GBP edges higher on Thursday in the Asian trading hours. The pair opened lower but swiftly recovered to higher levels. At the time of writing, EUR/GBP is trading at 0.8434, up 0.10% for the day.
EUR/GBP daily chart
-637703774057077617.png)
On the daily chart, the EUR/GBP cross currency pair fell sharply after testing the high of 0.8658 on September 29, this also constituted a double top formation with a high made on July 21. A double top candlestick technical formation is a bearish pattern. Furthermore, the spot slipped below the 21-day Simple Moving Average (SMA) at 0.8567 strengthening the case for the probable downside momentum. However, the price found shelter near the critical support around 0.8330.
Having said that, if the price breaks the intraday low, the immediate downside target would emerge at the February,2020 low at 0.8282. The Moving Average Convergence Divergence (MACD) slips below the midline with a bearish crossover. Any downtick in the MACD would accelerate selling pressure in the psir.
Alternatively, if the price reverses direction, it could move back to the 0.8460 horizontal resistance level . On a successful daily close above the mentioned level would bring Friday’s high at 0.8486 back into the picture followed by the psychological 0.8500 mark.
EUR/GBP additional levels
- S&P 500 Futures snap six-day uptrend to print mild losses around September high.
- US 10-year Treasury yields rise for the fifth consecutive day towards May’s top.
- Fed tapering chatters, China’s Evergrande consolidate market moves amid a quiet Asian session.
S&P 500 Futures portray the market’s cautious mood, down 0.18% intraday around 4,520 during early Thursday.
The risk barometer takes clues from the hawkish comments of the US Federal Reserve (Fed) policymakers and updates surrounding China’s struggling reality firm Evergrande to print mild losses, the first in the last six days.
Tapering signals from Federal Reserve Governor Randal Quarles and Cleveland Fed President Loretta Mester have been the latest to pump the US 10-year Treasury yields, probing the equity bulls. That said, the US 10-year Treasury yields remain firm around 1.66%, up two basis points (bps) to refresh the highest levels since May.
Also challenging the mood were the headlines concerning Evergande. Earlier in Asia, it was revealed by Bloomberg that Evergrande failed to seal the asset sale deal with Hopson Development Holdings. The firm’s shares are ready to go live in Hong Kong for the first time after October and hints at an over 10.0% fall in the beginning.
Elsewhere, China’s two hypersonic weapon tests also should have weighed on the equity futures while the Wall Street benchmarks flashed gains on upbeat earnings and hopes of US stimulus.
Read: US Stocks Forecast: Wall Street mixed as US yields take the spotlight
It should be noted that the US Dollar Index (DXY) fails to benefit from the consolidation in the market sentiment, printing a seven-day downtrend around 93.55 near the three-week low by the press time.
Moving on, the risk catalysts may entertain traders amid a light calendar ahead of the US session readings comprising weekly jobless claims and second-tier housing data, not to forget Fedspeak.
Japan’s Industry Minister Koichi Hagiuda warned on Thursday, “Japan's electricity supply vs. demand this winter is expected to be the tightest in a decade.”
Additional quotes
“LNG inventory held by major utilities as of October 15 was around 2.3 mln tonnes, up 0.7 mln tonnes from a year ago.”
“On electricity supply for winter, says minimum required reserve ratio of 3% has been secured. “
Market reaction
USD/JPY is little affected by the above headlines, keeping its range around 114.30, marginally higher on the day. Rising Treasury yields continue to put a floor under the spot.
- USD/INR bears step in and take on the bullish commitments.
- USD/INR daily support is giving way and daily resistance plays its role.
USD/INR is losing its bullish allure as it takes a trip to beneath what would have texted to be a reliable level of the support structure. The price had been advancing over the course of the last several weeks, but the resistance has proven to be a tough nut to crack. The price is now taking on the bullish commitments and pricing below a critical Fibonacci retracement level as follows:
USD/INR daily chart
-637703761614968220.png)
As illustrated, the 61.8% is under pressure but the battle has just begun. There is still room for a correction deeper before the bulls might get squeezed out entirely:
-637703764142481868.png)
“The median of 80 forecasts put 2021 growth at 6.8%, unchanged from September, and 5.0% next year - a downgrade from the previous 5.5% forecast,” per the latest Reuters poll.
The survey results also reiterate that the Bank of England will be the first major central bank to raise interest rates in the post-pandemic cycle but the first hike will not come until early next year, later than markets are pricing in.
Key quotes
Medians in the Oct. 13-20 poll said the bank rate would rise 15 basis points to 0.25% in either February or March although around a fifth of respondents said the initial move would come on Nov. 4, in line with market expectations.
In September, the first hike was not expected until the fourth quarter of next year and, when asked about the risks to their current forecasts, almost 85% of respondents to an additional question said it was more likely the bank acted sooner rather than later than they expected.
Inflation will peak at 4.0% next quarter before falling to 3.5%, 2.7% and 2.2% in the following quarters, the latest poll showed, much higher than predicted a month ago.
GDP was predicted to expand 1.1% this quarter, weaker than the 1.5% expected in last month's poll as a shortage of heavy goods drivers has added to supply chain disruptions.
Also read: GBP/USD steady above 1.3800 amid risk-on sentiment
In recent trade today, the People’s Bank of China (PBOC) set the yuan (CNY) at 6.3890 vs the estimates 6.3884 and the prior 6.4069.
About the fix
China maintains strict control of the yuan’s rate on the mainland.
The onshore yuan (CNY) differs from the offshore one (CNH) in trading restrictions, this last one is not as tightly controlled.
Each morning, the People’s Bank of China (PBOC) sets a so-called daily midpoint fix, based on the yuan’s previous day closing level and quotations taken from the inter-bank dealer.
- Silver edges higher at six-week top, prints three-day uptrend.
- Break of descending trend line from July, bullish MACD favor buyers.
- Three-month-old horizontal area challenges upside past 100-DMA.
Silver (XAG/USD) holds onto the previous two-day uptrend above $24.00, up 0.25% intraday around $24.35 during early Thursday.
In doing so, the bright metal justifies the upside break of a descending resistance line from July, now support near $24.00.
The trendline breakout joins the bullish MACD signals to direct XAG/USD buyers towards a 100-DMA level of $24.60
However, any further upside past $24.60 will be challenged by multiple levels marked since late July, also comprising September highs, near $24.80-85.
Meanwhile, silver sellers may not take the risk of entry until the quote stays beyond $24.00.
Even on a downside break of the resistance-turned-support, the commodity prices remain on the bull’s radar until breaking $23.00 support including 23.6% Fibonacci retracement of May-September fall.
Overall, silver remains in the bullish trend with a bumpy road ahead.
XAG/USD: Daily chart
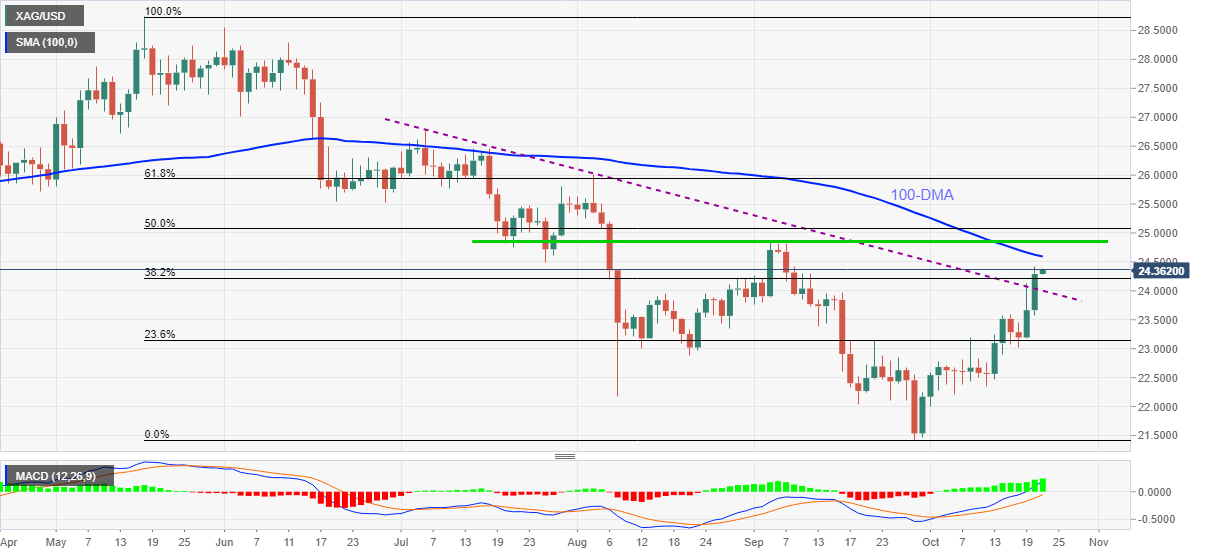
Trend: Further upside expected
- AUD/JPY edges higher on Thursday following the previous day’s upside momentum.
- The pair remains under buying pressure since October 1.
- Momentum oscillator holds onto the overbought zone with upside momentum.
AUD/JPY trades lower in the Asian trading hours on Wednesday morning. The pair continued to rise in the October series, after opening at 80.43 . As of writing, AUD/JPY trades at 86,00, up 0.15% for the day.
AUD/JPY daily chart
-637703742718548286.png)
Technically speaking, after rising from the low of 78.85 made one month ago, the pair put paddle on accelerator and tested the yearly high at 86.02 in intraday session. The bullish bias Moving Average Convergence Divergence (MACD) indicator fuels the probability of the next higher price movement toward the February, 2018 high at 88.12.
Alternatively, if price reverses direction on profit booking it could retarced back to the 85.50 horizontal support level. Further, a break of the mentioned level, which coincides with the break of the ascending trendline from the low of 78.85 would mean more pain for the pair. The AUD/JPY bears would recapture the psychological 85.00 mark followed by Tuesday's low of 84.66.
AUD/JPY additional levels
- AUD/USD takes the bids to refresh multi-day high.
- NAB Business Confidence drops below market forecast and prior in Q3.
- Market sentiment dwindles amid a sluggish session, US Treasury yields stay firmer.
- Evergrande’s failure to clinch asset sale deal, hawkish Fedspeak weigh on risk appetite of late.
AUD/USD stays bid at 0.7527, the highest level since July 07 during early Thursday. In doing so, the Aussie pair ignores downbeat sentiment data from the National Australia Bank (NAB).
NAB Business Confidence not only lagged below the previous print of 17 but also dropped past market consensus of 5, with a -1 figure for the third quarter (Q3) of 2021. The drop in business sentiment could be linked to the coronavirus lockdowns in Australia.
Also challenging the AUD/USD bulls are the hawkish comments from Federal Reserve Governor Randal Quarles and Cleveland Fed President Loretta Mester. On the same line was the news that China’s struggling real-estate major Evergrande failed to seal the asset sale deal with Hopson Development Holdings. It’s worth mentioning that China’s two hypersonic weapon tests also should have weighed on the quote, but did not.
Additionally, a jump in Australia’s covid counts to the highest in a week, from 2,151 to 2,642 per ABC News, also probes the AUD/USD upside.
Even so, the US dollar weakness rules above everything else and keeps the Aussie pair on firmer footing. That said, the US Dollar Index (DXY) stays pressured around 93.60 near the lowest levels in three weeks by the press time, after printing a six-day south-run.
Against this backdrop, the US 10-year Treasury yields remain firm around 1.66%, up two basis points (bps) whereas the S&P 500 Futures print mild losses by the press time.
Moving on, AUD/USD traders will keep following the US dollar moves and the US data amid a light calendar at home. Hence, qualitative factors like Fedspeak and China news may gain major attention.
Technical analysis
A clear upside break of a four-month-old horizontal resistance, now support around 0.7480-75, enables AUD/USD bulls to battle multiple levels marked since April 01 near 0.7530-35. However, overbought RSI conditions and 200-DMA level of 0.7565 may challenge the run-up afterward.
- Gold extends the previous session’s gains on Thursday above $1,780.
- Higher US Treasury yields fail to uplift the demand for the US dollar.
- Higher inflation worries, Fed’s tapering catching investor attention.
Gold trades with minute gains on Thursday after testing the high near to $1,790 in the US session. The US benchmark 10-year Treasury yields rose above 1.65% reducing non-yielding bullion’s appeal.
The US Dollar Index, which tracks the performance of the greenback against the basket of six major currencies, trades lower below 94.00 with 0.02% losses, making gold attractive for the other currencies holders. The greenback weighed down as the expectations mounted of faster monetary policy tightening among other major central banks and as the global equity market extended the rally sapping demand for the greenback.
The US T-bond yields rise for the fourth-straight session at 1.66% with more than 1% gains, the highest in the five months. Investors remained optimistic about the US economic recovery amid strong corporate earnings amid higher inflationary pressures due to soaring energy prices. Gold is generally considered a hedge against inflation and currency volatility. A hawkish move by the major central banks would diminish gold’s appeal.
XAU/USD daily chart
-637703730278236333.png)
Gold prices posted gains of about $20 in the previous session after testing the high at $1,788 mark in the previous session. The prices crossed above the 21-day Simple Moving Average (SMA) at $1,759.23 on October 13. The descending trendline from the high of $1,834.02 made on September 3, acts as a strong resistance for the bulls.
The Moving Average Convergence Divergence (MACD) holds below the midline with a bullish crossover. Any uptick in the MACD indicator would amplify the buying pressure and the prices would approach Friday’s high of $1,796.50. A daily close above the mentioned level would entice bulls to retest the $1,810 horizontal resistance level. XAU/USD bulls could meet the September, 7 high at $1,827.32.
Alternatively, if the prices break below the intraday low, it could retrace back to the $1,770 horizontal support level. Furthermore, a successful break of the 21-day SMA at $1,760 could mean more downside for gold toward the $1,750 horizontal support level. A break of the mentioned support level would open the gates for the further lower levels, the bears will keep their eyes on the $1,730 horizontal support level.
- USD/CAD has something for both bulls and bears from a longer-term perspective.
- Bulls look to the M-formation while bears eye and downside extension.
USD/CAD is a compelling long-term chart that has something for both the bulls and bears. The following is an analysis of the weekly and monthly time frames that illustrate the potential for a bullish correction followed by a downside and significant bearish extension to the 1.1680s.
USD/CAD weekly chart: Failed bullish attempts
As illustrated, the bears tried to break out of the reverse head and shoulders in any significant reversal trend.
However, the Cup & Handle played out well, if only for a short while with the price breaking higher momentarily:
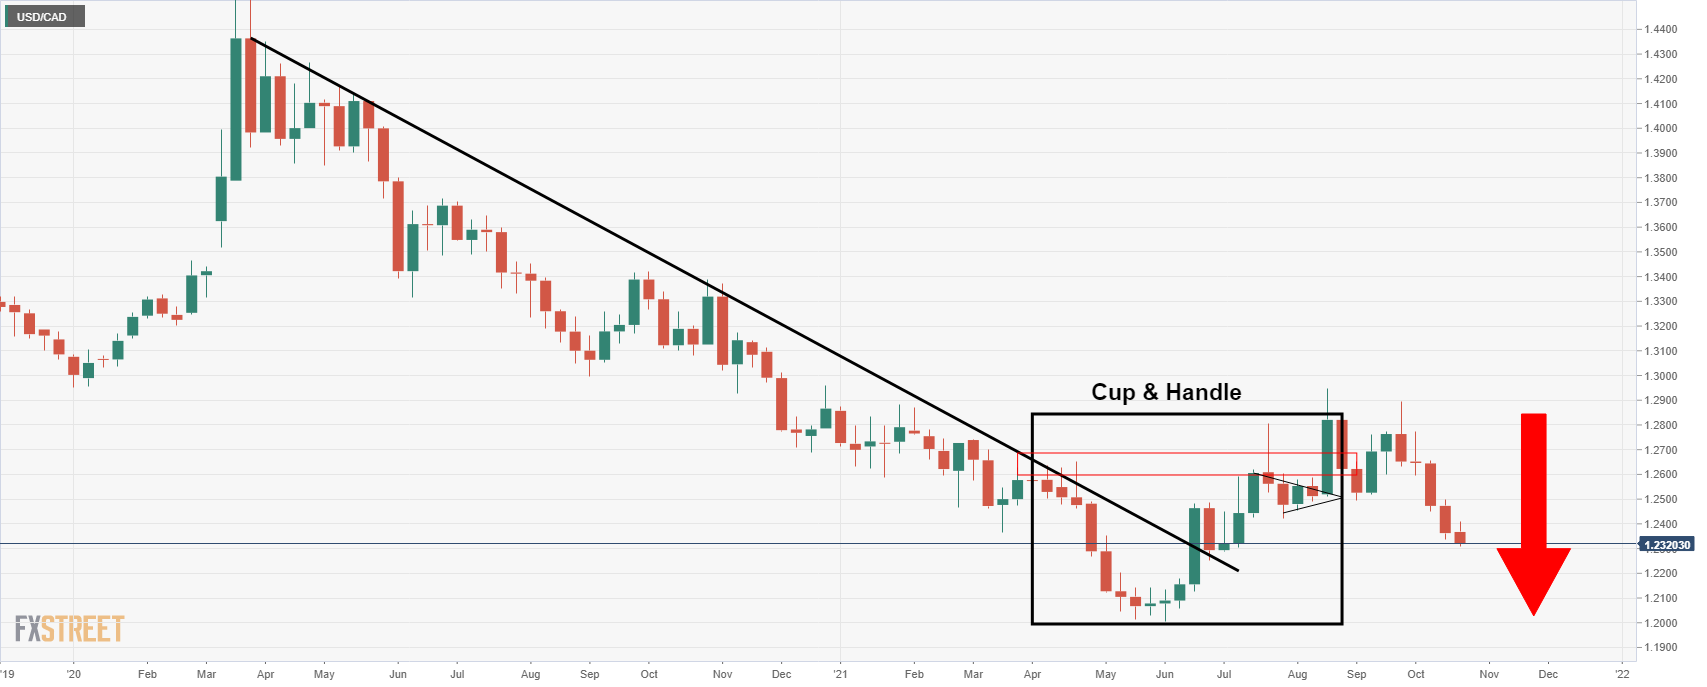
USD/CAD bullish and bearish playbooks
However, the price has now broken the trendline support as follows which would be expected to lead to a fresh weekly low in due course towards 1.1680:
With that being said, however, there are prospects of a bullish correction to test the neckline of the M-formation, a bullish reversion pattern that has a high completion rate:
The price still has some room to go to the downside to fully test the demand area and it would be expected to take a number of days or even weeks before demand can outstrip supply. However, should the price indeed correct higher, it could be an attractive discount for the bears targeting lower lows and the 1.1680s. The 1.1680s is around where a -272% Fibonacci retracement of the current weekly correction meets a long term monthly structure level as follows:
| Time | Country | Event | Period | Previous value | Forecast |
|---|---|---|---|---|---|
| 06:00 (GMT) | United Kingdom | PSNB, bln | September | -20.5 | -22.6 |
| 10:00 (GMT) | United Kingdom | CBI industrial order books balance | October | 22 | 18 |
| 12:30 (GMT) | U.S. | Continuing Jobless Claims | October | 2593 | 2550 |
| 12:30 (GMT) | Canada | New Housing Price Index, MoM | September | 0.7% | |
| 12:30 (GMT) | Canada | New Housing Price Index, YoY | September | 12.2% | |
| 12:30 (GMT) | U.S. | Philadelphia Fed Manufacturing Survey | October | 30.7 | 25 |
| 12:30 (GMT) | U.S. | Initial Jobless Claims | October | 293 | 300 |
| 14:00 (GMT) | Eurozone | Consumer Confidence | October | -4 | -5 |
| 14:00 (GMT) | U.S. | Leading Indicators | September | 0.9% | 0.4% |
| 14:00 (GMT) | U.S. | Existing Home Sales | September | 5.88 | 6.09 |
| 19:00 (GMT) | Australia | RBA's Governor Philip Lowe Speaks | |||
| 23:01 (GMT) | United Kingdom | Gfk Consumer Confidence | October | -13 | -16 |
| 23:30 (GMT) | Japan | National CPI Ex-Fresh Food, y/y | September | 0.0% | 0.1% |
| 23:30 (GMT) | Japan | National Consumer Price Index, y/y | September | -0.4% |
US inflation expectations, as measured by the 10-year breakeven inflation rate per the St. Louis Federal Reserve (FRED) data jumped to the highest levels in 8.5 years by the end of Wednesday’s North American trading.
In doing so, the risk barometer extends recovery moves from late September while flashing 2.57% at the latest.
While this favors risk assets and weighs on the safe-havens like the US dollar, the same also amplifies the Fed tapering concerns that seemed to have been ignored of late.
However, the flash readings of October’s activity numbers, up for publishing on Friday, may highlight the carry trade opportunities and help Antipodeans, especially the NZD/USD.
On the same line, EUR/USD may witness a pullback should the Eurozone data remain downbeat, favoring the European Central Bank’s (ECB) bearish bias.
Read: US Dollar Index Price Analysis: DXY bears keep 93.20 on radar
| Pare | Closed | Change, % |
|---|---|---|
| AUDUSD | 0.75146 | 0.59 |
| EURJPY | 133.162 | 0.14 |
| EURUSD | 1.16471 | 0.14 |
| GBPJPY | 157.997 | 0.19 |
| GBPUSD | 1.3821 | 0.23 |
| NZDUSD | 0.71944 | 0.66 |
| USDCAD | 1.23148 | -0.34 |
| USDCHF | 0.91881 | -0.41 |
| USDJPY | 114.317 | -0.02 |
- DXY remains pressured around three-week low after a two-day downtrend.
- Clear break of 21-DMA, two-month-old horizontal area favor sellers.
- 50-DMA, five-month-old support line offer a tough nut to crack for the bears.
US Dollar Index (DXY) fades bounce off multi-day low, retreating to 93.60 during Thursday’s Asian session.
The greenback gauge dropped in the last two days following the downside break of 21-DMA and a horizontal area comprising levels marked since August.
Given the firmer Momentum backing the current south-run, US Dollar Index is likely staying on the sellers’ list.
However, a confluence of 50-DMA and an ascending support line from late May, around 93.20, will be a tough nut to crack for the DXY bears.
Should the quote drops below 93.20, September’s low near 91.94 will be in focus.
Alternatively, the stated horizontal area close to 93.75 precedes 21-DMA level near 93.92 to restrict short-term recovery moves of the US Dollar Index.
In a case where DXY bulls manage to conquer 93.92 hurdle, also cross the 94.00 threshold, the yearly top of 94.56 should gain the market’s attention.
DXY: Daily chart
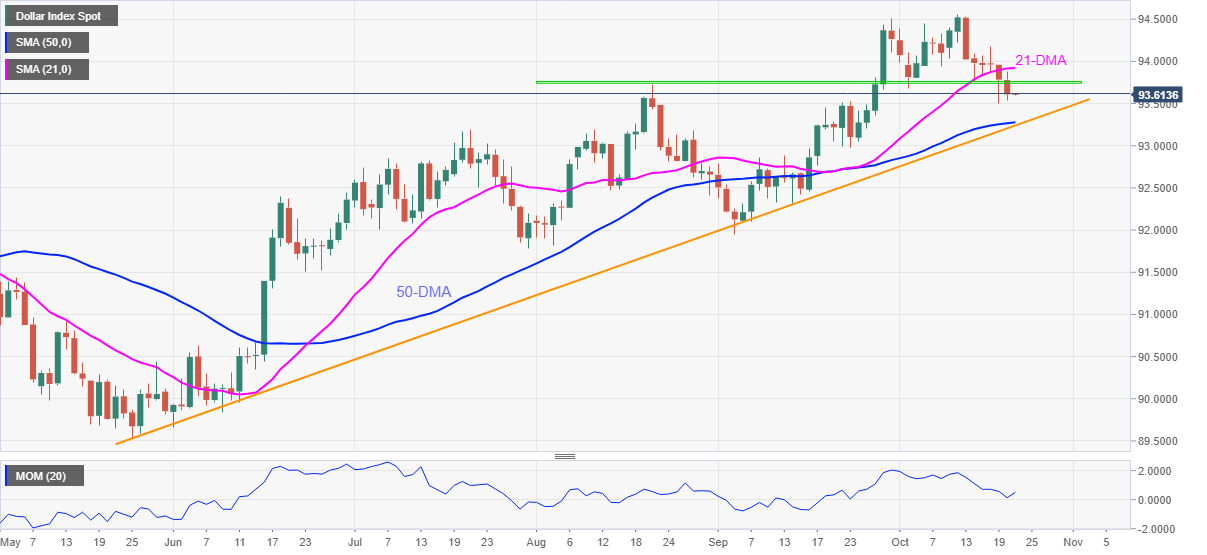
Trend: Further weakness expected


© 2000-2026. All rights reserved.
This site is managed by Teletrade D.J. LLC 2351 LLC 2022 (Euro House, Richmond Hill Road, Kingstown, VC0100, St. Vincent and the Grenadines).
The information on this website is for informational purposes only and does not constitute any investment advice.
The company does not serve or provide services to customers who are residents of the US, Canada, Iran, The Democratic People's Republic of Korea, Yemen and FATF blacklisted countries.
Making transactions on financial markets with marginal financial instruments opens up wide possibilities and allows investors who are willing to take risks to earn high profits, carrying a potentially high risk of losses at the same time. Therefore you should responsibly approach the issue of choosing the appropriate investment strategy, taking the available resources into account, before starting trading.
Use of the information: full or partial use of materials from this website must always be referenced to TeleTrade as the source of information. Use of the materials on the Internet must be accompanied by a hyperlink to teletrade.org. Automatic import of materials and information from this website is prohibited.
Please contact our PR department if you have any questions or need assistance at pr@teletrade.global.
transfers