- Analytics
- News and Tools
- Market News
CFD Markets News and Forecasts — 25-10-2021
- GBP/JPY struggles to keep rebound from one-week low.
- UK Brexit Minister doubts EU proposals, sets December deadline to solve NI border issue.
- Covid cases jump in Britain, Virus-led restrictions ease in Japan.
- Risk catalysts are the key amid a light calendar.
GBP/JPY takes rounds to 156.50, fading the previous day’s recovery moves during Tuesday’s Asian session. The cross-currency pair struggles for a clear direction as mixed concerns for yen joins Brexit woes and coronavirus fears from the UK.
Risk appetite improved headlines from China and concerning Evergrande joined hopes of US stimulus, backed by US President Joe Biden and House Speaker Nancy Pelosi.
While upbeat sentiment weighed on the US Treasury yields and should have helped the Japanese yen (JPY), fears that recently easy activity restrictions in Tokyo and surrounding prefectures after 11 months of hardships may renew the COVID-19 cases probe the pair bears.
Elsewhere, UK Brexit Minister conveys dissatisfaction with the Eurozone’s Brexit proposals and gives time until December 2021 to solve the Northern Ireland (NI) issue. “The EU's current proposals to reform the Northern Ireland Protocol "don't go far enough", the UK's Brexit minister has said, as he set a December deadline for the two sides to find a solution,” said Sky News. It's worth noting that a delegation from Brussels will arrive in London on Tuesday to discuss the matter.
Additionally weighing on the cable is the fears of faster virus mutations in the UK and the latest jump in the covid cases. “UK has seen close to 40,000 new cases per day for the last 4 days. UK health secretary has warned people of not letting their guard down as there could be 100,000 COVID cases per day as the country heads into the winter season,” said CNBC.
Against this backdrop, Wall Street benchmarks closed positive, refreshing records, while the US 10-year Treasury yields seek further clues following two days of downside. That said, S&P 500 Futures print mild gains by the press time.
Given the light calendar and mixed catalysts, the Brexit talks and covid updates are important to forecast short-term GBP/JPY moves.
Technical analysis
Despite bouncing off 10-day EMA, around 156.15 by the press time, GBP/JPY remains below the previous support line from October 01, close to 157.15, keeping bears hopeful.
- AUD/USD is testing the waters in the 0.75 area.
- Weekly resistance is a conundrum for the bulls at this juncture.
AUD/USD is on the verge of a break of 0.75 psychological resistance, but the longer-term time frames are less than favourable given the amount of weekly resistance ahead.
Meanwhile, the event for the day is the Consumer Price Index and the following is the hourly picture leading into the event:
AUD/USD 1-HR chart
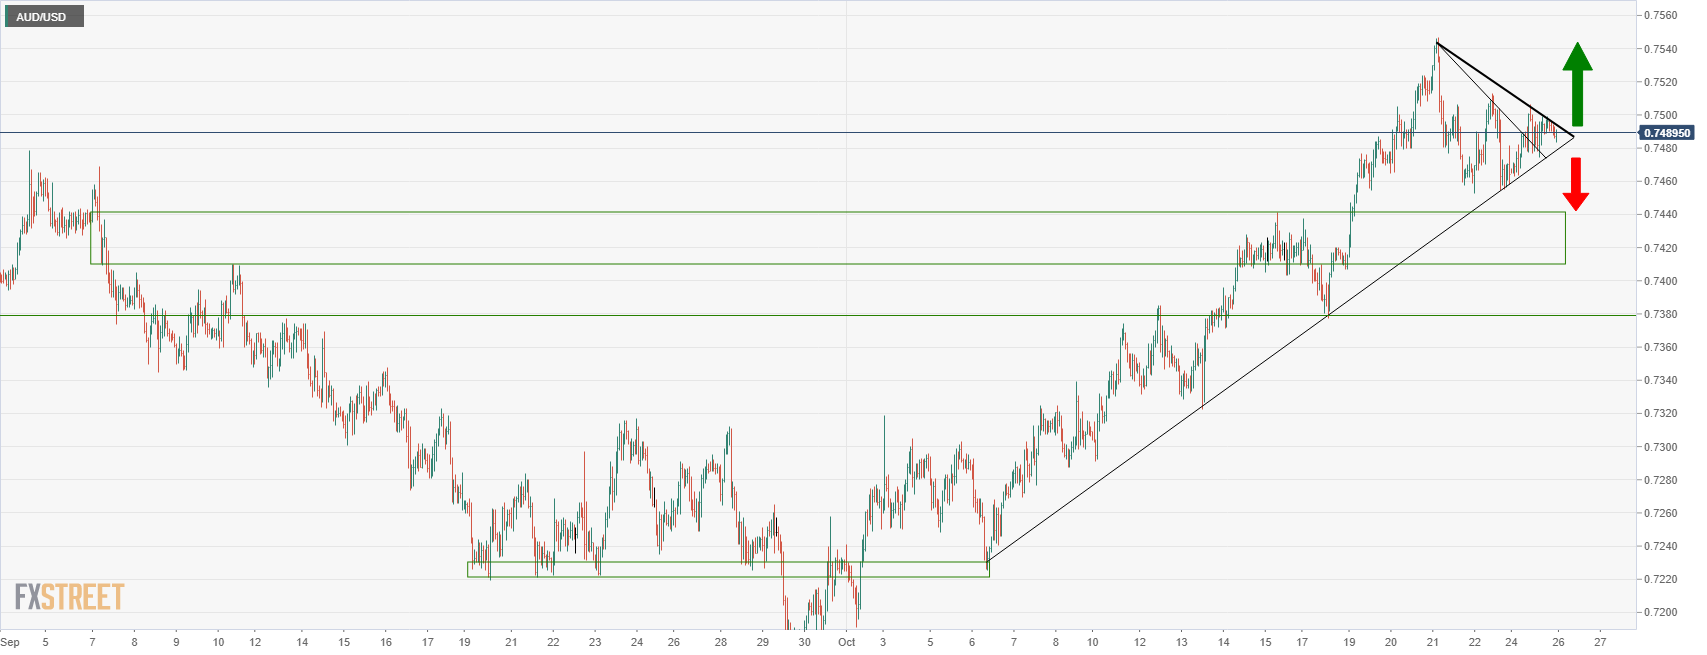
The price broke the trendline resistance in 0.7485 during the start of the European session ad has since carved a fresh dynamic resistance near 0.75 the figure. A break of that will open risk towards 0.7505. On the downside, and should the data disappoint, the bears will be seeking a break below 0.7480 for a run towards 0.7440.
Meanwhile, the following is a top-down analysis of the weekly and daily charts that illustrate the predicament for the bulls.
Daily chart
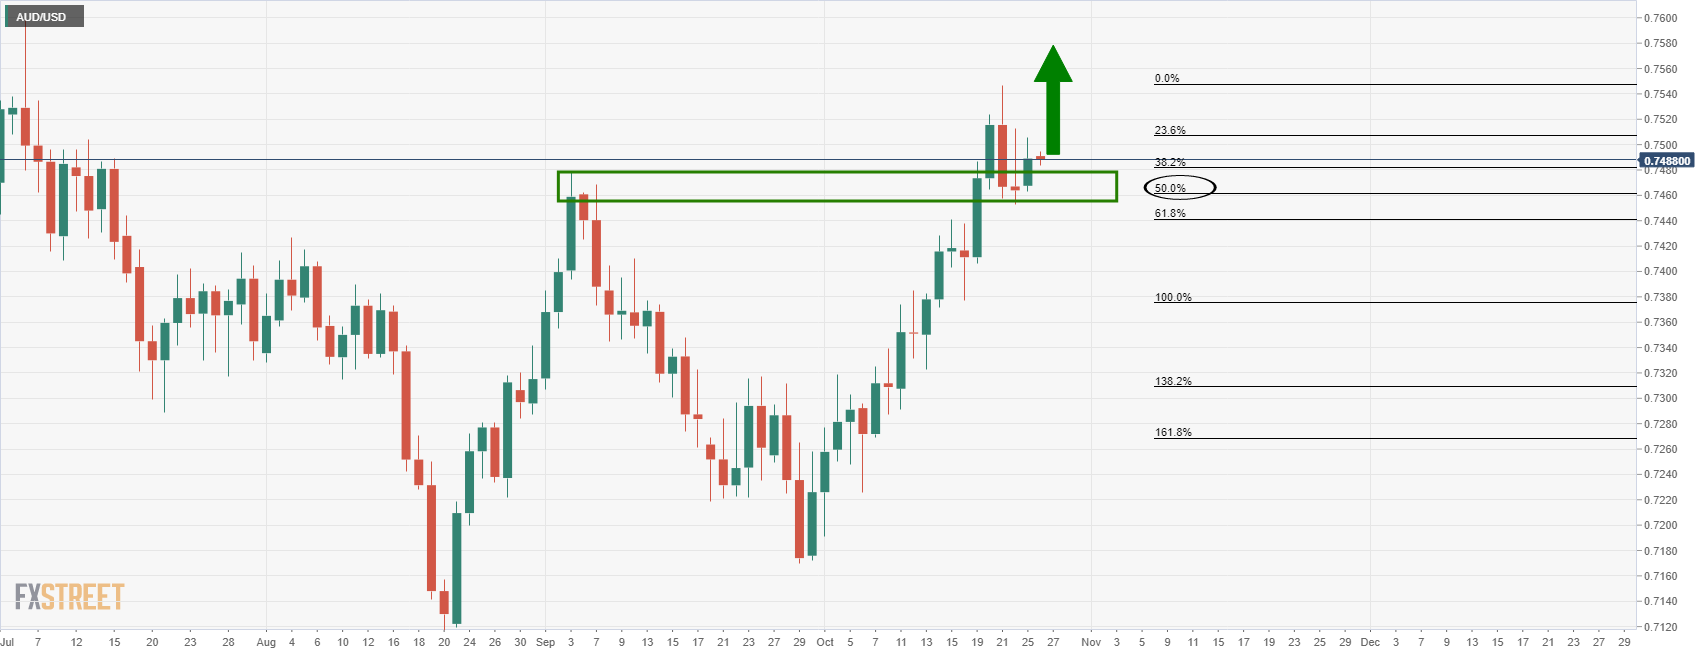
The daily chart is offering prospects of an upside continuation and while it is probable that the market will indeed continue higher, the weekly resistance must be noted.
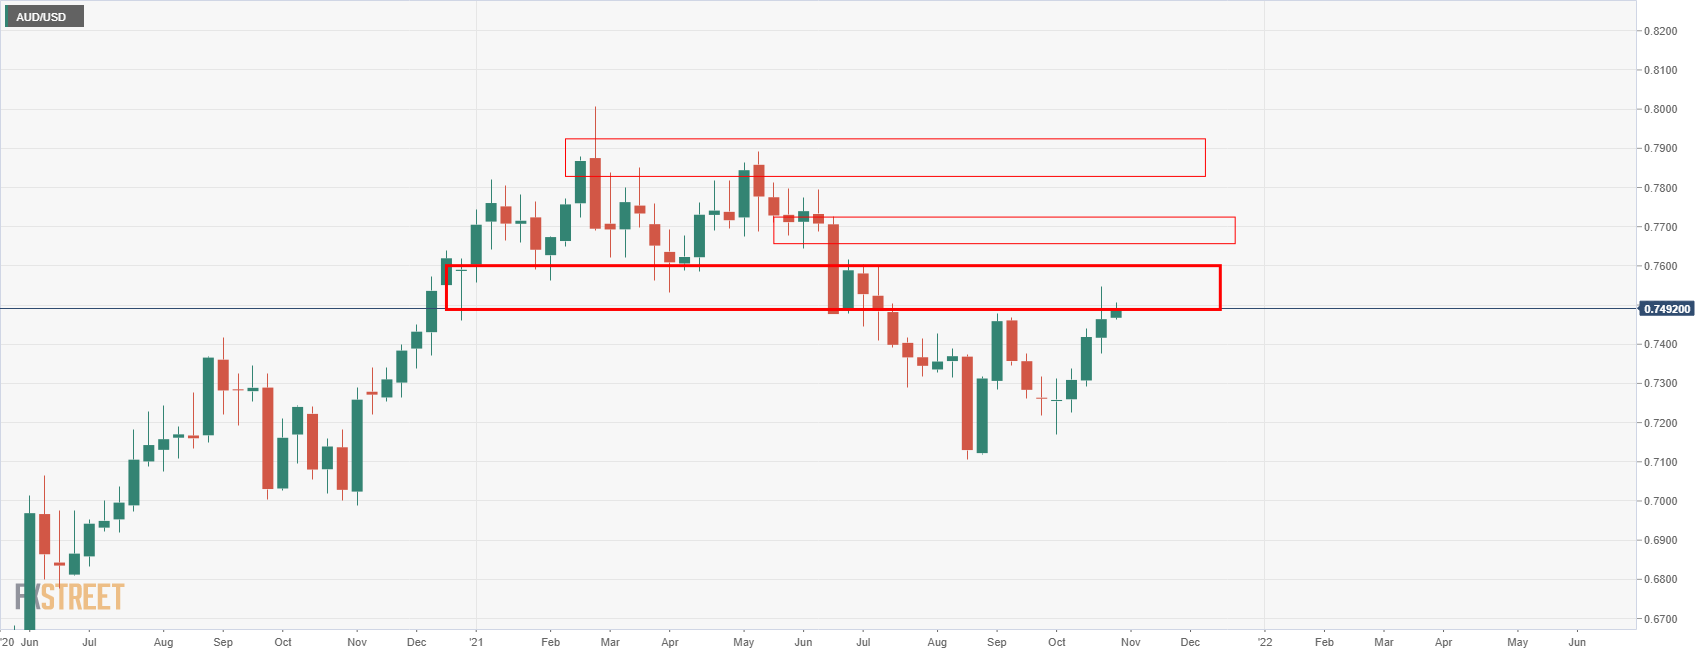
Weekly chart
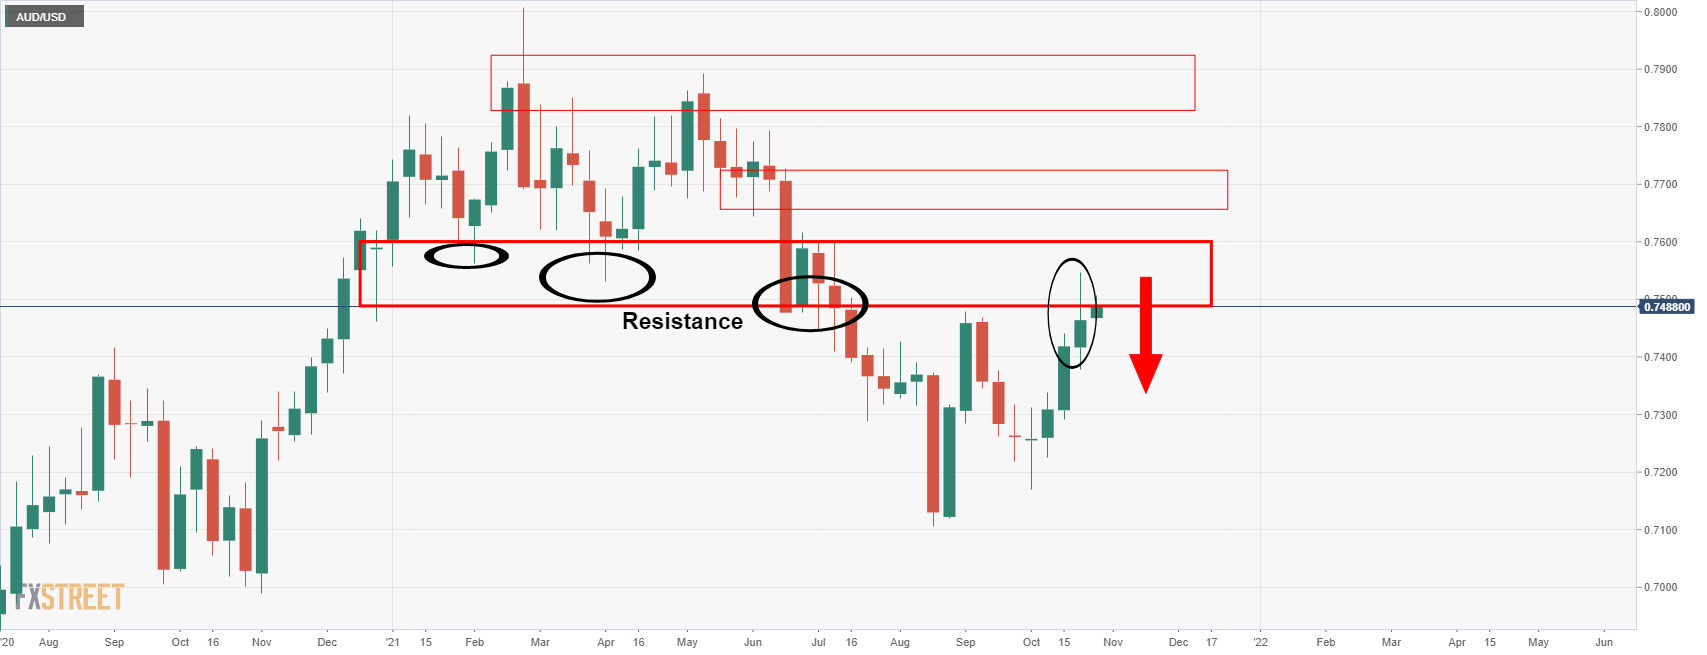
As illustrated on the weekly chart above for AUD/USD, the price is testing a wall of resistance. There is room to move a touch higher but last weeks' candle was lacking bullish momentum which leaves a bearish bias while below 0.7550.
- AUD/JPY fades rebound from 50-SMA, stays inside short-term ascending triangle.
- MACD teases bulls, monthly support line adds to the downside filters.
AUD/JPY retreats towards 85.00, down 0.05% intraday around 85.15 during Tuesday’s Asian session.
In doing so, the cross-currency pair fails to keep the last week’s recovery moves from 50-SMA. However, a two-week-old rising trend line, forming part of a short-term triangle, joins the stated short-term moving average and MACD conditions to keep buyers hopeful.
Hence, the latest pullback moves may aim to rest 50-SMA level of 85.00 while the stated triangle’s support line will also challenge the AUD/JPY bears around 84.85.
Should the quote drops below 84.85, it confirms the bearish chart pattern and signals downside towards the 84.00 round figure and monthly support line near 83.30.
On the contrary, an upside clearance of 85.55 horizontal hurdle will direct AUD/JPY prices toward the latest peak near 86.25.
In a case where the pair buyers keep reins past 86.25, March 2016 peak surrounding 86.70 and the 87.00 round figure will be in focus.
AUD/JPY: Four-hour chart

Trend: Bullish
- USD/CAD trades cautiously following the previous session’s gains on Tuesday.
- WTI retreats from $84.00 and is exerting pressure on the Canadian dollar.
- Fed/ BoC rate hike bets, inflation, and higher commodity prices take the center stage.
The USD/CAD pair accumulates gains on Tuesday in the early Asian trading hours. The pair touched the 1.2400 mark in the US session. At the time of writing, USD/CAD is trading at 1.2383, up 0.03% for the day.
The appreciative move in the US dollar keeps USD/CAD higher. The US Dollar Index (DXY), which measures the performance of the greenback against its six major rivals, trades at 93.81, up 0.21%. Investors anticipate Fed’s tapering while digesting delay in rate hike expectations. US corporate results remained strong despite inflation concerns, which helped the greenback in finding some traction.
Crude oil, a key Canadian export, retreated from fresh 7-year highs, which pushed the loonie lower against the USD. In addition to that, a Reuters poll reported that the Bank of Canada (BoC) will raise interest rates as early as Q3, 2022, at least three months earlier than previously expected. The Market is already pricing in the first hike as early as April.
As for now, traders are waiting for the US Housing Price Index, S&P/Case-Shiller Home Price Indices, and New Home Sales data to take fresh trading impetus.
USD/CAD additional levels
- EUR/USD trades below the 4-hour 10 & 20 EMA bearish crossover.
- The US dollar is finding its form into critical events this week, including the ECB.
EUR/USD is trading in a tight range ahead of the Tokyo open near to 1.1610. EUR/USD fell from 1.1645 to 1.1610 overnight and remains capped by the 4-hour 10/20 EMA bearish crossover. The downside came from the dollar steadying on Monday afternoon after bouncing off a one-month low. Traders now look ahead to key data events for the week ahead, including the European Central Bank meeting this Thursday.
The forex space is being governed by markets that are weighing the prospects of higher interest rates for different currencies. This makes this weeks calendar critical as it may set the stage for many weeks to come. So far, the rebound in the greenback has come at the expense of the euro, the Japanese yen and the Swiss franc in the main.
ECB in focus
For today, bar the Aussie inflation readings, will be a quieter day for economics whereby we will see markets focused on US New Home Sales and a speech by the ECB's Villeroy on Tuesday. The bigger event, however, will be the ECB that meets this week and comments from the bank could shift views on how many inflationary pressures could impact interest rates.
''Whilst it has signalled that December is the meeting to expect a comprehensive update on post-PEPP plans, the current rise in inflation demands attention,'' analysts at ANZ Bank argued. ''Our analysis estimates inflation will prove more persistent than transitory next year, though we also think that the ECB will push back against expectations of rates rises in 2022.''
- WTI keeps pullback from seven-year high, retreats of late.
- Saudi Arabia outlines Mideast Green initiative, shows readiness to ease supply constraints.
- US-Iran tussles could renew on chatters over Syrian done attack.
- Risk-on mood, geopolitics may challenge oil bears, weekly API stockpiles eyed.
WTI holds lower grounds following a U-turn from a fresh multi-day high, pressured around $83.25 during Tuesday’s Asian session. In doing so, the black gold struggles to justify headlines from the Middle East, as well as risk-on mood, amid the US dollar rebound.
The US Dollar Index (DXY) refreshed three-week lows before posting the heaviest daily jump in two weeks on Monday. The greenback gauge seems to have benefited from the market’s cautious sentiment ahead of Thursday’s advance estimation of the US Q3 GDP amid hawkish Fedspeak and mixed data.
On the other hand, market sentiment improved headlines from China and concerning Evergrande joined hopes of US stimulus, backed by US President Joe Biden and House Speaker Nancy Pelosi.
More recently, doubts that Iran was behind the drone attack on the US airbase in Syria should have probed the oil sellers. However, Saudi Arabia’s “aims to reach "net zero" emissions of greenhouse gases, mostly produced by burning fossil fuels, by 2060,” per Reuters, challenge the energy buyers.
Even so, "We would need prices to rise to $110 /bbl to stifle demand enough to balance the market deficit we currently see in 1Q22 given our expectation that OPEC+ continues on the current path of +0.4 mb/d per month increases in quotas," said Goldman Sachs per Reuters.
Amid these plays, Wall Street closed positive and the S&P 500 Futures print mild gains by the press time.
Moving on, WTI traders should wait for the weekly oil stockpile data from the American Petroleum Institute (API), prior 3.294M, for fresh impulse. Though, qualitative factors and the US dollar moves will also be important to watch.
Technical analysis
10-DMA precedes monthly support line, respectively around $82.30 and $81.90 to restrict short-term WTI downside. Meanwhile, bulls need a daily closing beyond November 2012 lows near $84.10 to excel further.
- On Monday, gold advanced $17 during the day, despite risk-on market sentiment.
- Gold has rallied for five consecutive days, climbing almost $50 until the current market price.
- XAU/USD: The daily chart is tilted to the upside, but strong resistance at $1,834 lies ahead.
- US 10-year T-bond yield: A break below 1.55% could push gold prices toward $1,834 and beyond.
Gold (XAU/USD) is barely flat as the New York session winds down and the Asian session begins, is trading at $1,807.68 during the day at the time of writing. On Monday, the non-yielding metal rose almost 1%, from $1,792 to $1,810, amid lower US T-bond yields, with the 10-year yield dropping from 1.678% to 1.633%.
Risk-on market sentiment prevailed during the Monday New York session as portrayed by US stock indices rising between 0.18% and 1.04%, gaining follow-through in the Asian session. Equity futures in Asia climb between 0.12% and 0.31%, except for the FTSE China A 50, down some 0.30%.
Gold reached five days in a row in advance; though the gains have been minimal, the price steadily climbed towards $1,800. The Federal Reserve entered the blackout period until the November 2-3 meeting, when investors expect the announcement of the bond tapering program. Those expectations kept gold from a steep upward move, as the market cautiously weighs inflationary pressures and the possibility of higher rates in the US.
XAU/USD Price Forecast: Technical outlook
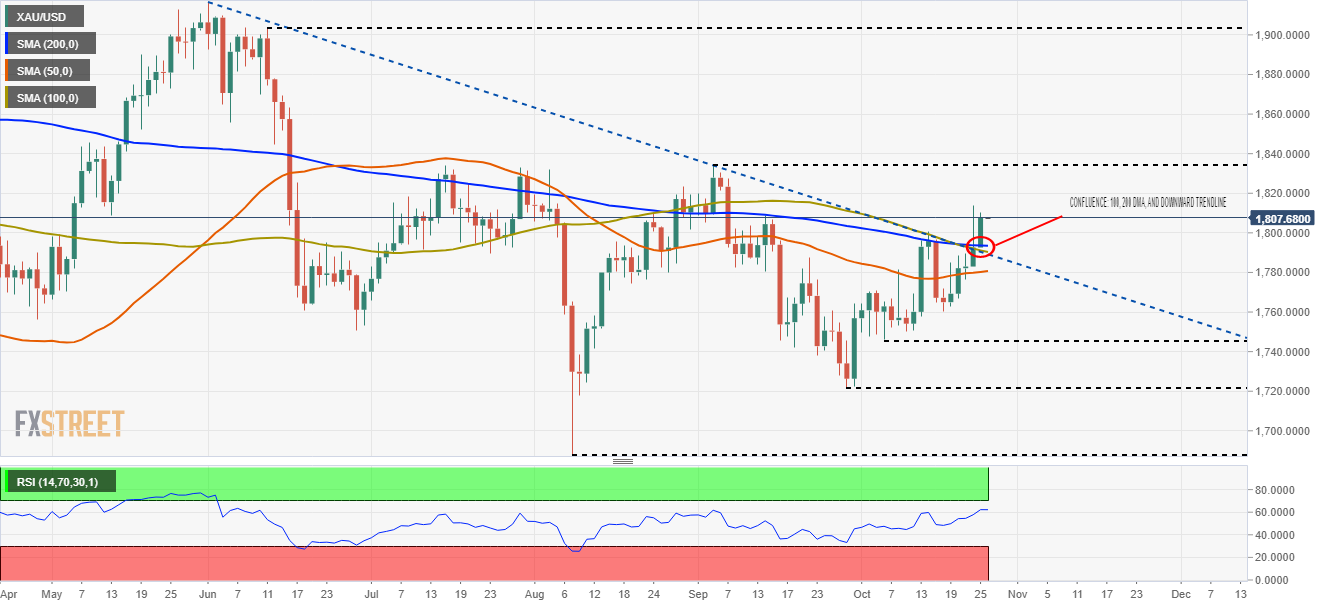
Daily chart
On Monday, gold (XAU/USD) broke a five-month-old downward slope trendline along with the confluence of the 100 and the 200-day moving averages (DMA’s), printing a daily close above $1,800 for the first time since September 8. The abovementioned could well be a strong signal that the yellow-metal might be headed toward higher prices, but the September 3 high at $1,834 would be the first resistance level to surpass on its way towards $1,900. In case of that outcome, there would be nothing on the $1,900 path.
On the flip side, a reversal towards $1,780 could exert additional downward pressure to XAU/USD, leaving $1,746 as the first support area. A clear break of the latter could expose essential support areas—the September 29 low at $1,721, followed by the August 9 low at $1,687.
The Relative Strength Index (RSI) at 62 above the 50-midline supports the upside bias, but the slope is flattish so that gold might be headed for consolidation.
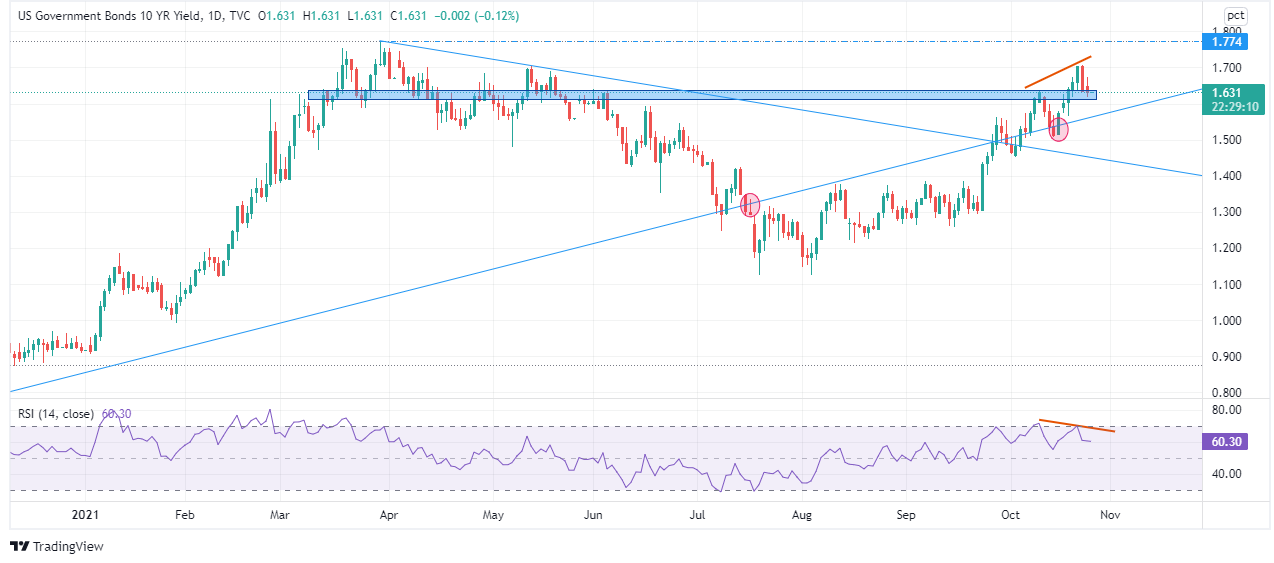
US Government Bond 10-year Treasury yield
The daily chart of the US 10-year Treasury yield depicts a negative divergence with the yield pushing higher, while the Relative Strength Index tops is printing lower highs.
The abovementioned suggest that the US 10-year bond coupon might be headed lower, but at press time, it is testing an area supported for about four months. Also, around the 1.55% area lies an upward trendline broken to the downside in July, but reclaimed its support status on October 15, when the 10-year reached a high of 1.579%. Hence, confirmation of the negative divergence could open the way for another leg-down in yields, thus propelling gold prices higher.
- GBP/USD fails to extend the first daily gains in three.
- Steady RSI, sustained trading below key SMAs keeps sellers hopeful.
- Previous resistance line from July adds strength to immediate support.
GBP/USD drops back to 1.3765 after snapping a two-day downtrend. In doing so, the cable pair fades the previous day’s bounce off the three-month-old resistance-turned-support during the early Asian session on Tuesday.
Given the quote’s inability to cross the 100-DMA and 200-DMA, coupled with the steady RSI, GBP/USD prices are likely to retest the previous resistance line around 1.3740-35. Also adding to the support’s strength is an ascending trend line from September 30.
It should be noted, however, that the pair’s weakness past 1.3735 will make it vulnerable to rest the early October’s top near 1.3675 before highlighting lows marked in August and July, respectively around 1.3600 and 1.3570 for the bears.
Alternatively, the 100-DMA level of 1.3792 precedes the 1.3800 round figure to guard the short-term GBP/USD recovery moves.
Following that, the recent swing high near 1.3835 and 200-DMA level close to 1.3850 will be the key to watch.
Overall, GBP/USD is likely to witness additional downside towards the key support confluence but bears should wait for confirmation.
GBP/USD: Daily chart
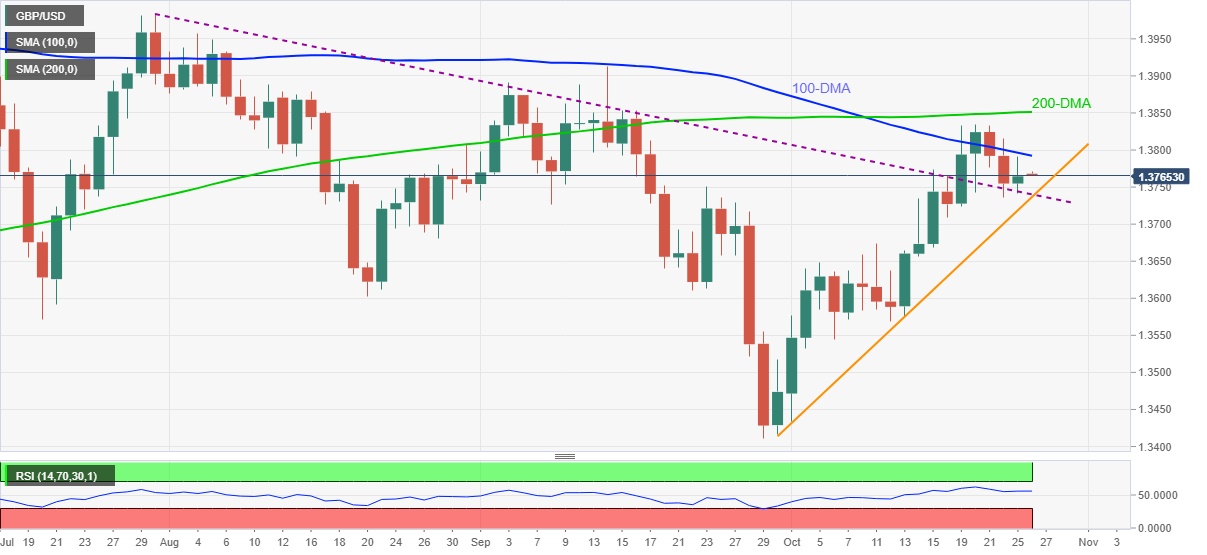
Trend: Further weakness expected
- USD/JPY accumulates gains on Tuesday in the initial Asian session.
- The US dollar holds above 93.80 despite slightly weaker US T-bond yields.
- Yellen's comments on inflation, higher equity market, and Fed tapering influences traders' decisions .
USD/JPY makes steady moves following the previous session’s movement. The pair retreated from the highs of 2018 high near 114.69 on Wednesday, and continued to move in a familiar trading range. At the time of writing USD/JPY is trading at 113.72, up 0.02% so far.
The US benchmark 10-year T bond yields trades lower at 1.63% which undemins the demand for the greenback. The yields took a tour to the south following US Treasury Secretary Janet Yellen remarks on inflation where she expected US inflation to return to normal by the second half of 2022.
In addition to that, US House Speaker Nancy Pelosi remained hopeful to pass an infrastructure bill and have a deal on the social policy bill by the end of the week. US Senator Joe Manchin also said that a deal on the outlines of the plan is within reach this week.
On the other hand the Japanese yen lost its ground on improved risk appetite among investors. It is worth noting that, S&P 500 Futures are trading at 4,563,up 0.11% so far.
As for now traders are waiting for the US Housing Price Index, S&P/Case-Shiller Home Price indices, and US Consumer Confidence to gauge the market sentiment.
USD/JPY additional levels
- US stocks begin the key week on a positive note, Dow, S&P refresh all-time highs.
- Upbeat performance of techs, US stimulus hopes join Fed blackout period to help the bulls.
- A 100,000 car order from Hertz boosted Tesla, Facebook earnings fail to lure bulls.
US equities extend Friday’s upbeat performance, backed by sentiment-positive news from Tesla to kick-start the heavy reporting week. That said, US stimulus hopes and an absence of Fedspeak, not to forget mixed US data, also helped stock buyers to keep the reins.
Amid these plays, Dow Jones Industrial Average (DJIA) and S&P 500 refresh record top with 0.18% and 0.47% daily gains, closing respectively around 35,741 and 4,566, following a run-up to 35,787 and 4,572. Additionally, Nasdaq gained 0.90%, or 136 points to end Monday’s trading around 15,226.
Market sentiment improved on Monday, keeping Friday’s optimism, after headlines from China and concerning Evergrande joined hopes of US stimulus, backed by US President Joe Biden and House Speaker Nancy Pelosi. However, the market’s wait for the advance US Q3 GDP, up for publishing on Thursday, probed the bulls following Friday’s hawkish Fedspeak.
Tesla stocks refresh all-time high, rising 13% on a day following the Electric Vehicle (EV) order from Hertz. “The company's market capitalization passed $1 trillion after Hertz Global agreed to buy 100,000 cars from the EV maker by the end of 2022,” said Reuters. On the other hand, Facebook registers a daily fall amid concerns over the prevalence of abusive content on its platform as well as softer Q3 revenues. It’s worth noting that shares of Pinterest dropped around 13% on Monday on the news that Paypal isn’t in to bid for the company.
Talking about US data, Dallas Fed Manufacturing Business Index rose past market consensus and prior readings in October but the Chicago Fed National Activity Index turned negative, -0.13 versus +0.05 previous readouts.
Looking forward, chatters from the Middle East, over US-Iran tussle and Saudi Arabia’s rejection to inflation further oil supplies, will join second-tier US data to entertain traders. However, major attention will be given to the earnings and the advance readings of the US Q3 GDP, up for publishing on Thursday.
Read: Forex Today: Central banks and US growth under the spotlight
- NZD/USD kick-starts the trading week inside the short-term range, poking the top of late.
- Market sentiment improves on stimulus hopes, China and Evergrande news.
- NZ markets resume trading after Labour Day holiday with light calendar in the Pacific.
- Second-tier US data, risk catalysts in focus ahead of Thursday’s US Q3 GDP.
NZD/USD holds onto the immediate trading range surrounding 0.7150, following a firmer performance of Monday. That being said, the kiwi pair seesaws near 0.7160 as the markets in New Zealand (NZ) begin the week’s trading on Tuesday, after an extended weekend.
Market sentiment improved on Monday, keeping Friday’s optimism, after headlines from China and concerning Evergrande joined hopes of US stimulus. Also favoring the risk-on is the firmer equities and receding covid fears. However, the absence of NZ traders and the market’s wait for the advance US Q3 GDP, up for publishing on Thursday, probed the quote’s latest moves.
US President Joe Biden and House Speaker Nancy Pelosi remain hopeful of getting the much-awaited infrastructure spending package passed soon. The policymakers have recently been ready to trim the package size and hence the stimulus gets less criticism from Republicans.
Elsewhere, China gets a formal seat on the United Nations and the People’s Bank of China (PBOC) stays ready for further injection, recently by 190 billion yuan. Further, Evergrande announced the restart of some cities after paying the US bond coupons the last week.
At home, receding virus cases and faster vaccinations help the NZ policymakers to stay hopeful of overcoming the coronavirus-led activity restrictions. “Deputy Prime Minister Grant Robertson confirmed today officials expect Counties Manukau to hit the 90 percent first vaccination target within the week - meaning second doses across Counties Manukau and the region's two other DHBs should be complete by the end of November,” said NZ Herald.
Alternatively, fears that COVID-19 regains momentum in China and the Fed tapering remains on the table keep the NZD/USD bulls challenged ahead of the key data/events.
Amid these plays, US equities closed higher, refreshing record tops, whereas the US 10-year Treasury yields dropped 2.2 basis points (bps) by the end of Monday’s North American trading session. However, the US Dollar Index (DXY) firmed after refreshing the three-week low.
Given the NZ traders’ return, NZD/USD may witness an active day and can overcome the immediate trading range. However, the recent USD strength and a lack of fresh positives may question the bulls. It’s worth noting that the US housing data, Consumer Confidence and Richmond Manufacturing Index may also entertain the pair traders.
Technical analysis
Although NZD/USD keeps pullback from a four-month-long ascending resistance line, near 0.7225, bullish MACD signals and Friday’s Doji keeps buyers hopeful until the quote stays beyond 200-DMA level surrounding the 0.7100 threshold.
- AUD/USD bulls meet resistance ahead of critical events this week.
- Aussie CPI will be the focus in Asia today.
AUD/USD was ending the day on Wall Street in the green by near to 0.4% after travelling from a low of 0.7461 to a high of 0.7505 on Monday's business. For Tuesday, the pair kicks off the Asian session up against a wall of weekly, daily and hourly resistance. For the day ahead, the Aussie Consumer Price Index will be a focus for traders.
The US dollar steadied on Monday afternoon after bouncing off a one-month low as traders weighed the prospects of a tighter US monetary policy. The risk events this week are heavy, so investors could be favouring the greenback as investors position for uncertainty. The euro, the Japanese yen and the Swiss franc were taking the brunt of the move into the US dollar. The dollar index against major currencies DXY steadied with a gain of nearly 0.23% for the day by the closing bell on Wall Street.
Meanwhile, there is a number of major events this week for forex. On Thursday, the European Central Bank will meet in US economic data, we have US Gross Domestic Product as well as inflation data from both the Us and across the pond, not to mention the domestic Consumer Price Index today for AUD. On top of this, there is also the Bank of Canada on Wednesday.
Critical events coming up
With respect to the Aussie CPI, analysts at TD Securities explained that ''new dwelling prices are expected to rise sharply as the dampening effect from the HomeBuilder grants fades, while higher fuel and motor vehicle prices will add to higher transport costs.'' Additionally, the analysts said, ''global supply-chain disruptions may also result in broad-based inflationary pressures. If our forecasts are correct, markets could retest the RBA and implies more pain for AU front-end rates.''
AUD/USD weekly resistance
US officials believe Iran was behind a drone attack that occurred last week at the military outpost in southern Syria where American troops are based.
key notes
Officials said Monday the US believes that Iran resourced and encouraged the attack.
They were Iranian drones, and Iran appears to have facilitated their use.
Officials believe the attacks involved as many as five drones laden with explosive charges, and that they hit both the US side of al-Tanf garrison and the side where Syrian opposition forces stay.
Market implications
There has been no reaction, thus far, to this developing situation but what is important, for now, is that there were no reported injuries or deaths as a result of the attack.
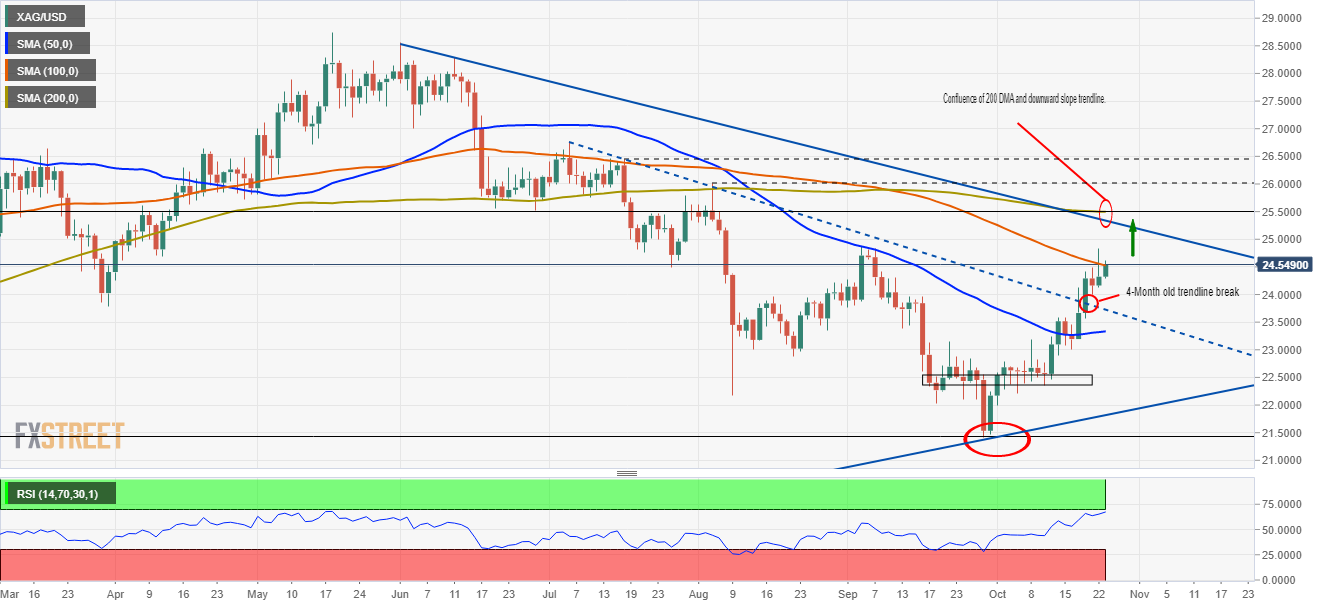
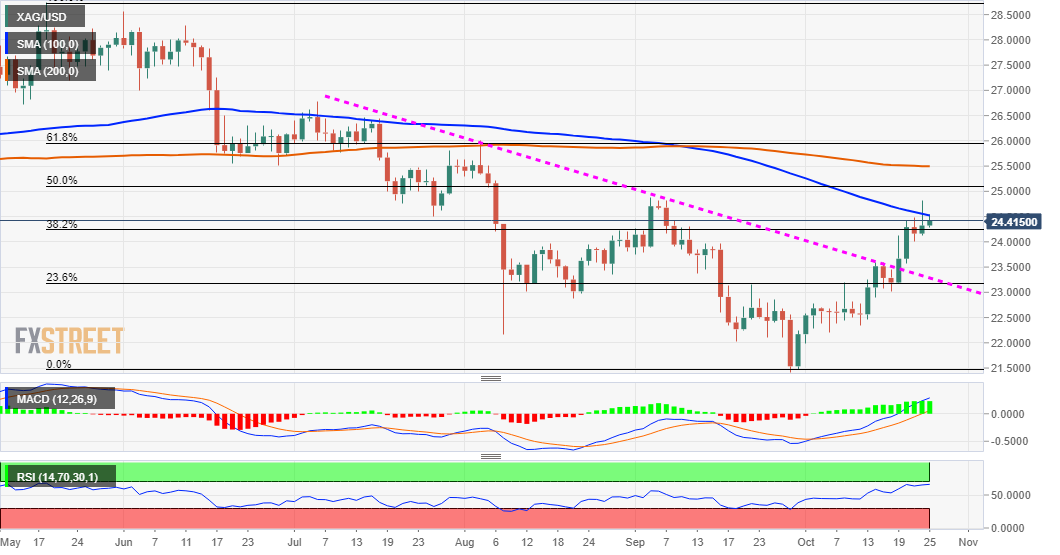
- XAG/USD: Weekly chart depicts the white metal is tilted to the upside but will face resistance at $25.00.
- XAG/USD: Daily chart portrays an upward trend, but RSI is aiming high near overbought levels, indicating that it could consolidate.
- XAG/USD: The 4-hour shows that silver upward move is overextended, as the RSI is one tick below overbought levels.
Silver (XAG/USD) begins the week in a positive tone, climbing 0.97%, trading at $24.54 during the New York session at the time of writing. The market sentiment is upbeat, portrayed by rising US stock indices, recording gains between 0.12% and 1.01%, contrarily US T-Bond yields slide, with the 10-year note rate falling one and a half basis points, sitting at 1.639%.
Meanwhile, the US Dollar Index, which price influences commodity prices, is rising 0.24%, currently at 93.83, putting a lid on silver prices, as it failed to break above $25.00 during the Monday session.
XAG/USD Price Forecast: Technical outlook
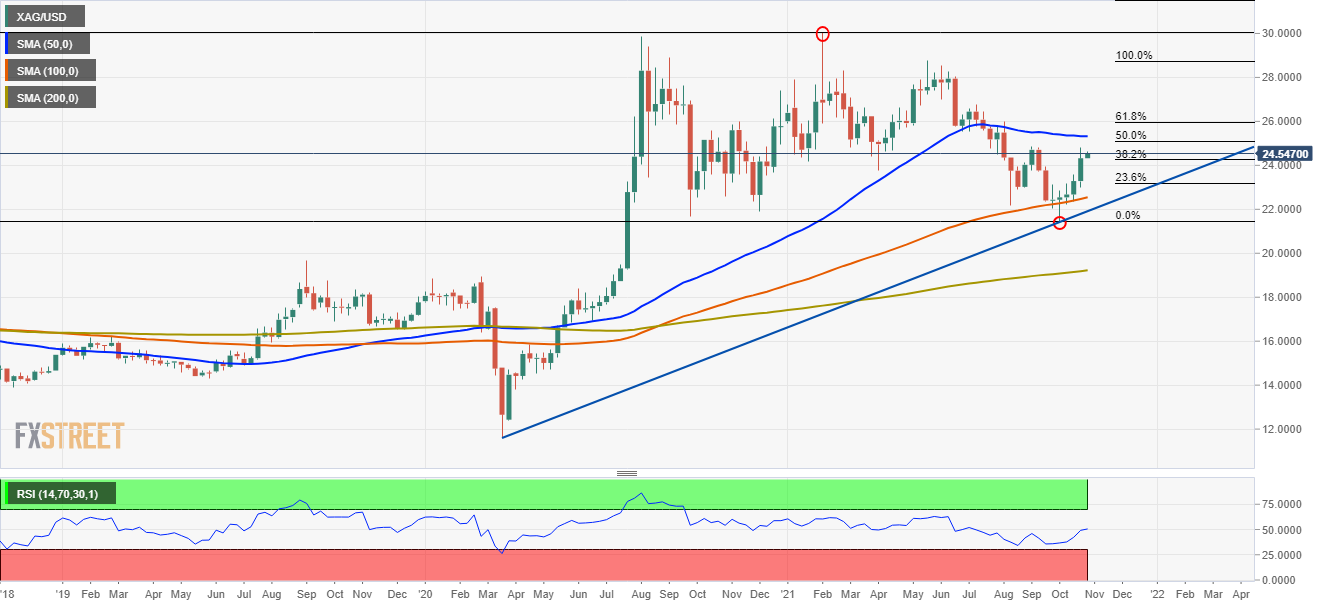
Weekly chart
The white metal is trading above the 38.2% Fibonacci retracement and the 100-week simple moving average (WSMA), near the tops of the month. Silver has an upside bias confirmed by the Relative Strenght Index (RSI), a momentum indicator is at 51, aiming higher.
Nevertheless, to continue its upward move, XAG/USD buyers will need to break above the 50% Fibonacci retracement at $25.10 to reclaim medium-term upward bias.
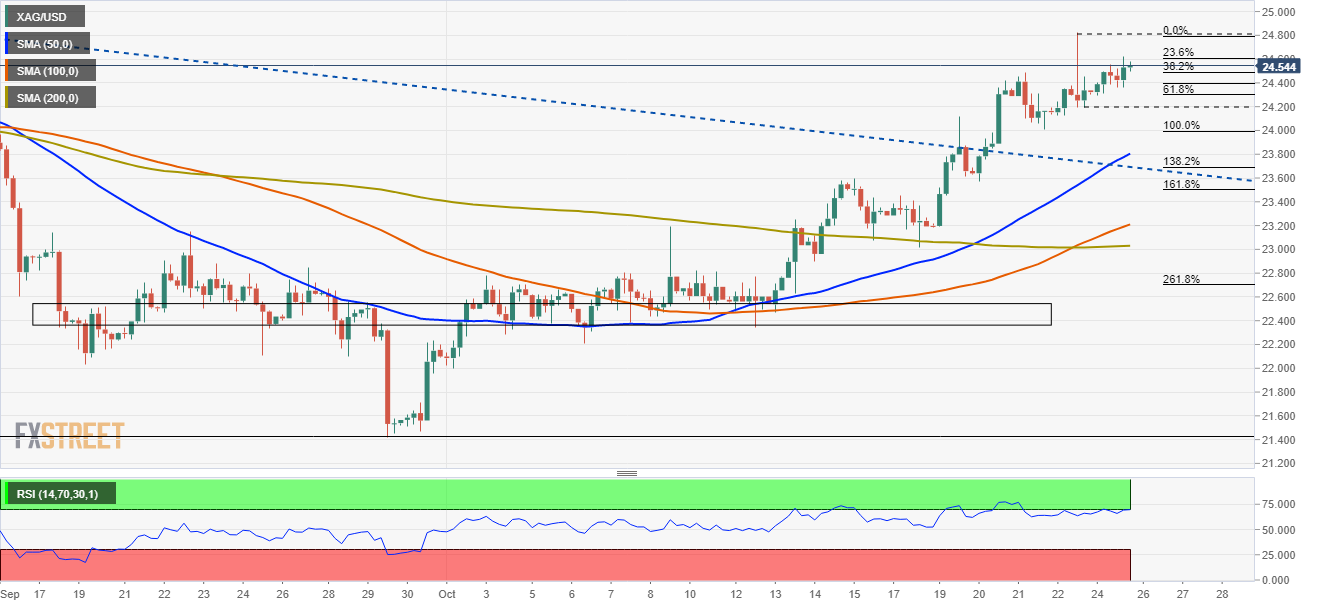
Daily chart
Silver follows the higher-timeframe analysis, as the daily chart depicts the white-metal is in an uptrend. The Relative Strength Index (RSI) at 67 confirms the upward bias, but it is close to overbought levels.
XAG/USD buyers will need a daily close above the 100-day moving average (DMA) at $24.52 to gain further upward strength.
In the case of that outcome, the confluence of the 200-DMA and a downward slope trendline around the $25.20-$25.50 range would be resistance for XAG/USD buyers. A breach of the latter could expose additional supply zones, like the August 4 high at $26.00, followed by the July 16 high at $26.45.
4-hour chart
Silver is in an uptrend, but it has the challenge of printing another leg-up above the $24.82 to extend the rally. The Relative Strength Index (RSI) is at 69, one tick short of reaching overbought levels, leading to a consolidation phase. Nevertheless, in case of a break above the latter, it could extend the rally towards $25.00 and beyond.
On the flip side, failure at the abovementioned level could open the door for a XAG/USD decline towards $24.20-30, as the RSI exits overbought levels before resuming the upward trend.
- USD/CAD is leaning with a bullish bias from a weekly, daily and hourly perspective.
- The bulls are on the verge of a break of the daily H&S neckline.
USD/CAD has been on the backfoot for the month of October so far and sharply so. However, there appears to be a short of momentum into the bull's hands which is illustrated in the following top-down analysis below:
USD/CAD weekly chart
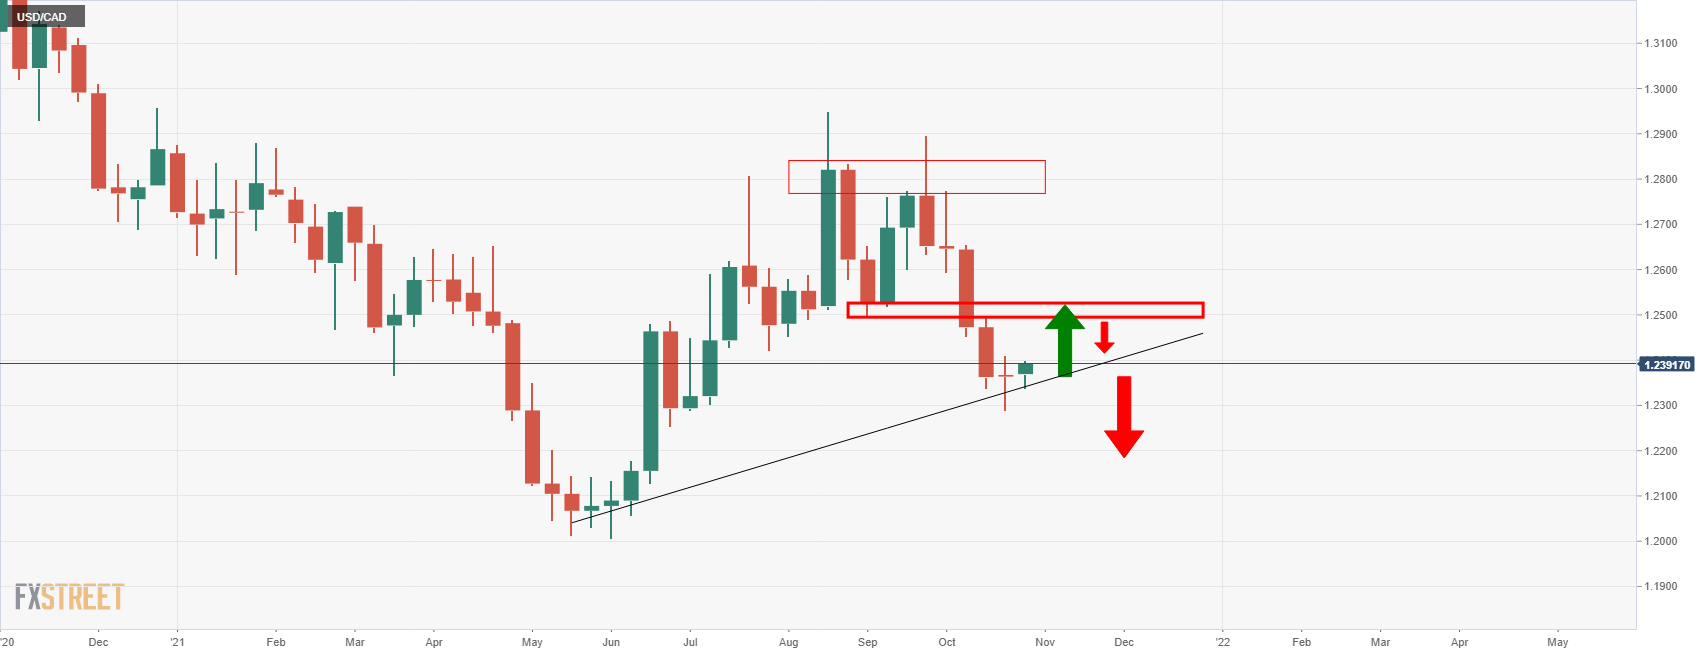
The weekly chart is showing signs of stability at this juncture and a retest of the old support that would be expected to act as resistance this time around is a high probability. This would equate to a bid from what is looking like the makings of a dynamic supporting trendline into the neckline of the M-formation near 1.2500. Should that hold, then the risks will shift to the downside for a restest of the territory below the dynamic support.
USD/CAD daily chart
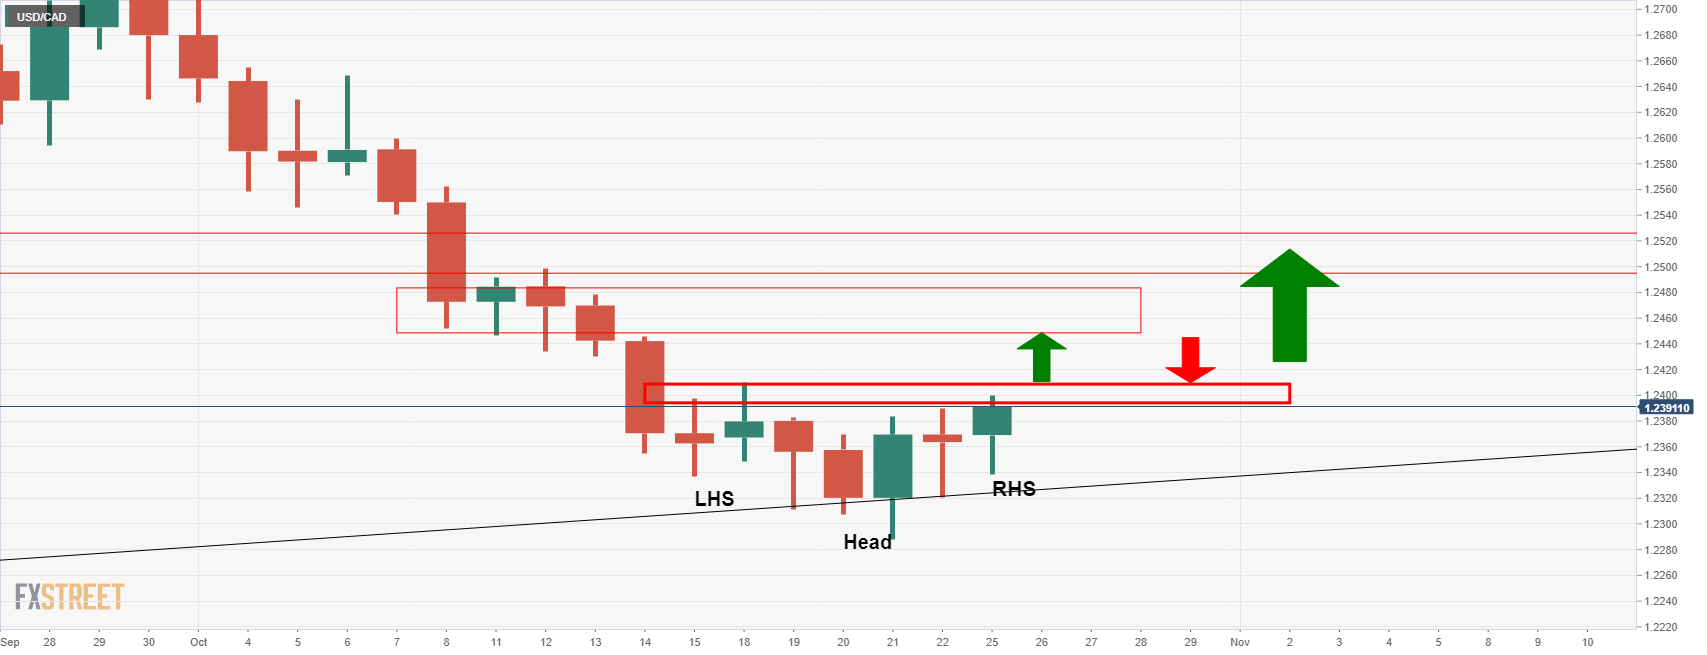
From a daily perspective, we have the makings of a reverse head and shoulders which aligns with the weekly bullish outlook. If the price breaks the neckline resistance, then there will be more resistance expected within the 11 Oct daily candle's range. this could lead to rejection on the first attempt and a restest of the H&S's neckline near to 1.2410 prior to the move into the weekly chart's neckline target near 1.2500.
USD/CAD hourly chart
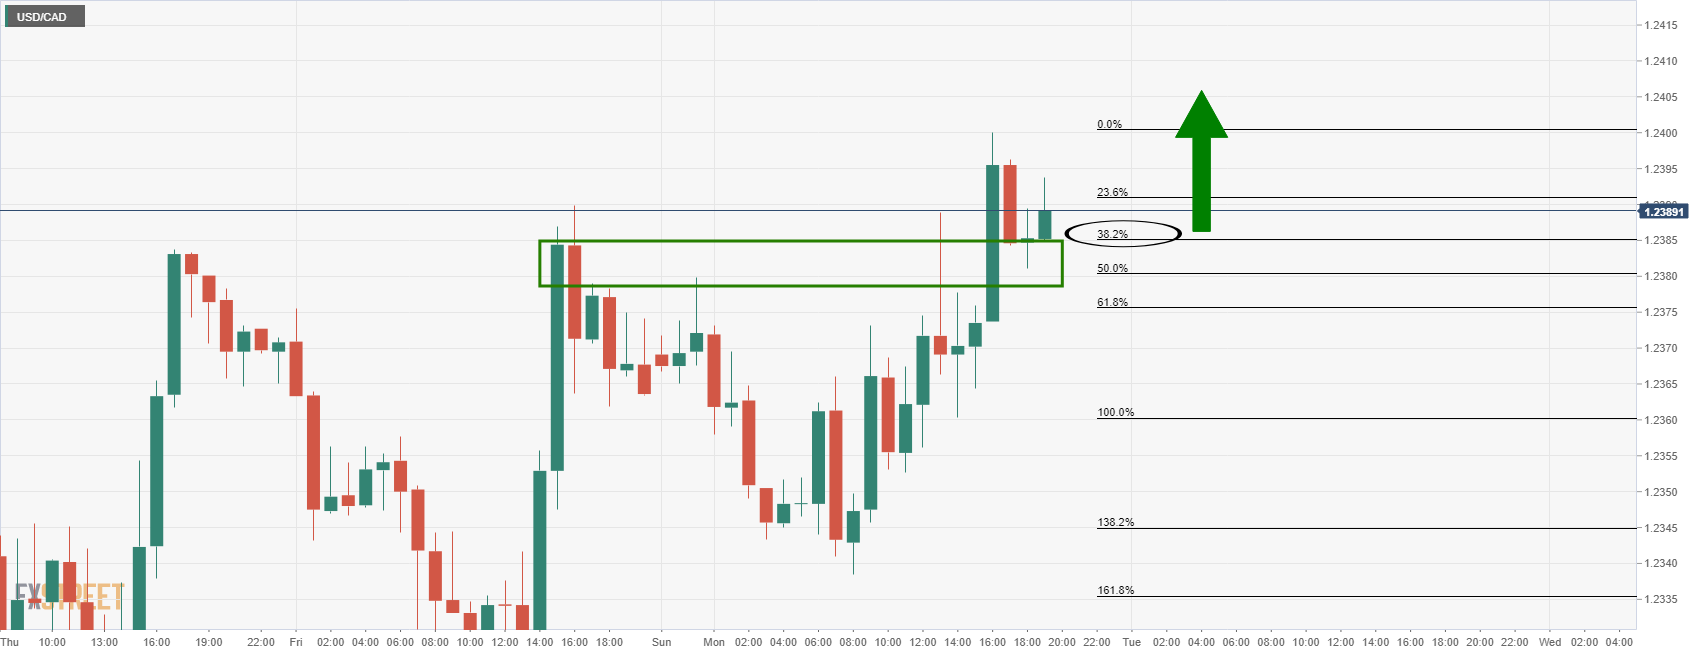
The hourly chart also represents a bullish bias in that the price has already corrected to the 38.2% Fibonacci retracement level of the recent bullish hourly impulse. This is a level where demand could lead to an eventual rally and fresh bullish impulse, in line with the break of the daily H&S neckline.
What you need to know on Tuesday, October 26:
The week started with a pitch of caution ahead of multiple first-tier events. The European Central Bank, the Bank of Japan, and the Bank of Canada will have monetary policies this week. Furthermore, the US will release the preliminary estimate of its Q3 Gross Domestic Product, and core PCE inflation, the US Federal Reserve favourite inflation measure.
The American dollar ended the day mixed against its major rivals, particularly strengthening against the EUR and the CAD. The first was affected by dismal German data, while the second suffered from retreating oil prices. The EUR/USD pair trades around 1.1610 after falling to 1.1590. USD/CAD nears the 1.2400 figure.
GBP and AUD are up against the greenback, although holding below the highs posted last week. Finally, the USD/JPY pair hovers around 113.60, marginally higher on a daily basis.
US Treasury yields kick-started the day ticking higher but finished the day below Friday’s closing levels. The yield on the 10-year benchmark stands around 1.63% after peaking at 1.67%.
Wall Street managed to post modest gains, enough to reach fresh all-time highs.
Mastercard gears up to offer crypto services to network-wide banks and institutions
Like this article? Help us with some feedback by answering this survey:
- The pound ticks up on Monday and returns to 156.50 area.
- The yen loses ground amid a moderate risk appetite.
- GBP/JPY remains positive, aiming to 158.22 – DBS Bank.
The British pound has edged up on Monday against a somewhat softer Japanese yen. The pair found support 155.90 lows, on its retreat from multi-year highs above 158.00, and has advanced to consolidate at the 155.50 area.
The Japanese yen eases on a moderate risk appetite
The safe-haven yen has lost ground on a very calm session on Monday, with the risk-sensitive pound supported by a mild appetite for risk. In absence of key macroeconomic releases, market sentiment has remained fairly positive, with the major stock indexes in the green.
From a wider perspective, however, the major currencies have been trading without a clear direction, with the investors reluctant to place large bets ahead of a string of high-relevance events due later this week.
The monetary policy releases by the Bank of Japan, Bank of Canada, and the European Central Bank, plus the preliminary estimations of US Q3 Gross Domestic product data are expected to open a new impulse to the market and st the near-term direction for the major crosses.
GBP/JPY: Aiming towards the 158.22 high – DBS Bank
The pound remains biased higher, according to Benjamin Wong, Strategist at DBS Bank, heading to levels past 158.00: “A quick look at the daily Ichimoku charts shows bullish momentum remains in a feverish pitch, and there is no affirmation that the 158.22 highs are a verified absolute top. Hence, we remain open to the possibility of the cross assailing higher levels before it ends terminally the bull run that currently came off 148.47, the July 2021 lows.”
Technical levels to watch
- GBP/USD is at the mercy of the markets balancing Brexit and COVID risks to BOE.
- BoE is being priced to hike, but some think it is a rate hike too soon and a mistake.
Sterling rose slightly on Monday but remained within recent ranges as analysts weigh up the expectations that the Bank of England will raise rates against economic data and Brexit headlines.
British Brexit minister David Frost said on Monday that the European Union's proposals to solve the problem of trade involving Northern Ireland did not go far enough and significant gaps remained between the two sides.
It would appear that the UK will continue to play rhetorical brinkmanship, holding off on triggering Article 16 while Frost tries to extract further concessions from European Commission Vice President Maroš Šefčovič. Sooner or later, though, Johnson will have to make a particularly difficult decision: compromise and move on, or provoke a war the UK could well lose.
BoE in focus, a hike too soon?
Meanwhile, money markets are pricing in a rate hike by the Bank of England at its meeting on 4 Nov. However, data from the UK last week was mixed which has resulted in traders dialling back rate hike expectations so soon. For instance, business activity surveys showed improvement as the economy unexpectedly regained momentum in October, but Retail Sales figures were worse than expected which has taken the shine out of the pound recently.
A segment of the market likely believes that policymakers could be making a mistake by tightening policy too quickly. This leaves the pound vulnerable to the downside given that speculators have switched to a small net long position on the pound in the week to Oct 19, positioning data from CFTC showed.
Meanwhile, UK breakeven inflation rates continue to climb. ''This seems to be telling us that the market believes that the BoE is falling behind the curve in terms of fighting inflation, and yet most analysts would probably agree with us that a rate hike now is a mistake,'' analysts at Brown Brothers Harriman argued.
GBP/USD technical analysis
- EUR/USD clings to the 1.1600 figure, despite overall US dollar strength across the board.
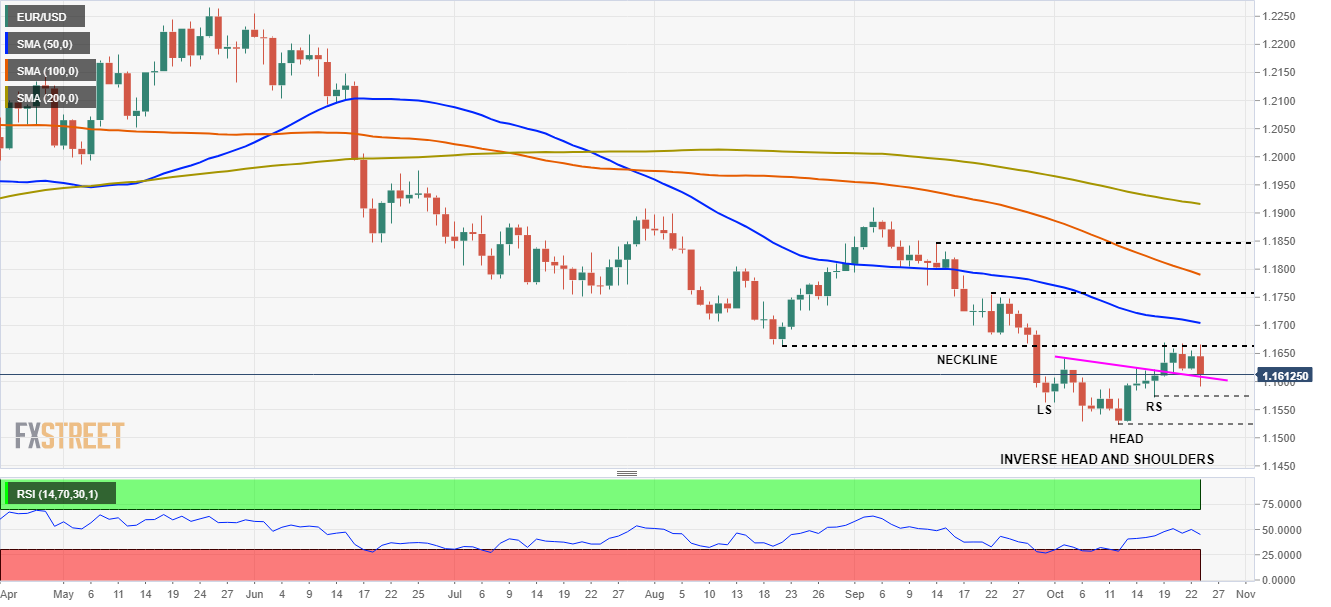
- EUR/USD: If the inverse head-and-shoulders neckline is broken, it will expose 2021 low at 1.1524.
- EUR/USD: The pair needs to reach 1.1700, to confirm the inverse head-and-shoulders pattern.
The EUR/USD slides on Monday during the New York session, trading at 1.1613, down 0.27% at the time of writing. Fading inflation worries, European and US stock indices in the green, and falling US T-bond yields portray a risk-on market sentiment. Safe-haven currencies like the Japanese yen and the Swiss franc fall, except for the US dollar, which benefits from the minimal drop of US yields.
During the Asian session, the shared currency began the week on the front foot, reached a daily high at 1.1665, but as European and American traders got to their desks, the EUR/USD dropped to 1.1590 before settling around the 1.1600 figure.
EUR/USD Price Forecast: Technical outlook
Daily chart
Despite reaching a low below 1.1600, the EUR/USD bounced off the inverse head-and-shoulders neckline. In the last five days, the pair looks trendless, with no clear direction, seesawing around the 1.1590-1.1660 range. The inverse head-and-shoulders pattern could well not be one, as the pair has failed to reach the 1.1700 target. However, as the daily moving averages (DMA’s) with a downward slope remain above the spot price, the EUR/USD is headed to the downside.
For EUR/USD sellers to resume the downward trend, they will need a daily close below the neckline, around 1.1590. In that outcome, the EUR/USD could tumble down to the 2021 lows around 1.1524., but it would find the October 18 1.1571 low as the first support level, before the 1.1524.
On the flip side, an EUR/USD daily upside close above 1.1665 could open the way for the inverse head-and-shoulders pattern of 1.1700.
The Relative Strength Index (RSI) is at 45, aiming lower, indicating that another leg-down might be on the cards.
KEY ADDITIONAL LEVELS TO WATCH
- The euro extends losses to test levels right below132.00.
- Expectations of a dovish ECB are weighing on the EUR.
- EUR/JPY testing support at 131.80.
The common currency is heading south for the third consecutive day against the Japanese yen on Monday. The pair is extending its reversal from last week’s highs at 133.50 area, to levels right below 132.00.
The euro, on the defensive ahead of the ECB monetary policy meeting
The moderate risk appetite witnessed at the week opening, with most equity markets posting gains, has not been enough to lift the euro. The pair remains weighed by rising inflation concerns, ahead of the European Central Bank’s monetary policy meeting, whose conclusions will be released next Thursday.
The next ECB meeting has gathered higher interest for the investors, with inflation pressures rising to levels difficult to ignore. The bank, however, is widely expected to maintain its commitment to the ultra-loose policy and keep its message on the dovish side to avoid creating tensions in peripheral markets. With the rest of the banks starting to set the stage for policy normalization, this will weigh on demand for the euro.
EUR/JPY: Hovering above 131.80 support
The pair is now testing support at 131.80 (61.8% Fibonacci retracement of the May-August decline) Below here, the pair could extend its reversal towards 131.25 (October 11, 12 highs) and then the 100-day SMA at 130.40.
On the upside, the pair should return above 132.80 (October 22 high) to retest October 21 high at 133.50 on track to 2021 highs at 134.00.
Technical levels to watch
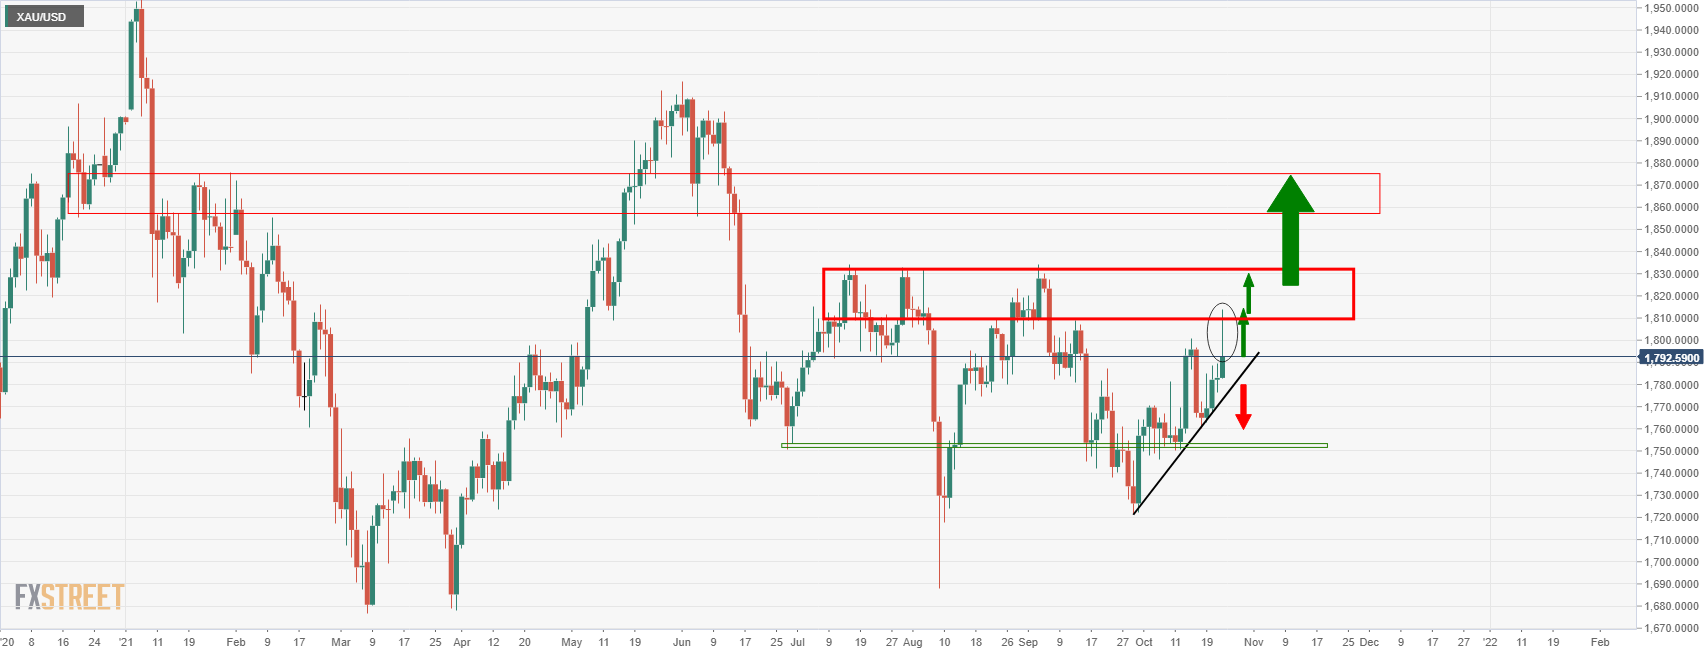
- Gold prices are holding in bullish territory as the New York session progresses.
- Bulls are in charge and target the $1,830s on the approach to Friday's closing high near $1,816.
- XAU/USD bears and bulls fight over $1,800, focus shifts to US GDP
The price of gold has started out the week on the front foot as bulls attack territory towards the highs of Friday's business near to $1,814. At the time of writing, XAG/USD is trading at $1,806 and 0.75% higher on the day. The price of gold has travelled from a low of $1,792.28 to a high of $1,810.07 so far.
The US dollar rose from a one-month low in mid-Asian session as investors looked ahead to central bank meetings and economic data coming later this week. The greenback catches a bid when the concentration is focussed on the Federal Reserve and prospects of a tighter US monetary policy. The risk events this week are heavy which tend to support flows into the greenback as investors position for uncertainty.
Inflation concerns fueling bid in gold
The dollar index DXY was up nearly 0.4 at 93.964 for the day after having fallen to a low of 93.484 which was a one month low following comments on Friday from Federal Reserve Chair Jerome Powell that affirmed plans to cut back on bond purchases.
The 10-year US Treasury rose at the start of the week in Asia to a high of 1.673% whereby the US dollar was supported. However, there has been a turn of trajectory in New York trade and the yield has slipped below the prior day's close and is down some 0.18% at the time of writing which would be expected to give support to the price of gold.
''Inflation concerns are fueling a push higher in gold,'' analysts at TD Securities explained. ''Investors are cautious about the yellow metal as they remain intensely focused on pricing the Fed's exit,'' the analysts explained further.
''Yet, we argue that market pricing for Fed hikes remains far too hawkish, as it fails to consider that a rise in inflation tied to a potential energy shock and lingering supply chain shortages would be unlikely to elicit a Fed response,''
''Reasons to own the yellow metal are growing more compelling as Fed pricing is likely to unwind. In this context, gold prices are tremendously underperforming against historical analogs, but a breakout in the yellow metal from its multi-month downtrend could signal that inflation-hedging flows are finally trumping the speculative exodus tied to Fed pricing,'' the analysts concluded.
ECB vs Fed meetings in focus
Meanwhile, the key data points for the week will be with US Gross Domestic Product and PCE as well as the European Central Bank. In this regard, outcomes will impact the US dollar and therefore gold prices will be vulnerable also. As for the ECB, this is a major risk event for markets given the move higher in yields in recent weeks has presented a challenge for the central bank.
''The October ECB meeting was supposed to be a boring one, but given risen market expectations, now the ECB needs to emphasize its forward guidance. We expect a slightly dovish market reaction to the ECB’s message on Thursday,'' analysts at Nordea argued.
Key points
The analysts at Nordea offered a number of key points ahead of the meeting that takes place later this week on Thursday:
- Previous ECB comments have failed to change market pricing much, and we expect Lagarde to try to emphasize the ECB’s dovish guidance on rates.
- Rapidly rising inflation expectations may already worry the more hawkish Governing Council members.
- Short end pricing may correct somewhat lower on Thursday, but in the bigger picture global inflation worries still have room to escalate.
Overall, this is a slightly dovish forecast that would be expected to weigh on the euro and support the US dollar as investors anticipate that the Fed is ready and willing to announce tapering at the upcoming FOMC meeting on Nov 3.
Powell himself said Friday that “The risks are clearly now to longer and more persistent bottlenecks, and thus to higher inflation.” He added that “I would say our policy is well-positioned to manage a range of plausible outcomes. I do think it’s time to taper and I don’t think it’s time to raise rates.”
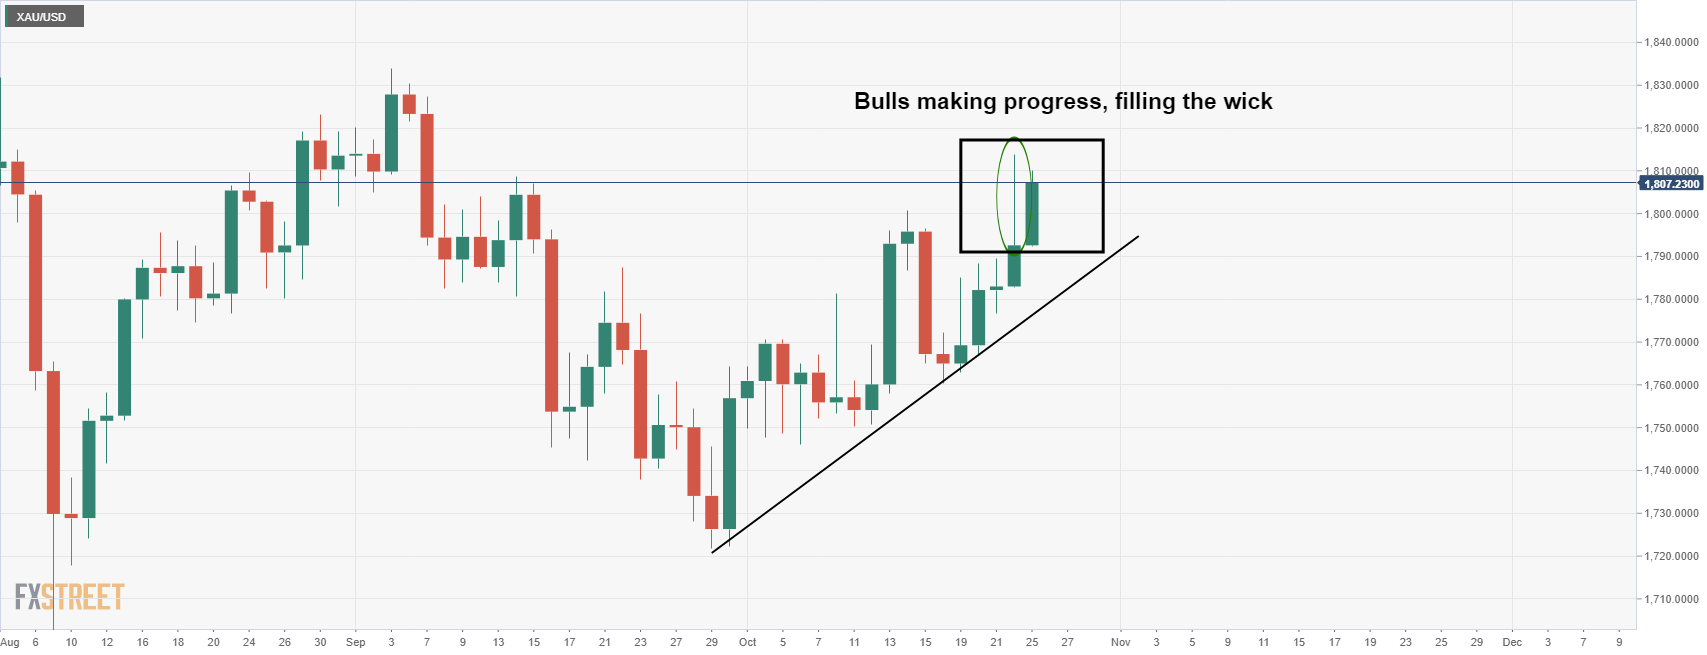
Gold technical analysis
From a daily perspective, the price is attempting a move higher, as Friday's price action shows, and the wick's high of the daily candle was a likely target for the sessions ahead, as illustrated in the following pre-market open analysis: Chart of the Week: Gold bears lurk at weekly trend line resistance
''$1,835 guards territory to $1,880 as follows:
 ''
''
Gold bulls making progress
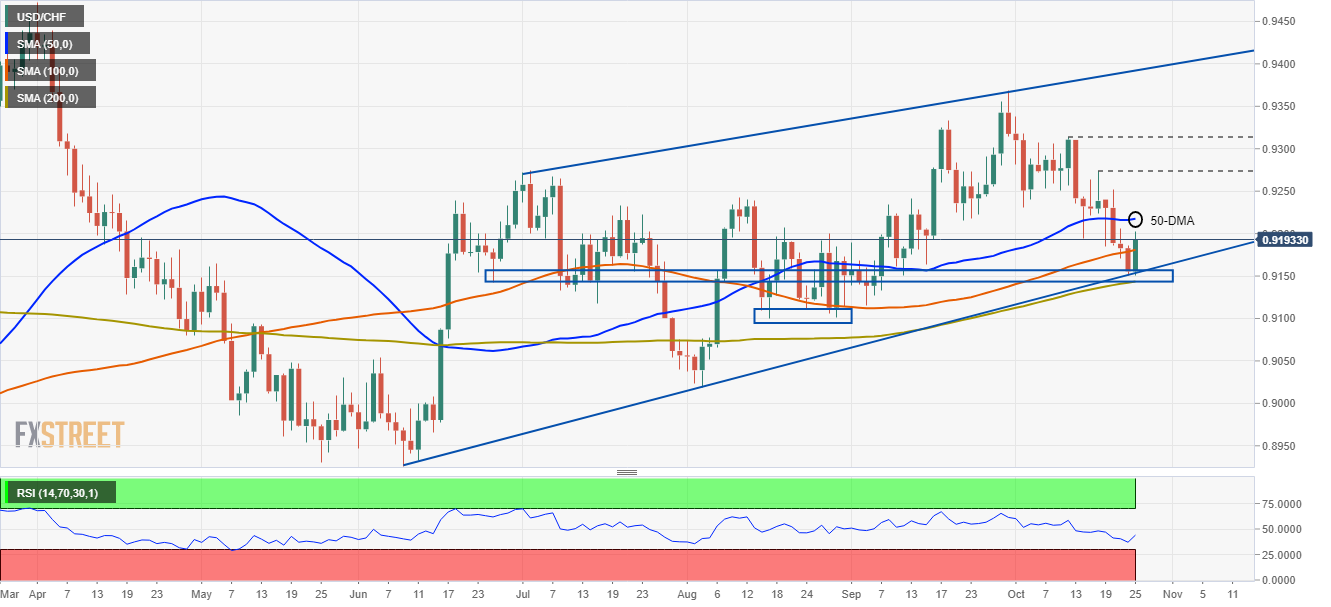
- USD/CHF begins the week on the right foot, up 0.43%.
- Risk-on market sentiment weighs on the Swiss franc.
- Inflation worries ease as investors focus on stocks, as US Government T-bond yields fall.
The USD/CHF climbs at the beginning of the week, trading at 0.9195 during the New York session at the time of writing. The market sentiment is positive, portrayed by US stock indices rising between 0.22% and 1.10%, while the US dollar is also gaining traction, hurting the Swiss franc and the Japanese yen.
In the meantime, inflation worries seem to fade some as witnessed by falling US T-bond yields. The 10-year benchmark note rate falls two basis points (bps) to sit at 1.634%, while the 30-year US Treasury yield is flat at 2.085%. Contrarily the US Dollar Index, which tracks the performance of the greenback against a basket of its peers, advances some 0.20%, currently at 93.83.
USD/CHF Price Forecast: Technical outlook
Daily chart
The USD/CHF is trading above the 100-day moving average (DMA), which lies at 0.9180. Early during the Asian session, the pair traded sideways around the three-month support at 0.9150. However, the confluence of an upward slope trendline from June to August lows unsuccessfully broken, and the October 22 low at 0.9150 spurred a bounce up to 0.9200.
For USD/CHF buyers to resume the upward trend, they will need a daily close above 0.9200. In that outcome, the 50-day moving average (DMA) at 0.9217 would be the first resistance. An upside break could push the price toward the October 18 high at 0.9273, followed by the October 12 high at 0.9313.
On the flip side, failure at 0.9200 would keep the USD/CHF range-bound within the 50-pip range of 0.9150-0.9200. Either way, in case of a break lower of the range, it would open a test of the 0.9100 figure, which was unsuccessfully tested two times in September.
The Relative Strength Index (RSI) is at 44, aiming higher, indicating that the pair could trend up, but it does not have enough upward force, so traders might wait for the RSI to pierce above the 50-midline, before putting aggressive bets.
KEY ADDITIONAL LEVELS TO WATCH
- The kiwi treads water between 0.7130 and 0.7180.
- FX markets remain directionless ahead of key releases this week.
- NZD/USD expected to keep appreciating on the b ack of higher global inflation – ANZ.
The New Zealand dollar is ticking up against the USD on Monday, supported by a modest appetite for risk. The pair has bounced up from 0.7130 lows, although it remains limited below 0.7180.
Sideways trading ahead of key events this week
The kiwi has been trading within recent ranges, slightly higher on the day despite the US dollar’s firmer tone. The US Dollar Index, which measures the value of the dollar against a basket of the most traded currencies has appreciated about 0.2%.
The major currency crosses, however, remain practically flat on the day, with the investors reluctant to place significant bets ahead of key releases later this week. The monetary policy decisions by the European Central Bank, the Bank of Japan and the Bank of Canada, and the preliminary Q3 US Gross Domestic Product are expected to set the direction of currency markets.
NZD/USD: Expected to appreciate amid rising global inflation – ANZ
From a wider perspective, FX analysts at ANZ Bank expect the pair to keep appreciating, supported by the rising inflation: “This correction has really been an AUD and NZD one as markets fade the spectacular rallies seen on crosses like NZD/EUR and NZD/JPY. At this stage it looks more like a rebalancing rather than the start of a fresh downtrend (…) We still think the NZD will benefit from higher interest rates, affirming both carry and confidence in the RBNZ’s inflation credentials.”
Technical levels to watch
- The US dollar edges up, yet it remains capped below 114.00.
- Major currency crosses, flat ahead of key events this week.
- USD/JPY: Set to retest 114.55 – Commerzbank.
The US dollar has edged up on a calm session on Monday, to trim losses following a three-day reversal from four-year highs at 114.65. The pair has remained steady above 113.50 on Monday, yet unable to post a significant recovery, with upside attempts limited below 113.85.
The dollar steadies ahead of key macroeconomic data
Most major currencies have remained trading sideways within previous ranges, with the investors awaiting the release of monetary policy decisions by the European Central Bank, Bank of Japan, and the Bank of Canada plus the preliminary estimation of the third quarter’s US Gros Domestic Product.
The US dollar has been trading on a slightly firmer tone, especially during the Asian and European trading sessions. A moderate appetite for risk, reflected in the positive equity markets has weighed on the safe-haven Japanese yen. Most European markets have closed positive, while in the US, the Dow Jones ticks 0.1% up, the S&P Index rises 0.4% and the Nasdaq Index advances 0.8% buoyed by strong advances in Tesla and Paypal shares.
On the other hand, persisting inflation concerns, with oil prices hitting fresh multi-year highs earlier today, and softer US T-Bond yields, have weighed on demand for the greenback.
USD/JPY: Aiming to 114.55 – ING
On a broader view, Karen Jones, Team Head FICC Technical Analysis Research at Commerzbank, maintains her positive outlook for the USD: “USD/JPY failed to close above the 114.55 October 2018 high last week and has now eased back to the 23.6% retracement at 113.38. Provided this holds the downside we should see recovery and a reattempt on the 114.55 high.”
Technical levels to watch
- The Aussie dollar advances amid risk-on market sentiment in the financial markets.
- The Fed bond taper announcement is perceived as positive for the US dollar, portrayed by the AUD/USD pair.
- Fed’s Chairman Powell: “If we see persistent inflation, we will use our tools.”
The Australian dollar climbs for the second consecutive day, trading at 0.7489 during the New York session at the time of writing. Investors sentiment is positive, as heavy-tech US companies will reveal earnings for the Q3, while US T-bond yields fell, while the US dollar gains.
Despite broad US dollar strength, risk-sensitive currencies like the AUD, the GBP, and the NZD advance during the day. The US Dollar Index, which tracks the buck’s performance against six rivals, is up 0.25%, sitting at 93.84.
The AUD/USD pair reached a daily high at 0.7504 but retreated the move towards 0.7475. Investors seem nervous to open aggressive bets in the pair, as the Fed bond tapering announcement is nearby, perceived as dollar positive. Contrary, despite reducing its bond purchasing program, the Reserve Bank of Australia had sound dovish as they expressed they would raise rates until 2024.
Also, more market participants start betting that the Federal Reserve will make two hikes by 2022, the first one at the beginning of the second half, while the latter by the end of the year. Furthermore, on Friday. Federal Reserve Chairman Powell said that high inflation would likely last well into next year but added that they still expect it to move back down toward their 2% goal.
Furthermore, he added that “If we see persistent inflation, we will use our tools.”
That said, the AUD/USD price action is confined to remain at familiar levels around 0.7400-0.7500, waiting for a fresh catalyst.
In the week ahead, the Australian economic docket will feature inflation figures due on Wednesday. The latter, along with the Advance US GDP for the third quarter on Thursday, will help determine the pair’s trend. Meanwhile, the pair direction will lie on the US dollar sentiment as well as the market mood.
KEY ADDITIONAL LEVELS TO WATCH
- Crude oil futures give away gains after hitting fresh highs at $85.35.
- The oil rally remains intact, boosted by concerns of an oil crunch.
- WTI: Testing support at $83.90 previous resistance.
Front-month WTI is losing steam on Monday’s US trading session after having climbed to a fresh seven-year high above $85.00 earlier today. Crude prices have retreated more than $1,00 so far, hitting session lows at $84.00 area and turning negative on daily charts.
Fears of an energy crunch are boosting oil prices
The West Texas Intermediate (WTI) futures remain moving within a solid upside trend, buoyed by concerns that the tight supply and increasing demand for crude, as the global economy recovers from the COVID-19 crisis, might lead to an energy crunch this winter.
A report from the US bank Goldman Sachs forecasting that we could be “at the beginning of a material repricing for higher oil” has contributed to boosting WTI prices to fresh highs. Goldman Sachs affirms that the UK benchmark Brent oil could hit $90 per barrel by the end of the year (about 4.5% above current prices), as demand is rebounding further and oil producers are dragging their feet to increase supply.
WTI prices about to test support at $83.90
On the downside, WTI futures might find support at the previous resistance level 83.90 (October 18 and 20 highs) below here, next potential targets might be at $82.50 and $81.50 (October 22 low).
Alternatively, if the mentioned 83.90 level holds, upside momentum would remain intact, to set another attempt to break intra-day high at 85.35, on its way towards the 90.00 psychological area.
Technical level to watch
- Euro under pressure as focus turn to Thursday’s European Central Bank meeting.
- EUR/GBP remains sideways near monthly lows, under 0.8470.
The EUR/GBP turned to the downside after being unable to hold above 0.8460 and recently printed a fresh daily low at 0.8426. The cross remains near the lows with a bearish bias but is above the strong support area at around 0.8420.
The euro is among the worst performers on Monday ahead of Thursday’s European Central Bank meeting. Weaker-than-expected German economic data and the EUR/USD of a multi-day range weighed on EUR/GBP.
The ECB meeting is probably the key event for EUR/GBP of the week. “There will be plenty of speculation regarding the end of the PSPP and some form of increasing the PSPP purchase. We expect ECB to flag risks to the outlook and as such not deviate from the current baseline and send new policy signals already now but wait for a new projections round in December”, explained analysts at Danske Bank. The fact there is no unanimous expectation about what the ECB might do or say, will likely trigger volatility in euro’s crosses on Thursday and keep them exposed to rumours prior to the announcement.
From a technical perspective, the EUR/GBP chart shows risk tilted to the downside. While above 0.8420 losses seem limited; a break below should clear the way for a test of 0.8400. A firm recovery above 0.8475 should alleviate the bearish pressure. The next resistance stands at 0.8515.
Technical levels
- The US dollar pulls back after being rejected at 1.2390.
- The pair remains flat ahead of key macroeconomic events later this week.
- USD/CAD might extend losses towards 1.2200 – MUFG.
The US dollar opened the week on a moderately positive tone, and extended its rebound from Friday’s low at 1.2335 to hit resistance again at 1.2385/90 area. The pair has retreated to 1.2360 afterward and remains practically flat on the day.
Sideways trading ahead of key macroeconomic data
The major currency crosses are trading within previous ranges on Monday, with the US dollar slightly firmer against its main rivals in a choppy trading session. Investors remain reluctant to place significant bets ahead of the release of US GDP data and the monetary policy decisions of the European Central Bank, Bank of Japan, and the Bank of Canada.
In absence of relevant macroeconomic releases today, persisting inflation concerns and a moderate pullback on US Treasury yields, are keeping US dollar bulls in check. The 10-year bond has ticked down to 1.63% on Monday from multi-month highs at 1.68% last week which is weighing on demand for the greenback.
Regarding the Canadian dollar, rising expectations that the Bank of Canada will be forced to start hiking rates ahead of schedule are supporting the CAD, which has appreciated more than 3% in the last five weeks. In this context, some market voices, anticipate that the BoC might start raising the tone of its message after this week’s meeting, which might give a fresh boost to the loonie.
USD/CAD: Scope to a slide to 1.22 –MUFG
From a technical perspective, the FX Analysis Team at MUFG observes the CAD supported by fundamentals, which could drive the pair towards 1.2200 in the near-term: “The Canadian rate market has moved sharply over the past month to price in both earlier BoC hikes and a larger hiking cycle. Weekly QE purchases are currently running at CAD2 B, and the BoC could announce plans to formally bring an end to QE this year. To reinforce upward momentum for the CAD, the BoC will also have to drop forward rate guidance (..)The next key support area comes in at around the 1.2200-level.”
Technical levels to watch
- Euro trims losses versus US dollar, recovers 1.1600.
- US dollar retreats across the board as US yields slide.
The EUR/USD bottomed earlier on Monday at 1.1589, reaching the lowest level in a week. After the beginning of the American session, it rebounded, and it is hovering around 1.1615, down for the day, but off lows.
The break under 1.1615 in EUR/USD ended days of a range trading between 1.1615 and 1.1670. The euro is back near the 1.1620 area; a recovery back above should alleviate the bearish pressure. The euro remains among the worst performers on Monday ahead of Thursday’s ECB meeting.
“The Eurozone focus is on the ECB meeting, but I don't think it's a big market driver, barring a jaw-dropping shift to a hawkish bias. What the euro needs, if it is to make a break higher, is better economic data. Supply-chain issues have hurt and if that doesn't change, then the euro will meander until the US rate outlook triggers the next leg down in EUR/USD and a further reversal of the move up we've seen since the Fed came to everyone's aid in March 2020”, said Kit Juckes, Chief Global FX Strategist at Société Générale.
The dollar lost momentum amid a decline in US yields. The 10-year dropped from 1.68% to 1.62% in a few minutes, and pushed the DXY away from the 94.00 area. Also, risk appetite weighed on the greenback. The S&P 500 index hit a record high and is up 0.28%; the Nasdaq gains 0.52%.
Economic data from the US surpassed expectations with the Dallas Fed Manufacturing Index rising to 14.6 in October above the 6.8 of market consensus. The key report will be Q3 growth numbers on Thursday.
Technical levels
- The British pound advances despite US dollar strength across the board.
- Brexit: David Frost said, “The problem with the EU proposals on Northern Ireland is that they don’t go far enough.”
- BoE Tenreyro: Not in a rush to lift rates.
The GBP/USD stalled at 1.3800 for the second consecutive day in a row, failing to print a sustained break above the figure, but as of the last couple of hours, it bounced off the daily low at 1.3739, trading at 1.3768 during the New York session at the time of writing.
The risk-sensitive British pound is advancing, despite US dollar strength across the board. Worries about inflation seem to easy a little, as major US heavy-tech companies, like Facebook, Alphabet, Apple, and Facebook, will unveil earnings for the third quarter, keeping the market sentiment upbeat.
Meanwhile, the US Dollar Index that tracks the greenback’s performance against a basket of peers advances 0.16%, at 93.79, while the US 10-year treasury yield sheds almost three basis points, down to 1.627%.
Brexit woes seem to keep GPB/USD price action within the 1.3700-1.3800 range. On Monday, David Frost, British Brexit main negotiator, said that the EU proposals would not deliver the “freeing up of trade” they would want to see, per Reuters. Further added, “The problem with the EU proposals on Northern Ireland is that they don’t go far enough.”
BoE Tenreyro: Not in a rush to lift rates
Earlier during the day, Silvana Tenreyro, an external member of the Bank of England, said that she needed more time to judge how the furlough scheme would affect the labor market, signaling that she was not in a rush to lift rates. Moreover added that inflation pressures from surging energy prices were likely to fade quickly.
Tenreyro, still one of the dovish members of the BoE, adopted a different tone to the one portrayed by Governor Andrew Baily, which said that the BoE “will need to act” to curb inflationary pressures.
According to Brown Brothers Harriman in a note to clients, the expectations of a Bank of England tightening remain elevated. “Q4 liftoff is fully priced in, along with four more hikes over the course of 2022,” said in the note.
Across the pond, in the US, the blackout period for Federal Reserve members would leave investors, with a good number of policymakers favoring the bond taper announcement by the November meeting.
In the US economic docket, the Dallas Fed Manufacturing Business Index rose to 14.6, higher than the 6.8 foreseen by economists. Additional details of the publication showed that the Employment Index rose to 28.3 from 26.3, and the New Orders Index climbed to 14.9 from 9.5.
KEY ADDITIONAL LEVELS TO WATCH
David Frost, the British minister responsible for implementing the Brexit deal, said on Monday that the European Union's proposals wouldn't deliver the "freeing up of trade" they would want to see, as reported by Reuters.
"The problem with the EU proposals on Northern Ireland is that they don't go far enough," Frost added and reiterated that significant gaps remain.
Market reaction
The initial market reaction to these comments was largely muted. As of writing, the GBP/USD pair was trading at 1.3758, where it virtually unchanged on a daily basis.
- Dallas Fed Manufacturing Index rose more than expected in October.
- US Dollar Index stays in the positive territory near 93.80.
The activity in Texas' manufacturing sector continued to expand at a robust pace in October with the headline General Business Activity Index of the Dallas Fed's monthly survey improving to 14.6 from 4.6 in September. This reading surpassed the market expectation of 6.8.
On a negative note, the Manufacturing Output Index edged lower to 18.3 from 24.2 in September. Additional details of the publication showed that the Employment Index rose to 28.3 from 26.3 and the New Orders Index climbed to 14.9 from 9.5.
Market reaction
This report doesn't seem to be having a noticeable impact on the greenback's performance against its major rivals. As of writing, the US Dollar Index was up 0.2% on the day at 93.80.
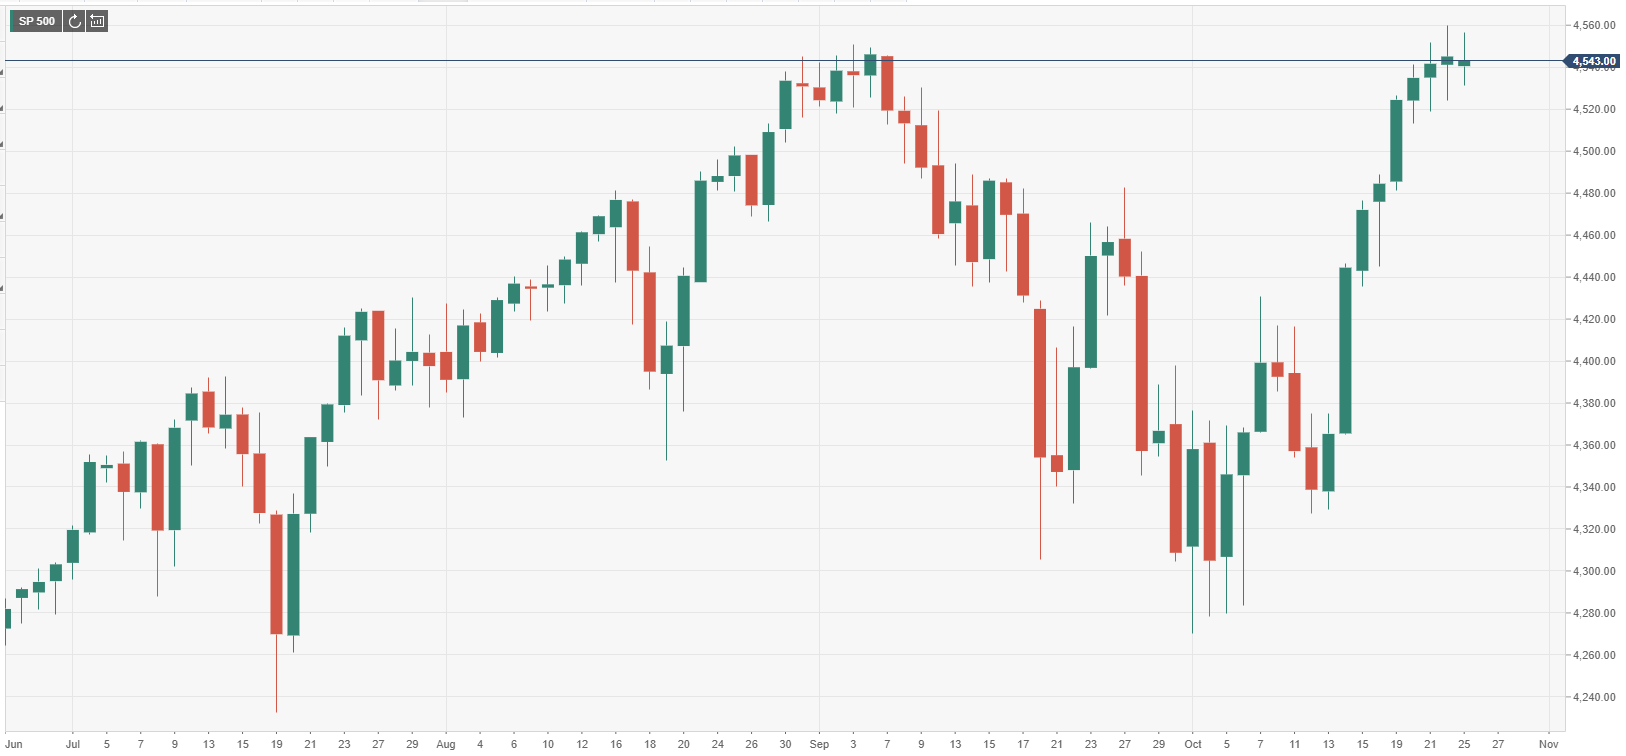
- Wall Street's main indexes opened near last week's closing levels.
- Energy stocks post strong gains on the back of rising crude oil prices.
- Technology shares underperform after the opening bell on Monday.
Major equity indexes in the US started the new week in a relatively calm manner amid varying performances of major sectors. As of writing, the S&P 500 Index was unchanged on the day at 4,542, the Dow Jones Industrial Average was losing 0.1% at 35,642 and the Nasdaq Composite was flat at 15,092.
Among the 11 major S&P 500 sectors, the Energy Index is up 1.1% supported by rising crude oil prices. Earlier in the day, the barrel of West Texas Intermediate (WTI) hit its strongest level in seven years at $85.35.
On the other hand, the Communication Services Index is down 0.55% as the biggest decliner after the opening bell.
Earlier in the day, the Federal Reserve Bank of Chicago reported that the economic growth lost momentum in September with its National Activity Index dropping to -0.13 from 0.05 in August.
S&P 500 chart (daily)
- Gold caught some fresh bids on Monday amid the latest COVID-19 breakout in China.
- Resurgent USD demand, elevated US bond yields could cap gains for the commodity.
- Acceptance above 100/200-day SMAs supports prospects for further near-term gains.
Gold attracted fresh buying on the first day of a new trading week and built on the intraday positive move through the early North American session. The latest COVID-19 outbreak in China raised concerns about the imposition of economically damaging lockdowns amid the country's ‘zero-tolerance approach to the disease. This, to a larger extent, overshadowed the dominant risk-on mood in the markets and turned out to be a key factor that acted as a tailwind for the safe-haven XAU/USD.
Apart from this, the uptick could further be attributed to some technical buying following Friday's break through the 100/200-day SMAs confluence hurdle. That said, a solid US dollar rebound from near one-month tops might hold bullish traders from placing aggressive bets around the dollar-denominated gold. The greenback was back in demand in the wake of the emergence of heavy selling around the shared currency and was further underpinned by elevated US Treasury bond yields.
In fact, the yield on the benchmark 10-year US government bond held steady above the 1.65% threshold amid growing acceptance that the Fed will tighten its policy sooner than anticipated. The Fed Chair Jerome Powell reaffirmed on Friday that the US central bank remains on track to begin rolling back its massive pandemic-era stimulus. Adding to this, worries that the recent widespread rally in commodity prices will stoke inflation have been fueling speculations about a potential interest rate hike in 2022. This could further collaborate to cap the upside for the non-yielding gold.
Market participants now look forward to the Advance US GDP report, scheduled for release on Thursday for a fresh impetus. This, along with key central bank meetings in Canada, Japan and the Eurozone will infuse some volatility around gold during the second half of the week. In the meantime, the US bond yields will play a key role in influencing the USD price dynamics amid absent relevant market moving economic releases. Apart from this, traders might further take cues from the broader market risk sentiment to grab some short-term opportunities.
Technical outlook
From a technical perspective, Friday’s pullback from an intermediate resistance near the $1,812-14 region, or six-week tops warrants some caution for bullish traders. That said, the emergence of dip-buying near the 100/200-day SMAs confluence supports prospects for additional gains. Hence, a subsequent strength towards challenging the next major hurdle, around the $1,832-34 supply zone, remains a distinct possibility.
On the flip side, the daily swing lows, around the $1,792 region, which coincides with the confluence resistance breakpoint, should continue to protect the immediate downside. Any subsequent fall could find decent support near the $1,782 horizontal zone, which if broken decisively will shift the near-term bias in favour of bearish traders. Gold prices might then turn vulnerable to accelerate the decline towards the $1,760 horizontal support en-route monthly swing lows, around the $1,745 region.
Levels to watch
Bank of England (BOE) policymaker Silvana Tenreyro noted on Monday that the recent moderation in the gross domestic product growth looks set to continue over the winter months, as reported by Reuters.
Additional takeaways
"Uncertainty over furlough scheme effects should be resolved over the coming months, which should help paint a clearer picture of labour market."
"We will also continue to learn more about the persistence of disruptions to global and domestic supply chains and their impact on the UK inflation outlook."
"There is a possibility that higher inflation or higher inflation expectations begin to feed through into higher wage demands."
"There is also a risk that the end of the furlough scheme leads to a loosening in the labour market and moderation in wage pressures."
Market reaction
The GBP/USD pair continues to move sideways around mid-1.3700s following these comments.
Bank of England (BOE) policymaker Silvana Tenreyro said on Monday that some inflation drivers are expected to remain short-lived and added that the monetary policy can do little to affect them, as reported by Reuters.
Additional takeaways
"Since August, we have had large upside news for near-term inflation from energy prices, an effect which should fade quickly."
"Effects of supply chain disruption should also be temporary but the speed of rotation back to normal is a key uncertainty."
"Balance of recent news on the economy is unlikely to have a large effect on the amount of tightening required over the next few years."
"Domestic cost pressures will depend on the evolution of the labour market now that the furlough scheme has ended."
"My policy votes will aim to strike a balance between these different effects and risks."
Market reaction
These don't seem to be having a significant impact on the British pound's performance against its major rivals. As of writing, the GBP/USD pair was virtually unchanged on the day at 1.3752.
- The risk-on mood assisted the perceived riskier aussie to gain traction on Monday.
- Elevated US bond yields revived the USD demand and capped any meaningful gains.
- Investors now await the Australian CPI report and Advanced US GDP for a fresh impetus.
The AUD/USD pair maintained its bid tone through the early North American session and was last seen trading around the 0.7485-90 region, up 0.35% for the day.
The pair attracted fresh buying on the first day of a new trading week amid the dominant risk-on mood in the markets, which tends to benefit the perceived riskier aussie. However, a goodish pickup in the US dollar failed to assist the AUD/USD pair to capitalize on its move or find acceptance above the key 0.7500 psychological mark.
The greenback drew some support from elevated US Treasury bond yields and staged a solid rebound from near one-month lows touched earlier this Monday. In fact, the yield on the benchmark 10-year US government bond held steady above the 1.65% threshold growing acceptance that the Fed will tighten its policy sooner than anticipated.
The Fed Chair Jerome Powell reaffirmed on Friday that the US central bank remains on track to begin rolling back its massive pandemic-era stimulus. The markets have also been pricing in the possibility of a potential interest rate hike in 2022 amid worries that the recent widespread rally in commodity prices will stoke inflation.
This, in turn, was seen as a key factor that kept a lid on any meaningful gains for the AUD/USD pair amid absent relevant market moving economic releases from the US. Investors also refrained from placing aggressive bets, rather preferred to wait on the sidelines ahead of this week's important macro data from Australia and the US.
The quarterly Australian consumer inflation figures are due for release on Wednesday. This, along with the Advance US Q3 GDP report on Thursday, will help determine the next leg of a directional move for the AUD/USD pair. In the meantime, the USD price dynamics and the broader market risk sentiment will be looked upon for some trading impetus.
Technical levels to watch
- Chicago Fed's National Activity Index fell into the negative territory in September.
- US Dollar Index continues to push higher toward 94.00.
The data published by the Federal Reserve Bank of Chicago showed on Monday that the National Activity Index (CFNAI) declined to -0.13 in September from 0.05 (revised from 0.29) in August.
This print suggests that the economic activity grew at a slower pace in September than it did in August.
"The CFNAI Diffusion Index, which is also a three-month moving average, edged up to +0.22 in September from +0.20 in August," the publication further read.
Market reaction
The greenback continues to outperform its rivals after this report and the US Dollar Index was last seen gaining 0.26% on the day at 93.85.
- Silver gained some positive traction on Monday, albeit lacked any follow-through buying.
- The set-up seems tilted in favour of bullish traders and supports prospects for further gains.
- Any meaningful pullback might still be seen as a buying opportunity near the $24.00 mark.
Silver edged higher on the first day of a new trading week, albeit struggled to capitalize on the move and remained capped near the 100-day SMA resistance around mid-$24.00s.
From a technical perspective, last week's sustained strength beyond a short-term descending trend-line resistance validated an inverted head and shoulders bullish breakout. A subsequent move and acceptance above the 38.2% Fibonacci level of the $28.75-$21.42 downfall supports prospects for additional gains.
The constructive set-up is reinforced by bullish technical indicators on the daily chart, which are still far from being in the overnight territory. Hence, some follow-through move beyond the $24.80-85 region, towards reclaiming the key $25.00 psychological mark, remains a distinct possibility.
The latter coincides with the 50% Fibo. level, which if cleared decisively should set the stage for an extension of the appreciating move. The XAG/USD could then climb to an intermediate hurdle near the $25.55-60 region before eventually darting towards the $26.00 mark, or the 61.8% Fibo. level.
On the flip side, any meaningful pullback might continue to attract some buying near the $24.00 mark, which now seems to act as a strong base for the XAG/USD. Failure to defend the mentioned support might prompt some technical selling and accelerate the corrective slide towards mid-$23.00s.
This is closely followed by the $23.20-15 confluence support, comprising of the descending trend-line resistance breakpoint and the 23.6% Fibo. level. A convincing break below will shift the bias in favour of bearish traders and expose the next relevant support near mid-$22.00s.
Silver daily chart
Technical levels to watch
- NZD/USD struggles to gather bullish momentum on Monday.
- US Dollar Index edges higher toward 94.00 following a weak start to the week.
- Eyes on mid-tier macroeconomic data releases from the US.
After closing the second straight week in the positive territory, the NZD/USD pair edged higher during the Asian session on Monday but lost its bullish momentum. As of writing, the pair, which touched a daily high of 0.7180, is virtually unchanged on a daily basis at 0.7150.
DXY rebounds toward 94.00 on rising yields
The renewed USD strength during the European trading hours seems to be weighing on NZD/USD. The US Dollar Index is currently rising 0.26% on the day at 93.85. In the absence of high-tier macroeconomic data releases, the more-than-1% increase witnessed in the benchmark 10-year US T-bond yield is providing a boost to the greenback at the start of the week.
The Federal Reserve Bank of Chicago's National Activity Index and the Dallas Fed Manufacturing Survey will be featured in the US economic docket later in the day. On Tuesday, Trade Balance data from New Zealand will be looked upon for fresh impetus.
In the meantime, US stock index futures are up between 0.1% and 0.3%. In case Wall Street's main indexes gain traction after the opening bell, the dollar could have a hard time finding demand as a safe haven and NZD/USD could look to edge higher. Nevertheless, investors are likely to keep a close eye on the US T-bond yields as well.
Technical levels to watch for
- USD/TRY witnessed a modest pullback from fresh record highs touched earlier this Monday.
- Extremely overbought conditions seemed to be the only factor that prompted profit-taking.
- The near-term fundamental backdrop remains tilted firmly in favour favours bullish traders.
The USD/TRY pair witnessed a modest pullback from a record high level of 9.8505 touched earlier this Monday and has now filled the weekly bullish gap opening.
The Turkish lira plunged in reaction to developments over the weekend, wherein President Tayyip Erdogan told his foreign ministry to expel the ambassadors of 10 Western countries. This comes after the Turkish central bank (CBRT) last week decided to cut interest rates from 19% to 16%, which was seen as another factor that acted as a headwind for the domestic currency.
On the other hand, the recent strong rally in the US Treasury bond yields continued lending some support to the US dollar. This, in turn, provided an additional lift to the USD/TRY pair, though extremely overbought conditions kept a lid on any further gains, rather prompted some profit-taking at higher levels. That said, the bias remains tilted in favour of bullish traders.
Investors expect that the country’s business conditions could worsen if it gets into another conflict with the west. Adding to this, CBRT believes that high interest rates lead to high inflation and has adopted an unorthodox monetary policy. Conversely, growing market acceptance for an early policy tightening by the Fed supports prospects for the emergence of some dip-buying.
Hence, it will be prudent to wait for a strong follow-through selling before confirming that the recent bullish trajectory has run out of steam and that the USD/TRY pair has topped out.
The Turkish lira is under pressure. Axel Rudolph, Senior FICC Technical Analyst at Commerzbank, expects the USD/TRY pair to reach new all-time highs at the psychological 10.0000 mark.
Immediately bullish while above the October 20 low at 9.2010
“USD/TRY’s advance has reached all our daily Point & Figure upside targets and may touch the psychological 10.0000 mark around which it is expected to soon stall. If not, we would have to allow for an hourly 0.01 x 3 Point & Figure upside target at 11.0400 to be reached.”
“We will stay immediately bullish while the cross remains above the October 20 low at 9.2010. Below it, a two-month support line can be found at 9.1721 and the September high at 8.9636. Further down sits the early October low at 8.8037. While remaining above the latter level, overall upside pressure should retain the upper hand.”
USD/BRL trades at levels last seen in April when the pair reached the 5.7560 mark. Above here lies 5.8795/5.9710 and the psychological 6.000 level, Axel Rudolph, Senior FICC Technical Analyst at Commerzbank, reports.
Recent surge higher has nearly reached the 5.7560 April high
“USD/BRL’s rise is seen to accelerate higher and has practically reached the April high at 5.7560. The next higher March peak at 5.8795 may soon also be reached. Further up the May 2020 high can be found at 5.9710 and also the psychological 6.0000 mark.”
“While the currency pair stays above the 5.4342 mid-October low we will retain our short-term bullish view. Further down meander the 200 and 55-day moving averages at 5.3533/14 and lies the five-month uptrend line at 5.3022.”
EUR/CHF maintains its breakdown below major support at 1.0704/1.0696. Subsequently, economists at Credit Suisse stay biased to the downside, with next support at 1.0660.
EUR/CHF’s decline to take a breather at 1.0600
“EUR/CHF maintains its break below major support at 1.0704/1.0696, which turned our bias to the downside. Support is seen next at the 1.0660/57 low from November 2020, before retracement support at 1.0642, then another prominent price low at 1.0605/00, where we would expect to see another pause.”
“The magnitude of this potential breakdown suggests we could even move beyond here over the medium-term and move all the way to the long-term support level at the 2020 low at 1.0503/00, which is likely to be a much tougher support level if reached.”
“First resistance stays at 1.0726, then the recent high at 1.0764/67, before the 55-day average at 1.0789, with a break above here needed to instead suggest a false breakdown.”
USD/RUB is seen slipping back towards the December 2018 high at 69.78. Below this mark lies the 2014-2021 uptrend at 69.52, Axel Rudolph, Senior FICC Technical Analyst at Commerzbank, reports.
Russian rouble appreciates
“USD/RUB continues its descent towards the December 2018 high at 69.78. The next lower 2014-2021 uptrend line at 69.52 may be reached as well. Below it sits the 68.04 June 2020 low.”
“Minor resistance above the 71.55 June low is found at the 72.13 mid-October high and also at the 72.22 September low. Further minor resistance sits between the August and early September lows at 72.55/69. Still, further resistance comes in along the seven-month resistance line at 73.00.”
“For any kind of (unexpected) bullish reversal to gain traction, a rise and daily chart close above the September 20 high at 73.62 would need to be seen. This scenario is highly unlikely, though.”
The market attention shifts towards the European central Bank (ECB) decision. Meanwhile the EUR/USD is supported within range. Economists at OCBC Bank expect the pair to move between 1.1620-1.1670.
Consolidation phase ahead of ECB meeting
“The tight 1.1620 to 1.1670 range for the EUR/USD may persist into the ECB decision, with firmer support/resistance levels at 1.1580/1.1700.”
“Our bias remains to be selling the pair on rallies.”
- EUR/USD lost its traction after pushing higher in Asian session.
- Germany's Bundesbank warns against slowdown in activity in Q4.
- US Dollar Index turns positive on the day above 93.70.
The EUR/USD pair started the new week on a firm footing and rose toward the top of its weekly trading range before reversing its direction. As of writing, the pair was losing 0.2% on a daily basis at 1.1624.
Warning signs from Germany hurt EUR
The disappointing macroeconomic data releases from Germany and Bundesbank's worrisome growth outlook seems to be weighing on the shared currency.
The headline Business Climate Index of the IFO Survey for Germany declined to 97.7 in October from 98.9 in September. This reading fell short of the market expectation of 97.9. Additionally, the Expectations Index fell to 95.4 from 97.4. Meanwhile, Bundesbank said that the full-year growth in 2021 was likely to be significantly lower than the June forecast of 3.7% due to persistent supply chain issues and the loss of momentum in the service sector's business activity.
Germany's Bundesbank: Full-year growth to be significantly below June forecast of 3.7%.
On the other hand, the cautious market mood and rising US Treasury bond yields help the greenback find demand on Monday. The US Dollar Index, which declined to 93.50 area earlier in the day, is currently up 0.15% at 93.75. Later in the session, the Federal Reserve Bank of Chicago's National Activity Index and the Federal Reserve Bank of Dallas' Manufacturing Survey will be looked upon for fresh impetus.
Technical levels to watch for
- USD/JPY staged a modest intraday bounce from ascending channel support on Monday.
- The set-up favours bulls and supports prospects for the resumption of the prior uptrend.
- A convincing break below the trend-channel support would negate the positive outlook.
The USD/JPY pair attracted some buying on the first day of a new trading week and for now, seems to have stalled its recent corrective pullback from multi-year tops. The pair held on to its modest intraday gains, around the 113.65-70 region through the mid-European session, albeit lacked any follow-through.
The dominant risk-on mood undermined the safe-haven Japanese yen and was seen as a key factor that acted as a tailwind for the USD/JPY pair. Bulls further took cues from elevated US Treasury bond yields, which revived the US dollar demand and assisted the pair to defend the lower end of a short-term ascending channel.
The mentioned support coincides with the 23.6% Fibonacci level of the 109.12-114.70 recent strong move up and should now act as a key pivotal point for short-term traders. A sustained break below will suggest that the USD/JPY pair has topped out already and pave the way for a deeper corrective pullback in the near term.
Meanwhile, technical indicators on the daily chart have eased from the overbought territory and are still holding comfortably in the bullish territory. This, along with the emergence of dip-buying near the trend-channel support, favours bullish traders and supports prospects for the resumption of the prior well-established uptrend.
Hence, a subsequent move beyond the 114.40 intermediate hurdle, towards retesting the recent swing highs near the 114.70 region, remains a distinct possibility. The momentum could get extended towards the 115.00 psychological mark, above which bulls could aim to challenge the trend-channel hurdle, around the 115.30-35 region.
Conversely, a sustained break below the trend-channel support might prompt aggressive technical selling and turn the USD/JPY pair vulnerable to weaken further below the 113.00 mark. The next relevant support is pegged near the 112.70-65 region (38.2% Fibo. level) before the pair eventually drops to test the 112.00 round figure.
USD/JPY daily chart
-637707570081633840.png)
Technical levels to watch
In its monthly report published on Monday, Germany's Bundesbank said that the full-year growth in 2021 is likely to be significantly below the June forecast of 3.7% due to a slowdown in activity in the fourth quarter, as reported by Reuters.
Bundesbank further noted that the momentum in the service sector is expected to slow considerably and added that industrial supply chain issues are forecast to persist.
Regarding price pressures, Bundesbank said it sees inflation continuing to rise for the time being before gradually declining in 2022.
Market reaction
The EUR/USD pair remains on the back foot following this publication and was last seen losing 0.2% on the day at 1.1624.
- GBP/USD surrendered a major part of its intraday gains to the 1.3800 neighbourhood.
- Elevated US bond yields underpinned the USD and exerted some pressure on the pair.
- A break below ascending channel support is needed to confirm a fresh bearish break.
The GBP/USD pair struggled to preserve its intraday gains to the 1.3800 neighbourhood and has now retreated to the lower end of its daily trading range. The pair was last seen hovering around mid-1.3700s, just a few pips above lows touched during the Asian session.
The US dollar attracted some buying amid elevated US Treasury bond yields, bolstered by expectations for an early policy tightening by the Fed. This, in turn, was seen as a key factor that prompted fresh selling around the GBP/USD pair and led to the intraday decline.
The downfall dragged the GBP/USD pair back towards key pivotal support marked by the lower boundary of a one-month-old descending channel. A convincing break below will set the stage for an extension of the recent rejection slide from the very important 200-day SMA.
Meanwhile, technical indicators on the daily chart – though have been losing positive traction – are still holding in the bullish territory. This makes it prudent to wait for a convincing break through the channel support before placing aggressive bearish bets.
The mentioned support is currently pegged near the 1.3735 region. Some follow-through selling below the 1.3700 mark will reaffirm the negative outlook and turn the GBP/USD pair vulnerable to accelerate the fall towards the next relevant support near mid-1.3600s.
On the flip side, the 1.3790-1.3800 area now seems to have emerged as immediate strong resistance. This is followed by a downward sloping trend-line resistance extending from late July, currently around the 1.3825 region ahead of the 1.3845-50 confluence barrier.
The latter comprises of 200-day SMA and the top end of the ascending channel, which if cleared decisively will be seen as a fresh trigger for bullish traders. The momentum could then assist the GBP/USD pair to aim back to reclaim the 1.3900 round-figure mark.
GBP/USD daily chart
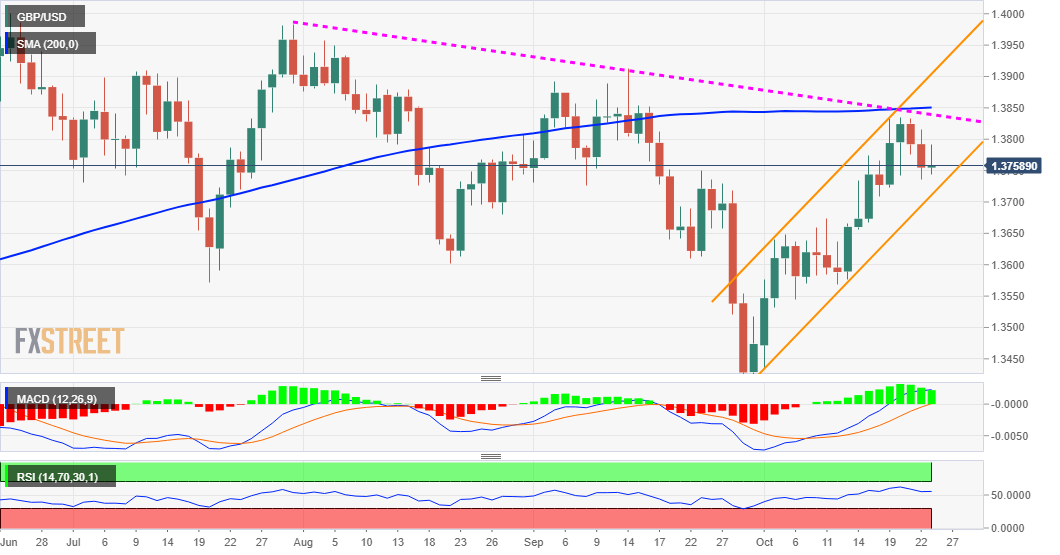
Technical levels to watch
The AUD/USD pair was last seen hovering just below the key 0.7500 psychological mark. Economists at OCBC Bank expect the aussie to fail to surpass the 0.7550/60 resistance zone.
AUD/USD may turn heavy
“Traction above 0.7500 seems to be limited for the AUD/USD, with firm resistance out at the 0.7550/60 zone.”
“Support at 0.7440/50 needs to be overcome for the pair to re-engage downside.”
“Potential for the pair to turn heavy should the hawkish central banks spur another round of risk-off.”
- USD/CAD was seen oscillating in a range through the first half of the trading action on Monday.
- Bullish crude oil prices underpinned the loonie and capped any meaningful gains for the major.
- Elevated US bond yields acted as a tailwind for the USD and extended some support to the pair.
The USD/CAD pair bounced nearly 30 pips from the early European session lows and was last seen trading just a few pips below daily tops, around the 1.2370 region.
The pair, so far, has struggled to capitalize on last week's modest recovery move from four-month lows and continued with its subdued/range-bound price action for the second straight session on Monday. The recent bullish run in crude oil prices to multi-year tops underpinned the commodity-linked loonie. This, in turn, acted as a headwind for the USD/CAD pair amid the lack of any meaningful buying around the US dollar.
The dominant risk-on mood was seen as a key factor that weighed on the safe-haven greenback. That said, elevated US Treasury bond yields – amid prospects for an early policy tightening by the Fed – helped limit losses for USD and extended some support to the USD/CAD pair. The Fed Chair Jerome Powell reaffirmed on Friday that the US central bank remains on track to begin rolling back its massive pandemic-era stimulus.
Moreover, bets for an interest rate hike in 2022 have been rising amid expectations that the recent rally in commodity prices would stoke inflation. The markets, however, seem to have fully priced in hawkish Fed expectations, which might hold the USD bulls from placing aggressive bets. This makes it prudent to wait for a strong follow-through buying before confirming that the USD/CAD pair has bottomed out in the near term.
There isn't any major market-moving economic data due for release on Monday, either from the US or Canada. Hence, the US bond yields and the broader market risk sentiment will play a key role in driving the USD demand and provide some impetus to the USD/CAD pair. Apart from this, traders will further take cues from oil price dynamics to grab some short-term opportunities around the major.
Technical levels to watch
- Gold price eyes a sustained move above $1800 amid USD weakness.
- Market sentiment remains mixed ahead of a critical week.
- Gold bears and bulls fight over $1,800, focus shifts to US GDP.
Gold price is once again testing offers above the $1800 mark, as the bulls look for acceptance above the latter after Friday’s quick retracement from six-week tops of $1814. As risk remains relatively firmer on Monday, courtesy of easing China’s property sector concerns, the US dollar keeps losing additional ground vs. its main competitors, benefiting gold price. Meanwhile, with persistent rising inflation fears amid supply chain crisis and surging energy costs, gold price is likely to keep the upper hand as an inflation hedge.
Read: Gold Price Forecast: A big technical breakout in the offing. Where is XAU/USD headed next?
Gold Price: Key levels to watch
The Technical Confluences Detector shows that gold has recaptured the $1800 mark, with bulls unstoppable, as they target the Fibonacci 23.6% one-day at $1807.
If the buying interest accelerates, then a test of the pivot point one-day R1 at $1811 will be soon on the cards.
The next stop for gold bulls is seen at the previous day’s high of $1814, above which the pivot point one-week R1 at $1818 will be challenged.
Further up, powerful resistance of the pivot point one-month R1 at $1820 will be a tough nut to crack for gold optimists.
Alternatively, sellers will probe the strong resistance-turned-support around $1800, which is the convergence of the Fibonacci 38.2% one-day, Fibonacci 23.6% one-week and Bollinger Band one-day Upper.
Gold bears will then look out for the $1796 cap, which is the SMA5 four-hour.
Further south, a dense cluster of healthy support levels around $1793 will test the bullish commitments.
That area is the intersection of the Fibonacci 38.2% one-week, Fibonacci 61.8% one-day, SMAs100 and 200 one-day.
The last line of defense for gold buyers is the SMA50 one-hour at $1789.
Here is how it looks on the tool
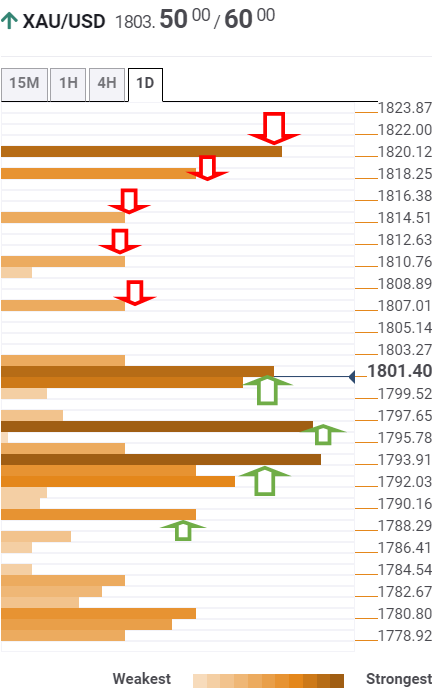
About Technical Confluences Detector
The TCD (Technical Confluences Detector) is a tool to locate and point out those price levels where there is a congestion of indicators, moving averages, Fibonacci levels, Pivot Points, etc. If you are a short-term trader, you will find entry points for counter-trend strategies and hunt a few points at a time. If you are a medium-to-long-term trader, this tool will allow you to know in advance the price levels where a medium-to-long-term trend may stop and rest, where to unwind positions, or where to increase your position size.
- A subdued USD price action assisted EUR/USD to gain some intraday traction on Monday.
- Elevated US bond yields helped limit the USD losses and capped the upside for the major.
- Bulls remained on the sidelines following the release of mixed German IFO survey results.
The EUR/USD pair struggled to capitalize on its modest intraday gains and was last seen hovering around mid-1.1600s, nearly unchanged for the day.
The pair gained some positive traction on the first day of a new week, albeit struggled to capitalize on the move and remained well within a four-day-old trading range. The dominant risk-on mood in the markets weighed on the safe-haven US dollar and extended some support to the EUR/USD pair through the first half of the European session.
However, a combination of factors held bulls from placing aggressive bets and capped the upside just ahead of the 1.1665-70 resistance zone, or monthly tops touched last week. Elevated US Treasury bond yields acted as a tailwind for the greenback and turned out to be a key factor that kept a lid on any meaningful gains for the major.
In fact, the yield on the benchmark 10-year US government bond held steady near the 1.65% mark amid growing acceptance for an early policy tightening by the Fed. Apart from this, the disappointing release of the German IFO survey results failed to impress bullish traders or provide any meaningful impetus to the EUR/USD pair.
The headline German IFO Business Climate Index dropped to 97.7 in October as against consensus estimates for a fall to 97.9 from 98.9 recorded in the previous month. Additional details revealed that the Current Economic Assessment edged lower to 100.1 from 100.4, while the IFO Expectations Index fell to 95.4 from 97.4 in September.
Moving ahead, there isn't any major market-moving economic data due for release from the US. Hence, the US bond yields, along with the broader market risk sentiment will influence the USD price dynamics and provide some impetus to the EUR/USD pair. That said, the momentum is likely to be limited ahead of the European Central Bank meeting on Thursday.
Technical levels to watch
Touching upon the topic of monetary policy, the European Central Bank (ECB) Governing Council member and Spanish central bank chief Pablo Hernandez de Cos said, the general perception is that the ECB’s monetary policy will keep expansive tone 'during the dilated time'.
“The longer the inflation increases lasts, the likelier it will gain persistence,” he added.
- EUR/GBP witnessed some selling on Monday, though lacked a strong follow-through.
- The formation of a rectangle might be categorized as a bearish continuation pattern.
- Mixed oscillators on hourly/daily charts warrant some caution for aggressive traders.
The EUR/GBP cross edged lower during the first half of the trading action on Monday and refreshed daily lows, around mid-0.8400s during the early European session.
The United Kingdom hinted at a compromise on the post-Brexit Northern Ireland trade rules. This, in turn, was seen as a key factor behind the British pound's relative outperformance and exerted some pressure on the EUR/GBP cross. The downside, however, remains cushioned amid a modest pickup in demand for the shared currency, which drew some support from a subdued US dollar demand.
Moreover, diminishing odds for an early policy tightening by the Bank of England held traders from placing aggressive bullish bets around the sterling. Investors also seemed reluctant, rather preferred to wait on the sidelines ahead of the European Central Bank meeting on Thursday. This further contributed to limiting any meaningful slide for the EUR/GBP cross, at least for now.
Looking at the technical picture, bulls, so far, have struggled to capitalize on last week's bounce from the lowest level since February 2020. The upside remained capped near the top boundary of a one-week-old trading range, which constitutes the formation of a rectangle. Given the recent sharp decline, the rectangle could still be categorized as a bearish continuation pattern.
Meanwhile, the intraday decline, so far, has shown some resilience below the 200-hour SMA. Moreover, technical indicators on hourly charts have been gaining positive traction, though are yet to recover fully from the bearish territory on the daily chart. This further warrants some caution before placing any aggressive directional bets around the EUR/GBP cross.
From current levels, bulls are likely to wait for a strong follow-through buying beyond the 0.8465-70 region before placing fresh bets. A sustained move beyond should allow the EUR/GBP cross to reclaim the key 0.8500 psychological mark. The recovery momentum could further get extended towards the next relevant hurdle near the 0.8525-20 supply zone en-route mid-0.8500s.
On the flip side, the 0.8420-15 region, or the lower boundary of the mentioned trading band should continue to protect the immediate downside. A convincing break below will be seen as a fresh trigger for bearish traders and turn the EUR/GBP cross vulnerable to break below the 0.8400 mark. The downward trajectory could eventually drag the cross to the 0.8335 support area.
EUR/GBP 1-hour chart
-637707478918635107.png)
Technical levels to watch
The European Central Bank (ECB) Governing Council member and Spanish central bank chief Pablo Hernandez de Cos said Monday, “supply chain problems and rising raw material prices affect negatively economic recovery pace.”
“Recent developments anticipate a significant downward economic outlook revision for 2021,” said de Cos.
The FX market is continuing to weigh up the risk of more persistent inflation. Lee Hardman, Currency Analyst at MUFG Bank, expects the US dollar to strengthen against the euro, the Swiss franc and the Japanese yen given that their central banks are set to keep a dovish stance shrugging off higher inflation.
Market is expecting more hawkish Fed if higher inflation persists
“The Fed is beginning to display more concern over the risk that higher inflation could become more embedded in the economy. It provides justification for the Fed to begin QE tapering from next month and to bring QE to an end by around the middle of next year. That would then leave open the second half of next year for the Fed to begin raising rates if higher inflation proves more persistent than policymakers currently believe.”
“The US rate market has already moved along way to price in this scenario with two 25bps now priced into 2022 followed by a further three 25bps hikes in 2023. It is continuing to place upward pressure on US rates.”
“Support for the US dollar from higher US yields has been dampened so far this month both by the improvement in global investor risk sentiment, and by similar rise in yields outside of the US on average in other G10 economies. As a result yield spreads have not moved decisively in favour of the US dollar.”
“The case for a stronger US dollar is more compelling against the low yielding G10 currencies of the EUR, CHF and JPY where market participants are more comfortable that their domestic central banks will keep rates low despite higher inflation.”
The CAD has continued to trade on a stronger footing over the past week with USD/CAD hitting an intra-day low of 1.2288. Fundamentals remain supportive for CAD strength but risk/reward balance for further near-term gains less favourable now, economists at MUFG Bank report.
Will the BoC or OPEC+ meetings spoil the CAD party?
“The next key support area comes in at around the 1.2200-level.”
“The Canadian rate market has moved sharply over the past month to price in both earlier BoC hikes and a larger hiking cycle. Weekly QE purchases are currently running at CAD2 B, and the BoC could announce plans to formally bring an end to QE this year. To reinforce upward momentum for the CAD, the BoC will also have to drop forward rate guidance.”
“The CAD has been benefiting from the higher price of oil. Our oil analyst expects the higher price of oil to be sustained as the current fundamental setup couldn’t be more favourable, and has set a year end forecast for Brent at $85/barrel. It should help to support a stronger CAD heading into year-end although we are wary of downside risks posed by the upcoming OPEC+ meeting on 4th November which also coincides with the COP26 climate talks.”
“While momentum still favours further CAD gains in the near-term, the risk/reward balance has become less favourable at current stronger levels.”
Following the release of the German IFO Business Survey, the institute’s Economist Klaus Wohlrabe said that “supply chain problems are causing trouble for companies, production capacities are falling.”
Additional quotes
Supply chain problems are causing trouble for companies, production capacities are falling.
In the manufacturing sector, business sentiment has fallen, same with services and trade.
German economy is facing an uncomfortable autumn.
Problems in industry are still virulent, procurement issues are leading to sinking capacity.
In auto sector capacity utilization has fallen to 78.2 from 85.2.
Supply chain problems are impacting stores.
EUR/USD remains capped below 1.1670
EUR/USD is keeping its range trade intact below 1.1670 amid a better market mood and mixed German data. The spot was last seen trading at 1.1657, adding 0.08% on the day.
- German IFO Business Climate Index came in at 97.7 in October.
- IFO Current Economic Assessment rose to 100.1 this month.
- October German IFO Expectations Index arrived at 95.4, a miss.
The headline German IFO Business Climate Index dropped further to 97.7 in October versus last month's 98.9 and the consensus estimates of 97.9.
Meanwhile, the Current Economic Assessment arrived at 100.1 points in the reported month as compared to last month's 100.4 and 99.4 anticipated.
The IFO Expectations Index – indicating firms’ projections for the next six months, fell to 95.4 in October from the previous month’s 97.4 reading and worse than the market expectations of 96.4.
Market reaction
EUR/USD remains unfazed by the mixed German IFO survey, keeping its range just above 1.1650.
At the time of writing, the spot is up 0.10% on the day, trading at 1.1660.
About German IFO
The headline IFO business climate index was rebased and recalibrated in April after the IFO research Institute changed series from the base year of 2000 to the base year of 2005 as of May 2011 and then changed series to include services as of April 2018. The survey now includes 9,000 monthly survey responses from firms in the manufacturing, service sector, trade and construction.
Euro Stoxx 50 has pushed beyond a multi month descending channel (4130pts). Economists at Société Générale expect the index to soar as high as 4350pts.
Holding above 4310pts is critical to see further gains
“A retest of the high formed in September near 4250pts can’t be ruled out. Next projections are located at 4350pts.”
“Consolidation above the channel band near 4130pts will be crucial for persistence in the up move.”
XAU/USD is closing in on $1800. As FXStreet’s Dhwani Mehta notes, gold eyes symmetrical triangle breakout on the daily chart. Focus is on Monday’s close, as above $1793 the yellow metal would target the $1900 level.
Immediate downside appears cushioned around $1793-$1791
“Looking forward, the risk trends, the price action in the yields and the buck will continue to influence gold price amid a blackout period for the Fed and a quiet start to the week.”
“Gold is teasing a symmetrical triangle breakout, with bulls awaiting a daily closing above the falling trendline resistance at $1793. The triangle breakout will open doors for a fresh uptrend towards the $1900 barrier. Ahead of that, the previous week’s high of $1814 will offer stiff resistance. Further up, September highs at $1834 will also emerge as a tough nut to crack for gold bulls.”
“On the flip side, the immediate downside appears cushioned around $1793-$1791. The next critical support awaits at the horizontal 50-DMA at $1780. Selling resurgence could knock off gold price further towards the rising trendline support at $1775.”
EUR/CHF has extended its phase of decline after sliding below 1.07. Economists at Société Générale expect the pair to drop towards the 1.0620/1.0580 region.
Downward momentum is still prevalent
“Break below August trough (1.0700) denotes downward momentum is still prevalent.”
“The pair is likely to head lower towards the lower limit of a multi-month channel at 1.0620/1.0580. Defending this can result in a bounce, however, last week's peak of 1.0765 is likely to cap.”
“Lows of 2020 at 1.0500 could be a significant support.”
EUR/USD stays afloat around mid-1.1600s. Economists at Société Générale expect the pair to tackle the 1.1730/50 resistance zone. A break above here would open up the 1.1910 mark.
Initial support seen at 1.1570
“EUR/USD is expected to extend its bounce after a brief pause.”
“It is inching towards a multi month channel at 1.1730/1.1750. Reclaiming this will be essential for a retest of 1.1910.”
“First layer of support is at 1.1570.”
- AUD/USD regained positive traction on Monday amid a subdued USD price action.
- The dominant risk-on mood also acted as a tailwind for the perceived riskier aussie.
- Elevated US bond yields helped the USD losses and should cap gains for the major.
The AUD/USD pair maintained its bid tone through the early European session and was last seen hovering near daily tops, just below the key 0.7500 psychological mark.
Following the previous session's good two-way price swings, the AUD/USD pair attracted some dip-buying on the first day of a new week and was supported by a combination of factors. The dominant risk-on mood in the markets was seen as a key factor that undermined the safe-haven greenback and acted as a tailwind for the perceived riskier aussie.
Apart from this, the USD downtick lacked any obvious fundamental catalyst and remained cushioned amid elevated US Treasury bond yields, bolstered by the prospects for an early policy tightening by the Fed. In fact, Fed Chair Jerome Powell reiterated on Friday that the US central bank remains on track to begin tapering its bond purchases soon.
Moreover, the markets have been pricing in the prospects for an interest rate hike in 2022 amid fears about a faster than expected rise in inflation. This, in turn, warrants some caution before placing aggressive bullish bets around the AUD/USD pair and positioning for an extension of the recent bullish move witnessed over the past one month or so.
Investors might also prefer to wait on the sidelines ahead of this week's key releases of the quarterly Australian consumer inflation figures on Wednesday. This, along with the Advance US Q3 GDP report on Thursday, will play a key role in influencing the AUD/USD pair and assist investors to determine the next leg of a directional move.
In the meantime, the US bond yields will drive the USD demand. Traders might further take cues from the broader market risk sentiment to grab some short-term opportunities around the AUD/USD pair.
Technical levels to watch
USD/JPY snapped a four-week winning streak and seems to have gone into a consolidation phase around mid-113.00s on Monday. Karen Jones, Team Head FICC Technical Analysis Research at Commerzbank, expects the pair to hold above the 23.6% retracement at 113.38 to retest the 114.55 high.
USD/JPY targets 114.55, then 115.60
“USD/JPY failed to close above the 114.55 October 2018 high last week, and has now eased back to the 23.6% retracement at 113.38. Provided this holds the downside we should see recovery and a reattempt on the 114.55 high.”
“Failure at 113.38 will imply a deeper sell off to 112.56, the 38.2% retracement, and potentially the 111.66 July high.”
“Above 114.55/70, we have 115.60, the 61.8% retracement of the move down from 2015 and then the 117.06 the 1998-2021 resistance line.”
GBP/JPY continues to push higher, having printed a fresh high at 158.22 last Friday. Benjamin Wong, Strategist at DBS Bank, expects the pair to lurch even higher.
Strong momentum being augmented
“A quick look at the daily Ichimoku charts shows bullish momentum remains in a feverish pitch, and there is no affirmation that the 158.22 highs is a verified absolute top. Hence, we remain open to the possibility of the cross assailing higher levels before it ends terminally the bull run that currently came off 148.47, the July 2021 lows.”
“On the monthly charts, 162.13 is a keenly watched 200-month moving average as well.”
The USD has lost ground against all other G10 currencies with the exception of the JPY since the start of the month. Economists at Rabobank consider the move to be corrective in nature given the recent run up in long USD positions. This next round of G10 central bank policy meetings will be crucial in injecting more clarity into the outlook for G10 currencies.
Next round of central bank meetings to be crucial to inject more clarity
“We view the current softer tone of the USD as corrective. CFTC data show that speculators’ added to their long USD index positions for an eighth consecutive week last week and that these positions are holding at their highest levels since October 2019. After such a sharp change in allocation of positions, some pullback or consolidation is not exceptional and should allow market participants to catch their breath.”
“The recent ‘catch-up’ moves in the money market rates of other countries has contributed to the stronger tone of other G10 currencies vs the USD. In many cases, however, it is likely that movements in the short end of several curves are overdone.”
“A reiteration of cautious positions from central banks such as the ECB, BoJ, SNB, RBA and the Riksbank is likely to settle markets and should allow the USD to pull back some ground.”
“We retain our view that difficult conditions for emerging markets caused by concerns such as higher US rates, slowing Chinese growth and rising energy prices remains a USD positive dynamic.”
EUR/CHF is at new lows for the year. Karen Jones, Team Head FICC Technical Analysis Research at Commerzbank, expects the pair to hold above the 1.0643/1.0623 area though a break below here would expose the 1.0505 2020 low.
Near-term rallies to find initial resistance at the 1.0790 55-DMA
“EUR/CHF sold off into new lows for the year last week and we are now very close to our downside target of the 1.0623/43 November 2020 low, the 2016 low and 78.6% retracement at 1.0643. This is a major band of support and we would expect the market to at least hold the initial test.”
“Failure at 1.0623/43 would target the 1.0505 2020 low.”
“Near-term rallies will find initial resistance at the 55-day ma at 1.0790 and will stay offered while capped there. Above the 55-day ma lies the 1.0865 24th September high.”
- EUR/USD is fading the upside momentum despite weaker USD, Treasury yields.
- 200-SMA on the 4H chart at 1.1667 offers strong resistance to the EUR bulls.
- RSI ticks down but holds above 50.00, keeping downside limited.
EUR/USD has met fresh supply near the 1.1670 region, retracing towards 1.1650 ahead of the German IFO survey.
The pair ignores the broad-based US dollar weakness alongside the extended retreat in the Treasury yields, as the EUR bulls run into a key technical hurdle on the four-hour chart.
Its worth noting that the retracement could be also in the wake of the upcoming European Central Bank policy decision and US GDP report this week.
The rejection at higher levels is also backed by the latest downtick in the Relative Strength Index (RSI). However, the leading indicator still remains well above the midline, keeping the buyers hopeful.
A four-hourly candlestick closing above the 200-Simple Moving Average (SMA) at 1.1667 will revive the bullish momentum, opening doors towards the 1.1700 psychological level.
Further up, the next resistance zone is seen near the 1.1720 region.
EUR/USD: Four-hour chart
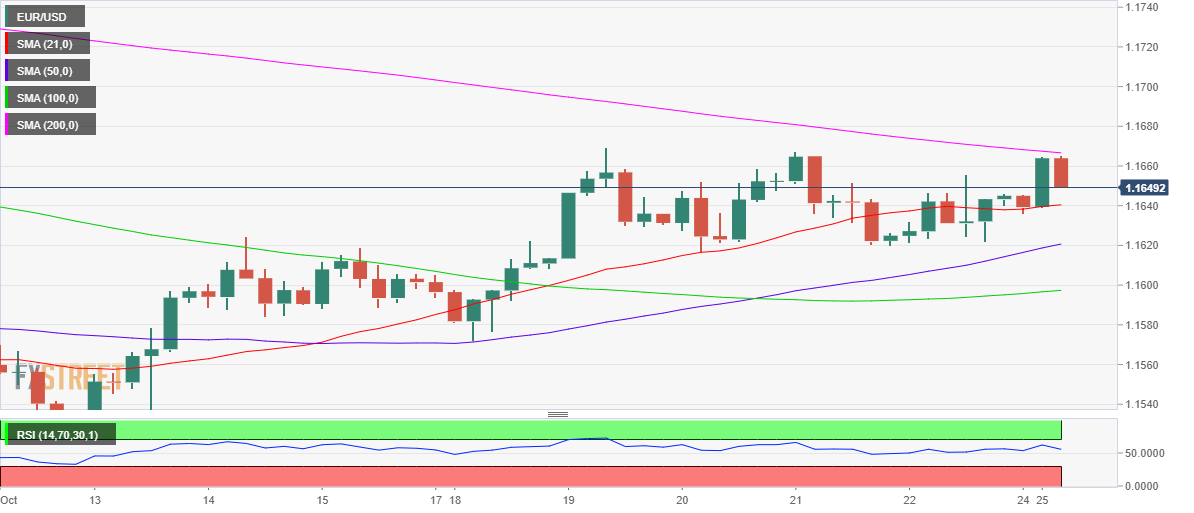
Meanwhile, if the latest pullback gathers steam, then a test of the mildly bullish 21-SMA at 1.1640 will be inevitable.
Bears will then aim for the upward-sloping 50-SMA at 1.1621.
EUR/USD: Additional levels to consider
Here is what you need to know on Monday, October 25:
The dollar struggles to find demand at the start of the week amid the mixed market mood but the overall trading action remains relatively subdued as investors await this week's high-impact macroeconomic data releases and events. IFO Business Climate Index and Expectations Index from Germany will be featured in the European economic docket on Monday ahead of the Chicago Fed's National Activity Index and the Dallas Fed's Manufacturing Survey.
Risk mood: China's SSE Composite Index is up 0.45% but the Nikkei 225 Index is losing 0.65%. US Stock index futures are trading flat and major European equity indices remain on track to open near Friday's closing levels. Meanwhile, the benchmark 10-year US Treasury bond yield, which fell 4% on Friday, is clinging to modest daily gains near 1.65%.
In an interview with CNN on Sunday, US House Speaker Nancy Pelosi said that Democrats have almost reached an agreement on a scaled-back version of US President Joe Biden's spending bill. Pelosi further added that they are looking to vote on it later in the week.
EUR/USD stays afloat in the upper half of last week's trading range around mid-1.1600s, supported by the modest USD weakness. The pair might need a fundamental catalyst to break out of this range.
Gold surged above $1,800 on Friday but erased a large portion of its gains before closing a little above $1,790. Currently, XAU/USD is closing in on $1,800 and it could gather bullish momentum in case US T-bond yields start to push lower.
The EU and the UK will continue talks on post-Brexit trade rules for Northern Ireland on Tuesday in London. The role of the European Court of Justice in upholding and implementing those rules remains the biggest sticking point. GBP/USD, which closed the last two days of the previous week modestly lower, is now edging higher toward 1.3800.
USD/JPY snapped a four-week winning streak and seems to have gone into a consolidation phase around mid-113.00s on Monday. The data from Japan showed that the Leading Economic Index declined to 101.3 in August from 104.1 in July but this reading was largely ignored by market participants.
Cryptocurrencies: Following Wednesday's record-setting rally, Bitcoin extended its correction over the weekend and briefly declined below $60,000 before regaining its traction. Currently, BTC is up nearly 2% on a daily basis at $62,000. Ethereum continues to fluctuate above $4,000.
FX option expiries for October 25 NY cut at 10:00 Eastern Time, via DTCC, can be found below.
- EUR/USD: EUR amounts
- 1.1615 372m
- 1.1660 453m
- 1.1720-25 638m
- 1.1770 534m
- GBP/USD: GBP amounts
- 1.3700 513m
- USD/JPY: USD amounts
- 112.50 780m
- 113.00 886m
- 114.00 480m
- 114.25 421m
- 114.50 450m
- USD/CAD: USD amounts
- 1.2500 620m
- 1.2600 685m
The focus shifts to US GDP while XAU/USD bears and bulls fight over $1,800. FXStreet’s Eren Sengezer expects gold to head towards $1,825 before $1,840 on a break above the aforementioned $1,800 resistance.
Neither sellers nor buyers have control of the critical $1,800 level
“On Thursday, the European Central Bank (ECB) will announce its Interest Rate Decision and release the Monetary Policy Decision Statement. In case the ECB event highlights the policy divergence with the Fed, the greenback could regather its strength and bring forth XAU/USD weakness.”
“The US Bureau of Economic Analysis will release its first estimate of third-quarter Gross Domestic Product (GDP) growth. On a yearly basis, the GDP is expected to expand by 3.2% following the 6.7%. A GDP reading near the market consensus could trigger another leg higher in US T-bond yields. On the other hand, a big miss could cause investors to price in a delay in the reduction of the Fed’s asset purchases and weigh heavily on the dollar.”
“It's difficult to say that the outlook is bullish unless gold makes a decisive move above the $1,795/$1,800 area. Above that hurdle, $1,825/30 area (Fibonacci 38.2% retracement of the April-June uptrend, static level) could be seen as the next target before $1,840 (static level).”
“On the downside, $1,780 (50-day SMA) aligns as the first support ahead of $1,770 (former resistance, Fibonacci 61.8% retracement). Sellers are likely to maintain control of the action as long as the above-mentioned resistance holds.”
- GBP/USD edges higher on Monday in the European trading hours.
- The US dollar remains subdued following lower US Treasury yields, ebbing inflation fears.
- Upbeat data, Brexit headlines, and hawkish BOE fuel gains in the sterling.
GBP/USD remains firm on the first trading day of the week in the early European session. The pair managed to gather momentum following the previous two session’s fall-off . At the time of writing, GBP/USD is trading at 1.3780, up 0.19% for the day.
The sterling keeps its foot firmly against the majors amidst the expectations that the Bank of England (BOE) will be probably the first major central bank to raise interest rates in the post-pandemic cycle but economists warned that markets are already pricing the early rate hikes.
The Brexit-led optimism uplifts the sentiment surrounding the sterling, in light of the positive comments from the UK government on the Northern Ireland (NI) protocol. Meanwhile, the IHS Markit/CIPS UK Composite PMI jumped to 56.8 in October, beating the market expectations of 54.0.
The greenback edges lower on Monday, following the Fed Chair Jerome Powell’s comment that the US central bank is ready to start tapering but remained tight-lipped on the timeline to raise interest rate hikes. Investors took remarks as a signal that the other major central banks may hike rates sooner than the Fed.
As for now, traders keep their focus on the Bank of England’s(BoE) Tenreyro's speech to gauge market sentiment.
GBP/USD technical levels
- WTI rises to the fresh high since October 2014, sidelined of late.
- Ascending trend line from March, overbought RSI challenge the bulls.
- Convergence of monthly support line, 10-DMA restricts immediate downside.
WTI bulls remain dominant, refreshing the seven-year peak during early Monday. That said, the black gold seesaws around $84.15, up 0.53% intraday, after renewing the multi-year peak to $84.38 before a few minutes to the European session’s start.
It should be noted, however, that the further upside remains doubtful as the RSI line pokes overbought region as the oil prices flirt with an ascending resistance line from March, near $84.45-50 at the press time.
In a case where WTI buyers manage to flash a daily closing past $84.50, the early 2010 levels near $87.50 may probe the run-up targeting the $90.00 psychological magnet.
During the quote’s pullback moves, a confluence of 10-DMA and an ascending trend line from late September, near $82.10, will be the key to watch.
Should oil’s profit-booking extends below $82.10, also conquer the $82.00 threshold, the $80.00 round figure and July’s high near $76.40 will be in focus.
WTI: Daily chart
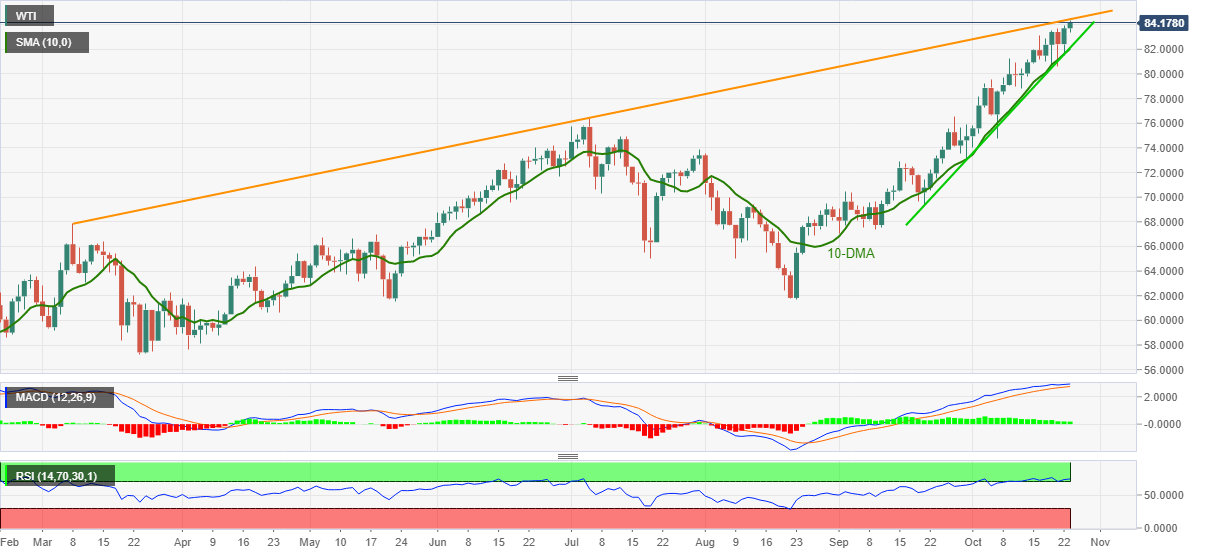
Trend: Pullback expected
- US Dollar Index extends Friday’s losses to refresh multi-day bottom.
- US stimulus hopes, China headlines weigh on US dollar’s safe-haven demand.
- Fed’s Powell favored tapering but not the rate hikes.
- Second-tier data eyed ahead of Thursday’s advance reading of Q3 GDP.
US Dollar Index (DXY) refreshes monthly low around 93.50, extending Friday’s losses as European traders brush their screens for Monday’s tasks.
The greenback gauge tracks downbeat US Treasury yields amid a quiet start to the key week including the first estimation of the US Q3 GDP.
The reason could be linked to the risk-on mood, mainly taking clues from US stimulus hopes and Evergrande-led relief in China. It should be noted, however, the last lot of the Federal Reserve (Fed) officials, including Chairman Jerome Powell, kept flashing the need for tapering despite staying away from the rate hike signals. Even so, markets seem to have digested the news long back and hence the latest reaction to the hawkish Fedspeak has been minimal.
Amid these plays, US 10-year Treasury yields drop one basis point (bp) to 1.642% while the S&P 500 Futures turn positive, poking record top marked on Friday.
Given the greenback sellers’ rejection of the Fed tapering concerns, firmer US GDP will extra support to the DXY should the growth numbers arrive firmer. However, soft numbers may well extend the latest bearish consolidation of the US Dollar Index.
Ahead of Thursday’s US GDP, today’s second-tier activity numbers and Wednesday’s Durable Goods Orders for September will join the aforementioned risk catalysts to entertain the DXY traders.
Technical analysis
US Dollar Index drops to the three-week low, battling one-month-old horizontal support and the 200-SMA. It’s worth observing that the US Dollar Index portrays a short-term falling wedge bullish chart pattern, on the four-hour play and hence confirmation of the same, with an upside break of 93.70 will theoretically hint at a fresh north-run towards the monthly high, also the yearly peak surrounding 94.55. Alternatively, 200-SMA and the stated monthly support restrict short-term DXY declines around 93.55-50 before the wedge’s support line, close to 93.40.
- USD/CNH prints three-day south-run, stays pressured around intraday low.
- Oversold RSI probes bears, 5-DMA guards immediate upside.
USD/CNH takes offers around $6.3775, down 0.10% intraday as European traders brace for Monday’s bell.
In doing so, the offshore Chinese currency (CNH) pair extends the previous week’s U-turn from a support-turned-resistance line from July towards the monthly low, also the lowest level since May.
It should be noted, however, that the oversold RSI conditions may challenge the USD/CNH bears around the five-month low of $6.3524, also the yearly bottom.
In a case where the pair sellers ignore RSI conditions and refresh the yearly low, bottom marked during the mid-May 2018 near $6.3195 may challenge the quote ahead of directing them to the $6.3000 threshold.
On the contrary, the 5-DMA level of $6.3855 challenges the quote’s immediate upside ahead of the stated resistance line, previous support, near $6.3990.
During the USD/CNH upside past $6.3990, September’s low around $6.4250-45 will gain the buyer’s attention.
USD/CNH: Daily chart
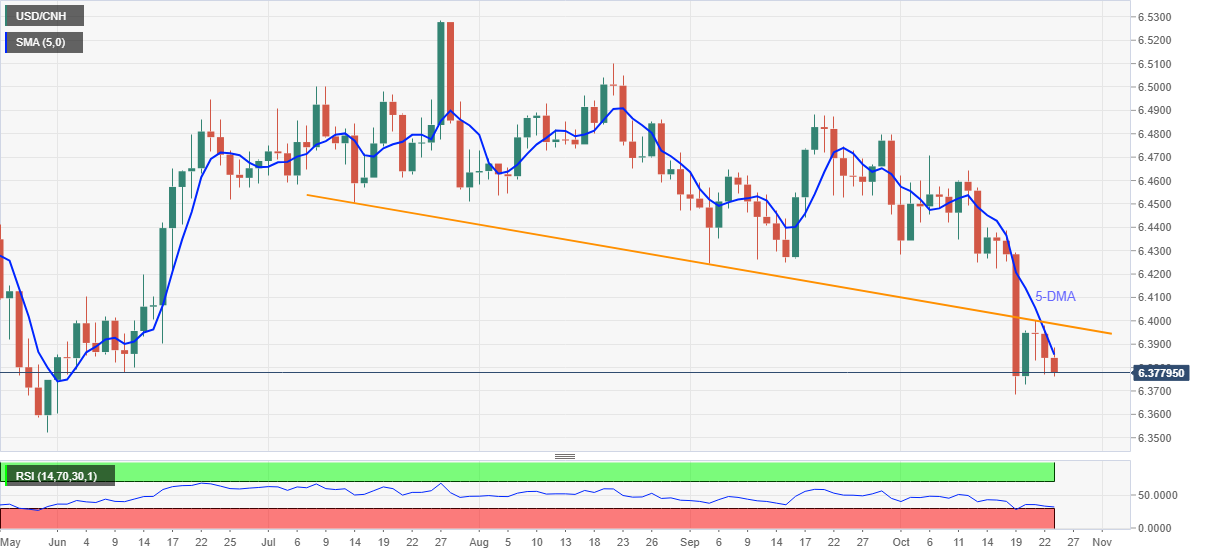
Trend: Further weakness expected
- USD/INR print three-day uptrend, picks up bids of late.
- Markets doubt RBI Minutes terming rise in inflation as softer than expected amid firmer oil prices.
- DXY refreshes three-week low amid risk-on mood, helped by China.
USD/INR struggles to cheer the broad US dollar weakness, down 0.08% intraday around 75.00 heading into Monday’s European session. The reason could be linked to the concerns over the Reserve Bank of India’s (RBI) inaction, as well as inflation view, amid surging oil prices.
On Friday, minutes of the latest RBI meeting conveyed that India's monetary policy committee sees the need for continued policy accommodation as the economic recovery remains fragile, with the rise of inflation less steep than expected. However, Goldman Sachs (GS) recently rang the inflation alarm and the need for monetary policy change. “India Monetary Policy Committee’s (MPC’s) concerns on persistent core inflation amid high commodity prices coming to fore,” said GS per Reuters.
Improvement in India’s covid conditions and strong vaccinations should have also helped the Indian rupee (INR) but does not as market players seem to prepare for future tightening of the RBI. As per the latest government figures, there are 14,306 new cases versus 15,906 reported yesterday. Further, the government claims to have jabbed over 1.02 billion population, running the world’s biggest vaccination drive.
On a different page, China’s ability to regain the formal seat at the United Nations (UN) and the People’s Bank of China’s (PBOC) efforts to safeguard the financial system, recently by a net 190 billion yuan injection, underpin the positive sentiment, weighing on the US dollar. Further, the latest comments from the US policymakers, including President Joe Biden and House Speaker Nancy Pelosi, also signaled nearness to the much-awaited infrastructure spending deal of late and dragged down the US Dollar Index (DXY). Above all, the Fed tapering chatters seemed to have failed to underpin the US Treasury yields.
Against this backdrop, MSCI’s index of Asia-Pacific shares outside Japan gains 0.20% intraday whereas S&P 500 Futures reverse the early Asian losses to poke the record high flashed on Friday.
Looking forward, USD/INR traders remain at the mercy of the US dollar moves and the market’s preparation for the RBI’s action. However, the US Chicago Fed National Activity Index for September and Dallas Fed Manufacturing Business Index for October can offer intermediate clues.
Technical analysis
USD/INR recovery needs to conquer the 75.10 hurdle, comprising 10-DMA and a two-week-old resistance line, to aim for the monthly high near 75.65, failures to do so can recall the bears.
- AUD/JPY edges higher on Monday following the previous session’s downside momentum.
- The cross-currency pair posts gains after two days of sell-off.
- The momentum oscillator holds onto the overbought zone with receding upside momentum.
AUD/JPY trades higher in the Asian trading hours on Monday morning. The pair retreated after testing the fresh yearly highs on Thursday at 86.25. As of writing, AUD/JPY is trading at 85.03, up 0.35% for the day.
AUD/JPY daily chart
-637707341492743132.png)
After rising from the lows of 78.85 made one month ago, the pair put its paddle on the accelerator and tested the fresh yearly highs above 86.20 on Thursday. The AUD/JPY bulls look exhausted near the higher levels and pushed lower amid a corrective pullback.
If the renewed upside in the pair gains momentum, it could touch the 85.50 horizontal resistance level again, followed by the yearly highs of 86.25. Further, a close above the mentioned level would open the gates for the February 2018 highs at 88.12.
Alternatively, if the price reverses direction on further profit booking, it could retrace to the 84.50 horizontal support level.
A decisive break of the ascending trendline at 84.00, which extends from the low of 78.85, would mean more pain for the pair. The AUD/JPY bears would recapture the 83.50 horizontal support zone. The overbought Moving Average Convergence Divergence (MACD) teases bears to test the low of October,12 at 83.01.
AUD/JPY additional levels
In the view of the analysts at JP Morgan, EUR/USD is foreseen at 1.1400 by December and 1.1200 next year.
Key quotes
“We are bringing forward and extending the projected slippage in EUR to reflect these developments, but principally the increased uncertainty about the duration of a soft-patch in global growth that is now impacting the Euro area as well.”
“European industry has been wrestling with supply disruptions for some time - German car output is 50% below pre-pandemic levels - and to compound matters there is now a potentially major drag from the surge in natural gas prices, to which Europe is particularly exposed.”
- XAU/USD extends the previous session’s gains on Monday near $1,780.
- Gold posts the gains for the fifth straight session.
- Lower US Treasury yields undermine the demand for the US dollar.
Gold trades with gains on Monday extending the previous week’s upside momentum. The US benchmark 10-year Treasury yields tardes below 1.65% with 0.78% losses enhancing non-yielding bullion’s appeal.
The US Dollar Index, which tracks the performance of the greenback against the basket of six major currencies, book fresh losses below 93.50 with 0.15% losses, making gold attractive for the other currencies holders. The greenback weighed down as investors digested the relative pace of interest rate hikes expectations from the major central banks.
Global stock market remained edgy amidst a deterioration in investor risk sentiment linked to comments made by the Chairman of the Fed’s Chairman Jerome Powell. He reiterated his outlook that the US central bank is on confirmed track to reduce its monthly asset purchase before the end of the year. Further, he added that the monthly purchases are expected to end by mid-2022.
The precious metal rallied to its highest level since early September above $1,800 on Friday before trimming gains, following Fed’s chairman Powell’s statement on the timing of interest rates hike, especially the given current labor market conditions. US Treasury Secretary Janet Yellen remained on the same line on inflation as she said the US is in control of inflation, and it could return to normal by the second half of next year.
As per the US Commodity Futures Trading Commission's data released on Friday, traders cut their net long positions in gold in the week to October,19.
Technical levels
XAU/USD daily chart
-637707321824287502.png)
On the daily chart, XAU/USD rose for fifth consecutive sessions after forming a Doji candlestick on October,18. The prices crossed above the 200-day Simple Moving Average (SMA) at $1,793.43 for the first time since early September. The prices moved in the upward channel from the lows of $1,722.31 made on September 30, indicating the current underlying bullish current.
The Moving Average Convergence Divergence (MACD) holds above the midline with a bullish crossover. Any uptick in the MACD indicator would amplify the buying pressure and the prices would approach the $1,810 horizontal resistance level . A daily close above the mentioned level would encourage bulls to retest the high made on September, 7 at $1,827.32. XAU/USD bulls could meet the upper trendline of the upward channel at $1,840 as the next upside target.
Alternatively, if the prices break below the 200-day SMA, it could retrace back to the $1,780 horizontal support level. Furthermore a successful break of the bullish sloping line could mean more downside for gold toward the $1,765 horizontal support level, followed by the October, 12 low at $1,750.81.
XAU/USD additional levels
- Asian shares track Wall Street gains amid softer US Treasury yields.
- Evenrgrande restarts 16 cites after paying US bond coupons, PBOC stays defensive.
- Australia eyes booster shots, NZ markets are off.
- Firmer oil probes equity bulls amid a quiet start to the key week.
Asian equities portray a positive week-start heading into Monday’s European session, thanks to headlines from China. Also contributing to the risk-on mood are the US stimulus hopes and downbeat US Treasury yields.
US policymakers, including President Joe Biden and House Speaker Nancy Pelosi, signaled nearness to the much-awaited infrastructure spending deal of late. The same joins China’s Evergrande’s comments suggesting it has resumed construction work on 16 cites, including the latest six, to brighten the mood. Further, China’s ability to regain the formal seat at the United Nations (UN) and the People’s Bank of China’s (PBOC) efforts to safeguard the financial system, recently by a net 190 billion yuan injection, also underpin the positive sentiment.
On the contrary, fresh covid fears from China, as conveyed by Mi Feng, a spokesman at the National Health Commission, joins the Fed tapering chatters, underpinned by Fed Chairman Jerome Powell on Friday, challenge the mood.
Amid these plays, MSCI’s index of Asia-Pacific shares outside Japan gains 0.20% intraday. However, Japan’s Nikkei drops 0.85% at the latest after an insurance company Meiji Yasuda Life hints at further yen strength.
Elsewhere, Australia eyes COVID-19 booster shots soon after the virus-led activity restrictions ease, per Reuters, which in turn joins recently softer Aussie virus numbers to help ASX gain 0.35% by the press time. That being said, Chinese stocks are mildly bid whereas those from Indonesia India, and South Korea follows the suit. It's worth noting that Turkish Lira refreshed record top at the week's start, following the weekend headlines, before trimming the gains to 1.35% on a day at the latest.
On a broader front, S&P 500 Futures reverse the early Asian losses to poke the record high flashed on Friday whereas the US 10-year Treasury yields drop 1.3 basis points (bps) to 1.642% at the latest. It’s worth noting that Wall Street closed firmer the previous day even as Fed Chair Jerome Powell backed tapering and refrained from terming inflation as ‘transitory’.
Read: S&P 500 Futures, US Treasury yields wobble amid quiet markets
- AUD/USD snaps two-day losses, refreshes intraday top of late.
- Firmer MACD, strong RSI add to the bullish bias.
- Convergence of 200-DMA, three-month-old resistance line becomes a tough nut to crack for the bulls.
AUD/USD again rebounds from a monthly support line, snapping a two-day downtrend while refreshing the daily high around 0.7485 ahead of Monday’s European session.
Given the firmer RSI line, not overbought, coupled with the bullish MACD signals, AUD/USD prices are likely to remain firm, suggesting the 0.7500 threshold break on hand.
However, the latest swing high near 0.7550, also the highest since early July, will precede the convergence of the 200-DMA and an upward sloping trend line from July 29 to challenge the AUD/USD upside close to 0.7565.
Should the pair buyers ignore RSI conditions and overcome the 0.7565 hurdle, the late June’s peak of 0.7617 will be in focus.
Meanwhile, a daily closing below the stated support line, near 0.7455 by the press time, will aim for the 100-DMA level of 0.7397 to probe the AUD/USD bears.
In a case where the quote remains weak past 100-DMA, July’s low near 0.7290-85 should return to the chart.
AUD/USD: Daily chart
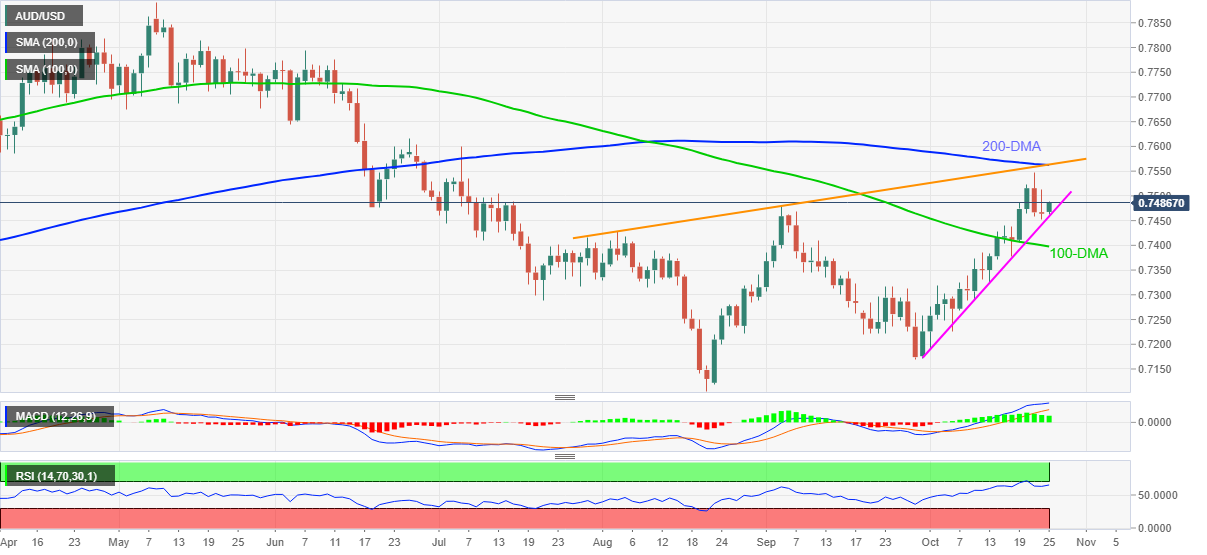
Trend: Further upside expected
The Chinese property firms, including many with dollar debts, to gather in Beijing on Tuesday to meet with the National Development and Reform Commission (NDRC), the country’s state planner, the local media outlet Cailianshe reported, citing sources familiar with the matter.
Cailianshe added, “representatives of many of the property firms are on their way to Beijing after being notified by the National Development and Reform Commission.”
This comes after China Evergrande Group announced Sunday that it had resumed work on more than ten projects in six cities including Shenzhen.
Market implications
The renewed optimism around the Chinese troubled property sector is outweighing concerns over the fresh Delta covid variant outbreak in the country, lifting the sentiment towards the riskier assets.
The S&P 500 futures flip to gains while AUD/USD rebounds towards 0.7500. As of writing, AUD/USD is trading at 0.7485, having found support at 0.7464, adding 0.29% on the day.
- EUR/USD refreshes intraday high, extends Friday’s recovery moves.
- Downbeat US Treasury yields, mixed sentiment weigh on US dollar.
- ECB, US GDP in focus but China headlines, Fed tapering concerns add to the watcher’s list.
- Second-tier German, US data eyed for fresh impulse.
EUR/USD takes the bids to cross a key short-term resistance line around 1.1655 heading into Monday’s European session.
The currency major pair cheered US dollar weakness, amid broad risk-on mood, the previous day but the stated resistance line probed the quote’s following advances. Though, the latest drop in the greenback enables the EUR/USD bulls to cross the immediate hurdle ahead of an important week comprising the European Central Bank (ECB) monetary policy meeting and the preliminary readings of the US Q3 GDP.
US Dollar Index (DXY) pressures a three-week low, extending Friday’s losses around 93.50, as the recent softening of the US 10-year Treasury yields join sentiment-positive catalysts from China. Also, hopes that the ECB policymakers will keep their hawkish rhetoric during this week’s monetary policy meeting add to the EUR/USD strength.
That said, the US 10-year Treasury yields drop 1.3 basis points (bps) to 1.642% while the S&P 500 Futures turn positive, poking record top marked on Friday.
Behind the moves could be the headlines suggesting US policymakers’ optimism towards reaching the agreement on the much-awaited infrastructure spending deal. On the same line was news from China’s Evergrande which said it has resumed construction work on 16 cites, including the latest six. The troubled real-estate player paid $83.5 million in interest on a U.S. dollar bond and relieved the market’s stress the last week. Further, the People’s Bank of China’s (PBOC) efforts to safeguard the financial system, recently by a net 190 billion yuan injection, also brighten the market’s mood.
It should be noted, however, that Friday’s comments from Fed Chair Jerome Powell turned out in sync with the rest of the Fed policymakers who favor tapering and challenge the EUR/USD bulls. Also, covid fears in China add to the catalysts underpinning the US Treasury yields. Mi Feng, a spokesman at the National Health Commission said during the weekend, per Reuters, ''There is increasing risk that the outbreak might spread further, helped by ‘seasonal factors’”.
Moving on, German IFO numbers October will precede the US Chicago Fed National Activity Index for September and Dallas Fed Manufacturing Business Index for October to entertain the intraday bulls. Though, major attention will be given to the US Treasury yields ahead of crucial events on Thursday.
Technical analysis
EUR/USD stays firmer above 10-day and 21-day EMAs amid bullish MACD signals, suggesting further advances towards the downward sloping resistance line from September 22, near 1.1655. However, August month’s low around 1.1665 will validate the quote’s additional upside towards the late September’s peak near 1.1755. Meanwhile, the stated EMAs, close to 1.1630-25, challenge the short-term EUR/USD declines ahead of the 1.1600 threshold and the 1.1570 support levels.
- EUR/GBP trades marginally lower on Monday in the Asian trading hours.
- Minimum wage rise, positive Brexit headlines, upbeat data support the gains for the sterlings.
- Dovish ECB's stance weighs on the euro.
EUR/GBP remains muted on Monday in the Asian session . The cross-currency stayed in a relatively narrow trade band with no meaningful traction. At the time of writing, EUR/GBP is trading at 0.8457, down 0.08% for the day.
The downbeat economic data and dovish ECB makes the euro weaker against the sterling. The IHS Markit Eurozone Services Purchase Managers Index (PMI) dropped 54.7 in October below the market projections of 55.5. The Eurozone business activity stutters as supply chain woes intensify. In addition to that, a Reuters poll reported that the European Central Bank (ECB) will be the last major central bank to raise interest rates after the COVID-19 pandemic.
It is worth mentioning that, S&P 500 Futures is trading at 4,525, down 0.24% for the day.
On the other hand, the sterling enjoyed the gains on combination of factors. UK’s Finance Minister Rishi Sunak prepares to push the minimum wage to £10 an hour by the next General Election along with an additional £ 6 billion budget to its National Health Service.
The IHS Markit/ CIPS UK Manufacturing PMI jumped 57.7 in October beating the market forecast of 55.8. Furthermore, the UK government said that the talks between London and Brussels remained constructive so far over the troubled Northern Ireland Protocol.
As for now, traders are waiting for the German Business Climate data, and UK BoE’s Tenreyro speech to gauge market sentiment data.
EUR/GBP additional levels
China’s President Xi Jinping said on Monday, he opposes unilateralism, protectionism and zero-sum games.
Additional comments
“China has always worked together with people across the world in defending international fairness and justice.”
“China firmly opposes hegemony and power politics.”
“Chinese people firmly support developing countries' just fight for sovereignty, security and development interests.”
Market reaction
The above comments have little to no impact on the market sentiment, as the S&P 500 futures continue to remain marginally under pressure while the aussie pares early gains.
At the time of writing, AUD/USD adds 0.09% on the day to trade at 0.7470 while the S&P 500 futures drop 0.12% to 4,540.
In its latest Commodity Markets Outlook report released over the weekend, the World Bank warned that the recent surge in oil price is unlikely to reverse until 2023.
Key takeaways
“Average crude prices are expected to end the year at US$70 a barrel, 70 percent higher than in 2020.”
“The surge in energy prices poses significant near-term risks to global inflation and, if sustained, could also weigh on growth in energy-importing countries.”
“The World Bank uses an average of Brent, WTI and Dubai crude which it said will ‘remain at high levels in 2022 but will start to decline in the second half of the year as supply constraints ease’.”
“Additional price spikes may occur in the near-term amid very low inventories and persistent supply bottlenecks.”
Related reads
- Saudi Energy Minister: OPEC+ should remain cautious over output
- WTI pokes multi-month top near $84.00 despite sluggish sentiment
| Raw materials | Closed | Change, % |
|---|---|---|
| Brent | 85.68 | 1.32 |
| Silver | 24.302 | 0.7 |
| Gold | 1792.488 | 0.53 |
| Palladium | 2004.57 | -0.24 |
Analysts at Goldman Sachs slash China’s 2022 GDP growth forecasts to 5.2% vs. 5.6% projected earlier amid the government’s efforts to reduce property debts.
Key quotes
“China’s economy will probably expand 5.2% next year, down from a previous projection of 5.6%.”
“On a year-on-year basis, growth is set to slow to 3.1% this quarter.”
“The long-term policy direction such as property deleveraging remains unchanged as evidenced by the latest news on starting property tax trials in select cities.”
Read: China warns of further spread in latest COVID-19 flare-up
- USD/INR bulls meeting support on daily basis.
- Above 0.7440, the bias is bullish. All eyes on the US dollar for the week ahead.
As illustrated below, USD/INR is contained in a flag pattern as it moves towards the support area as marked an eclipse. On the other hand, should US yields and the greenback pick up steam, then the correction will likely be over and there will be probabilities of an upside extension.
USD/INR daily chart
-637707234615053772.png)
On the downside, however, the price would need to break below 0.7440.
DXY daily chart
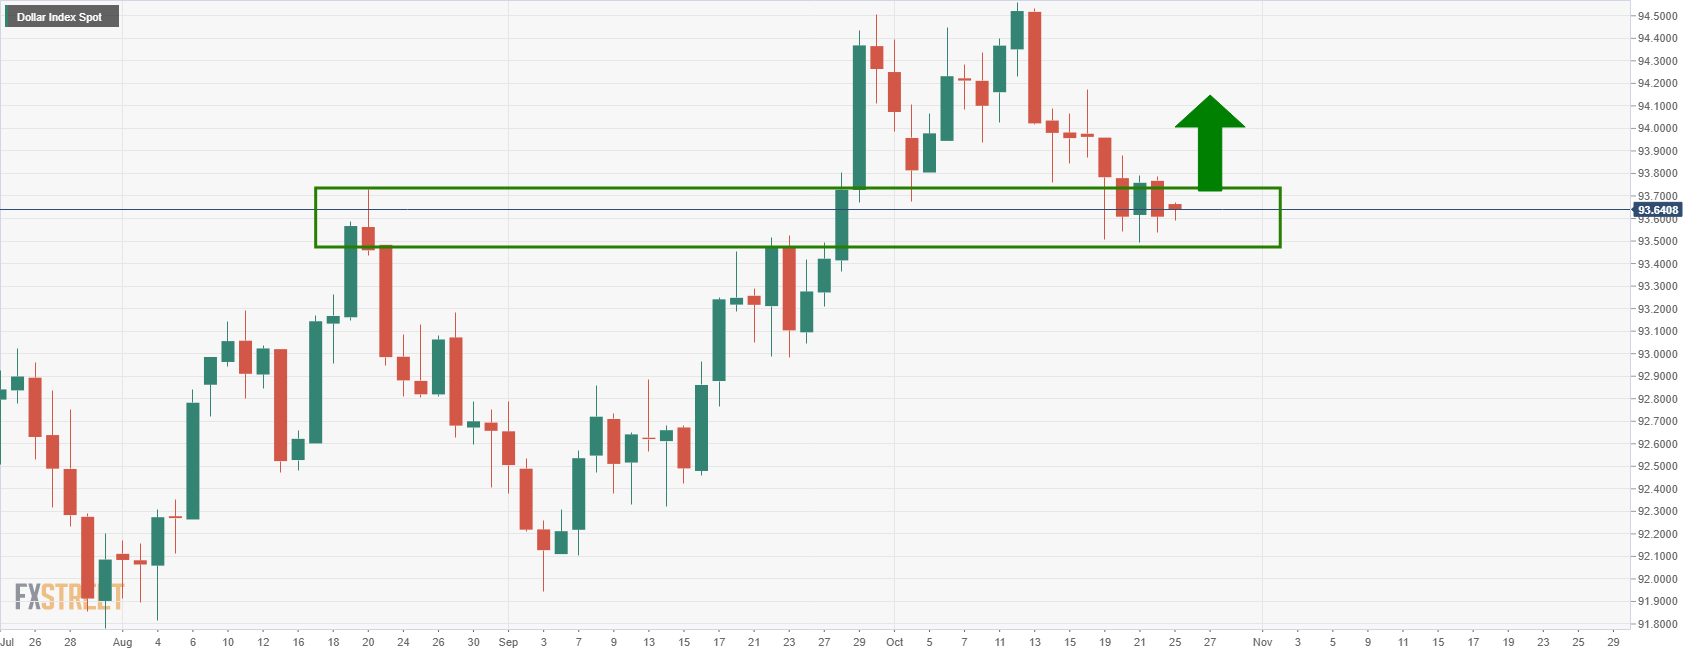
The US dollar is meeting a critical support structure which would be expected to hold and potentially lead to a break back towards 94.50. This would be more probable should the US yields continue to climb in the current bullish form of late as follows:
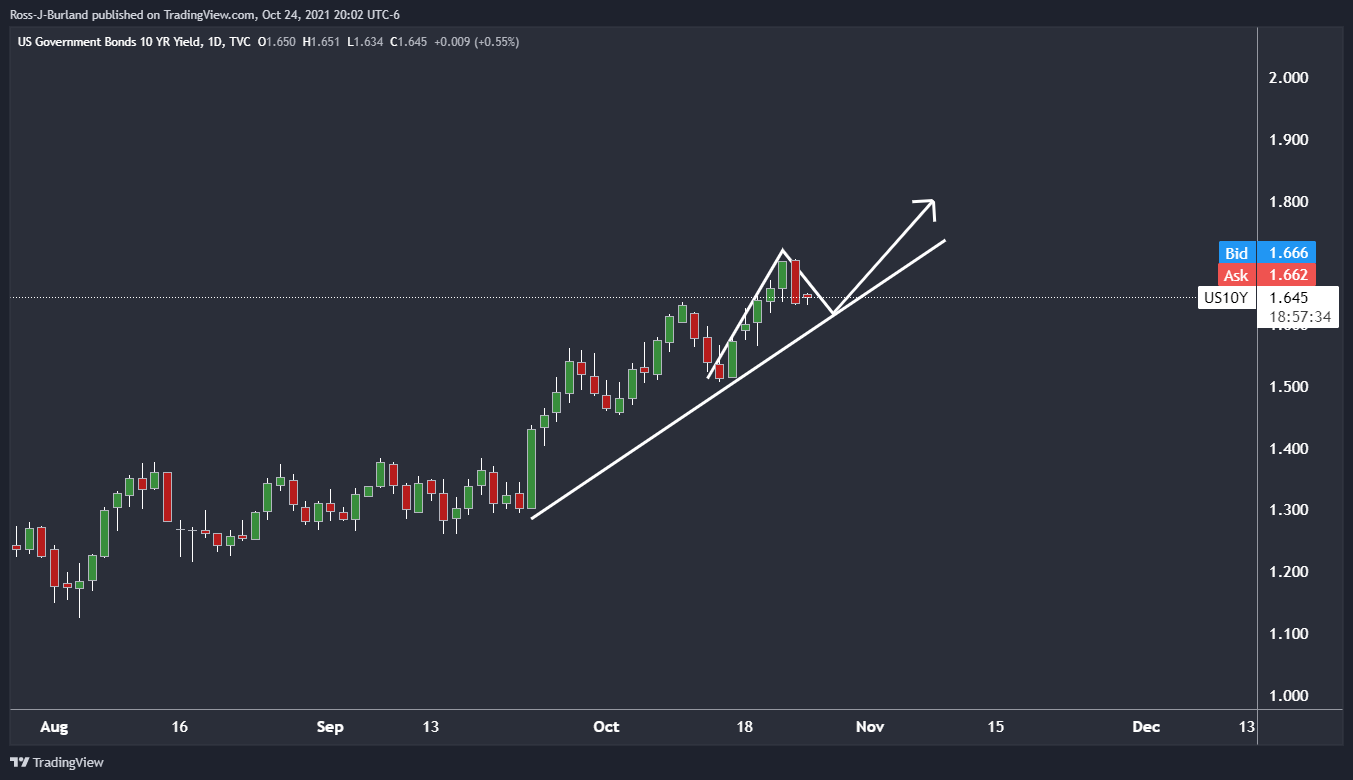
The US 10-year yield has been climbing in a classic impulse, correction, impulse shape and the current dynamic trendline support are about to come under pressure, which could lead to the next bullish impulse.
“Oil producers shouldn't take the rise in prices for granted because the coronavirus pandemic could still hit demand,” Saudi Arabia Energy Minister Prince Abdulaziz bin Salman said in a Bloomberg TV interview over the weekend.
Additional quotes
“OPEC+ should remain cautious over output.”
“Saudi Arabia wants to be a top supplier of hydrogen.”
Market reaction
WTI was last seen changing hands at $84, up 0.37% on the day.
- WTI pokes multi-month top near $84.00 despite sluggish sentiment
- S&P 500 Futures consolidate recent gains, mildly offered around record top.
- US 10-year Treasury yields remain pressured, extends Friday’s pullback from five-month high.
- Fed tapering concerns remain elevated, China flags covid risk but Evergrande tries to placate bears amid a light calendar.
- US stimulus headlines, second-tier data may entertain traders.
Market players remain divided on mixed signals during early Monday. While portraying the mood, the S&P 500 Futures ease from Friday’s record top of 4,551 whereas the US 10-year Treasury yields drop one basis points (bps) to 1.645%, keeping the previous day’s pullback from May 2021 levels.
China’s fresh covid fears join Fed tapering concerns to weigh on the stock futures. Friday’s comments from Fed Chair Jerome Powell turned out in sync with the rest of the Fed policymakers who have been favoring asset purchase adjustments, but stay away from a rate hike. Elsewhere, as per the latest comments from Mi Feng, a spokesman at the National Health Commission, shared by Reuters, ''There is increasing risk that the outbreak might spread further, helped by ‘seasonal factors’”.
On the same line were fears that another real estate firm from China, namely Modern Land, is said to struggle to pay $250 million 12.85% senior notes due October 25.
Alternatively, the US policymakers, including President Joe Biden and House Speaker Nancy Pelosi, signaled nearness to the much-awaited infrastructure spending deal. Further, China’s Evergrande said it has resumed construction work on 16 cites, including the latest six. The troubled real-estate player paid $83.5 million in interest on a U.S. dollar bond and relieved the market’s stress the last week.
It should be noted that the People’s Bank of China’s (PBOC) efforts to safeguard the financial system, recently by a net 190 billion yuan injection, adds to the sentiment-positive catalysts.
Amid these plays, the US Dollar Index (DXY) picks up bids to 93.66, up 0.07% intraday, whereas prices of crude oil and gold remain lackluster, recently easing, around the latest peaks.
Moving on, market players seek clarity over US stimulus and hence updates from the House may entertain the bulls. On the economic calendar, the preliminary readings of Q3 2021 GDP will be the key, but today’s US Chicago Fed National Activity Index for September and Dallas Fed Manufacturing Business Index for October may offer intermediate direction.
- Silver eases from key SMA, keeps late Friday’s pullback from seven-week top.
- Bullish candlestick formation, MACD conditions keep buyers hopeful.
- September’s high add to the upside filters, fortnight-old support line probe sellers.
Silver (XAG/USD) stays mildly bid around $24.35 during early Monday.
The bright metal refreshed multi-day high the previous day before reversing from $24.82. In doing so, the quote potrayed a bullish candlestick, namely inverted hammer on the daily chart.
The bullish MACD signals and a fortnight-long support line also favor the XAG/USD bulls. However, 100-DMA near $24.55 guards the quote’s immediate upside.
Additionally challenging the silver buyers is a horizontal area comprising highs marked since early September, near $24.85.
In a case where the metal prices rally beyond $24.85, the $25.00 threshold may challenge the bulls ahead of directing them to the August month’s high of $26.00
On the flip side, a daily closing below an ascending support lien from October 12, around $23.85, becomes necessary for silver sellers to take entries.
Following that, mid-October high near $23.60 and a nine-week-old horizontal support, close to $22.90, will be in focus.
Silver: Daily chart
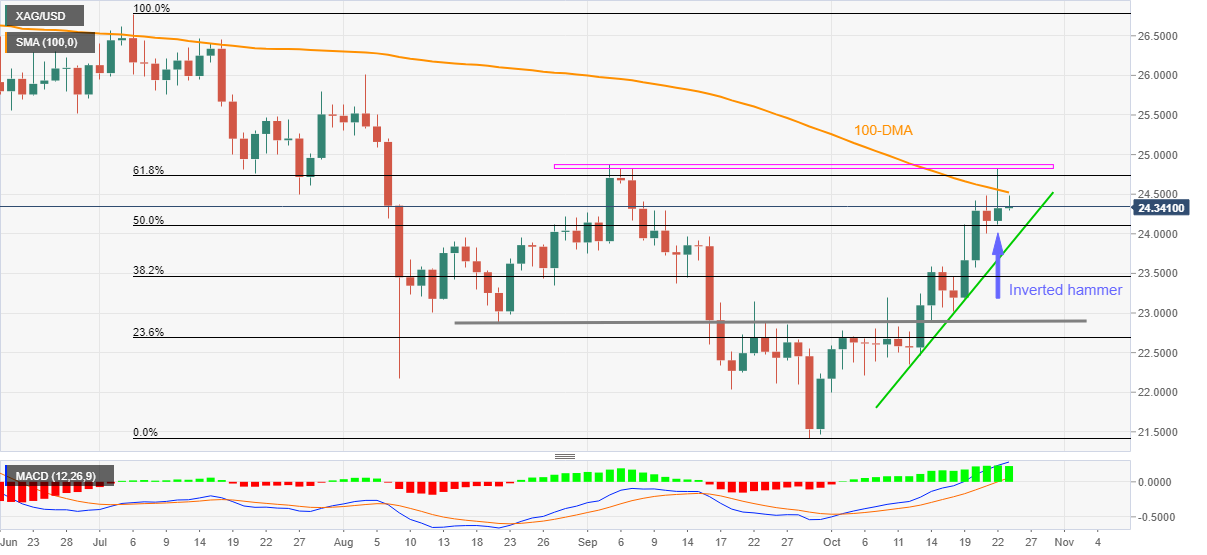
Trend: Further upside expected
Reuters came out with an analytical piece suggesting a divide between the markets pricing of the Reserve Bank of Australia’s (RBA) interest rate hike and the Aussie central bank’s efforts to tame the yields.
“On Friday, the Reserve Bank of Australia (RBA) spent A$1 billion ($750 million) buying in the bond market to try and calm investors who had been testing its resolve to anchor near-term rates at crisis levels,” said Reuters.
The analysis argues, “Yet a yawning gap remains between policymakers - who have repeatedly said they do not expect hikes before 2024 - and the market, which has priced 100 basis points of hikes before the end of 2023, beginning in the second half of 2022,”
The piece also marks the stated divergence between the RBA policymakers and the market bets as the starkest suggesting, “A bumpy resolution that could flow through to credit markets and even housing costs.”
“Government bond futures are traded more heavily than cash bonds, and Australian three-year bond futures touched a two-year low this week and 10-year futures slid to a seven-month trough,” Reuters adds.
It should be observed that RBA Governor Philip Lowe’s latest comments accepted reflationary pressures in Australia but the policymaker stepped back from suggesting tighter policy unless sustainable higher wages growth.
FX implications
As per the latest readings, Australia’s 10-year Treasury yields remain firmer around the yearly peak marked in February, close to 1.78%, whereas the 3-year coupon recovers from a one-week low to 0.75% at the latest.
Also read: AUD/USD struggles below 0.7500 on mixed concerns, sour sentiment
In recent trade today, the People’s Bank of China (PBOC) set the yuan (CNY) at 6.3924 vs the last close of 6.3850.
About the fix
China maintains strict control of the yuan’s rate on the mainland.
The onshore yuan (CNY) differs from the offshore one (CNH) in trading restrictions, this last one is not as tightly controlled.
Each morning, the People’s Bank of China (PBOC) sets a so-called daily midpoint fix, based on the yuan’s previous day closing level and quotations taken from the inter-bank dealer.
- NZD/USD is trying to break higher on the daily and weekly charts.
- NZD/USD holds in the daily support area and consolidates.
The price is meeting an area of strong support. However, the corrective candle was very strong so the momentum to the upside keeps the price offered as per the below daily chart:
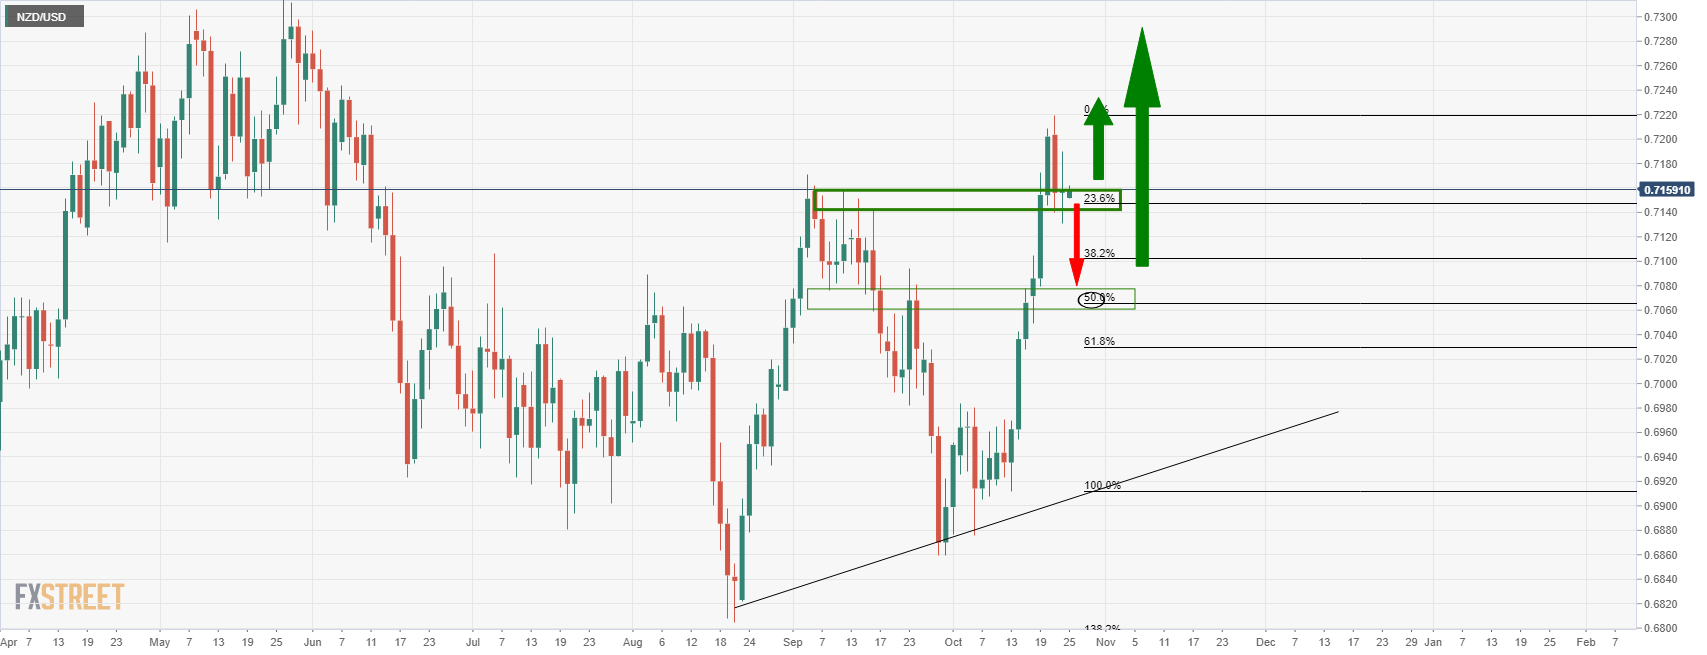
If the support breaks, the price could easily move through the volumes to reach at least 38.2% Fibonacci retracement of the bullish impulse. This will be the last defence for the 50% mean reversion target.
The weekly chart below shows that the price could move back into the triangle and head towards the dynamic trendline support:
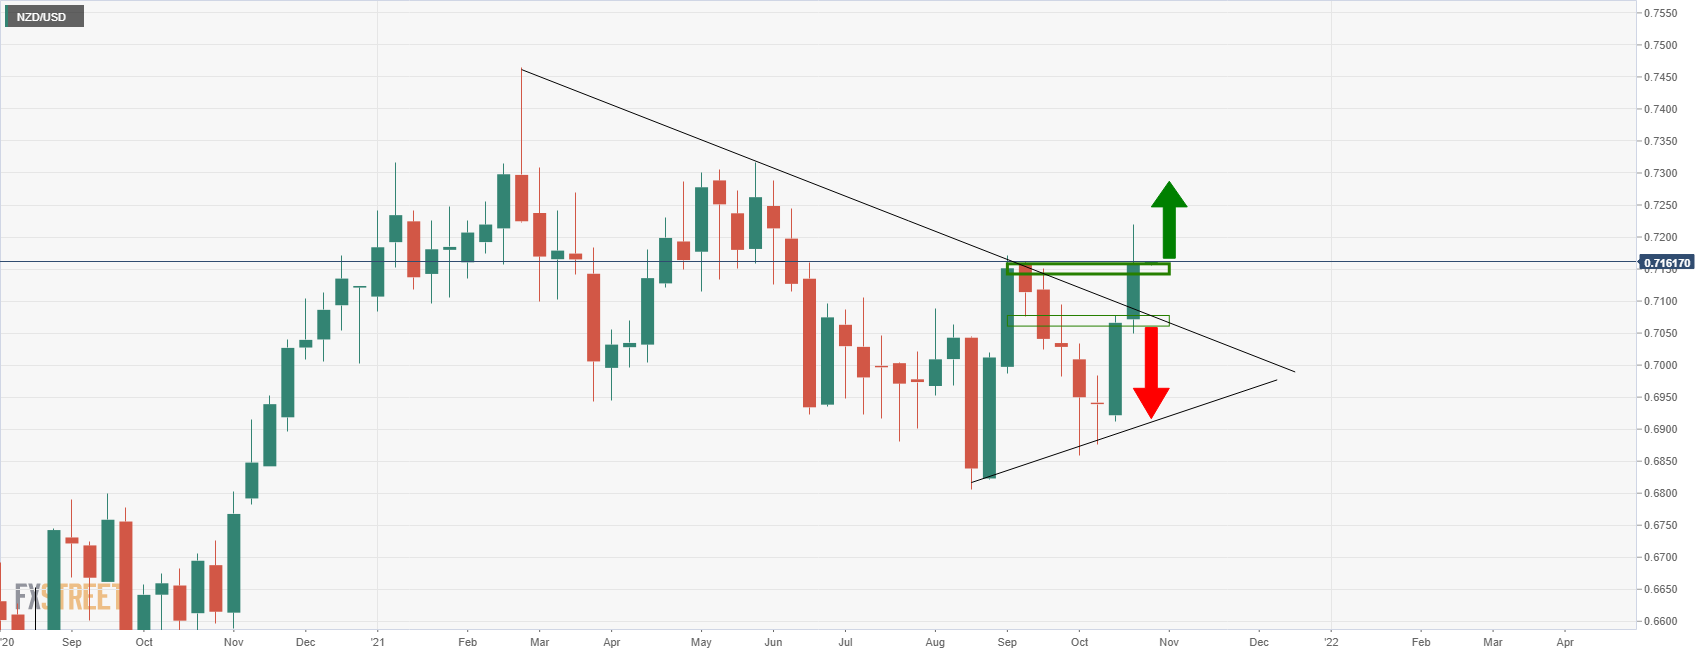
- GBP/JPY accumulates gains on Monday in the early Asian trading hours.
- The cross-currency pair took a breather near 156.00 following a two days sell-off.
- The momentum oscillator holds onto the overbought zone, throwing caution for aggressive bids.
The GBP/JPY cross-currency pair remains upbeat on the fresh trading week. The pair opened lower but managed to catch the upside momentum. At the time of writing, GBP/JPY is trading at 156.47, up 0.21% for the day.
GBP/JPY daily chart
-637707203227100756.png)
On the daily chart, the GBP/JPY cross currency pair seems exhausted near a fresh six-year high made on Wednesday. The double top near 158.22 prompts bears to take some action, which resulted in two days sell-off of more than 300-pips.
The price sustained the 156.00 psychological level and is on the way to climb back to the 157.00 horizontal resistance level. A successful daily close above 157.00 would again prompt the bulls to test the multi-year highs above 158.20.
Alternatively, the Moving Average Convergence and Divergence (MACD) trades in the overbought zone. Any downtick in the MACD along with the break of 156.00 would bring selling opportunities in the pair. In that case,the first downside target appears at the low of October, 15 at 155.42, followed by the 155.00 horizontal support level.
Next, the market participant would aim at the 154.00 horizontal support zone.
GBP/JPY additional levels
One-month risk reversal on the British pound (GBP), a gauge of calls to puts, prints a four-week uptrend, per the latest data provided by Reuters.
The options market gauge stays positive for the fourth week while recently flashing the +0.021 figure at the latest, considering the weekly data from Reuters.
The positive reading indicates call options are drawing a higher premium (option price) than puts or bears bets.
In other words, the options market favors bulls ahead of this week’s Brexit talks in the UK, as well as the US preliminary GDP for Q3 2021.
That said, GBP/USD refreshes intraday high to 1.3775, up 0.14% on a day by the press time of early Monday.
Read: UK says substantial differences remain with EU over Northern Ireland trade
- DXY remains pressured after two-week downtrend, flirts with resistance line of bullish chart pattern.
- Sluggish momentum challenges the up-moves but 200-SMA, monthly horizontal support keep buyers hopeful.
US Dollar Index (DXY) extends Friday’s weakness, also the two-week south-run, while taking the bids around 93.61 during Monday’s Asian session.
The greenback gauge dropped to the three-week low on Thursday before bouncing off one-month-old horizontal support. Also challenging the DXY weakness is the 200-SMA and sluggish Momentum line ever since the quote reversed from the yearly top during mid-October.
It’s worth observing that the US Dollar Index portrays a short-term falling wedge bullish chart pattern, on the four-hour play.
Hence, confirmation of the stated wedge, with an upside break of 93.70 will theoretically hint at a fresh north-run towards the monthly high, also the yearly peak surrounding 94.55. During the run-up, the 94.00 threshold may offer an intermediate halt.
Alternatively, 200-SMA and the stated monthly support restrict short-term DXY declines around 93.55-50.
Following that, the wedge’s support line, close to 93.40, acts as an extra filter to the south before dragging the quote towards 61.8% Fibonacci retracement of September-October upside, at 92.94 by the press time.
DXY: Four-hour chart

Trend: Recovery expected
| Time | Country | Event | Period | Previous value | Forecast |
|---|---|---|---|---|---|
| 05:00 (GMT) | Japan | Coincident Index | August | 94.4 | |
| 05:00 (GMT) | Japan | Leading Economic Index | August | 104.1 | |
| 08:00 (GMT) | Germany | IFO - Expectations | October | 97.3 | 96.4 |
| 08:00 (GMT) | Germany | IFO - Current Assessment | October | 100.4 | 99.4 |
| 08:00 (GMT) | Germany | IFO - Business Climate | October | 98.8 | 97.9 |
| 12:30 (GMT) | U.S. | Chicago Federal National Activity Index | September | 0.29 | |
| 13:00 (GMT) | Belgium | Business Climate | October | 4 | 2.2 |
| 13:00 (GMT) | United Kingdom | MPC Member Tenreyro Speaks |
- AUD/NZD edges higher on Monday in the Asian trading hours.
- The cross-currency pair finds support near the 21-day SMA.
- The momentum oscillator holds onto the overbought zone with receding momentum.
AUD/NZD prints fresh gains on Monday in the initial Asian trading hours. The cross-currency pair opened lower but quickly traveled higher. At the time of writing, AUD/NZD is trading at 1.0449, up 0.16% for the day.
AUD/NZD daily chart
-637707182649967749.png)
On the daily chart, the AUD/NZD cross-currency pair has been under selling pressure after testing high above 1.0610 on October, 12. The downside took a breather near the 50-day Simple Moving Average (SMA) at 1.0431.
A daily close above the 50.0% Fibonacci retracement level, which extends from the low of 1.0278 at 1.0443 would result in the meeting the previous session’s high at 1.0497. The Moving Average Convergence (MACD) trades above the midline. Any uptick in the MACD suggests the possibility of the 1.0550 horizontal resistance level followed by the high made on October, 14 at 1.0610.
.
Alternatively, if the price moves lower, it would first retest the 61.8% Fibonacci retracement level at 1.0405. Next, on the bear’s radar will be the 1.0350 horizontal support level and then September, 17 low of 1.0294.
AUD/NZD additional levels
- The move higher in yields in recent weeks presents a challenge to the ECB.
- EUR/USD remains capped by daily resistance.
EUR/USD is flat in the open this week at 1.1645 at daily resistance with the US dollar trying to hold up. Investors have taken profits since the dollar index hit a one-year high last week as they build expectations for sooner rate increases in other currencies. However, the dollar pared losses on Friday and Treasury yields fell after Federal Reserve Chairman Jerome Powell said the US central bank should begin reducing its asset purchases soon, but should not yet raise interest rates.
However, there were no massive surprises in his comments but he said the impacts from global supply-chain constraints are having a longer-lasting effect on prices. Nevertheless, he still expects inflation to move back towards 2% over time. This led to US rates selling-off initially with 10y UST yields down sharply to 1.63%. US equities were also lower.
In US data, Markit Manufacturing PMI dropped more than expected in October, to 59.2 vs the expected 60.5. However, the service index improved more than expected, to 58.2 vs the expected 55.2). ''The impacts of the supply-chain constraints were evident in the details, with the indices for input prices rising to series highs,'' analysts at ANZ Bank explained. ''Likewise, measures of backlogs and manufacturing times were also the highest on record.''
Domestically, the preliminary composite PMI for October fell to 54.3 vs the expected 55.2. This was in large part attributable to a decline in activity in the German service PMI which fell by 3.6pts to 52.4. Meanwhile, the EA manufacturing PMI was relatively stable, falling 0.1pts to 58.6. ''The data suggest that growth in Q4 for Europe will slow, but with the recovery, still intact,'' the analysts at ANZ explained. ''Encouragingly, the composite employment index rose 1.2pts to 56.1 and the future output index rose 0.3pts to 67.2.''
ECB in focus
Looking ahead to the week, the European Central Bank is what matters most. ''While October was meant to be a simple placeholder meeting on the road to the Governing Council's big December "re-assessment" of its policy stance, the move higher in yields in recent weeks presents a challenge,'' analysts at TD Securities explained. ''While we think words are more likely than actions, an increase in the pace of PEPP purchases can't be completely ruled out.''
| Pare | Closed | Change, % |
|---|---|---|
| AUDUSD | 0.74669 | 0.02 |
| EURJPY | 132.135 | -0.28 |
| EURUSD | 1.1643 | 0.16 |
| GBPJPY | 156.139 | -0.69 |
| GBPUSD | 1.37588 | -0.24 |
| NZDUSD | 0.71483 | -0.1 |
| USDCAD | 1.23661 | -0.01 |
| USDCHF | 0.91597 | -0.2 |
| USDJPY | 113.479 | -0.45 |
- AUD/USD remains sidelined, pokes monthly support line amid a quiet session.
- Risk appetite worsens amid fresh covid fears from China, another Beijing-based firm’s nearness to bond default.
- Moody’s site Australia’s rising prices, stagnant wages, Fed tapering concerns remain elevated.
- Second-tier US data, risk catalysts in focus amid light calendar in Asia.
AUD/USD seesaws around 0.7470, flirting with the monthly support line near the one-week low. That said, the quote remains indecisive as contrasting headlines from China and home trouble traders.
Among them, fears of another COVID-19 wave in China battle positive headlines concerning Evergrande. Also in the play are the chatters over the Fed tapering and credit crisis of one more Chinese real estate firm. At home, vaccine optimism fails to stop the global rating giant Moody’s from conveying fears for Aussie housing markets.
As per the latest comments from Mi Feng, a spokesman at the National Health Commission, shared by Reuters, ''There is increasing risk that the outbreak might spread further, helped by ‘seasonal factors’”. On the other hand, Evergrande’s latest communication to have restarted 10 projects in six cities including Shenzhen tame fears emanating from the struggled real-estate player.
It’s worth noting that the US policymakers, including President Joe Biden, signaled nearness to the much-awaited infrastructure spending deal but there hasn’t been any notable progress and that adds to the market’s boredom. Also contributing to the latest risk-off mood is the Fed tapering concerns, recently backed by Federal Reserve Chairman Jerome Powell, as well as news that another real estate firm from China, namely Modern Land, is said to struggle to pay $250 million 12.85% senior notes due October 25.
Reuters came out with the news saying, “Australia looks to roll out COVID-19 booster shots soon as curbs ease,” which in turn keeps AUD/USD buyers hopeful amid the US dollar weakness. However, Moody’s comments like, “housing affordability in Australia will continue to worsen over the rest of 2021 and into early 2022 as property prices rise amid stagnant wages,” challenge the pair buyers.
Amid these plays, US 10-year Treasury yields remain pressured around 1.65%, after stepping back from a five-month high the last week, whereas the S&P 500 Futures drop 0.23% by the press time.
Considering a mixed play of catalysts, AUD/USD traders will wait for clearer factors for short-term direction. This may highlight today’s US Chicago Fed National Activity Index for September and Dallas Fed Manufacturing Business Index for October for immediate direction.
Technical analysis
Although overbought RSI dragged AUD/USD back from a 10-week-old resistance line, a monthly support line near 0.7460 restricts the quote’s short-term declines. In a case where bears manage to conquer the stated support line, the 100-DMA level of 0.7400 will be crucial to watch. Meanwhile, an upside clearance of the stated trend line resistance, around 0.7530, will direct the pair buyers toward the 200-DMA and late June’s peak, respectively close to 0.7565 and 0.7620.


© 2000-2026. All rights reserved.
This site is managed by Teletrade D.J. LLC 2351 LLC 2022 (Euro House, Richmond Hill Road, Kingstown, VC0100, St. Vincent and the Grenadines).
The information on this website is for informational purposes only and does not constitute any investment advice.
The company does not serve or provide services to customers who are residents of the US, Canada, Iran, The Democratic People's Republic of Korea, Yemen and FATF blacklisted countries.
Making transactions on financial markets with marginal financial instruments opens up wide possibilities and allows investors who are willing to take risks to earn high profits, carrying a potentially high risk of losses at the same time. Therefore you should responsibly approach the issue of choosing the appropriate investment strategy, taking the available resources into account, before starting trading.
Use of the information: full or partial use of materials from this website must always be referenced to TeleTrade as the source of information. Use of the materials on the Internet must be accompanied by a hyperlink to teletrade.org. Automatic import of materials and information from this website is prohibited.
Please contact our PR department if you have any questions or need assistance at pr@teletrade.global.
transfers