- Analytics
- News and Tools
- Market News
CFD Markets News and Forecasts — 20-07-2022
US inflation expectations, as per the 10-year breakeven inflation rate per the St. Louis Federal Reserve (FRED) data, ease from the monthly high by the end of Wednesday’s North American session. That said, the inflation gauge recently flashed the 2.38% mark, reversing from the previous day’s multi-day of 2.39%.
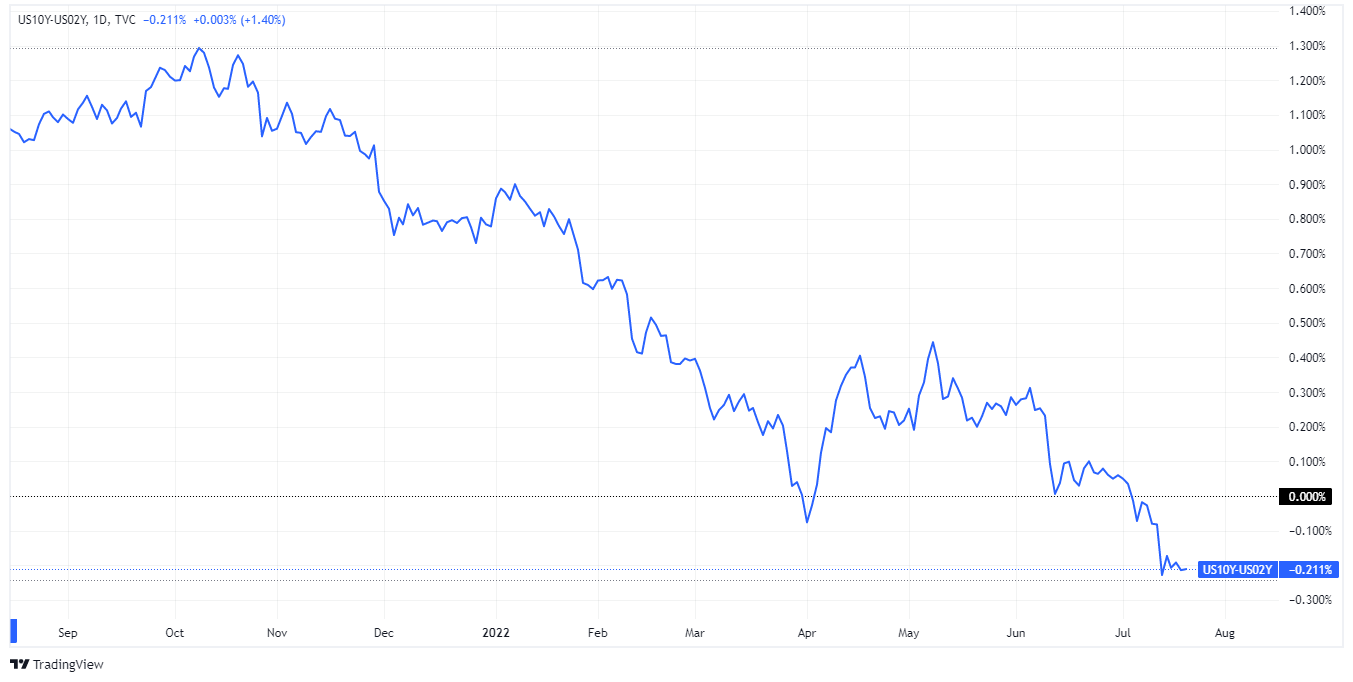
The recent weakness in the US inflation expectations fail to defy the recession fears, signaled by the inversion of the 2-year and the 10-year Treasury yield curve. That said, the US 2-year Treasury yields are higher around 3.23% while the 10-year bond coupon seesaws near 3.03% at the latest.
Overall, the inflation expectations are in recovery mode and appear to weigh on the market sentiment, which in turn can help the US dollar to regain its upside momentum, after a week of a pullback from a nearly 20-year high.
It’s worth noting that the US Dollar Index (DXY) bounced off a two-week low to snap the three-day downtrend the previous day as market sentiment soured.
Also read: Forex Today: Sentiment sours amid recession fears and ahead of the ECB
- EUR/JPY has extended recovery near 141.00 on expectations of ECB-BOJ policy divergence.
- The ECB may accelerate its interest rates by 25 bps initially to test the waters.
- BOJ’s Kuroda may withstand policy easing to keep the inflation rate above 2%.
The EUR/JPY pair is mostly trading sideways above 140.00 as investors are awaiting the release of the interest rate policy by the European Central Bank (ECB) and Bank of Japan (BOJ) on Thursday. Both G7 participants have not paddled up their interest rates like the other mates which have accelerated their interest rates to tame the price pressures vigorously.
However, this time a policy divergence looks imminent as the market participants are betting over a rate hike announcement by ECB President Christine Lagarde. It would be worth watching whether the ECB will initially test the waters by hiking interest rates by 25 basis points (bps) or will choose the new normal of 50 bps.
Taking into account the soaring price pressures and the conclusion of the Asset Purchase Program (APP), the ECB is left with no other choice than to feature a rate hike. The final print of the Eurozone Harmonized Index of Consumer Prices (HICP) landed at 8.6%, which indicates that the households are facing the heat of price rise beyond their tolerance power.
On the Tokyo front, the BOJ is expected to stand with its ultra-loose monetary policy despite the vulnerable yen in the FX domain. BOJ Governor Haruhiko Kuroda is bound to accelerate policy easing as their main agenda is to keep the ongoing inflation rate above the desired rate. In order to keep price pressures above 2%, the Japanese economy is needed a higher wage rate to keep the former elevated.
- GBP/USD remains pressured after reversing from short-term key moving average.
- Five-week-old horizontal support challenges immediate downside, bulls need validation from 1.2055.
- MACD signals, RSI (14) hint at further consolidation from yearly low.
GBP/USD holds onto the previous day’s pullback from the 20-DMA around 1.1970 amid Thursday’s Asian session.
In doing so, the Cable pair ignores MACD and RSI (14) as bears approach a horizontal support area established since June 14, around 1.1930.
The quote’s further downside appears limited as the 1.1900 threshold and 1.1880 level may test the bears before directing them to the two-year low around 1.1760, flashed last week.
It’s worth noting that the GBP/USD weakness past 1.1760 won’t hesitate to drag it towards the 61.8% Fibonacci Expansion (FE) of June 16 to July 19 moves, around 1.1650.
On the contrary, an upside break of the 20-DMA, at 1.2020 by the press time, isn’t a green signal to the Cable buyers as July 08 swing high near 1.2055 appears the short-term hurdle to the north.
Following that, the 38.2% Fibonacci retracement of the June-July downside, close to 1.2105, will precede the June 22 low of 1.2161 to challenge the GBP/USD buyers.
Overall, GBP/USD is likely to witness further downside but the road to the south is bumpy and long.
GBP/USD: Daily chart
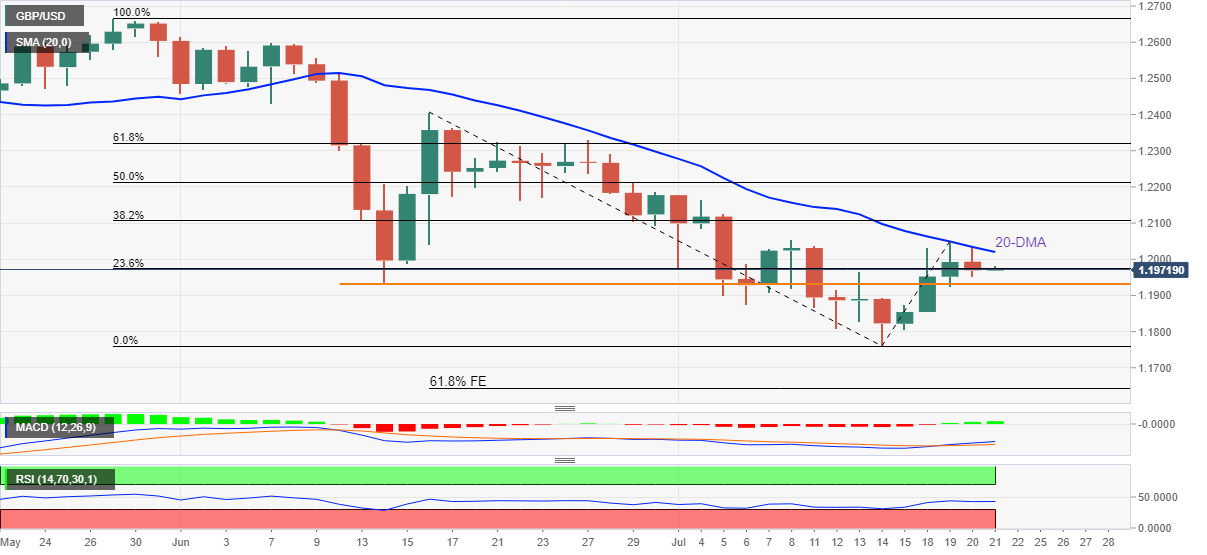
Trend: Limited downside expected
“For investors trying to figure out how to play the US Treasury market, the Bank of Japan is one of the big unknowns,” mentioned Bloomberg ahead of Thursday’s Bank of Japan (BOJ) monetary policy meeting.
Key quotes
While the European Central Bank is widely anticipated on Thursday to raise rates for the first time since 2011 and questions around Federal Reserve policy revolve how fast and how far officials might tighten, in Japan it’s the lift-off itself that’s in question.
Japan’s central bank was the first globally to usher in ultra-loose monetary policy, employing tools like quantitative easing and yield-curve control, and it’s set to be among the last to abandon it.
At their meeting this week, BOJ officials are expected to keep holding rates low to stimulate the nation’s economy as consumer-price increases hold below those seen in other developed economies.
But a plummeting yen is adding to speculation about how long Japan can hold out from the hawkish shift among central banks, injecting fresh uncertainty into global bond markets.
If it does change course, analysts say Treasury yields could jump higher -- if only temporarily -- by signaling an official end to the easy money era globally.
At the same time, though, it could also rekindle Treasury buying by Japanese investors who have been on the sidelines as the US dollar rallied -- or even drive down long-dated yields by intensifying the risk of a global slowdown.
The prospect that the BOJ will surprise markets in the coming months by removing the 0.25% yield ceiling on 10-year bonds is being eyed by some investors as a potential buying opportunity for US and euro-zone bonds.
Also read: BOJ Preview: Still on hold, but for how long?
- The performance of the USD/CAD pair has remained vulnerable despite a confident pullback in DXY.
- The higher inflation rate reported by Statistics Canada accelerates hawkish BOC bets.
- Oil prices are facing barricades around $100.00 as recession fears escalate.
The USD/CAD pair is displaying a lackluster performance in the early Asian session, following the footprints of the US dollar index (DXY). The asset is juggling in a minute range below the critical hurdle of 1.2900. It is worth noting that a stronger pullback in the DXY on Wednesday failed to bring a parallel pullback in the USD/CAD pair. This indicates that the loonie bulls have gotten stronger on escalated hawkish Bank of Canada (BOC) bets after the release of the inflation rate.
On Wednesday, Statistics Canada reported the plain-vanilla Consumer Price Index (CPI) at 8.1%, higher than the prior release of 7.7% but remained lower than the consensus of 8.4%. The monthly inflation rate slipped firmly to 0.7% vs. 0.9% expected and 1.4% the prior release. Also, the core CPI that doesn’t inculcate volatile food and oil prices remained lower than the estimates of 6.7% at 6.2% and 10 basis points (bps) higher than the former figure.
Although the price pressure remained lower than the estimates but still remains higher than the prior figures and doesn’t show any sign of exhaustion. This keeps the odds of more jumbo rate hikes by the BOC alive. Currently, the BOC’s interest rate stands at 2.5% after the 100 bps rate hike last week.
Meanwhile, the US dollar index (DXY) is holding itself above 107.00 after a pullback move. The asset picked bids after testing Tuesday’s low around 106.40 with lower selling pressure. This week, the focus will remain on the S&P PMI data, which is expected to remain subdued.
On the oil front, oil prices are facing barricades continuously around the psychological resistance of $100.00. It seems that investors have started underpinning the recession fears against the supply worries as western central banks are shifting into a new leg of raising interest rates. Price pressures have not delivered a meaningful exhaustion signal yet, which indicates more policy tightening measures are ahead.
- NZD/USD fades corrective pullback above 0.6200 on mostly downbeat NZ trade data.
- New Zealand Trade Balance dropped to $-10.51B YoY versus $-9.56B prior in June.
- Market sentiment sours as fears of recession, central bank aggression renew.
- Risk catalysts are the key for fresh impulse, ECB in focus.
NZD/USD remains pressured towards 0.6200 as New Zealand (NZ) trade numbers hint at a wider deficit for June, published during Thursday’s Asian session. Adding to the Kiwi pair’s woes were the fresh risk-off mood and a lack of major data/events at home. However, hawkish concerns surrounding the Reserve Bank of New Zealand (RBNZ) appear to defend the bulls.
NZ Trade Balance dropped to $10.51B YoY from $9.56B (revised) prior whereas the monthly figures also marked a deficit of $701 million versus the $195M previous surplus. Further details hint at the reduction in Exports to $6.42B from $6.87B prior while Imports improved to $7.12B versus 6.68B prior.
Other than the recently released NZ trade numbers, the market’s risk-aversion also exerts downside pressure on the NZD/USD prices. Among the key challenges to sentiment are the fresh fears of recession emanating from Europe and strong inflation data from the UK, as well as from Canada. Also weighing on the Kiwi pair could be the Sino-American tensions and China’s covid woes.
Russian President Vladimir Putin mentioned that they are yet to see in which condition the equipment for Nord Stream 1 will be after returning from maintenance, per Reuters. However, European Commission President Ursula von der Leyen said on Wednesday that it was a likely scenario that there could be a full cut-off of Russian gas, as reported by Reuters. It should be noted that the fears over gas might have pushed the International Monetary Fund (IMF) to cut its growth forecasts for Germany. That said, the IMF lowered its growth forecasts for Germany to 1.2% for 2002 and 0.8% for 2023. In its previous forecast, the IMF was expecting the German economy to grow by 2% in both years. Also signaling more pain for the bloc, as well as for markets, were political jitters in Italy. That said, Prime Minister Mario Draghi won a confidence motion, but as three major cotillion parties boycotted the vote and hence Mr. Draghi may again resign and trigger early elections in the nation.
Elsewhere, Eurozone Consumer Confidence slumped to a record low and the UK’s inflation refreshed an all-time high while Canada’s Consumer Price Index (CPI) also rose in June.
Furthermore, the fresh US-China tussles over Taiwan and China’s highest covid count in two months add to the risk-off mood. Additionally, Google was the first to report a two-week halt in recruitment while Ford announced plans to cut around 8,000 jobs.
On the contrary, the hawkish hopes from the RBNZ keep the NZD/USD buyers hopeful. The Analysts at ANZ Bank who are anticipating a 50 bps hike said the possibility that the RBNZ hikes by 75bps in August cannot be ruled out. ''The second quarter labor market statistics on August 3 will be watched very closely.''
Against this backdrop, Wall Street managed to close on the positive side despite the latest pullback while the US 10-year Treasury yields paused a two-day uptrend around 3.03%.
Looking forward, NZD/USD traders may witness further selling amid sour sentiment ahead of the monetary policy meeting of the European Central Bank (ECB).
Technical analysis
NZD/USD pullback remains elusive unless staying beyond the 21-DMA hurdle surrounding 0.6200.
- The AUD/JPY remains on the right foot during the week, gaining 1.20%.
- Asian equity futures are registering losses, augmenting the appetite for safe-haven peers and bolstering the JPY.
- AUD/JPY Price Analysis: Buyers' failure at 96.00 could pave the way for further losses, as sellers eye 94.50.
The AUD/JPY barely grinds lower as the Asian Pacific session begins, down by almost 0.03%. On Wednesday, the cross-currency pair hit a fresh 7-week high around 95.76 before diving towards the 95.20s region. At the time of writing, the AUD/JPY is trading at 95.24, amidst a mixed market mood, as US equities rose in the last hour of the trading day while Asian equities prepare for a lower open, as shown by market futures.
AUD/JPY Price Analysis: Technical outlook
From a technical perspective, the AUD/JPY daily chart depicts a neutral bias, as the cross-currency has failed to break above the 96.00 figure to challenge the YTD high of around 96.88. Nevertheless, the AUD/JPY shifted from upwards-neutral to neutral on some factors. First, the Relative Strength Index (RSI), albeit in bullish territory, begins to show signs of aiming lower. Secondly, the distance between the 20, 50, and 100-day EMAs reduced in the last six trading days, opening the door for consolidation before resuming upwards or turning downwards.
AUD/JPY 1-hour chart
The AUD/JPY 1-hour chart illustrates the pair trending in an ascending channel since July twelve. AUD/JPY traders should notice that on Wednesday, price action faced the top-trendline of the previously mentioned channel, indicating prices reaching overbought conditions and opening the door for a pullback. Indeed that happened since the North American session began, with traders sending the AUD/JPY towards the daily low at 95.02.
Nevertheless, at the time of writing, the AUD/JPY is below the mid-line of the ascending channel and under the daily pivot, indicating that sellers are in charge. Therefore, the AUD/JPY first support would be the 50-hour EMA at 95.05. Break below will immediately send the pair to the S1 pivot point at 94.92, followed by the bottom trendline of the ascending channel around 94.70-80. Once cleared, the AUD/JPY's next support would be the 100-hour EMA at 94.54.
On the flip side, the AUD/JPY resistance levels would be the confluence of the daily pivot point and the 20-hour EMA at 95.33. Break above will send the price towards the R1 daily pivot at 95.66 before challenging the July 20 high at 95.75.
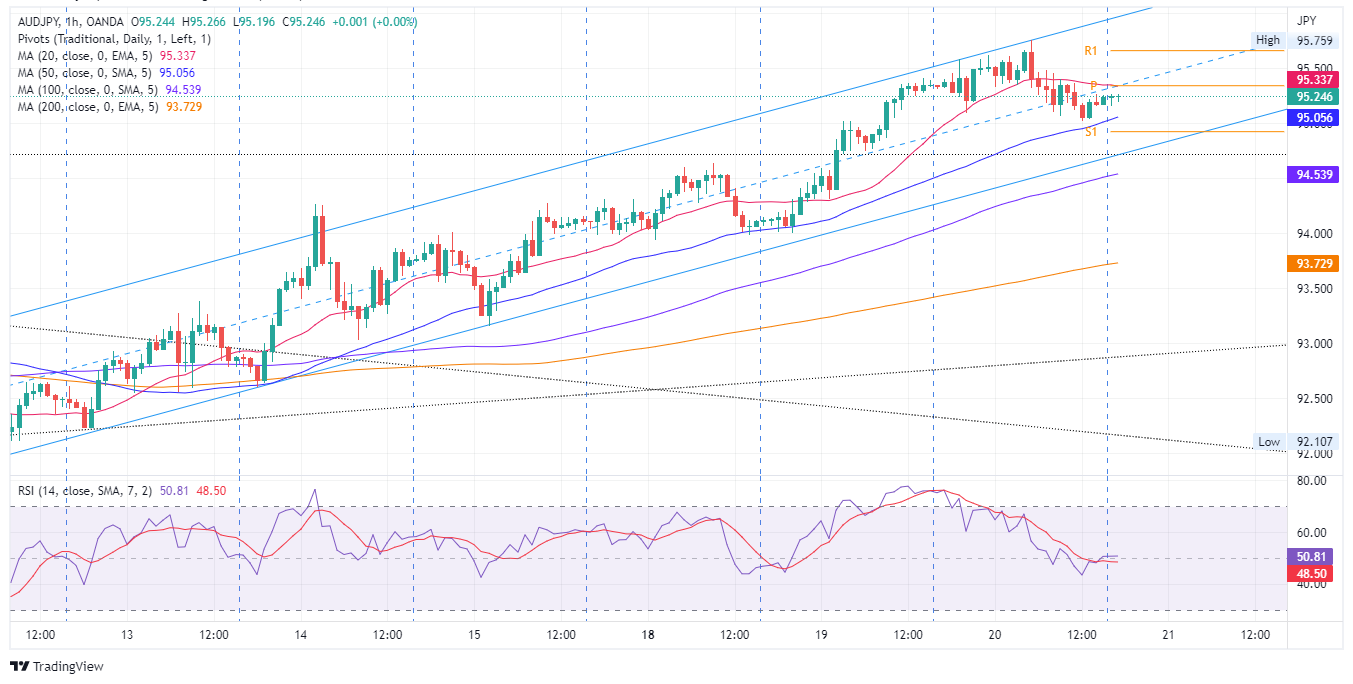
AUD/JPY Key Technical Levels
- EURUSD price has displayed recovery signs and is likely to recapture 1.0200 on ECB’s rate hike expectations.
- The DXY has made a confident pullback after sensing lower selling pressure around 106.40.
- Political turmoil in Italy and renewed obscurity over gas supply from Nord Stream1 have soured market mood.
EURUSD price shifted into a correction mode after failing to surpass Tuesday’s high at 1.0269 on Wednesday. The availability of barricades around a fresh three-week high activated selling pressure and dragged the asset to near 1.0156. On a broader note, the asset is scaling higher with sheer momentum. The pair has displayed signs of rebound and is expected to extend its recovery above 1.0200.
Meanwhile, the US dollar index (DXY) picked bids around 106.39 and displayed a pullback move above 107.00. A decent pullback in the DXY was expected by the market participants as a vertical downside move forced profit-booking at lower levels. The DXY is attempting to establish above 107.00 as lower selling pressure while testing Tuesday’s low around 106.40 has underpinned a short-term bullish reversal for now.
Also Read: EUR/USD Forecast: EUR corrects higher ahead of critical ECB decision

ECB President Christine Lagarde to announce a rate hike today
EURUSD price faces the heat of lower Consumer Confidence
EURUSD price witnessed a decent corrective move after the release of the lower Consumer Confidence. The consumer sentiment data landed at -27, worsen than the expectations of -24.9 and the prior release of -23.8. A slippage in the confidence of consumers in the economy results in an economic downturn, henceforth more losses for eurozone. It is worth noting that the US economy also reported Consumer Confidence last week. The data landed minutely higher at 51.1 vs. 50 reported earlier.
Political instability in Italy put pressure on the shared currency
Ongoing political turmoil in Italy after Prime Minister Mario Draghi informed his resignation despite winning a confidence motion in the upper house Senate on Wednesday has put certain pressure on the EURUSD price. The political instability has soured market sentiment as the economy is already facing the heat of soaring price pressures and over that a political instability raises concerns over the growth prospects.
Obscurity over Nord Stream 1 still persist
EURUSD price will remain under pressure as obscurity over the gas supply from Nord Stream 1 to Europe still persist. Earlier, two Russian sources familiar with the export plans told Reuters that the gas supply would be at less than its full capacity of some 160 million cubic metres (mcm) per day. Although the European Commission was not expecting that the pipeline will restart. Now comments from Russian President Vladimir Putin said on Wednesday that they are yet to see in which condition the equipment for Nord Stream 1 will be after returning from maintenance have created obscurity over the gas supply in eurozone.
EURUSD price to remain on sidelines ahead of ECB policy
The European Central Bank (ECB) is set to paddle up its interest rates for the first time in 11 years as price pressures are demanding containment. It would be worth watching whether the ECB will initially test the waters by hiking interest rates by 25 basis points (bps) or will choose the new normal of 50 bps. The announcement will definitely cushion the shared currency bulls against the DXY as the event will trim the ECB-Federal Reserve (Fed) policy divergence.
EURUSD technical analysis
EURUSD price has attempted a rebound on a Positive Divergence formation, which indicates a resumption of an uptrend after a corrective move. A Positive Divergence has been recorded after the asset made a higher low at around 1.2907 while the momentum oscillator Relative Strength Index (RSI) (14) made a lower low. This dictates an oversold situation in an uptrend which is considered a bargain buy for the market participants.
The major is auctioning between the 50- and 200-period Exponential Moving Averages (EMAs) at 1.0195 and 1.0160 respectively, which signals a minor consolidation ahead.
EURUSD hourly chart
-637939534235901994.png)
Key trading levels: AUDJPY, AUDUSD, EURJPY, EURUSD, GBPJPY, other currencies and S&P 500
- AUD/USD tries to reverse a pullback from a three-week high as market sentiment dwindles on recession fears.
- Looming gas problems for Eurozone, firmer inflation data from UK, Canada challenge the previous risk-on mood.
- Equities pared gains as major players paused/cut down on jobs, led by Google, hawkish RBA Governor Lowe defended bulls earlier.
- Australia’s NAB Business Confidence will be important, ECB is the key.
AUD/USD licks its wounds around 0.6900, after posting the first daily loss in a week as it reversed from the monthly top. The Aussie pair’s pullback could be linked to the market’s fresh fears of recession and inflation. However, hawkish concerns over the Reserve Bank of Australia’s (RBA) next move, as well as hopes of firmer sentiment data at home, appear to keep buyers hopeful during Thursday’s initial Asian session.
Chatters surrounding a permanent halt in Russia’s gas supplies to Europe appear to be the key catalyst that renewed recession fears the previous day. On the same line were the record inflation from the UK, a firmer CPI from Canada and Italy’s political crisis. Additionally, covid fears from China and Wall Street majors’ alarm on employment could also roil the previous optimism. However, comments from RBA Governor Philip Lowe suggested further rate hikes ahead, which in turn kept AUD/USD buyers hopeful.
European Commission President Ursula von der Leyen said on Wednesday that it was a likely scenario that there could be a full cut-off of Russian gas, as reported by Reuters. On the other hand, Russian President Vladimir Putin mentioned that they are yet to see in which condition the equipment for Nord Stream 1 will be after returning from maintenance, per Reuters. It should be noted that the fears over gas might have pushed the International Monetary Fund (IMF) to cut its growth forecasts for Germany. That said, the IMF lowered its growth forecasts for Germany to 1.2% for 2002 and to 0.8% for 2023. In its previous forecast, the IMF was expecting the German economy to grow by 2% in both years.
Elsewhere, Italian Prime Minister Mario Draghi won a confidence motion, but as three major cotillion parties boycotted the vote and hence Mr. Draghi may again resign and trigger early elections in the nation.
It should be noted that the UK reported an all-time high Consumer Price Index (CPI) of 9.4% YoY for June while Canada’s CPI also rose 8.1% during the stated month. The record slump in the Eurozone Consumer Confidence could also be linked to the market’s sour sentiment and weighed on the AUD/USD prices.
Furthermore, the fresh US-China tussles over Taiwan and China’s highest covid count in two months add to the risk-off mood. Additionally, Google was the first to report a two-week halt in recruitment while Ford announced plans to cut around 8,000 jobs.
On the contrary, RBA's Governor Lowe said that the board anticipates that additional hikes will be necessary in the upcoming months, per Reuters. With this, 50 bps rate hike from the RBA during its next meeting on August 02 gains more acceptance.
Amid these plays, Wall Street managed to close on the positive side despite the latest pullback while the US 10-year Treasury yields paused a two-day uptrend around 3.03%.
Moving on, National Australia Bank’s (NAB) quarterly prints of Business Confidence, expected 16 versus 14 prior, could entertain AUD/USD traders. However, risk catalysts and monetary policy meeting of the European Central Bank (ECB) will be more important for clear directions.
Technical analysis
A successful break of the 21-DMA and previous resistance line from mid-June, respectively around 0.6845 and 0.6820, keeps the AUD/USD pair on the way to the 0.7000 threshold.
- The British pound lost ground vs. the Japanese yen, but it’s positive in the week, up almost 0.80%.
- Investors’ mood improved towards the Wall Street close, but Asian equity futures are stumbling.
- GBP/JPY Price Analysis: Neutral-to-downward biased, though upside risks remain.
The GBP/JPY is barely up almost 0.03%, following Wednesday’s session, where the cross-currency tumbled from weekly highs around 166.25 to hit a daily low at 165.13 before settling around in the mid 165-166.00 range. At the time of writing, the GBP/JPY is trading at 165.58 as the Asian Pacific session begins.
GBP/JPY Price Analysis: Technical outlook
On Wednesday, the GBP/JPY began trading around 165.70s before marching firmly towards the daily highs around 166.22. Nevertheless, the pair fell on UK inflation data, sending the GBP/JPY towards its daily lows around 165.13, breaking below the 20, and 50 hour-EMA’s on its way south. Therefore, the GBP/JPY is neutral biased in the hourly chart, though it might consolidate around the 165.27-88 range before breaking in either way.
GBP/JPY 1-hour chart
The GBP/JPY 1-hour chart depicts the pair as range-bound. However, GBP/JPY traders should notice that price action broke below a nine-day upslope trendline around 165.60, which was later tested. However, GBP/JPY buyers could not hold the exchange rate above it, and meaning sellers outweighed buyers.
Therefore, the GBP/JPY is mild-tilted downwards. If that scenario plays out, the GBP/JPY first support would be 165.27. Break below will send the pair diving to the confluence of the 100-hour EMA and the S1 pivot point around 165.00, followed by the 200-hour EMA at 164.25. On the other hand, the GBP/JPY first resistance would be the intersection of the daily pivot and the 20-hour EMA around 165.69. A breach of the latter will expose the top of the range around 165.88, followed by the weekly high at 166.25.
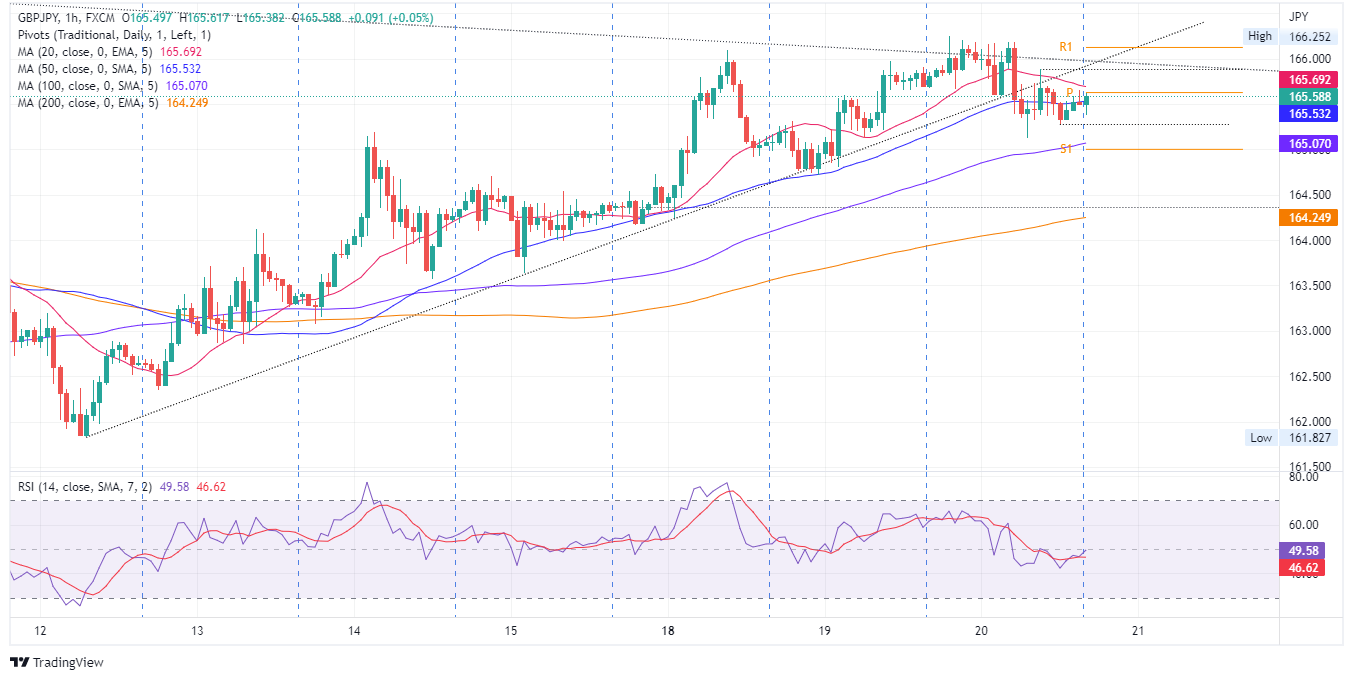
GBP/JPY Key Technical Levels
- Gold price is now awaiting the outcome of the ECB meeting on Thursday.
- US yields and US dollar are playing their role in the yellow metals decline.
- Italian politics stole the show on Wednesday ahead of central bank business.
Gold price is down 0.85% at $1,696,84 as the US dollar strengthens which left XAUUSD for December delivery down US$10.40 to US$1,717.70. Still, the spot gold price is below the psychological threshold and traders are eyeing a move to the weekly pivot of $1,676. Bonds and the US dollar are picking up the bid from safe-haven flows making the yellow metal more expensive for international buyers. Markets are second-guessing the Federal Reserve's next move but will be distracted by Thursday's European Central Bank decision, political turmoil in Italy and key US data before the showdown FOMC meeting taking place on July 26/27 July.
Gold price pressured by US yields edging higher, firm US dollar
Bond yields and the US dollar were firmer on Wednesday which weighed on the gold price, bearish for gold since it offers no interest to investors seeking yield with their idle capital. The US 10-year note was last seen paying 3.032%, up 0.1 basis points in early Asia after bond investors balanced their positions ahead of another Federal Reserve meeting next week. A strong US 20-year bond auction helped to support bond values on the longer end of the curve, pushing their yields lower compared with those with shorter-term maturities and keeping the curve inverted. However, the inversion is regarded as a risk to markets as it warns of aggressive Fed hikes that might be expected to send the US economy over the edge.
Meanwhile, the US dollar gains were capped ahead of the crucial European Central Bank policy decision on Thursday. The greenback, as measured by the DXY, hit 107.252 before slumping towards 107.00 in late New York trade. The majority of the leg work in forex was centred around the euro due to political uncertainties in Italy as well as the ECB.
EUR/USD could be a driver for gold price on Thursday
EUR/USD has rallied about 2% in the last three trading sessions as markets get prepared for a possible 50 basis point rate hike by the ECB. However, it came up against bears on Wednesday due to the prospects of Italian politics plunging into months of upheaval surrounding the resignation of the prime minister, Mario Draghi.
Read more here: Italian PM Draghi will announce his resignation in the chamber tomorrow
The ECB meeting meanwhile will come to the forefront of Thursday's trading activity and the outcome would be expected to move the needle in forex and ultimately in the gold price as a bi-product of what happens to the US dollar.
ECB outlook

The European Central Bank
The ECB is expected to hike by 25bps and announce an anti-fragmentation tool. However, the risk of a 50bps hike has grown materially and is almost a coin toss as analysts at TD Securities argued. ''it is the sensible outcome to the meeting, but goes against recent communications.''
With regards to how the outcomes and scenarios might play out in forex, the analysts make a case for a buy the rumour, sell the fact playbook. ''Markets should respect the risk for a 50bp 'surprise'. But in doing so, the ECB is pulling forward its limitations to tighten aggressively later in its cycle as energy constraints risk choking-off domestic demand. A move to 1.0340/00 in EURUSD risks being a fade.''
US dollar holds below a 20-year peak ahead of PMI & Fed
The US dollar is trying to establish below the 20-year highs but from a daily perspective, the price is hovering over a void of offers that leaves 105.27 vulnerable should DXY bears continue to hit the bids. Gold traders will be keeping a close eye on price action at this juncture. Meanwhile, beyond the ECB, key US PMI data will be eyed. Analysts at TD Securities explained, ''business surveys fell markedly in June, led by broad declines in the S&P Global PMIs. The manufacturing index, in particular, posted a large retreat to 52.7 from 57.0 in May.''
'While we look for relief in the pace of declines in the mfg PMI, we still expect it to register a new drop in the flash estimate. Conversely, we expect a steady number for the services index after recent declines.''
The Federal Reserve is around the corner and for the time being, ''gold prices are being supported by the markets' repricing for odds of a 100bp hike after Fedspeak from notable hawks has pushed back against this narrative, which is raising the risk of a near-term short-squeeze,'' analysts at TD Securities argued. ''Notwithstanding, this scenario would create the ideal set-up for additional downside in the yellow metal.''
Gold price technical analysis
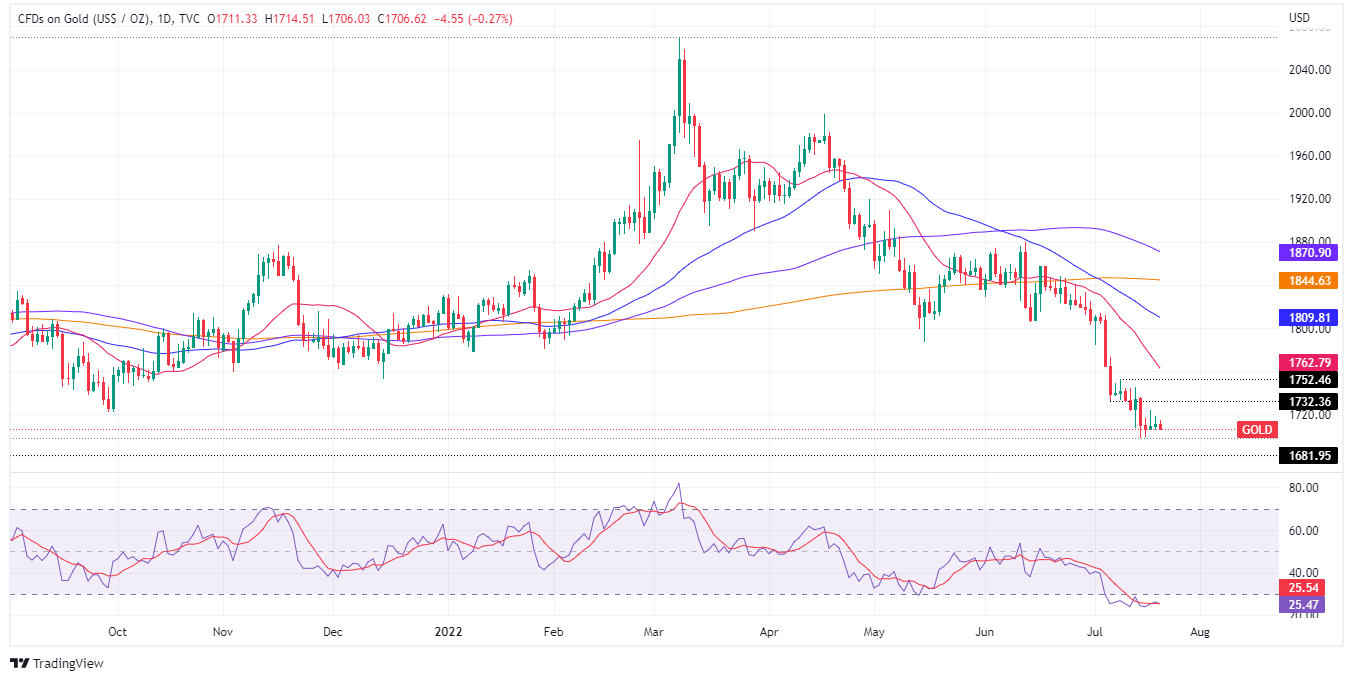
Gold price, from a weekly perspective, the bull correction has stalled and bears are moving in again. This puts the lows of $1,676.86, as illustrated on the chart below and up for grabs from a technical perspective:
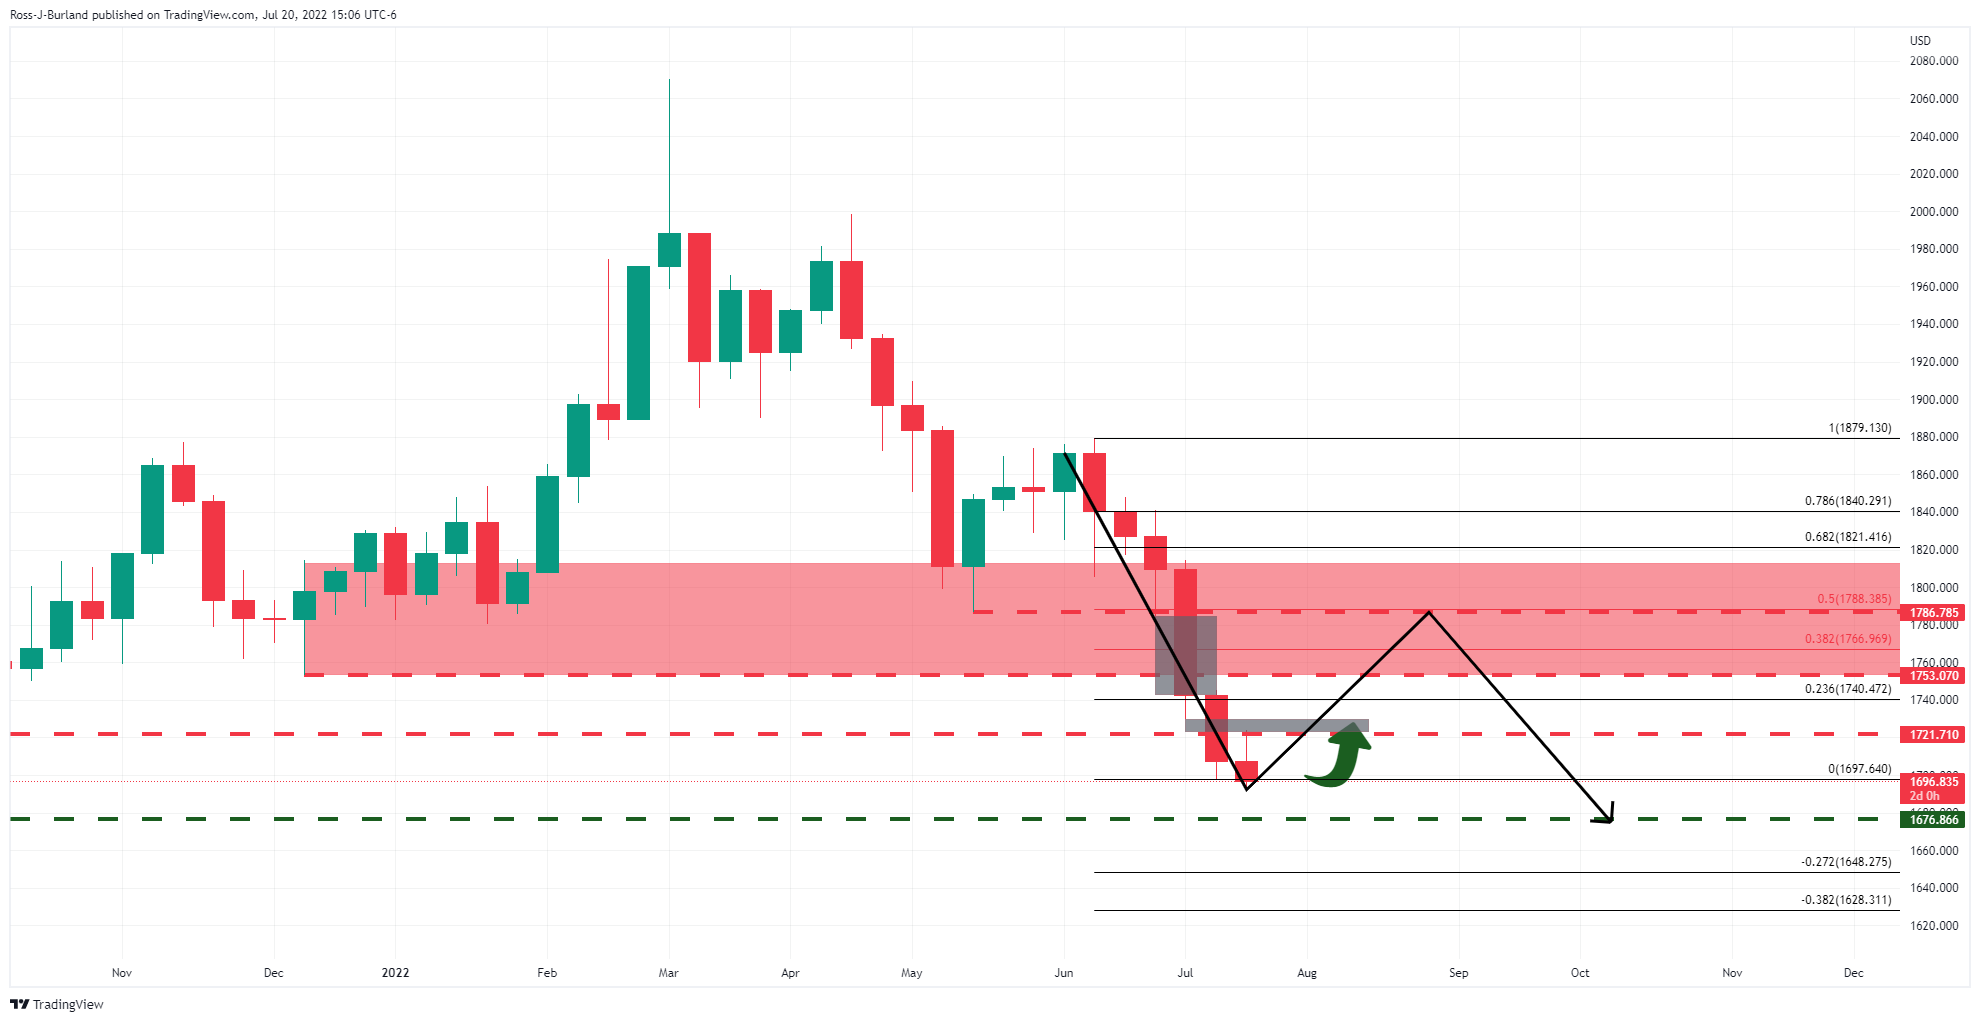
The greyed-out areas on the chart above are void of bids which could draw XAUUSD to test the commitments of bears near a 50% mean reversion. On the way there, however, we have a couple of major pivot points that could offer resistance at $1,721 and $1,753. On the other hand, if the bears stay committed, the $1,677 pivot area could be hit sooner than later.
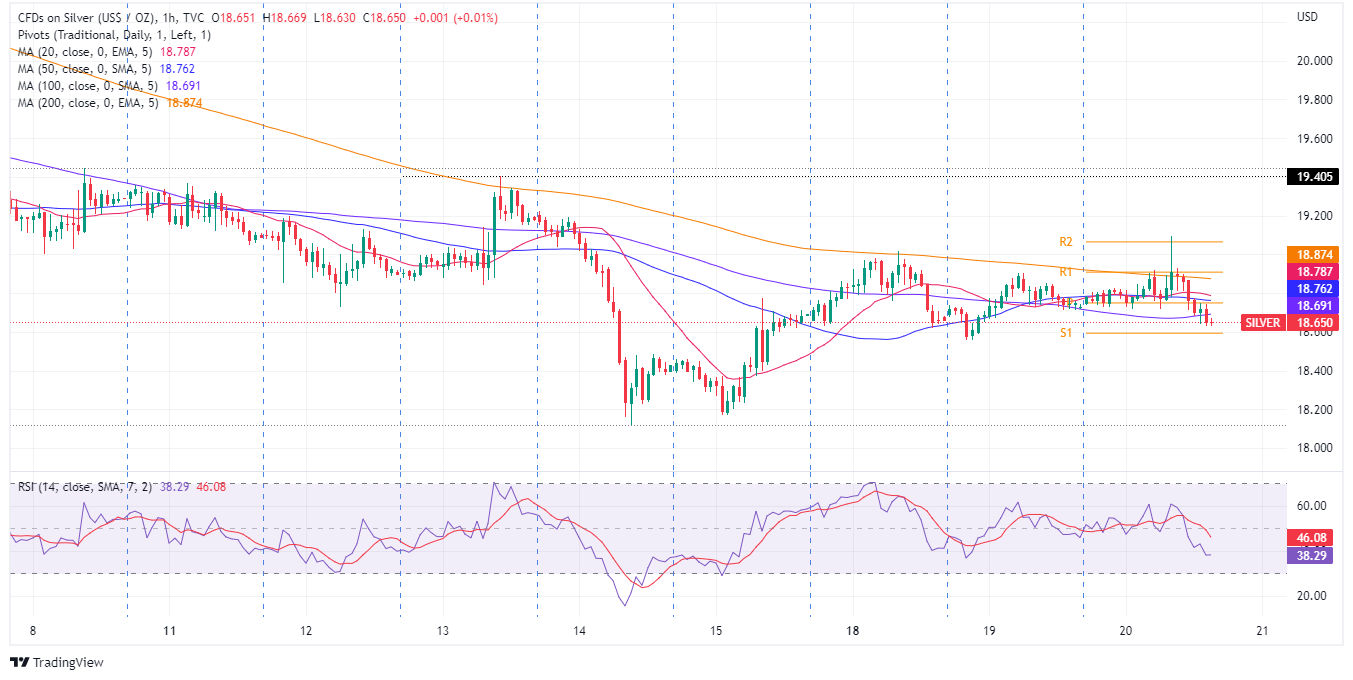
- Silver prices are on the defensive, on broad US dollar strength.
- The US housing market crumbles as the Fed continues hiking rates aggressively.
- Silver Price Forecast (XAGUSD): Range-bound but tilted to the downside.
Silver price remains subdued, registering minimal losses late during the New York session. Factors like improved market sentiment, a buoyant US dollar, and elevated US Treasury yields keep the while metal pressured. At the time of writing, XAGUSD is trading at $18.65, down 0.19%.
The US Dollar Index, a measure of the buck’s value against six currencies, snaps three days of losses, rising 0.36% above the 107.000 threshold. US Treasuries remain under selling pressure, as the US 10-year benchmark note rate sits at 3.038%, almost flat, putting a lid on higher silver prices.
US housing data flash a faster economic deceleration
The US housing market is beginning to show flashes of further deterioration, as data reported during the week missed expectations, meaning a recession looms. On Tuesday, Housing Starts contracted to its lowest level since September 2021, declining 2% in June, while Building Permits, also known as building applications, shrank 0.6%, respectively.
In the meantime, Existing Home Sales for June, unveiled on Wednesday, followed suit Tuesday’s data, plunging to -5.4%, well below the 5.4% growth estimations. Sources cited by Bloomberg said that “both mortgage rates and home prices have risen too sharply in a short span of time.”
That said, the first signs of an impending US recession lie ahead. The US 2s-10s yield curve remains inverted for twelve straight days, at -0.220%, indicating investors’ worries of further economic deterioration. However, elevated inflationary pressures, with the US CPI above 9% and PPI at 11%, might not deter the Federal Reserve from hiking 75 bps in the next week.
Therefore, XAGUSD will remain on the defensive due to the greenback’s strength, which would also keep the commodity complex under pressure.
What to watch
The US economic docket will feature the Philly Fed Manufacturing Index, Initial Jobless Claims, and the CB Leading Index.
Silver Price Forecast (XAGUSD): Technical outlook
Silver has been exchanging hands in low volatility conditions during the last three days, as shown by the dismal $0.10 trading range, trapped within the $18.60-70 area. Furthermore, the XAGUSD 1-hour moving averages (HMAs) hoover around that area, further explaining the narrow trading range.
To the upside, the XAGUSD’s first resistance would be July’s 18 high at 19.01. Break above will expose the July 13 daily high at 19.40. Conversely, XAGUSD’s first support would be the S1 daily pivot at $18.59. A breach of the latter will expose the July 15 daily low at $18.17.
What you need to take care of on Thursday, July 21:
It was a busy and worrisome Wednesday, but the FX board did not reflect it as the lingering European Central Bank monetary policy announcement turned investors cautious.
Inflation is among the key global issues, as the Consumer Price Index in the UK surged by 9.4% YoY in June, while the Canadian CPI climbed by 8.1% in the same period, both up from May figures.
In the UK, the Conservative leadership contest has reduced candidates to two final ones, Rishi Sunak and Liz Truss. One of them will become the next Prime Minister replacing Boris Johnson. The winner will be announced on Monday, September 5, following a postal ballot completed by 160,000 Tory party members.
Wall Street opened with modest gains, but US indexes took a turn to the worst amid news big companies are cutting off jobs. Google was the first one, announcing it would pause recruitment for two week, while later in the day, Ford unveiled plans to cut as many as 8000 jobs in the coming weeks. The headlines put back on the table recession concerns.
In Italy, Prime Minister Mario Draghi won a confidence motion, but as three major cotillion parties boycotted the vote, he is likely to resign and call for early elections. Also, EU authorities fear a full cut-off of Russian gas, which will take a harsh toll on the Union’s Gross Domestic Product.
Meanwhile, Russia has announced geographical objectives of the special operation in Ukraine have changed to add new territories.
The EUR/USD pair trades around 1.0170, while GBP/USD was once again unable to retain gains above the 1.2000 threshold and hovers in the 1.1960 price zone. The AUD/USD pair is marginally lower, holding below 0.6900, while USD/CAD consolidates around 1.2870.
The American dollar posted modest gains against CHF and JPY. Gold, on the other hand, fell to a fresh weekly low below $1,700 and now trades in the $1,697 price zone.
Crude oil prices edged marginally lower, with WTI now changing hands at $99.80 a barrel.
Bitcoin Price Prediction: Smart Money Greed vs Retail Fear
Like this article? Help us with some feedback by answering this survey:
Italian Prime Minister Mario Draghi won a confidence motion in the upper house Senate on Wednesday, but three main coalition parties refused to take part in the vote, effectively dissolving his administration and he is said to announce his resignation in the chamber tomorrow.
The motion asked the house to approve a speech made by Draghi earlier in the day when he demanded unity from his coalition allies. The vote was approved by 95 to 38 with many dozens of senators absenting themselves. The euro has been pushed and pulled throughout the developments of the political turmoil as a government collapse would likely worsen social ills in a period of rampant inflation, war on the doorsteps of the euro bloc, delay the budget, threaten EU post-pandemic recovery funds and send jittery markets into a tailspin.
An early election is now scheduled to take place in September.
More on this here: Italian politics plunged into months of upheaval
- GBP/USD pressured by a stronger US dollar ahead of the ECB.
- Italian politics is taking up the front pages in the financials, weighing on the euro.
At 1.1967, GBP/USD is losing some 0.24% from a high of 1.2037 and has fallen to a low of 1.1953 with the US dollar edging higher ahead of a rate decision by the European Central Bank on Thursday and amidst yet more political uncertainty across the pond.
The US dollar has benefitted from its safe haven status as the euro struggles in the run-up to a potentially eventful day on Thursday with the ECB meeting. However, Italian politics has been at the fore of action this week, so far, with potentially months of upheaval.
Italian Prime Minister Mario Draghi asked on Wednesday for the upper house Senate to hold a confidence vote that will effectively decide if his coalition government stays in office. However, despite winning the Senate Confidence motion, Draghi previously said he would not continue without the support of his coalition partner, the Five Star Movement. This means that an early election will be called in the nation which is a weight on the euro, potentially beneficial to the US dollar and therefore a thorn in the side for the sterling bulls.
Meanwhile, back on UK shores, net short GBP positions increased for a second consecutive week last week as politics on home soil are also a burden for the nation's currency. The UK will have a lame duck prime minister until September when a new leader will be announced. The leadership battle has raised risks surrounding the Bank of England's independence, which could undermine the pound further analysts at Rabobank said.
''The UK Tory party leadership race has sparked comments from Foreign Secretary Truss that she may set limits to the BoE’s independence if she were PM. Insofar as Truss is in favour of large unfunded tax giveaway, this hints at government policy of loose fiscal and tight monetary conditions which would likely erode the Bank’s credibility and result in even more investors turning their backs on GBP.''
Meanwhile, the inflation data in the UK has surprised to the upside for June. Headline inflation rose to 9.4% YoY (consensus: 9.3%) from 9.1% in May, with core inflation easing slightly to 5.8% from 5.9%. The consensus is that inflation will continue rising in the UK over the coming months. The firmness in inflation combined with ongoing tightness in the labour market will mean that the BoE will have to raise rates aggressively, despite the elevated risk of recession. The markets are pricing in a move of 50bp to 1.75% in August, followed by 25bp hikes in subsequent meetings, with the policy rate peaking at 2.5% by December.
- The USD/CHF cuts some of its weekly losses, from 1.37% to 0.70%.
- US equities fluctuate, reflecting investors’ mixed sentiment, courtesy of Google’s halting hiring.
- USD/CHF Price Analysis: A break above 0.9800 would open the door toward 0.9900.
The USD/CHF bounces from weekly lows around 0.9650s, trimming some of its weekly losses and rises towards the 50-day moving average (DMA) around 0.9726, courtesy of fragile market sentiment, swinging between risk on/off, during the New York session. At the time of writing, the USD/CHF is trading at 0.9722, up 0.49%.
USD/CHF Price Analysis: Technical outlook
During the Asian session, the USD/CHF began trading around 0.9678, near the daily lows. Later, the major climbed steadily, breaking the daily pivot point resistance level at 0.9710 and the 50-hour SMA at 0.9715, on its way towards the daily high at 0.9736.
USD/CHF Daily chart
The USD/CHF is upward biased, despite exchanging hands below the 50-day moving average (DMA) at 0.6721. On Tuesday, the USD/CHF pair encountered bids just above the 61.8% Fibonacci retracement, as the major retraced nearly 100 pips daily, hitting a daily low of 0.9654, nine pips above the Fibonacci level. As buyers stepped in, the major broke above the 50% Fibonacci retracement and is facing solid resistance around the July 18 daily low at 0.9730.
Therefore, the USD/CHF first resistance would be 0.9730. A breach of the latter will expose the July 19 daily high at 0.9786, followed by 0.9800. Once cleared, a re-test of the July 14 swing high at 0.9886 is on the cards.
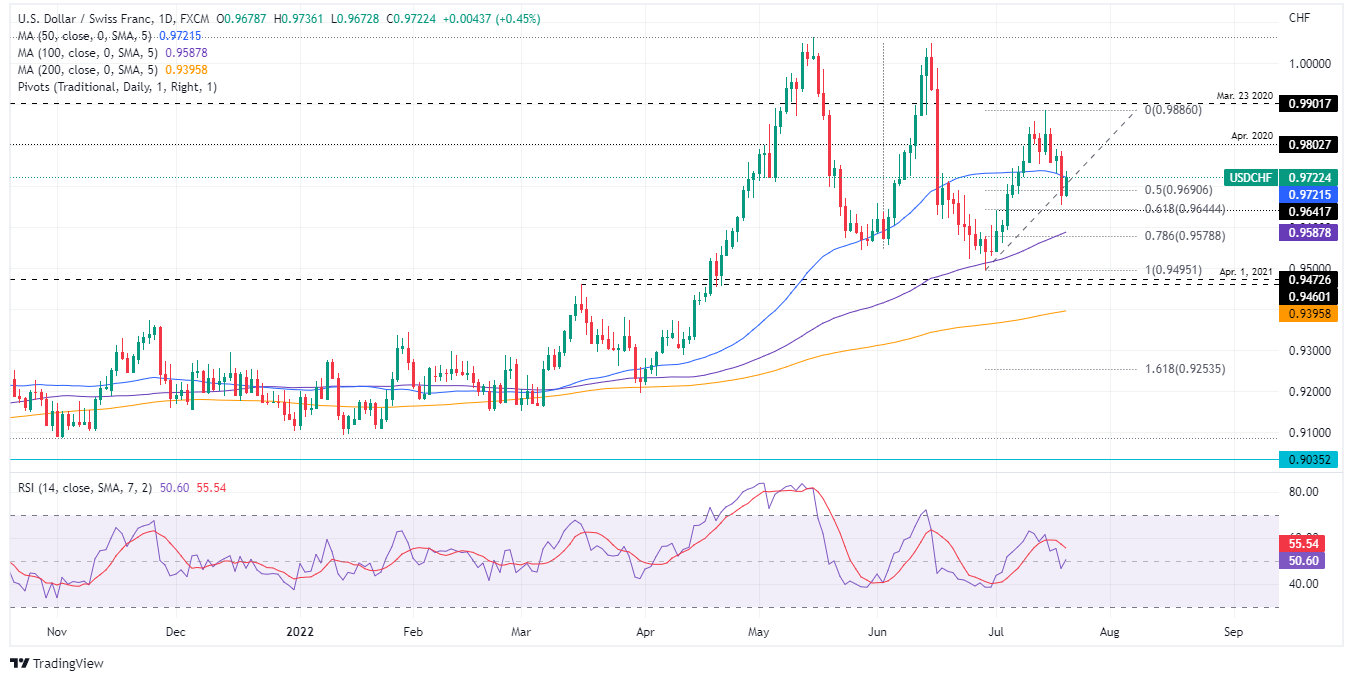
USD/CHF Key Technical Levels
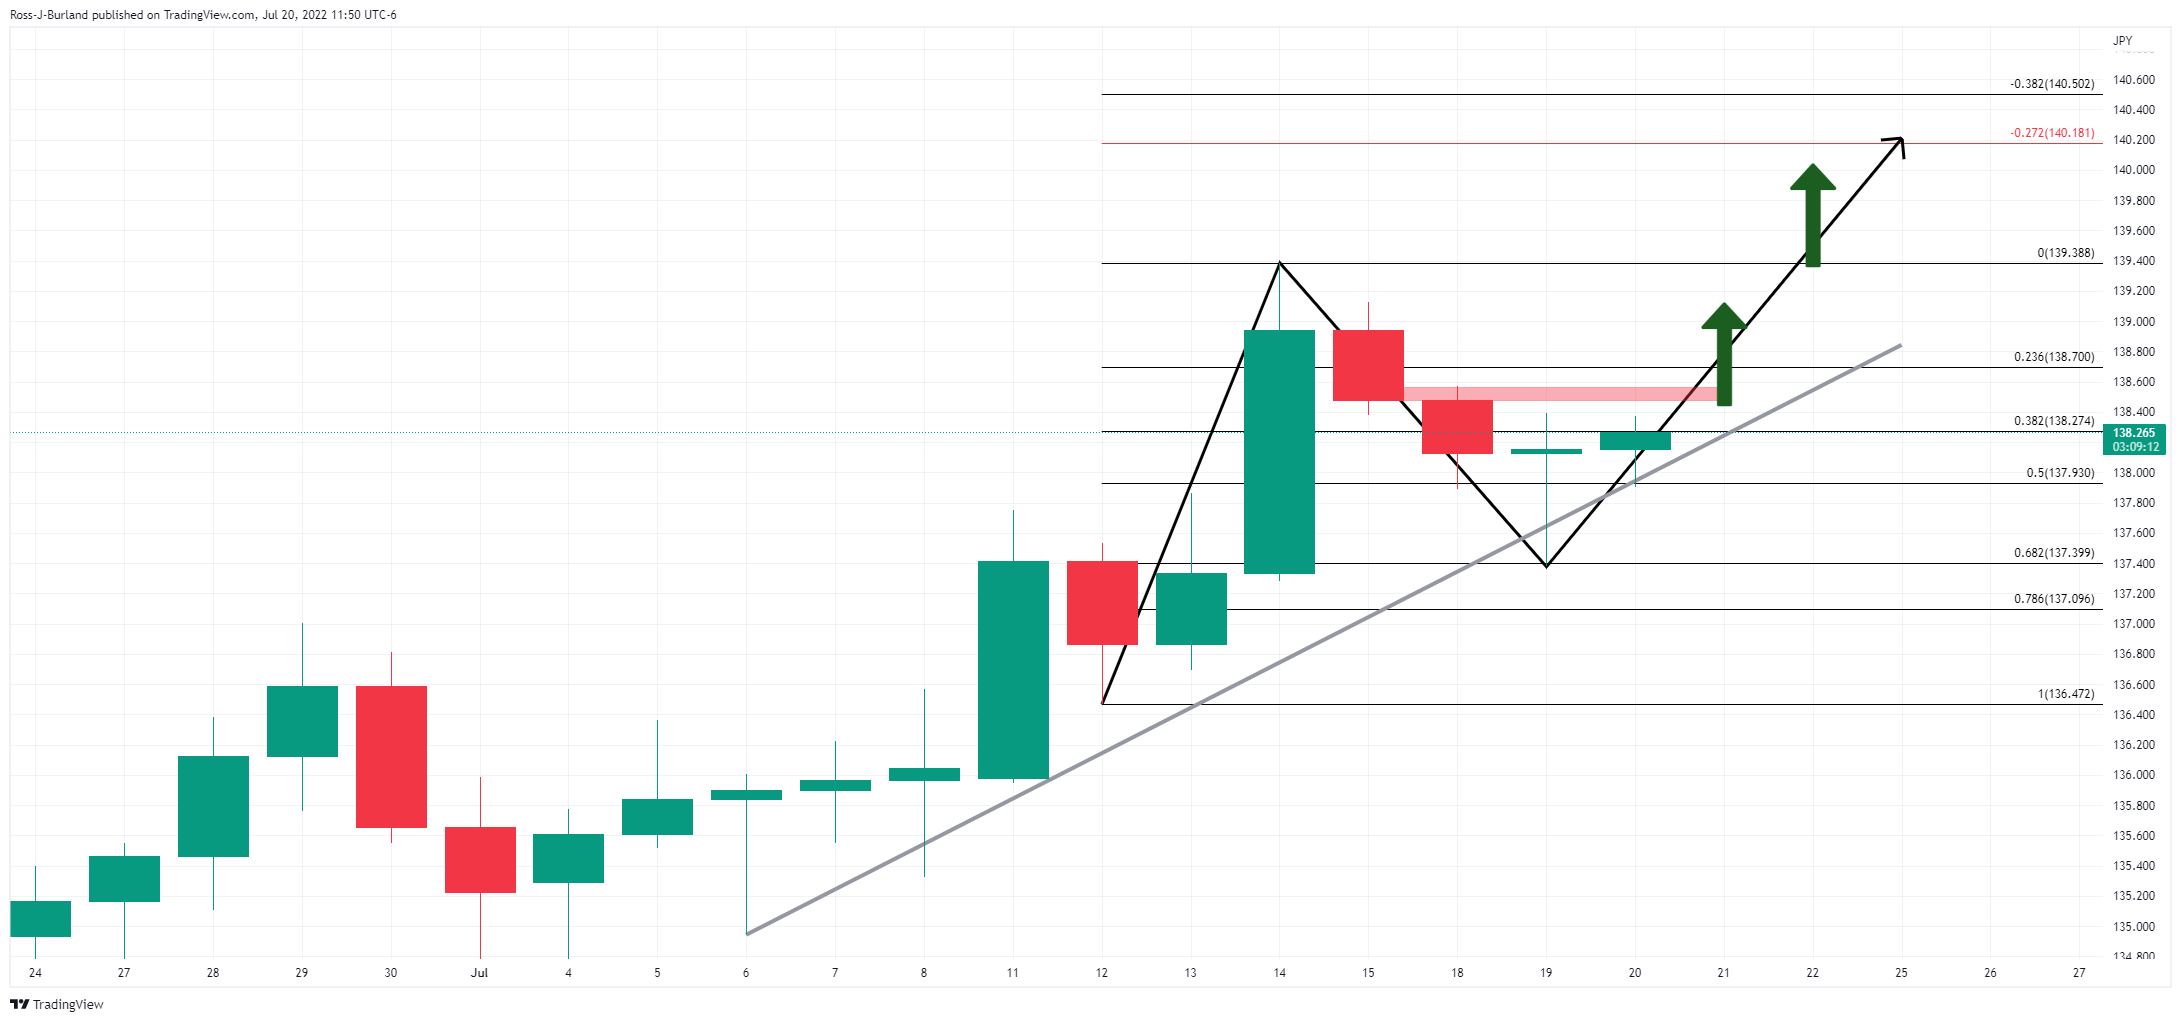
- USD/JPY could be on the verge of a bullish breakout.
- Bears have been giving way to the bulls on the daily chart.
USD/JPY is carving out a bullish scenario on both the hourly and daily time frames and the following illustrates the potential for a bullish breakout and bull daily extension for the days ahead.
USD/JPY H1 chart
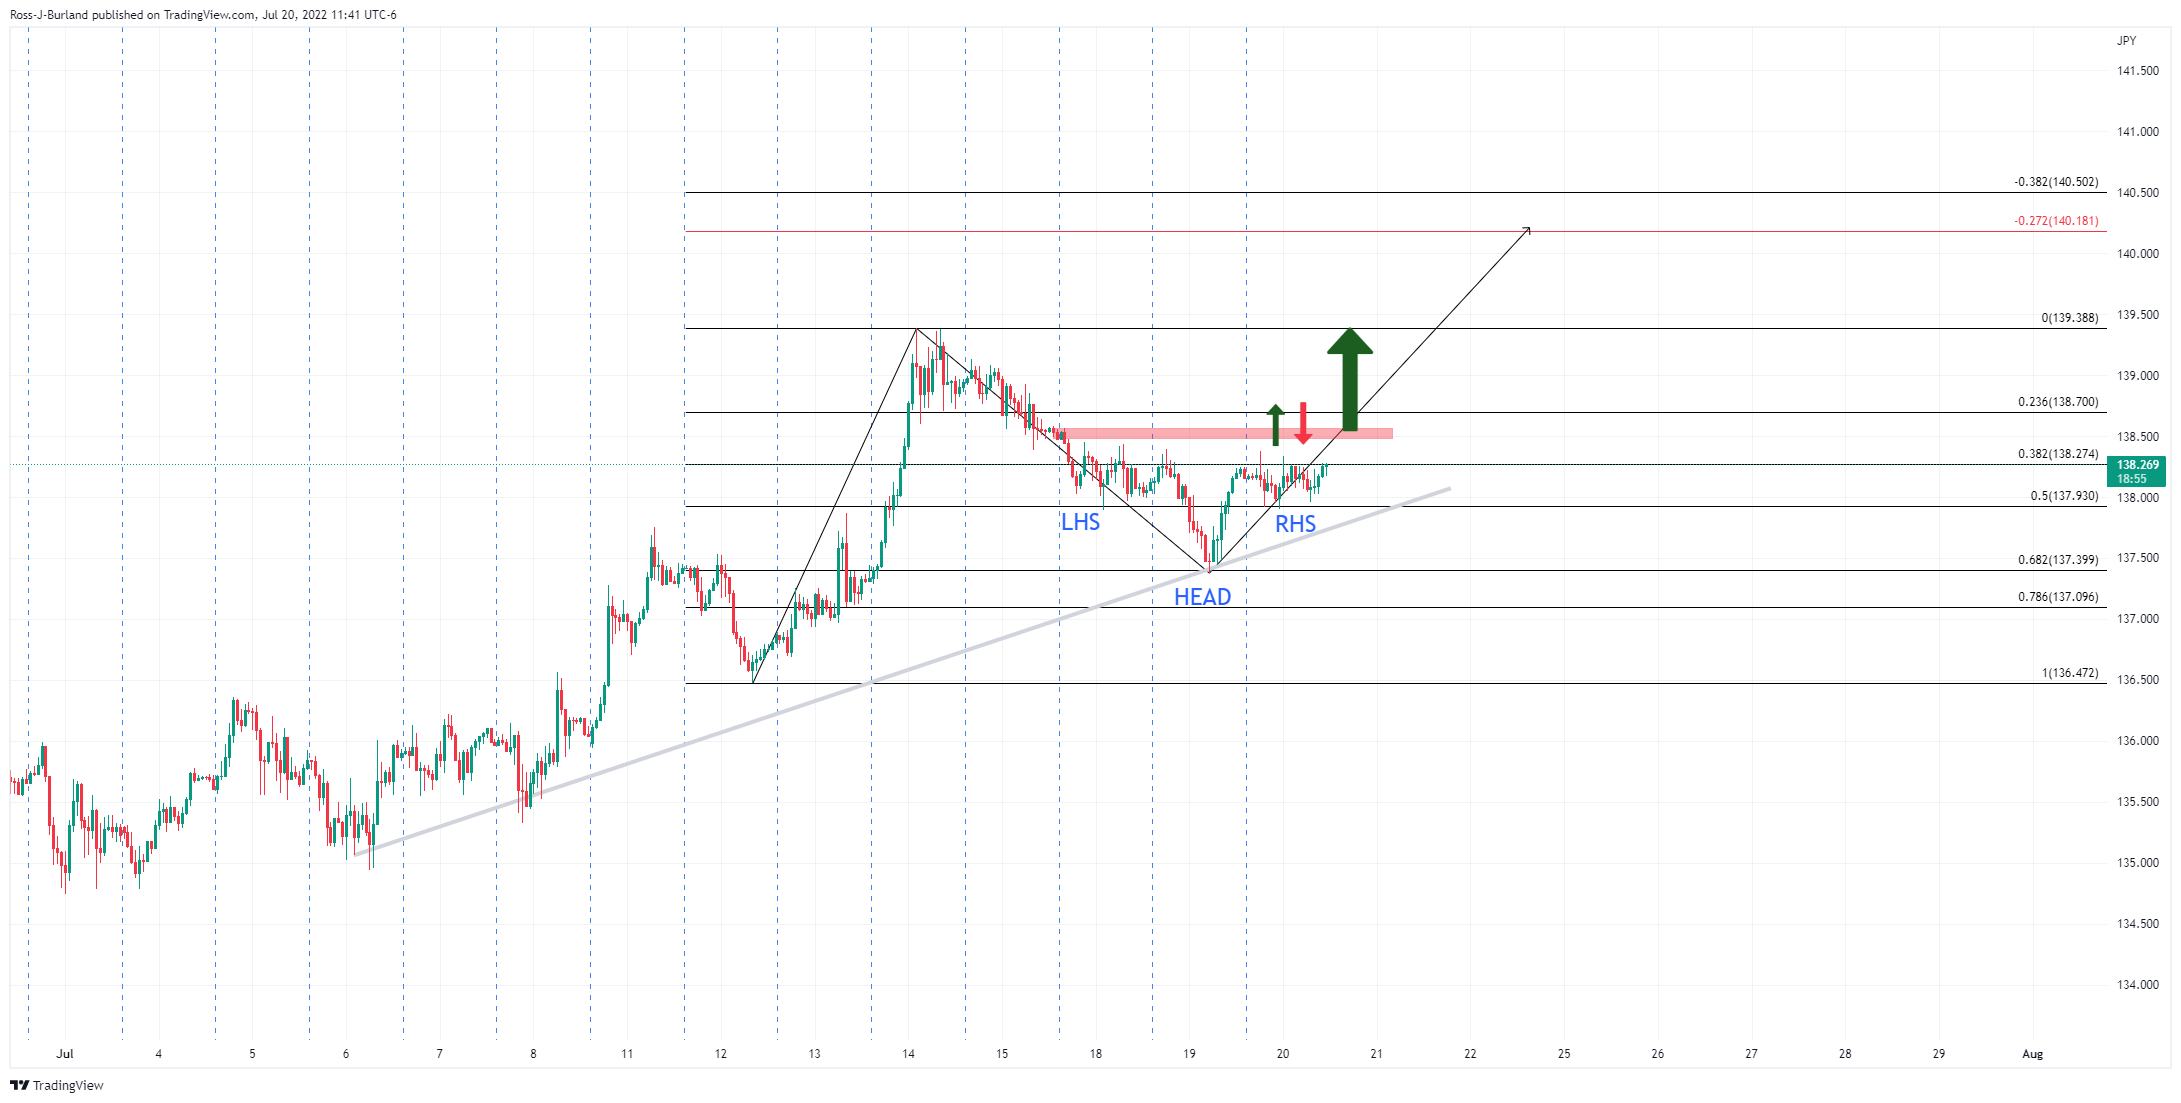
From an hourly perspective, USD/JPY is forming an inverse head and shoulders. On a break above the neckline around 138.50 and at what would be presumed to be a level of interest given how this area acted as the last stop before the continuation of the sell-off, the upside will be favourable. If this area holds as support on initial tests, then a daily extension could come into play:
USD/JPY daily chart
As illustrated, the daily chart has made a correction to the 61.8% Fibonacci area that has a confluence with prior highs. This could be critical support for the pair and if the hourly chart's bullish scenario plays out, then the bulls will be in the running for a significant move to the upside, potentially charting a fresh daily extension of the bullish cycle.
Italian Prime Minister Mario Draghi asked on Wednesday for the upper house Senate to hold a confidence vote that will effectively decide if his coalition government stays in office. Draghi indicated he was willing to stay on as prime minister if his feuding coalition partners could guarantee “sincere and concrete support” for him to continue.
However, two lawmakers from different parties confirmed to CNBC that Lega, Forza Italia and M5S are to boycott the confidence vote which leaves the government on the cusp of collapse and leading to an early election, regardless that the prime minister won the Senate Confidence motion. Draghi previously said he would not continue without the support of coalition partner the Five Star Movement.
This will plunge Italy into months of upheaval and weigh on the euro and Italian and eurozone bonds at a time of soaring inflation and war raging on the euro bloc's doorstep.
This comes ahead of Thursday's European Central Bank meeting while heated inflation risks have already seen money markets punting for a half-point hike. The uncertainty over Italian politics as well as the concerns that Moscow may not resume the flow of gas through the Nord Stream pipe as scheduled, or tightly curbed flows, will indeed be a cloud over the ECB event.
- The EUR/JPY buyers’ failure at weekly highs left the euro vulnerable to selling pressure.
- Sentiment shifted to mild-risk-off on Google news, and the Italy government is about to collapse.
- EUR/JPY Price Analysis: Sellers regained control around 142.00; if the ECB fails to deliver, expect further downside below 140.00.
The EUR/JPY nosedives from two-week highs, erasing almost 50% of its weekly gains, and tumbles towards the 20-day EMA at 140.50, as sellers are eyeing a break before the ECB’s monetary policy decision on Thursday. Also, a mixed market mood increased safe-haven appetite, such as the Japanese yen, which strengthened by almost 0.50% vs. the euro. At the time of writing, the EUR/JPY is trading at 140.48.
EUR/JPY Price Analysis: Technical outlook
The EUR/JPY opened near the highs of the day, shy of the 141.50 area, though later, the cross pushed towards the R1 daily pivot, short of the 142.00, sellers stepped in, sending prices tanking below the daily pivot, at 140.59, before entering a sideways range. Nevertheless, geopolitical news regarding Italy’s government about to collapse opened the door for further downside pressure, hitting a fresh daily low at 140.42.
EUR/JPY 1-hour chart
The EUR/JPY 1-hour chart depicts the cross-currency breaking below an ascending channel, which opens the door for further selling pressure. Although the EUR/JPY might find some bids around the confluence of the S1 daily pivot and the 100-hour EMA around 140.15-25, it could not deter sellers from applying further pressure as the euro’s outlook continues to deteriorate.
Therefore, the EUR/JPY next support would be 140.00, followed by July 18 low around 139.69, not that close to 139.50, before resuming towards the 139.00-20 area, surrounded by the 200-hour EMA and the S2 daily pivot.
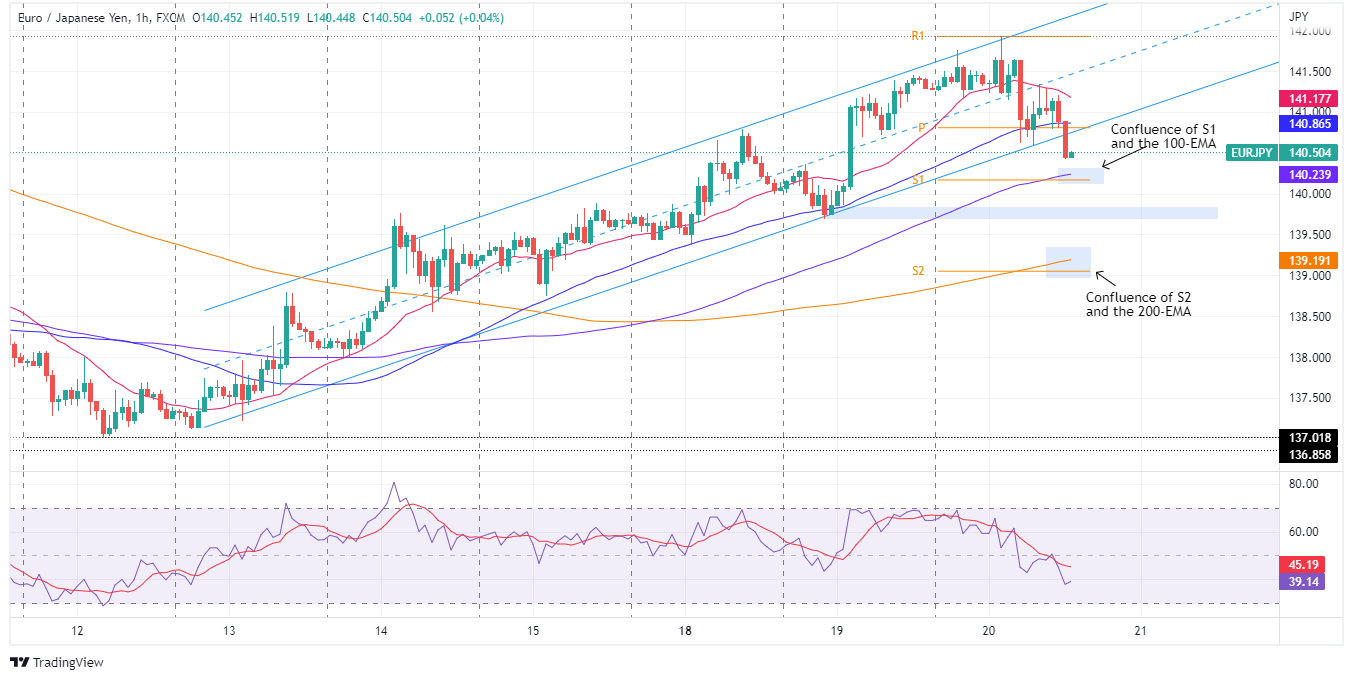
EUR/JPY Key Technical Levels
- NZD/USD climbed towards 0.6270s but erased gains of 50 pips as sentiment dampened.
- US recession fears loom amongst investors as the housing market keeps cooling further.
- NZD/USD Price Analysis: The major faces solid resistance despite breaking upwards of a falling wedge.
On Wednesday, the NZD/USD hit a new three-week high at 0.6272, but it is retreating as market sentiment shifted sour on news that Google would follow Apple’s path and might halt hiring for two weeks.
The NZD/USD opened near the session’s lows around 0.6220s but advanced firmly during the Asian and European sessions towards the weekly highs before tripping down, tumbling to the day’s low. At the time of writing, the NZD/USD is trading at 0.6224, barely up 0.05%.
The US housing market show signs of a slowdown
Recession fears could reignite due to worst than expected housing data. Earlier, US Existing Home Sales dropped to two-year lows levels and shrank by 5.4%, missing expectations of 5.4%. Although it is the fifth straight decline, higher interest rates might not stop the fall in the near term. Additionally, on Tuesday, Housing Starts and Building Permits acted as leading indicators for existing sales, contracting 2% and 0.6%, respectively.
In the meantime, the New Zealand economic docket reported the Global Dairy Trader Price Index at -5% vs. -4.1% the previous month, which NZD/USD traders mainly ignored.
Therefore, the NZD/USD outlook looks brighter for the greenback, even though US housing data shows contraction, which could be an optimistic scenario for the greenback. Why? Because the US dollar, throughout recessions, has risen. Additionally, commodity prices tend to drop through those periods due to falling demand, a headwind for the New Zealand dollar.
What to watch
The New Zealand docket will feature June’s Balance of Trade, alongside Imports and Exports. On the US front, the Philly Fed Manufacturing Index, Initial Jobless Claims, and the CB Leading Index.
NZD/USD Price Analysis: Technical outlook
From a technical perspective, the NZD/USD is downward biased, despite breaking a falling wedge, alongside trading above the 20-day EMA. Nevertheless, the NZD/USD price action is forming a gravestone doji preceded by an uptrend, meaning that sellers stepped in, putting a lid on prices, so the NZD/USD might consolidate in the near term.
The NZD/USD’s resistance levels would be July’s 20 high at 0.6272, followed by 0.6300, and then the 50-day EMA At 0.6314. On the flip side, the NZD/USD first support would be 0.6200. Break below will expose the 20-day EMA at 0.6195, followed by 0.6100.

So far, during the week the EUR/USD pair traded above 1.0000. Analysts at MUFG Bank expect the pair to revisit levels back below parity again considering the natural gas supply uncertainty, the probable resignation of Italian PM Draghi and the implications for fragmentation risks and the very cautious approach to monetary tightening by the ECB. They see EUR/USD trading in the 0.9800-1.0500 range over the next weeks.
Key Quotes:
“While the US economy looks to be slowing as rate hikes begin to impact sentiment in housing activity, the Fed looks set to hike by 75bps next week which will provide support for the dollar. Only when the FOMC clearly signals a change in policy approach by pausing its tightening cycle will the dollar turn weaker.”
“The US rate market is still expecting more front-loaded Fed tightening. The Fed is now expected to deliver two more 75bps hikes in July and September before slowing the pace of hikes in November and lifting the policy rate to a peak of 3.50% by year end.”
“The main upside risk to our bearish EUR/USD bias could be triggered by a paring back of energy supply concerns in Europe. The EUR would receive a lift if natural gas supply from Russia returns to more normal levels after the NordStream 1 pipeline maintenance period comes to an end. The EUR could be boosted as well by more decisive policy action from the ECB. A combination of a larger 50bps hike this month and convincing plans to keep a lid on fragmentation risk would create a more supportive environment for the EUR especially if snap elections in Italy are avoided as well.”
- AUD/USD reached a two-week high around 0.690 but tumbled as the mood remains mixed.
- During the week, US housing data shows the impact of higher US interest rates.
- AUD/USD Price Analysis: The upward break rising wedge opens the door towards 0.7000; otherwise, a fall to 0.6800 is on the cards.
The AUD/USD snaps three days of gains during the North American session, retreating from three-week highs around 0.6930 after opening around the 0.6880s area before hitting the latter.
However, during the last hour, the AUD/USD slipped below the 0.6900 figure after US housing data showed a deceleration in the housing market, meaning that recession fears are lingering in traders’ minds. At the time of writing, the AUD/USD is trading at 0.6889, almost flat, amidst a mixed market mood, which augmented the appetite for safe-haven peers.
US housing data show signs of an economic slowdown
During the week, US housing data has started showing higher interest rates. On Tuesday, Housing and Building Permits showed a contraction in the housing market, each by 2% and 0.6%, respectively. Further fueling recession fears are Existing Home Sales, which also dropped by 5.4%, reaching a two-year level, falling off the cliff, vs. expectations of a 5.4% growth.
In the meantime, during the Asian session, the Reserve Bank of Australia (RBA) Governor Philip Lowe crossed newswires. Lowe said that further interest rate hikes are needed while stating that the bank needs to “chart a credible path back to 2-3%” inflation, in which unemployment persists at lows while the economy grows. Lowe’s raised rates by 125 bps since May, and some analysts expect the RBA will move to the newest threshold of 75 bps in the August meeting.
All that said, a stagflationary scenario in the US would bolster the greenback’s appetite. But, also, an aggressive RBA might refrain AUD/USD traders from opening aggressive short positions in the near term.
AUD/USD Price Analysis: Technical outlook
AUD/USD buyers have achieved what they expected: an upside break of a falling wedge, which propelled the major above the 0.6900 threshold for a 150 pip gain from the break level around 0.6785 to the weekly high at 0.6930. Nevertheless, the pair remains downward biased from a medium to long-term perspective, despite that the 20-day EMA gave way to buyers.
Upwards, the AUD/USD will face resistance at the 0.6900 figure, followed by the 50-day EMA at 0.6970 and the triple-zero at 0.700. figure. On the downside, the AUD/USD’s next support level would be the 20-day EMA at 0.6838, followed by the 0.6800 mark.
- Silver spikes on Wednesday to $19.09, lacks follow-through buying.
- A steady and vulnerable XAUUSD not helping XAGUSD.
- Consolidation above $19.00 could trigger more gains, key resistance at $19.50.
Silver is marginally higher on Wednesday. It climbed to $19.09 but only to gave up all gains a few minutes later by pulling back to $18.80 during the American session.
The US dollar has stabilized, not helping metals. Also gold remains steady, and still looking vulnerable, near $1700/oz. A break under that psychological are could drag silver to the downside.
From a technical perspective, the XAGUSD remains unable to make a clear break of the $19.00 mark. The spike was taken as an opportunity to sell it. If price rises and holds above $19.00 it could strengthen for a test of the critical resistance area of $19.40-$19.50.
Technical indicators offer no clear signs. The RSI and Momentum are flat. Price is holding above the 20 Simple Moving Average in the four-hour chart and also above a short-term downtrend line. A slide under $18.75 should change the intraday bias to bearish. If XAGUSD drops further, the $18.55 zone emerges as the next support, followed by $18.45, the last defence to the year-to-day low near $18.15.
Silver 4-hour chart
Data released on Wednesday showed inflation in Canada rose to 8.1% (annual), the highest level in decades. Analysts at RBC Capital Market point out that inflation growth may be close to peak. They point out energy prices drove most of the increase from May, but food prices are also still rising.
Key Quotes:
“About half the increase in the year-over-year CPI growth rate came from higher gasoline prices alone, but food prices continued to surge (up 8.8% year-over-year to match the increases in the prior two months). There have been more signs recently that global inflation pressures may be near their peak.”
“The pullback in home resale prices in recent months is beginning to show up in lower home-buying costs – which were a major driver of price growth over the last year.”
“We continue to expect that headline inflation is close to its peak. But price growth is still too high, and won’t ease sustainably back to the Bank of Canada’s 1% to 3% target range until consumer demand slows substantially. We look for the BoC to hike the overnight rate to 3.25% by October and for that to push the economy into a moderate contraction next year.”
- Gold price is stationary amidst the lack of a catalyst ahead of Fed’s July meeting.
- The US Dollar Index bounces off weekly lows, a headwind for precious metals.
- US housing data begins to show the impact of higher interest rates.
- XAUUSD to remain sideways, eyeing a YTD low around $1680, and to the upside $1750.
Gold price seesaws around the $1700 area, failing to break upwards/downwards as traders prepare for the Federal Reserve July meeting in the next week, amidst a mixed sentiment on Wednesday trading session. Ahead in the week, two central banks’ monetary policy meetings loom, namely the ECB and the BoJ, with the former to follow suit with other banks, with its first hike in 11 years, while the latter is the outlier, pledged to its dovish stance. At the time of writing, XAUUSD is trading at $1708.61.
Gold remains subdued, weighed by a buoyant US dollar
Global equities are mixed, augmenting demand for safe-haven assets. The greenback finally showed signs of life, a headwind for gold prices, with the US Dollar Index barely recovering some ground, up 0.11% at 106.788. Contrarily are US Treasury yields, tumbling across the curve. The US 10-year benchmark note rate is at 3.004%, drops two and a half bps, as traders seek safety towards cash and US Treasuries.
Also read: Gold Price Forecast: XAUUSD remains stuck in a range above $1,700, bearish potential intact
US housing data weighed by higher rates
Fed to hike 75 bps in July
Since Wednesday, the US housing market has begun to feel the pain of higher rates. On Wednesday, Housing starts shrank 2% in June, to their lowest level since September, while Building Permits decreased by 0.6%, both readings on monthly figures. That reflects the aggressive path the Fed has taken, as they have expressed their commitment to tame inflation, even if it means slower economic growth than expected. Of late, US Existing home sales contracted to a two-year low, by 5.4%, exceeding the expectations of a 5.4% growth. That said, recessionary signals are beginning to show in the US, which could increase the appetite for XAUUSD, meaning higher gold prices lie ahead.
US Inflation grabbed the attention, but Retail Sales and Consumer Sentiment tempered Fed intentions of going 100 bps
Elsewhere, during the last week, US Retail Sales and the UoM Consumer sentiment exceeded estimations and tempered worries of a Federal Reserve hiking 100 bps at its July meeting, sparked by CPI topping above 9% YoY, further exacerbated by PPI above the 11% YoY threshold. Nevertheless, the University of Michigan Consumer Sentiment illustrated that consumer inflation expectations for a 5-year horizon fell from 3.1% to 2.8%, easing investors’ fears of a higher hike, which capped the ongoing gold downfall.
Last Wednesday, expectations of a 100 bps hike stood around 80%, but the CME FedWatch tool portrays a decrement to 30% chances while fully pricing in a 75 bps rate hike.
US recession fears linger in investors’ minds as the US 2s-10s yield curve stays inverted
The yield curve remains inverted for twelve days
Gold price will remain under pressure as the Fed keeps tightening. Nevertheless, the inversion of the US 2s-10-yield curve extends for twelve straight days, meandering around -0.217%, as traders’ fears about recession remain. Nonetheless, unless Fed policymakers express concerns about economic growth, that would not deter them from aggressive tightening. Consequently, if the Fed tightens too fast and is seen cutting rates, gold traders should be ready to take advantage of it.
Gold Price Analysis: Technical outlook
Gold price has been trading in a narrow $20 range since July 15, when US CPI data crossed the news wires. However, the XAUUSD outlook, from a technical perspective, is tilted to the downside, even though the Relative Strength Index (RSI), staying at oversold conditions during the last month, suggests that the XAUUSD price should bounce up.
Therefore, due to XAUUSD trading in a range, to the upside, its first resistance would be July 18 high at $1723.85. A decisive break will send the XAUUSD price towards July 6 daily low-turned-resistance at $1732.36, followed by $1750. On the downside, XAUUSD’s first support would be $1700. Break below will expose the August 9, 2021 swing low at $1681.95, followed by the 2021 year low at $1676.91.
Gold halts decline, but bearish risks still intact
- US stocks turn positive after opening bell, dollar weakens.
- A quiet session so far across financial markets.
- GBP/USD fails to break 1.2030/40 and retreats to 1.1955.
The GBP/USD pair is hovering around 1.2000, around the same level it closed on Tuesday. Cable bottomed on European hours at 1.1954 and then rebounded to the 1.2000 area.
For the third consecutive day, GBP/USD failed to break the 1.2030/40 area and weakened. The current tone favors a correction that could face support at 1.1950 and 1.1920.
In the short-term, if cable rises above 1.2010 it would gain support. While under 1.2040, gains seem limited. A consolidation above should clear the way to 1.2100.
Inflation in UK and US home prices keep rising
Earlier on Wednesday, inflation data in the UK showed the annual CPI rate rose to 9.4%, above the 9.3% of market consensus, hitting the highest level in 40 years. The numbers did not trigger a reaction in the pound. A 50 basis point from the Bank of England at the August meeting is fully priced in. “Looking ahead, the swaps market is pricing in 175 bp of tightening over the next six months that would see the policy rate peak near 3.0%, followed by a steady rate in the subsequent 6 months and then the start of an easing cycle over the following 12 months”, explained analysts at BBH.
Regarding the Tory rate, Penny Mordaunt has been knocked out of the Conservative leadership contest in the final round, leaving Rishi Sunak and Liz Truss in the run-off. PM Boris Johnson faced his final PMQ at the Parliament that goes on summer recess. The next prime minister will be announced early in September.
In the US, Existing Home Sales dropped in June to 5.12M (market consensus: 5.38M), the fifth decline in a row amid higher interest rates. The report showed the median existing-home price reached a new record in June, at $416K.
The US dollar is posting mixed results. The DXY is up 0.15%, amid higher US yields. Still, the greenback holds onto recent losses. Market participants await next week’s FOMC meeting.
Technical levels
Following Wednesday's voting, Penny Mordaunt has been knocked out of the Conservative leadership contest, leaving Rishi Sunak and Liz Truss to face each other in the run-off to replace Boris Johnson.
The winner of the final round is expected to be announced on Monday, September 5, following a postal ballot completed by 160,000 Tory party members.
Market reaction
This development doesn't seem to be having an impact on the British pound's valuation. As of writing, GBP/USD was trading flat on the day at 1.1995.
The International Monetary Fund (IMF) announced on Wednesday that it lowered its growth forecasts for Germany to 1.2% for 2002 and to 0.8% for 2023. In its previous forecast, the IMF was expecting the German economy to grow by 2% in both years.
"Uncertainty is very high, with risks to the baseline growth forecast skewed downward and risks to the inflation forecast skewed upward," the fund said in a statement, per Reuters. "The greatest threat is a persistent shut-off of the remaining Russian gas exports to Europe."
The IMF also revised its 2022 inflation forecast for Germany to 7.7% from 6.5% previously.
Market reaction
This report doesn't seem to be having a noticeable impact on the shared currency's performance against its rivals. As of writing, the EUR/USD pair was posting small daily losses at 1.0218.
- Existing Home Sales in the US fell sharply in June.
- US Dollar Index continues to fluctuate below 107.00.
Existing Home Sales in the US declined for the fifth straight month in June to a seasonally adjusted annual rate of 5.12 million, the National Association of Realtors reported on Wednesday. Sales were down 5.4% and 14.2% on a monthly and yearly basis, respectively.
Further details of the report revealed that the median price for Existing Home Sales rose by 13.4% from one year ago to $416,000, marking a new all-time high.
Market reaction
These figures don't seem to be having a significant impact on the dollar's performance against its rivals. As of writing, the US Dollar Index was posting small daily gains at 106.80.
- USD/JPY failed near the 100-hour SMA on Wednesday, though the downside remains cushioned.
- The overnight breakout through a descending trend-channel resistance favours bullish traders.
- Traders seemed reluctant and moved to the sidelines ahead of the BoJ meeting on Thursday.
The USD/JPY pair struggled to capitalize on the previous day's goodish bounce from the 137.40-137.35 confluence support and attracted some sellers near the 100-hour SMA on Wednesday. The pair remained on the defensive through the early North American session and was last seen trading around the 138.00 mark, just a few pips above the daily low.
A sharp intraday fall in the US Treasury bond yields resulted in the narrowing of the US-Japan rate differential. This, along with the cautious market mood, benefitted the safe-haven Japanese yen and acted as a headwind for the USD/JPY pair. The downside, however, remains cushioned, at least for now, amid a modest US dollar bounce from a two-week low.
Apart from this, a big divergence in the monetary policy stance adopted by the Bank of Japan and the Federal Reserve helped limit the downside for the USD/JPY pair. Investors also seemed reluctant to place aggressive bets and preferred to wait on the sidelines ahead of the BoJ policy decision, due to be announced during the Asian session on Thursday.
Looking at the technical picture, Tuesday's intraday rally of over 100 pips lifted the USD/JPY pair beyond a resistance marked by the top end of a short-term descending channel. Given the recent strong move up, the said channel constituted the formation of a bullish flag pattern and supports prospects for a further near-term appreciating move.
The technical set-up seems tilted firmly in favour of bullish traders, suggesting that any intraday downtick could still be seen as a buying opportunity. Some follow-through buying beyond the 100-day SMA resistance, currently around the 138.35 region, will reaffirm the constructive outlook and allow the USD/JPY pair to aim back to reclaim the 139.00 mark.
On the flip side, the 200-hour SMA, currently around the 137.70 region, now seems to protect the immediate downside ahead of the overnight swing low, around the 137.40-137.35 area. The latter coincides with the 38.2% Fibonacci retracement level of the 134.25-139.39 rally, which if broken would expose the descending channel support, around the 137.00 mark.
Failure to defend the aforementioned levels, leading to a subsequent break below the 136.80 horizontal support, would negate the near-term positive outlook and shift the bias in favour of bearish traders. The USD/JPY pair might then extend the corrective slide from a 24-year high, around the 139.40 region touched last week, and challenge the 136.00 round figure.
USD/JPY 1-hour chart
-637939220030692880.png)
Key levels to watch
Assessing the latest inflation data from Canada, economists at TD Securities think that the downside surprise on Consumer Price Index (CPI) should take some pressure off the Bank of Canada.
We will continue to watch risk assets
"Headline CPI surprised to the downside with an 8.1% print in June, falling short of the market consensus for 8.4%, with prices up 0.7% m/m. Details revealed a sharp deceleration in rents and food prices, although positive revisions to May left the average of the BoC's core inflation measures sitting at a new high of 5.0% y/y."
"We would not interpret this as a soft print, but the BoC should be relatively pleased to see inflation miss to the downside after the last few months. However, with inflation continuing to firm on a year-ago basis we do not expect the Bank to take its foot off the gas too much ahead of the September policy decision, especially with core inflation continuing to grind higher."
"FX: The downside surprise on CPI should take some pressure off the BoC but we don't see it moving the needle for CAD. We will continue to watch risk assets, with CAD the most correlated to equities across the FX complex."
According to analysts from Danske Bank” “The risk of a complete Russian gas cut-off is looming ever more acute in Europe. If Gazprom does not resume gas transmissions through North Stream 1 after the annual maintenance ends on July 21st, the risk of forced demand adjustment and a recession in Europe grows significantly.”
Additional Quotes
“Officials have estimated that the EU could replace up to 70% of Russian gas imports by increasing LNG shipments and pipe imports from other regions, green gas, renewables, and by reducing demand. This means that app. 1/3 of the Russian imports cannot be substituted easily in the short-term.”
“If gas flows from Russia stop completely, governments are likely forced into emergency measures such as energy rationing. In that case, households' energy needs will be prioritised over industries, and businesses operating e.g. in chemical, metal and cement industries particularly, could be forced to halt production.”
“Acute energy shortages and elevated energy prices will weigh on all European consumers over the coming winter, but households in Germany, Italy, Netherlands and Belgium are the most exposed. But, as European electricity markets are inter-connected, electricity prices will also be high in countries where direct use of gas is limited such as the Nordics.”
- EURUSD price retreated from a two-week high touched earlier this Wednesday.
- The emergence of some USD buying was seen as a key factor exerting pressure.
- Some repositioning ahead of the ECB on Thursday contributed to the pullback.
EURUSD price witnessed an intraday turnaround from the 1.0275 area, or a two-week high touched earlier this Wednesday and for now, seems to have snapped a three-day winning streak. The pair extended its descent through the early North American session and dropped to the 1.0175-1.0170 area, or a fresh daily low in the last hour.
Renewed USD buying prompted some selling
The US dollar made a solid comeback and recovered a part of this week's heavy losses to its lowest level since July 6, which, in turn, prompted some selling around the EURUSD pair. Investors still seem convinced that the recent surge in US consumer inflation to a four-decade high would force the Fed to deliver a larger rate hike later this year. Adding to this, a slight deterioration in the risk sentiment - as depicted by a modest fall in the equity markets - assisted the safe-haven USD to stall its recent pullback from a two-decade high.
ECB uncertainty exerted additional pressure
The shared currency was further pressured by some nervousness going into the European Central Bank meeting on Thursday. Market players remain divided over the possibility of a 50 bps rate hike by the ECB amid growing recession fears. It is worth recalling that a Reuters story on Tuesday suggested that the ECB will discuss whether to raise interest rates by 25 bps or 50 bps to control record-high inflation. Investors, however, remain concerned that a halt to gas flows from Russia could trigger an energy crisis in the Eurozone and curtail the ECB's ability to raise rates further.
Russia to restart gas exports from Nord Stream 1
Russian gas flows via the Nord Stream 1 pipeline reportedly will resume on time on Thursday after the completion of scheduled maintenance but at lower than its full capacity. Two Russian sources familiar with the export plans told Reuters that the gas supply would be at less than its full capacity of some 160 million cubic metres (mcm) per day. This comes after the Wall Street Journal reported that the European Commission did not expect the pipeline to restart and might have eased some of the market concerns, which should lend support to the euro.
Focus remains on ECB decision
The ECB monetary policy decision on Thursday will play a key role in driving the near-term sentiment surrounding the common currency and provide a fresh directional impetus to the EUR/USD pair. Heading into the key event risk, traders might refrain from placing aggressive bets and prefer to wait on the sidelines. This could further help limit any meaningful downfall for the EUR/USD pair, warranting some caution before positioning for any further depreciating move.
EURUSD price technical outlook
EURUSD price stalled its recent corrective bounce from the lowest level since December 2002 near a resistance marked by the top boundary of a short-term descending channel extending from late May. The mentioned barrier, around the 1.0275-1.0280 region, is closely followed by the 1.0300 round-figure mark, which if cleared would be seen as a fresh trigger for bulls. The pair might then accelerate the momentum and aim to reclaim the 1.0400 round figure.
On the flip side, any subsequent downfall is likely to find some support near the 1.0150 area. Some follow-through selling would negate any near-term positive bias and make the pair vulnerable to breaking below the 1.0100 mark. The subsequent downfall would expose the parity market and the YTD low, around the 0.9950 region.
-637939191376126765.png)
EURUSD price: Key trading levels [Video]
- USD/CAD attracted some buying on Wednesday and moved away from a two-week low.
- Softer Canadian CPI report, sliding oil prices undermined the loonie and offered support.
- A goodish pickup in the USD demand further contributed to the modest intraday bounce.
The USD/CAD pair staged a modest bounce from the vicinity of mid-1.2800s, or a two-week low touched earlier this Wednesday and for now, seems to have snapped a three-day losing streak. The pair held on to its recovery gains following the release of Canadian consumer inflation figures and was last seen trading just above the 1.2900 mark during the early North American session.
Statistics Canada reported that the headline CPI decelerated sharply to 0.3% in June from the 1.4% previous, missing estimates by a big margin. The yearly rate, however, rose to its highest level since 1982 and came in at 8.1% for the reported month. The reading was well above the 7.7% recorded in May, though was slightly below the 8.4% estimates. More importantly, the Bank of Canada's Core CPI, which excludes volatile food and energy prices, rose 0.3% MoM in June and edged higher to 6.2% on a yearly basis, again well short of market expectations.
The softer CPI report might have dashed hopes for another supersized rate hike by the Bank of Canada. This, along with with a fresh leg down in crude oil prices, now down around 2% for the day, undermined the commodity-linked loonie and acted as a tailwind for the USD/CAD pair. Apart from this, a goodish intraday US dollar recovery from its lowest level since July 6 was seen as another factor that offered some support to the major. The uptick, however, lacked bullish conviction, warranting some caution before positioning for any meaningful appreciating move.
Technical levels to watch
Russian President Vladimir Putin said on Wednesday that they are yet to see in which condition the equipment for Nord Stream 1 will be after returning from maintenance, as reported by Reuters.
"There is a risk that equipment could be switched off and Nord Stream 1 stops after returning from Canada," Putin added.
Market reaction
These comments seem to be weighing on market sentiment with the Euro Stoxx 600 Index losing 0.3% on a daily basis. In the meantime, EUR/USD continues to trade in negative territory slightly below 1.0200.
- CPI inflation in Canada rose at a softer pace than expected in June.
- USD/CAD continues to trade below 1.2900 after the data.
Inflation in Canada, as measured by the Consumer Price Index (CPI), climbed to 8.1% on a yearly basis in June from 7.7% in May. This reading came in lower than the market expectation of 8.4%. On a monthly basis, CPI was up 0.7%, compared to analysts' estimate of 0.9%.
The Bank of Canada's Core CPI, which excludes volatile food and energy prices, edged higher to 6.2% in 12 months to June from 6.1% in May. This print fell short of analysts' forecast of 6.7%.
Market reaction
The USD/CAD pair showed no immediate reaction to these figures and was last seen posting small daily gains at 1.2885.
When asked about the prospect of holding peace talks with Ukraine, Russian Foreign Minister Sergey Lavrov said that it made no sense in the current situation, as reported by Reuters.
"If the west delivers long-range weapons to Kyiv, geographical objectives in Ukraine will be advanced even further," Lavrov told reporters earlier in the day.
Market reaction
Markets remain risk-averse following these comments and US stock index futures were last seen losing between 0.2% and 0.4% on a daily basis. Meanwhile, the US Dollar Index clings to modest daily gains near 107.00.
Canada CPI Overview
Statistics Canada will release the latest consumer inflation figures for June later during the early North American session on Wednesday, at 12:30 GMT. The headline CPI is expected to ease from 1.4% in May to 0.9% during the reported month. The yearly rate, however, is anticipated to surge to its highest level since 1982 and come in at 8.4% in June, up from 7.7% in the previous month. More importantly, the Bank of Canada's Core CPI, which excludes volatile food and energy prices, is estimated to rise 0.5% MoM in June and accelerate to 6.7% on a yearly basis from the 6.1% in May.
According to analysts at RBC Economics: “This continued acceleration was likely largely driven by higher food and energy prices – both of which have been boosted by global pressures. Oil prices rose another 4.8% from May and consumer food prices have been surging in part due to higher commodity prices and acute supply chain disruptions. Roughly half of inflation recently has been driven by forces beyond our borders by our count. Inflation pressures are unlikely to ease sustainably to the BoC’s 1% to 3% target range until the economy, and labour markets, have cooled substantially.”
How Could it Affect USD/CAD?
A stronger print would reinforce expectations that the Bank of Canada would continue raising interest rates more aggressively to cool demand and achieve the inflation target. This should be enough to provide an additional boost to the already stronger Canadian dollar and set the stage for a further near-term depreciating move for the USD/CAD pair.
Conversely, a softer reading - though seems unlikely - is likely to be overshadowed by the prevalent US dollar selling bias. This, in turn, suggests that the path of least resistance for the USD/CAD pair is to the downside. Hence, a subsequent slide below the 50-day SMA, towards the next relevant support near the 1.2830-1.2820 zone and the 1.2800 mark, looks like a distinct possibility.
On the flip side, any meaningful recovery attempt might now confront stiff resistance near the 1.2900 mark ahead of the 1.2925-1.2930 region. This is followed by the 1.2960 hurdle, which if cleared decisively could trigger a short-covering move and allow the USD/CAD pair to aim to surpass the 1.3000 psychological mark.
Key Notes
• Canadian CPI Preview: Forecasts from six major banks, inflation continued to heat up in June
• USD/CAD Analysis: Bears pause near 50-DMA/50% Fibo. confluence, focus shifts to Canadian CPI
• USD/CAD: 50 DMA guards the downside ahead of Canadian inflation
About Canadian CPI
The Consumer Price Index (CPI) released by Statistics Canada is a measure of price movements by the comparison between the retail prices of a representative shopping basket of goods and services. The purchasing power of CAD is dragged down by inflation. The Bank of Canada aims at an inflation range (1%-3%). Generally speaking, a high reading is seen as anticipatory of a rate hike and is positive (or bullish) for the CAD.
Economists at BBH note that the US Dollar Index is pushing higher on Wednesday after having tested the 50% retracement objective of its June-July rally near 106.48 on Tuesday.
50 bp hike might give euro a knee-jerk boost
"Despite reports of a possible 50 basis point (bp) move by the ECB tomorrow, the euro rally ran out of steam near 1.0275. We see four potential outcomes tomorrow, most of them euro-negative."
"Best case outcome for the euro would be a 50 bp hike and the announcement of an aggressive anti-crisis tool, while the worst case would be 25 bp and further delays to the tool."
"In between would be a 50 bp hike and no tool or a 25 bp hike and an aggressive anti-crisis tool. We think the best case outcome is highly unlikely (15%), as is a 25 bp hike and aggressive anti-crisis tool (15%). As such, we are left with the worst-case outcome (35%) and 50 bp hike with no tool (35%) as the most likely outcomes."
"While a 50 bp hike might give the euro a knee-jerk boost, the fact that the ECB cannot come up with a credible anti-crisis tool should eventually weigh on the single currency. "
Economists at TD Securities expect the European Central Bank to hike its key rates by 25 basis points (bps) and announce the new anti-fragmentation tool.
Move to 1.0340/00 in EURUSD risks being a fade
"The risk of a 50 bps hike has grown materially and is almost a coin toss: it is the sensible outcome to the meeting, but goes against recent communications."
"Rates: Risk to rates remains binary to the size of rate hike and details of the tool. We continue to hold a bearish view on the front end via paying EUR 1y1y vs. GBP 1y1y."
"FX: Buy the rumour, sell the fact. Markets should respect the risk for a 50bp 'surprise'. But in doing so, the ECB is pulling forward its limitations to tighten aggressively later in its cycle as energy constraints risk choking off domestic demand. A move to 1.0340/00 in EURUSD risks being a fade."
European Commission President Ursula von der Leyen said on Wednesday that it was a likely scenario that there could be a full cut-off of Russian gas, as reported by Reuters.
"Russia is blackmailing us. Russia is using energy as a weapon. And therefore, in any event, whether it's a partial, major cut-off of Russian gas or a total cut-off of Russian gas, Europe needs to be ready," von der Leyen told a news conference.
EU executive proposed that members could voluntarily lower their gas usage by 15% until March to ease the pressure.
Market reaction
These comments seem to be having a negative impact on market sentiment. As of writing, EUR/USD was down 0.3% on the day at below 1.0200 and the Euro Stoxx 600 Index was losing 0.2%.
- USD/CAD languished near a two-week low amid the prevalent USD selling bias.
- Softer crude oil prices could undermine the loonie and help limit the downside.
- Investors await the Canadian CPI report before placing fresh directional bets.
The USD/CAD pair edged lower for the fourth successive day on Wednesday and was last seen trading near a two-week low, just above mid-1.2800s during the first half of the European session.
The US dollar remained on the defensive amid receding bets for a massive 100 bps rate hike by the Federal Reserve on July 27. This, in turn, was seen as a key factor that continued acting as a headwind for the USD/CAD pair. That said, a modest downtick in crude oil prices undermined the commodity-linked loonie and could help limit losses for the USD/CAD pair. Investors might also refrain from placing aggressive bets ahead of the Canadian CPI report.
From a technical perspective, the 1.2850 area represents confluence support - comprising of 50-day SMA and the 50% Fibonacci retracement level of the 1.2517-1.3223 strong rally. This should now act as a key pivotal point for intraday traders and help determine the next leg of a directional move for the USD/CAD pair. Some follow-through selling should pave the way for a fall towards the 1.2830-1.2820 support en-route the 1.2800 round-figure mark.
A convincing break below the latter would be seen as a fresh trigger for bearish traders and make the USD/CAD pair vulnerable to accelerating the fall towards the 1.2700 mark. The downward trajectory could further get extended towards the next relevant support near the 1.2675-1.2665 horizontal zone.
On the flip side, any meaningful recovery attempt might now confront stiff resistance near the 1.2900 mark ahead of the 1.2925-1.2930 region. This is followed by the 38.2% Fibo. level, around the 1.2960 area, which if cleared decisively would suggest that the correction has run its course and pave the way for additional gains.
The USD/CAD pair might then aim to surpass the 1.3000 psychological mark and retest the 1.3075-1.3085 supply zone, coinciding with the 23.6% Fibo. level. The positive momentum could eventually lift spot prices back above the 1.3100 round-figure mark.
USD/CAD daily chart
-637939082066878459.png)
Key levels to watch
Economists at Citi Group said in a note on Wednesday, they see a 50% chance of a global recession and expect several major economies to slip into one in the next 12-18 months.
Key quotes
"On balance, our forecast sees the global economy skating through and avoiding a synchronized downturn.”
“Incoming recessions are seen to be "relatively mild".
"As good news, this softening of demand has eased pressures on supply chains and supported a retreat in global metals prices,” an element they see as deflationary.
Analysts at Australia and New Zealand (ANZ) Banking Group note that “Philippines’ revenue and expenditure both outperformed in the first five months of 2022.”
Additional takeaways
“We maintain our budget deficit forecast at 7.7% of GDP. A fiscal slippage of 0.1-0.2% of GDP may materialise if the revenue gains do not offset the supplementary spending requirements.”
“The ratio of revenue to GDP continues to deviate widely from its pre-pandemic trajectory. We underscore the significance of tax reforms if the government eyes to close that gap faster.”
“The new administration’s FY2023 budget will be capped at 22.2% of GDP, fairly in line with the 22.1% spending ceiling adopted by the Duterte administration. The path to fiscal consolidation is gradual, with the government trying to strike a balance.”
- Silver gained some positive traction on Wednesday, though lacked follow-through buying.
- The bearish setup supports prospects for the emergence of fresh selling at higher levels.
- Sustained strength beyond the $19.40-$19.50 region is needed to negate the bearish bias.
Silver edged higher on Wednesday, albeit lacked bullish conviction and remained below the $19.00 mark through the first half of the European session.
From a technical perspective, the XAG/USD, so far, has struggled to break through the 50-period SMA on the 4-hour chart. This makes it prudent to wait for strong follow-through buying before positioning for an extension of this week's bounce from the vicinity of a two-year high, around the $18.15 region touched last Friday.
Technical indicators, meanwhile, have just started gaining positive traction on the hourly charts, though remained deep in the bearish territory on the daily chart. This, in turn, suggests that any further move up might still be seen as a selling opportunity and fizzle out rather quickly near the $19.40-$19.50 supply zone.
On the flip side, the $18.50 horizontal zone now seems to protect the immediate downside ahead of the YTD low, around the $18.15 region. This is closely followed by the $18.00 mark, which if broken decisively would be seen as a fresh trigger for bearish traders and pave the way for an extension of the recent downward trajectory.
The XAG/USD might then accelerate the slide towards the $17.45-$17.40 intermediate support en-route the $17.00 round-figure mark. The bearish trend could further get extended and drag spot prices to the next relevant support near the $16.70-$16.60 region.
Silver 4-hour chart
-637939054530396396.png)
Key levels to watch
- Gold price gathers strength to retest 11-month troughs below $1,700.
- US dollar stalls correction as risk sentiment turns cautious ahead ECB, BOJ.
- XAUUSD faces a wall of resistance despite falling Treasury yields.
Gold price continues to mire in yearly troughs so far this week, lacking a clear directional bias amid repricing of the Fed rate hike expectations. Investors also refrain from placing any aggressive bets on the bright metal ahead of the ECB and BOJ monetary policy announcements. The BOJ is widely expected to stick to its ultra-loose monetary policy while the ECB may surprise markets with a 50 bps rate hike. More hawkish than expected ECB could weigh negatively on the non-interest-bearing gold price. Meanwhile, the lack of first-tier US macro data combined with the Fed’s ‘blackout’ period leaves the metal traders in search of a significant catalyst. Meanwhile, the XAUUSD price will remain at the mercy of risk trends, with the US earnings season underway.
Also read: Gold Price Forecast: XAUUSD remains stuck in a range above $1,700, bearish potential intact
Gold Price: Key levels to watch
The Technical Confluence Detector shows that the downside appears more compelling for Gold price, as it faces a wall of resistance should any recovery momentum pick up steam.
A dense cluster of healthy resistance levels is stacked up around $1,711, where the SMA10 four-hour, Fibonacci 61.8% one-day and Bollinger Band four-hour Middle coincide.
The next hurdle is seen at the Fibonacci 38.2% one-day at $1,714, above which bulls will need vigor to take out the confluence of the Fibonacci 23.6% one-day and 38.2% one-week at $1,716.
The previous day’s high of $1,719 will be the level to beat for XAU bulls.
Alternatively, strong support awaits at $1,704, which is the convergence of the pivot point one-day S1 and pivot point one-month S3.
The next relevant downside target is aligned at the previous week’s low of $1,698.
Further south, the pivot point one-day S3 at $1,693 will come to the rescue of gold buyers.
Here is how it looks on the tool
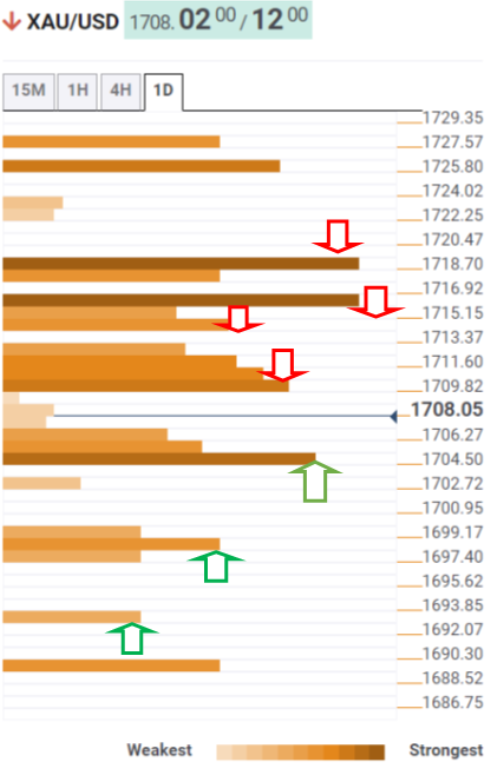
About Technical Confluences Detector
The TCD (Technical Confluences Detector) is a tool to locate and point out those price levels where there is a congestion of indicators, moving averages, Fibonacci levels, Pivot Points, etc. If you are a short-term trader, you will find entry points for counter-trend strategies and hunt a few points at a time. If you are a medium-to-long-term trader, this tool will allow you to know in advance the price levels where a medium-to-long-term trend may stop and rest, where to unwind positions, or where to increase your position size.
- USD/CHF gains some positive traction on Wednesday and reverses a part of the overnight slide.
- A generally positive risk tone undermines the safe-haven CHF and offers support to the major.
- Elevated US bond yields help the USD to stall its corrective pullback and provide a modest lift.
The USD/CHF pair attracts some buying on Wednesday and recovers a part of the overnight heavy losses to a two-week low. Spot prices are building on the steady intraday ascent through the early European session and have climbed to a fresh daily high, around the 0.9700 mark in the last hour.
Despite receding bets for a more aggressive tightening by the Fed, investors seem convinced that the US central bank will deliver a larger rate hike later this year to tame inflation. The speculations remain supportive of elevated US Treasury bond yields and will assist the US dollar to stall its recent corrective pullback from a two-decade high.
The idea of a massive 100 bps Fed rate hike move in July gained traction following the release of red-hot US consumer inflation figures, which accelerated to a four-decade high in June. Several FOMC members, however, pushed back against market expectations and signalled last week that they will likely stick to a 75 bps rate increase.
On the other hand, a generally positive tone around the equity markets undermined the safe-haven Swiss franc and offered some support to the USD/CHF pair. The uptick, however, lacked bullish conviction, warranting caution before confirming that the downfall from the 0.9885 region, or a multi-week high touched last Thursday, has run its course.
Market participants now look forward to the release of US Existing Home Sales data later during the early North American session. Apart from this, the US bond yields should influence the USD and provide some impetus to the USD/CHF pair. Traders will further take cues from the broader risk sentiment to grab short-term opportunities.
Technical levels to watch
- AUD/USD gained traction for the fourth straight day and climbed to a fresh monthly high.
- Receding bets for a 100 bps Fed rate hike in July weighed on the USD and extended support.
- Elevated US bond yields helped limit the USD losses and kept a lid on any further move up.
The AUD/USD pair built on its recovery move from the 0.6680 region, or over a two-year low touched last week and gained traction for the fourth successive day on Wednesday. Spot prices climbed to a fresh monthly high and held steady above the 0.6900 mark through the early European session.
Investors continued scaling back their expectations for a supersized Fed rate hike after several FOMC members said last week that they will likely stick to a 75 bps increase at the upcoming meeting. This was seen as a key factor behind the recent US dollar corrective pullback from a two-decade high, which, in turn, continued lending support to the AUD/USD pair.
Apart from this, a generally positive tone around the equity markets dragged the safe-haven buck to its lowest level since July 6 and benefitted the risk-sensitive aussie. The unsurprisingly hawkish Reserve Bank of Australia meeting minutes released on Tuesday further underpinned the Australian dollar and provided an additional boost to the AUD/USD pair.
Investors, however, seem convinced that the recent surge in US consumer inflation to a four-decade high would force the Fed to deliver a larger rate hike later this year. This, in turn, remained supportive of elevated US Treasury bond yields, which helped limit deeper losses for the greenback and capped the AUD/USD pair, at least for the time being.
Market participants now look forward to the US economic docket, featuring the release of Existing Home Sales data later during the early North American session. Apart from this, the US bond yields should influence the USD and provide some impetus to the AUD/USD pair. Traders will also take cues from the broader risk sentiment to grab short-term opportunities.
Technical levels to watch
Here is what you need to know on Wednesday, July 20:
The dollar selloff seems to have taken a break on Wednesday with the US Dollar Index moving sideways above 106.50 after having erased more than 1% so far this week. The benchmark 10-year US Treasury bond yield fluctuates above 3% and US stock index futures trade flat following the impressive risk rally witnessed earlier in the week. Inflation data from Canada and June Existing Home Sales from the US will be featured in the US economic docket. During the American trading hours, the European Commission will release the preliminary Consumer Confidence Index data for July. Finally, investors will pay close attention to the 20-yeas US Treasury note auction, which is scheduled to take place at 1700 GMT.
China reported more than 1000 coronavirus cases for the first time since May 20 and investors grow increasingly concerned over Chinese officials introducing additional restriction measures. Meanwhile, markets continue to scale down 100 basis points (bps) Fed rate hike bets for July.
Earlier in the day, the data published by the UK's Office for National Statistics revealed that inflation in the UK, as measured by the Consumer Price Index, jumped to 9.4% on a yearly basis in June from 9.1% in May. Although this print came in higher than the market expectation of 9.3%, the British pound struggled to gather strength. Following Tuesday's upbeat labor market data and Bank of England (BOE) Governor Bailey's hawkish comments, investors seem to have already fully priced in a 50 bps BOE rate hike in August. As of writing, GBP/USD was posting modest daily gains above 1.2000.
EUR/USD closed the third straight reading day in the positive territory on Tuesday on reports suggesting that the European Central Bank could opt for a 50 basis points rate hike at the upcoming meeting on Thursday. The pair continues to trade in positive territory at around mid-1.0200s in the European morning. In the meantime, Nord Stream 1 pipeline will reportedly come back online after the completion of the annual maintenance on Thursday but the gas will be supplied at a reduced rate.
ECB Preview: Three critical factors to watch, and why EUR/USD is set to plunge.
AUD/USD climbed to its highest level in three weeks above 0.6900 on Tuesday and seems to have gone into a consolidation phase early Wednesday. Reserve Bank of Australia's governor, Phillip Lowe, reiterated during the Asian session that further rate increases will be required over the months ahead.
Ahead of the Bank of Japan's policy announcements, USD/JPY continues to move sideways in a narrow band near 138.00.
Gold extends its sideways grind above $1,700 for the fourth straight trading day and struggles to make a decisive move in either direction. Rising US T-bond yields don't allow XAU/USD to benefit from the broad-based selling pressure surrounding the dollar.
Bitcoin trades at its highest level in more than a month above $23,000 and Ethereum stays quiet near $1,500 after having registered small daily losses on Tuesday.
“German producer prices in June were 32.7% higher than a year earlier. However, in intermediate goods there are initial signs that price pressure is no longer quite so strong,” Senior Economist at Commerzbank Research noted in their latest Economic Briefing published on Wednesday.
Additional quotes
“Prices of intermediate goods (excluding energy) did not rise as strongly as before. Here, the year-on-year comparison fell for the second month in a row, due among other things to somewhat lower prices of metals. As intermediate goods are (understandably) ahead of consumer goods prices in this cycle, this gives rise to hopes that the latter will also peak in the coming months.”
“The June figures for producer prices should certainly not be taken as an indication that the high inflation rates in Germany and the euro area will soon be a thing of the past again. On the contrary, we assume that it will be a long time before they fall back towards the ECB's target of 2% on a sustained basis. However, there are indications that the momentum in consumer prices is also likely to peak soon and that falling prices of some commodities in particular, such as industrial metals, will help core rates to fall again somewhat in the coming year.”
- A combination of diverging forces failed to provide any meaningful impetus to USD/JPY on Wednesday
- Diminishing odds for a 100 bps Fed rate hike in July weighed on the USD and acted as a headwind.
- The Fed-BoJ policy divergence helped limit deeper losses ahead of the BoJ decision on Thursday.
The USD/JPY pair struggled to capitalize on the previous day's goodish bounce from the 137.40-137.35 region and witnessed subdued/range-bound price action on Wednesday. The pair seesawed between tepid gains/minor losses through the early European session and was last seen trading just above the 138.00 round-figure mark.
The US dollar remained depressed for the fourth successive day and languished near a two-week low amid receding bets for a more aggressive rate hike by the Federal Reserve in July. In fact, several FOMC members signalled last week that they will likely stick to a 75 bps rate increase at the upcoming policy meeting on July 26-27. This, in turn, was seen as a key factor that acted as a headwind for the USD/JPY pair.
Investors, however, seem convinced that the recent surge in US inflation to a four-decade high would force the Fed to deliver a larger rate hike later this year. The speculations remained supportive of elevated US Treasury bond yields, which could help the USD to stall its recent corrective slide from a two-decade high. Traders might also refrain from placing bearish bets amid expectations for a more dovish Bank of Japan.
The BoJ has repeatedly said that it would stick to the ultra-loose monetary policy and ease further as necessary. The divergent Fed-BoJ policy stance supports prospects for the emergence of some dip-buying around the USD/JPY pair and an extension of the recent strong bullish run. That said, traders seemed reluctant and would prefer to wait on the sidelines ahead of the BoJ monetary policy decision, due to be announced on Thursday.
In the meantime, a generally positive risk tone could undermine the safe-haven Japanese yen and offer some support to the USD/JPY pair. Market participants now look forward to the release of the US Existing Home Sales data for some impetus later during the early North American session. Apart from this, the US bond yields and the broader market risk sentiment could allow traders to grab short-term opportunities.
Technical levels to watch
- GBP/USD continued with its struggle to make it through the 1.2040-1.2045 resistance zone.
- Stronger UK consumer inflation figures failed to impress the GBP bulls or provide any impetus.
- The prevalent USD selling bias acted as a tailwind for the major and helped limit the downside.
The GBP/USD pair edged higher for the fourth successive day on Wednesday and inched back closer to a two-week high touched the previous day. The uptick, however, lacked bullish conviction and once again failed near the 1.2040-1.2045 region. Spot prices quickly retreated a few pips following the release of the UK consumer inflation figures and now seem to have stabilized around the 1.2000 psychological mark.
The UK Office for National Statistics (ONS) reported that the headline UK CPI accelerated to the 9.4% YoY rate in June, surpassing estimates pointing to a rise to 9.3% from the 9.1% in the previous month. The monthly figures showed that the UK CPI rose 0.8% in June as against 0.7% anticipated and the 0.7% previous. Excluding volatile food and energy items, the core inflation gauge, however, eased to 5.8% YoY in June from the 5.9% booked in May. This, in turn, was seen as a key factor that acted as a headwind for the British pound and attracted some intraday selling around the GBP/USD pair.
On the other hand, the US dollar languished near its lowest level since July 6 amid diminishing odds for a more aggressive rate hike by the Federal Reserve later this month. In fact, several FOMC members signalled last week that they will likely stick to a 75 bps rate increase at the upcoming policy meeting on July 26-27. Apart from this, a generally positive tone around the equity markets continued undermining the safe-haven greenback and offered some support to the GBP/USD pair. This makes it prudent to wait for some follow-through selling before positioning for any meaningful slide.
Market participants now look forward to the release of the US Existing Home Sales data, due later during the early North American session. In the meantime, expectations that the recent surge in US inflation to a four-decade high would force the Fed to deliver a larger rate hike later this year should hold back the USD bears from placing aggressive bets. The speculations were reinforced by elevated US Treasury bond yields. This, in turn, should cap gains for the GBP/USD pair.
Technical levels to watch
- UK CPI climbs by 9.4% YoY in June vs. 9.3% expected.
- Monthly UK CPI arrives at 0.8% in June vs. 0.7% expected.
- GBP/USD remains unfazed around 1.2025 on upbeat UK CPIs.
The UK Consumer Prices Index (CPI) 12-month rate came in at 9.4% in June when compared to 9.1% seen in May while beating estimates of a 9.3% print, the UK Office for National Statistics (ONS) reported on Wednesday.
Meanwhile, the core inflation gauge (excluding volatile food and energy items) eased to 5.8% YoY last month versus 5.9% booked in May, meeting the market forecast of 5.8%.
The monthly figures showed that the UK consumer prices arrived at 0.8% in June vs. 0.7% expectations and 0.7% previous.
Key notes (via ONS):
ONS pointed to a 42% year-on-year rise in petrol prices and an almost 10% increase in food prices as the primary drivers of inflation last month.
Prices paid by British factories for materials and energy - a key determinant of prices later paid by consumers in shops - were 24.0% higher in June than a year earlier, the biggest increase since these records began in 1985.
FX implications:
In an initial reaction to the UK CPI numbers, the GBP/USD pair was largely unchanged above 1.2000.
The pair was last seen trading at 1.2025, up 0.25% on the day. The US dollar retreats amid the upbeat market mood, supporting the pair.
Why UK inflation matters to traders?
The Bank of England is tasked with keeping inflation, as measured by the headline Consumer Price Index (CPI) at around 2%, giving the monthly release its importance. An increase in inflation implies a quicker and sooner increase of interest rates or the reduction of bond-buying by the BOE, which means squeezing the supply of pounds. Conversely, a drop in the pace of price rises indicates looser monetary policy. A higher-than-expected result tends to be GBP bullish.
- Gold price is hovering around $1,710.00, downside remains favored on hawkish Western central banks.
- The DXY sees more downside as lower long-run inflation expectations data will remain underpinned.
- The formation of a volatility contraction pattern indicates more consolidation ahead.
Gold price is displaying back and forth moves in a narrow range of $1,710.00-1,715.33 in the Asian session. The precious metal is trading lackluster amid a volatility squeeze. On a broader note, a balanced auction profile can be concluded after considering the price action from the last week. Usually, a volatility contraction is followed by an expansion in the same, and investors should brace for wild moves sooner.
On the dollar front, the US dollar index (DXY) is declining firmly right from the initial tick of the trading session. A bearish open drive structure is indicating a carry-forward of the downside bias in the European session. The DXY will extend its losses after violating Tuesday’s low at 106.40. The asset has surrendered more than 2.60% after printing a fresh 19-year high of 109.30 last week.
Also Read: Gold Price Forecast: XAUUSD remains stuck in a range above $1,700, bearish potential intact
-637938923331471090.jpg)
Fed chair Jerome Powell to announce at least 75 bps rate in July
Gold price seldom has not performed against the weaker greenback
Gold price has turned sideways after printing a low of $1,697.44 last week. Risk-perceived currencies that are compared with the greenback, having the latter as a denominator, are advancing firmly from the past few trading sessions. The greenback turned broadly weak after the US agencies reported the long-run inflation expectations at 2.8%, lower than the prior release of 3.1%. However, the precious metal is displaying a vulnerable performance, which indicates that the gold’s appeal has trimmed significantly.
Lower inflation expectations trim 1% rate hike odds
After the release of the overall Consumer Price Index (CPI) at 9.1% on an annual basis, investors were expecting that the Federal Reserve (Fed) will follow the footprints of the Bank of Canada (BOC) and will paddle up its interest rates by 1% this time. However, the release of the long-run inflation expectations at 2.8% trimmed the 100 basis points (bps) rate hike expectations significantly.
As per CME’s FedWatch Tool, the expectations of a rate hike by 1% were as high as 80% last week, which have trimmed to near 30%. It is worth noting that the intentions of further policy tightening by the Fed are still intact despite the odds of a 1% rate hike have trimmed.
Hawkish central banks to keep the gold price on the tenterhooks
Gold price will remain on the backfoot as Western central banks are extremely hawkish about the benchmark rates. July’s monetary policy minutes released by the Reserve Bank of Australia (RBA) indicate hawkish guidance as inflation expectations for June are sky-rocketing. The European Central Bank (ECB) is discussing the extent of the interest rate to be announced for the first time in 11 years. The majority of Fed policymakers are betting on an interest rate hike by at least 75 bps in its July monetary policy. Apart from that, the Bank of England (BOE) is expected to announce a consecutive 50 bps rate hike next week.
-637938926300989391.png)
Vulnerable oil prices in July to barricade price pressures
The DXY is expected to continue its downside rush on a broader note as the market participants are expecting that inflation has reached its potential. Oil prices have remained vulnerable in the month of July and lower valued ‘paychecks’ received by the households have forced them to drop their consumption quantity-wise. A slippage in overall demand and oil-driven inflation will result in a lower inflation rate.
Gold technical analysis
Gold price is auctioning in a Symmetrical Triangle chart pattern that signals a slippage in volatility followed by an expansion in the same. The upward-sloping trendline of the above-mentioned chart pattern is placed from July 14 low at $1,697.69 while the downward-sloping trendline is plotted from July 18 low at $1,723.97.
The 50-period Exponential Moving Average (EMA) at $1,712.00 is overlapping with the gold prices, which signals a consolidation ahead.
Also, the Relative Strength Index (RSI) (14) is oscillating in the 40.00-60.00 range, which indicates that investors are awaiting a potential trigger for further guidance.
Gold hourly chart
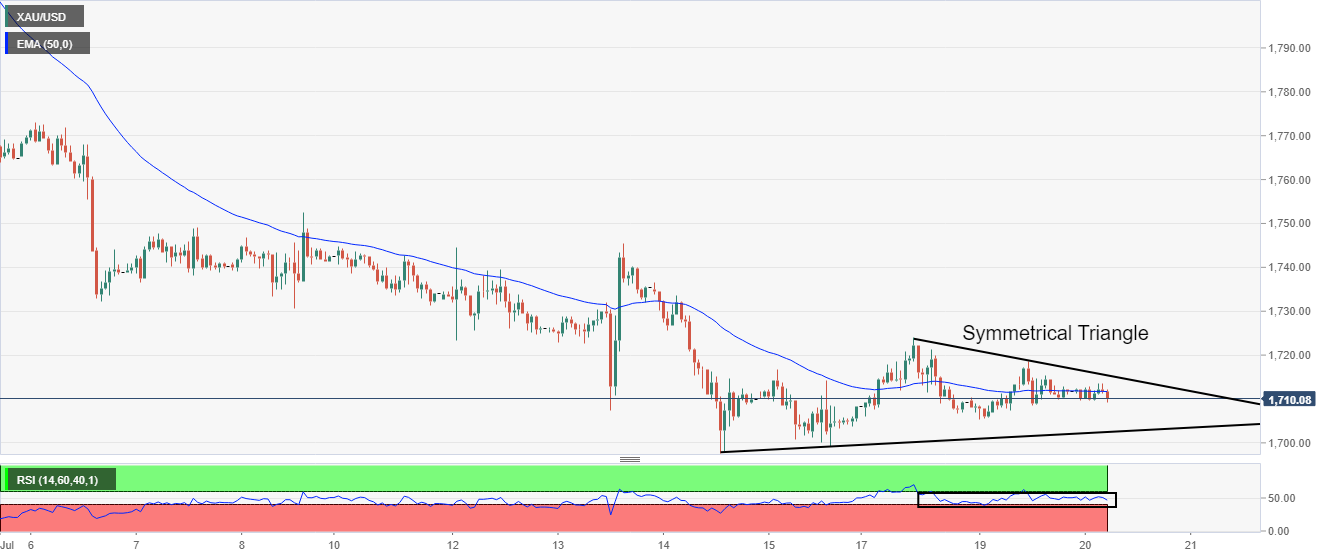
Gold halts decline, but bearish risks still intact
Analysts at Australia and New Zealand (ANZ) Banking Group provide reactions to the speech delivered by Reserve Bank of Australia (RBA) Governor Philip Lowe early Wednesday.
Key quotes
“RBA governor Lowe’s speech this morning and following Q&A made it clear the RBA has “more work to do,” but his view of where the neutral cash rate might lie still includes 2.5%, which is lower than the range alluded to in deputy governor Bullock’s speech yesterday, so can be seen in a somewhat dovish light.”
“On the other hand, Lowe is also open to the possibility that, “maybe we’ve gone past the point of full employment,” in which case, the RBA will need to take policy into clearly restrictive territory to bring inflation back to target.”
- EURUSD regains upside traction, as the US dollar remains on the back foot.
- Talks of a bigger than 25 bps ECB rate hike underpins the shared currency.
- Russia’s Nord Stream 1 pipeline reopens, the market mood remains buoyed.
EURUSD price is trading close to 1.0250, having found the renewed upside traction around the 1.0220 region earlier in the Asian session. The pair continues to benefit from the hawkish ECB expectations and the ongoing correction in the US dollar across the board.
The currency pair caught a fresh bid wave in Tuesday’s early European trading and rose over 100 pips to hit two-week highs of 1.0270. Although bulls failed to sustain at higher, as the price closed the day below the 1.0250 psychological barrier.
Also Read: ECB Preview: Is the time ripe for a 50 bps rate hike?
EURUSD price cheers US dollar correction
The US dollar is extending its corrective decline from two-decade highs for the fifth straight day on Wednesday. Repricing of tightening expectations from the Reserve Bank of Australia (RBA) and the ECB is weighing heavily on the buck. Additionally, easing fears over a 100 bps July Fed rate hike, as well as, ebbing recession risks have provided a relief to the markets, with many investors predicting a bottom could be in place. The upbeat market tone is also collaborating with the downside in the greenback when compared to its main competitors.
Eujropean Central Bank
ECB 50 bps rate hike on the table
The ECB story reported by Reuters on Tuesday suggested that the bank’s policymakers are set to discuss a 50 bps rate hike at the meeting. Therefore, a double-dose rate increase to control record-high inflation will not come as a surprise. Money markets are pricing in 40% odds on a half-point rate hike this week while wagering 97 bps of tightening by September after earlier baking in a one-percentage-point increase. The ECB news has offered the much-needed tailwind to the EUR/USD short-squeeze.
Russia’s Nord Stream 1 resumes
Russia's Nord Stream 1 pipeline will resume gas flows on schedule this week at reduced levels. The Nord Stream 1 carries more than one-third of Russia's natural gas exports to Europe and it was critical for the pipeline to restart after it went offline for 10 days on July 11 for annual maintenance. Markets were sceptical about Russia’s intentions, particularly after Russia’s Gazprom last month reduced the gas flow through Nord Stream 1 by 60%. The Nord Stream news helped EURUSD price with the additional legs in the ongoing recovery.
EU, China trade dialogue
EU-China trade negotiations held on Tuesday yielded few concrete results, with both sides saving for the commitment to keep talking. A Chinese state media report described the discussions as “pragmatic, candid and efficient”, and said the pair had agreed on “a series of results”. Reuters reported that progress was made on macroeconomic policy coordination, unblocking supply chains and reforming the world trading system. This could be seen as a positive for the euro in the coming months.
Eurozone Consumer Confidence eyed
Eurozone Consumer Confidence will drop later in the NA session, which will be interesting to watch ahead of Thursday’s ECB event. Ahead of that, the bloc’s Current Account data will be reported. The US Existing Home Sales will be also closely examined, as housing market slack has emerged as a critical problem for the US economy.
EURUSD price technical analysis

EURUSD price has paused well beneath the bearish 21-Daily Moving Average (DMA) at 1.0294. The renewed upswing once again targets the two-week highs of 1.0270.
Clearance of the 21 DMA will open doors for a rally towards the descending 50 DMA at 1.0467.
The 14-day Relative Strength Index (RSI) is flattening out while within the bearish territory, suggesting that bulls could face a hard time on the road to recovery.
On the flip side, the immediate support is seen at 1.0200 the figure, below which the 1.0150 psychological barrier will come into play.
EUR/USD price: A repricing of expectations [Video]
- Stability above the supply zone placed in a 0.6900-0.6923 range will accelerate the upside momentum.
- The upward sloping trendline placed from July 14 low at 0.6680 will act as major support ahead.
- A range shift to 60.00-80.00 by the RSI (14) signals more gains ahead.
The AUD/USD pair has given an upside break of the consolidation formed in a range of 0.6883-0.6913 in the late New York session on Tuesday. The asset has refreshed its July high at 0.6927 and is aiming for more upside amid a weaker US dollar index (DXY).
Aussie bulls have tested the critical supply zone that is placed in a narrow range of 0.6900-0.6923. The asset may attempt to establish above the same in order to shift its auction profile higher. The upward sloping trendline placed from July 14 low at 0.6680, adjoining July 15 low at 0.6734 will act as key support for the counter.
The 50- and 200-period Exponential Moving Averages (EMAs) at .6864 and 0.6818 respectively are scaling higher, which adds to the upside filters.
Also, the Relative Strength Index (RSI) (14) is oscillating in a bullish range of 60.00-80.00, which indicates that the bullish momentum will continue further.
Should the asset correct minutely to Tuesday’s high at 0.6913, bargain buyers will initiate significant longs which will drive the asset towards June 28 high at 0.6965. A breach of the latter will send the major towards the psychological resistance at 0.7000.
A steep fall below the round-level support of 0.6800 will strengthen the greenback bulls. This may decline the pair towards July 13 low at 0.6724, followed by July 14 low at 0.6680.
AUD/USD hourly chart
-637938883422315285.png)
Bill Evans, Analyst at Westpac offers his afterthoughts on the Australian Westpac-Melbourne Institute Leading Index.
Key quotes
“The Leading Index’s growth rate surged in February and March as the benefits to the economy from the reopening in the eastern states gained maximum momentum. Since that time the growth rate in the Leading Index has been sliding.”
“The six-month annualised growth rate in the Westpac-Melbourne Institute Leading Index, which indicates the likely pace of economic activity relative to trend three to nine months into the future, slowed to 0.40% in June from 0.56% in May.”.
“The June Index is capturing the very early impact of central bank tightening cycles. Most notable for the Australian economy has been the Reserve Bank of Australia, where the first move was initiated in early May.”
“ As the Reserve Bank extends and accelerates the pace of its tightening cycle, we can expect the growth rate in the Index to continue to ease.”
“The reading for June indicates above trend growth in the near term. We expect that as we move further into the three-to-nine-month ‘window’ growth prospects are going to falter.”
The UK CPIs Overview
The cost of living in the UK as represented by the Consumer Price Index (CPI) for June month is due early on Wednesday at 06:00 GMT. June’s inflation data will be keenly watched by the GBP/USD traders as a positive side deviation in overall and core inflation figures will strengthen the odds of a consecutive 50 basis point (bps) rate hike by the Bank of England (BOE). Also, it will add downside pressure on already vulnerable Gross Domestic Product (GDP) numbers.
As per the market consensus, the annual UK Inflation may refresh the four-decade high at 9.3% vs. 9.1% reported earlier. While the Core CPI that doesn’t include volatile food and energy prices is expected to shift lower to 5.8% against the prior print of 5.9%. Talking about the monthly figures, the CPI is seen as stable at 0.7%.
The investing community should note that the downbeat Average Hourly Earnings, stable Unemployment Rate, and decent slippage in Claimant Count Change highlight the Producer Price Index (PPI) as an important catalyst for the immediate GBP/USD direction. That being said, the PPI Core Output YoY may shift higher to 15.5% against the prior release at 14.8% on a non-seasonally adjusted basis. Adding to that, the monthly print may increase to 2% versus 1.5% reported earlier.
Furthermore, the Retail Price Index (RPI) is also on the table for release and is expected to rise minutely to 11.8% YoY from 11.7% prior while the MoM prints could hit 0.8% from 0.7%, as recorded in previous readings.
Deviation impact on GBP/USD
How could it affect GBP/USD?
GBP/USD is displaying an upbeat performance after a firmer rebound below the psychological support of 1.2000 in early Tokyo. The cable is poised to record more gains despite accelerating odds of more complexity for the households in the UK. The release of the unchanged Unemployment Rate at 3.8% and slippage in Claimant Count Change at 20k will delight the Bank of England (BOE) to tighten policy further. However, a significant plunge in Average Hourly Earnings is going to torture the pound bulls when the dust over the inflation rate in the US economy will settle.
The economic data plunged to 6.2% from the expectations of 6.9% and the prior release of 6.8%. The investing community is aware of the fact that the UK economy is already facing the headwinds of higher price pressures led by higher energy bills and food prices. Lower earnings along with price pressures are going to hurt the sentiment of the market participants dramatically.
Technically, the cable has established above the psychological resistance of 1.2000. The pair has breached a prolonged Falling Channel on the upside and is poised to register a two-week high above 1.2056. Short-to-long term Exponential Moving Averages (EMAs) are scaling higher on medium-range timeframe.
Keynotes
GBP/USD Forecast: Next bullish target aligns at 1.2060
GBP/USD Analysis: Descending channel breakout in play, UK jobs data eyed for fresh impetus
About the UK CPIs
The Consumer Price Index released by the Office for National Statistics is a measure of price movements by the comparison between the retail prices of a representative shopping basket of goods and services. The purchasing power of GBP is dragged down by inflation. The CPI is a key indicator to measure inflation and changes in purchasing trends. Generally, a high reading is seen as positive (or bullish) for the GBP, while a low reading is seen as negative (or Bearish).
- A breakout of a bullish flag has brought a sheer upside to the asset.
- The antipodean is aiming to drive the asset above 61.8% Fibo retracement.
- Advancing 20-and 50- EMAs signal more gains ahead.
The NZD/USD pair has surged strongly after a mild correction towards 0.6217. The asset has surpassed the critical hurdle of 0.6250 strongly. An upside break of the time correction has strengthened the kiwi bulls and has exposed the asset for more upside.
A breakout of the Bullish Flag chart pattern on an hourly scale has unleashed the kiwi bulls. Usually, an inventory distribution phase in the above-mentioned chart pattern denotes the initiation of longs by those market participants, which prefer to enter an auction after the establishment of a bullish bias.
The kiwi bulls have driven the asset to near 61.8% Fibonacci retracement (which is placed from June 16 high at 0.6396 to July 14 low at 0.6061) at 0.6268.
Advancing 20- and 50-period Exponential Moving Averages (EMAs) at 0.6229 and 0.6201 respectively add to the upside filters.
Also, the Relative Strength Index (RSI) (14) is oscillating in the 60.00-80.00 range, which signals a continuation of a bullish momentum ahead.
A corrective move towards Tuesday’s high at 0.6239 will be a bargain buy for the market participants. This will drive the asset towards 61.8% Fibo retracement at 0.6268, followed by the round-level resistance at 0.6300.
Alternatively, the greenback bulls could gain control if the asset drops below 38.2% Fibo retracement at 0.6190. An occurrence of the same will drag the asset towards 23.6% Fibo retracement at 0.6139. A breach of the 23.6% Fibo retracement will expose the greenback bulls to recapture its two-year low at 0.6061.
NZD/USD hourly chart
-637938838872007723.png)
- A pause in the US dollar sell-off offers some respite to USD/CAD.
- Oil price weakness helps alleviate the downside pressure.
- 50 DMA challenges bullish commitments, Canadian inflation eyed.
USD/CAD is licking its wounds while defending 1.2850, sitting at the lowest level in two weeks, as the US dollar bears take a breather after the recent downward spiral.
The sentiment remains upbeat amid easing recession fears, in the face of Russia’s Nord Stream 1 re-opening at reduced levels and ebbing 100 bps July Fed rate hike bets. Meanwhile, Netflix Inc. reported a smaller-than-expected subscriber loss, which also enhance the market mood.
Meanwhile, the renewed pullback in WTI prices after the previous upsurge also helps cushion the downside in the USD/CAD pair. The black gold slipped in Asian trading after the API crude stockpiles jumped by 1.86 million barrels vs. +1.40 million barrels expected.
Looking ahead, the US dollar price action and the Canadian inflation data will emerge as the key drivers for the major. The Canadian Consumer Price Index (CPI) is seen higher at 8.4% YoY in June vs. 7.7% expected. The annualized core CPI is likely to surge 6.7% in June vs. 6.1% reported previously. Note that the Bank of Canada (BOC) hiked the key rates by a surprise 100 bps to 2.5% at its policy meeting last week to fight raging inflation.
From a short-term technical perspective, USD/CAD is challenging the critical horizontal 50-Daily Moving Average (DMA) at 1.28558, as of writing.
Daily closing below the latter is needed to resume the bearish momentum from above 1.3200 levels. The 14-day Relative Strength Index (RSI) is flatlined but remains below the 50.00 level, suggesting that the downside bias looks well in place in the near term.
A breach of the key support could trigger a sharp drop towards the mildly bullish 100 DMA at 1.2771. Ahead of that, the 1.2800 round number could be put to test.
USD/CAD: Daily chart
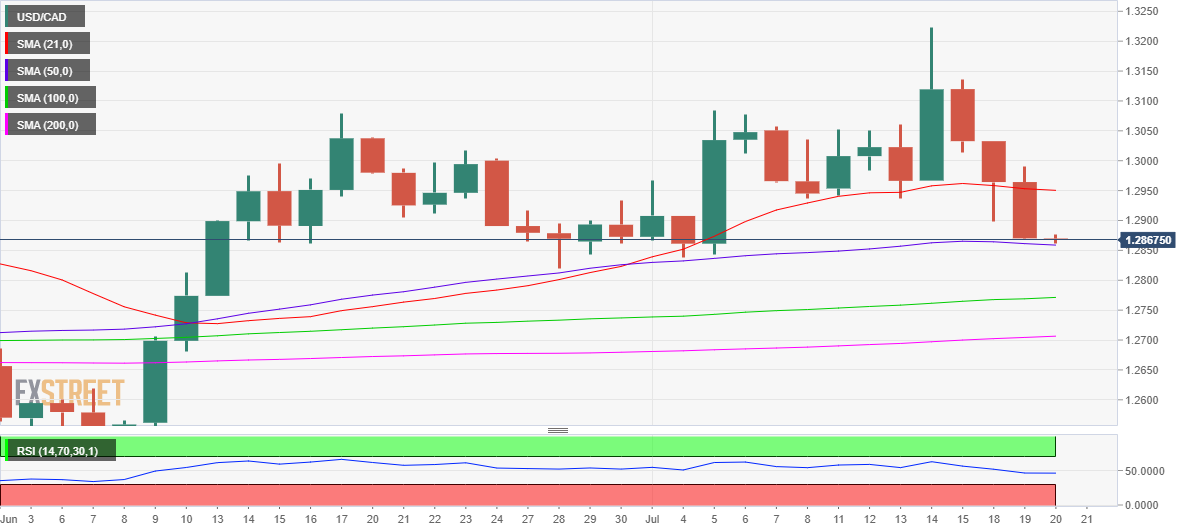
On the other side, bulls need to recapture the 1.2900 barrier to initiate any meaningful recovery. Up next, the falling 21 DMA at 1.2950 will offer stiff resistance.
A sustained break above the latter is critical to unleashing the additional recovery towards the 1.3000 mark and beyond.
USD/CAD: Additional levels to consider
| Raw materials | Closed | Change, % |
|---|---|---|
| Silver | 18.745 | 0.1 |
| Gold | 1711.22 | 0.08 |
| Palladium | 1873.51 | 0.64 |
More restrictive measures are on the table, as China reports more than 1000 new coronavirus cases for the first time since May 20.
The country recorded 1,012 new coronavirus cases for July 19, of which 150 were symptomatic and 862 were asymptomatic, according to the National Health Commission (NHC).
China's capital Beijing reported one new local symptomatic case. Shanghai reported five new local symptomatic cases.
Amidst rising covid count, the angst against the authorities also grew after it was reported that 84 homes in an apartment complex in Guangzhou city’s Liwan district had been opened in an effort to find any “close contacts” hiding inside and to disinfect the premises.
However, authorities in southern China have apologized for breaking into the homes of people who had been taken to a quarantined hotel. Those affected by the break-ins have been told that they will be compensated for the damage.
China maintains a strict zero-Covid policy despite its mounting economic costs. If the cases continue to rise at this pace, fresh lockdowns in Beijing and Shanghai won't come as a surprise.
Market reaction
Markets seem to ignore the concerning Chinese covid news, as worries over an imminent recession fade, with investors believing that the worst may be over for global stocks. The S&P 500 futures were last seen trading up 0.38% on the day while the US dollar index sheds 0.07% to trade around 106.60.
Chinese Premier Li Keqiang signaled a focus on jobs, flexibility on the economic growth rate and a shift toward making its Covid control measures more targeted, per Bloomberg.
Additional quotes
“Most important thing was to keep employment and prices stable.”
“Slightly higher or lower growth rates were acceptable as long as employment is relatively sufficient, household income grows and prices are stable.”
“Keeping major economic indicators within a proper range also means that the macroeconomy can enjoy sustained and sound growth.”
“Further economic support could come in the form of front-loading 2023 special local government bonds, raising the budget deficit, or issuing special sovereign debt.”
“Measures that could help China avoid a “policy cliff” in the fourth quarter.
Related reads
- AUD/USD remains lackluster as PBOC leaves PLR unchanged
- PBoC leaves loan prime rate duo unchanged, fixed USD/CNY at 6.7465 vs. the estimate at 6.7445
- Gold Price finds support as equities rise and US dollar sulks below 20-year highs.
- The bulls are correcting the gold price which could equate to a significant retracement.
- The key events coming up are the ECB, US PMIs before the Fed next week.
Gold price is flat in Asia in a quiet session consolidating the overnight volatility. With that being said, equities are following the lead that was made on Wall Street with the Nikkei up a stunning 2% in the first hour of trade. As such, the US dollar is on the backfoot as risk-on sentiment persists. Overall, XAUUSD leans bullish with time frame continuity within the bullish correction of the recent leg of supply from $1,750 that took out the $1,700 level last week. The pullback in the US dollar continues to support the gold price as investors move to the sidelines ahead of key central bank meetings.
US and Asian stocks on the front foot
US stocks were firm with better-than-expected earnings which comforted investors that have otherwise been fretting over the risks of elevated inflation and a stronger US dollar presumed to eat into corporate profits. This is supportive of the gold price as risk-on weighs on the US dollar.
Read: Forex Today: Dollar’s sell-off continues
The Dow Jones Industrial Average climbed 2.4% to 31,827.05, the S&P 500 added 2.8% to 3,936.69 and the Nasdaq Composite gained 3.1% to 11,713.15. In Asia, the upbeat mood has shined through and stocks are recovering from the prior day's slump after media reports that tech-giant Apple plans a hiring slowdown. After a three-day weekend, the benchmark Nikkei 225 rose 173.21 to 26,961.68, as gaining issues outnumbered losers 169 to 55.
US dollar slumping further below a 20-year peak
The US dollar is falling further below the 20-year highs in Asia, as per the DXY index, as it corrects towards a potential area of support in the longer-term time frames, an area that XAUUSD traders will be watching. The index, which measures the greenback vs. a basket of currencies has moved in on the 50% mean reversion level of the last weekly bullish impulse. At the time of writing, DXY is trading down 0.1% to 106.58 and around 106.53 as the low of the day so far.
From a daily perspective, the price is hovering over a void of offers that leaves 105.27 vulnerable should DXY bears continue to hit the bids. Gold traders will be keeping a close eye on price action at this juncture. Meanwhile, for the week and further out, central banks and key US PMI data will be eyed. Before the Federal Reserve meets next week, the European Central Bank, ECB, will meet on Thursday and then US PMI Surveys for July will be keenly watched on Friday.
ECB, the Fed and US PMIs coming up
The Federal Reserve
The ECB and US PMI Surveys have the potential to throw up some volatility in the gold price before the Fed meets on July 26-27. The ECB has firmly telegraphed a 25bps rate hike and while it is unlikely to surprise, the meeting will coincide with news related to the Nord Stream pipe. After a shutdown, gas is supposed to resume flowing. However, Berlin is growing concerned that Moscow may not resume the flow of gas as scheduled. Russia's Gazprom declared force majeure on gas supplies to Europe to at least one major customer, in a letter dated July 14 and seen by Reuters at the start of this week.
Heated inflation risks had already seen money markets punting for a half-point hike. The uncertainty is indeed a cloud over the ECB event. However, if the central bank goes ahead with a rate hike, be it 25 or 50bps, regardless, it will be the first time in more than a decade and the outcome of the event could have a material impact on the euro, US dollar and gold price.
As for US PMIs, analysts at TD Securities explained, ''business surveys fell markedly in June, led by broad declines in the S&P Global PMIs. The manufacturing index, in particular, posted a large retreat to 52.7 from 57.0 in May.''
-637938532289769428.png)
Manufacturing index PMI
''While we look for relief in the pace of declines in the mfg PMI, we still expect it to register a new drop in the flash estimate. Conversely, we expect a steady number for the services index after recent declines.''
The Federal Reserve is around the corner and for the time being, ''gold prices are being supported by the markets' repricing for odds of a 100bp hike after Fedspeak from notable hawks has pushed back against this narrative, which is raising the risk of a near-term short-squeeze,'' analysts at TD Securities argued. ''Notwithstanding, this scenario would create the ideal set-up for additional downside in the yellow metal.''
Gold price technical analysis
Gold price, from a weekly perspective, the bull correction is underway but the lows of $1,676.86, as illustrated on the chart below and up for grabs from a technical perspective longer term:
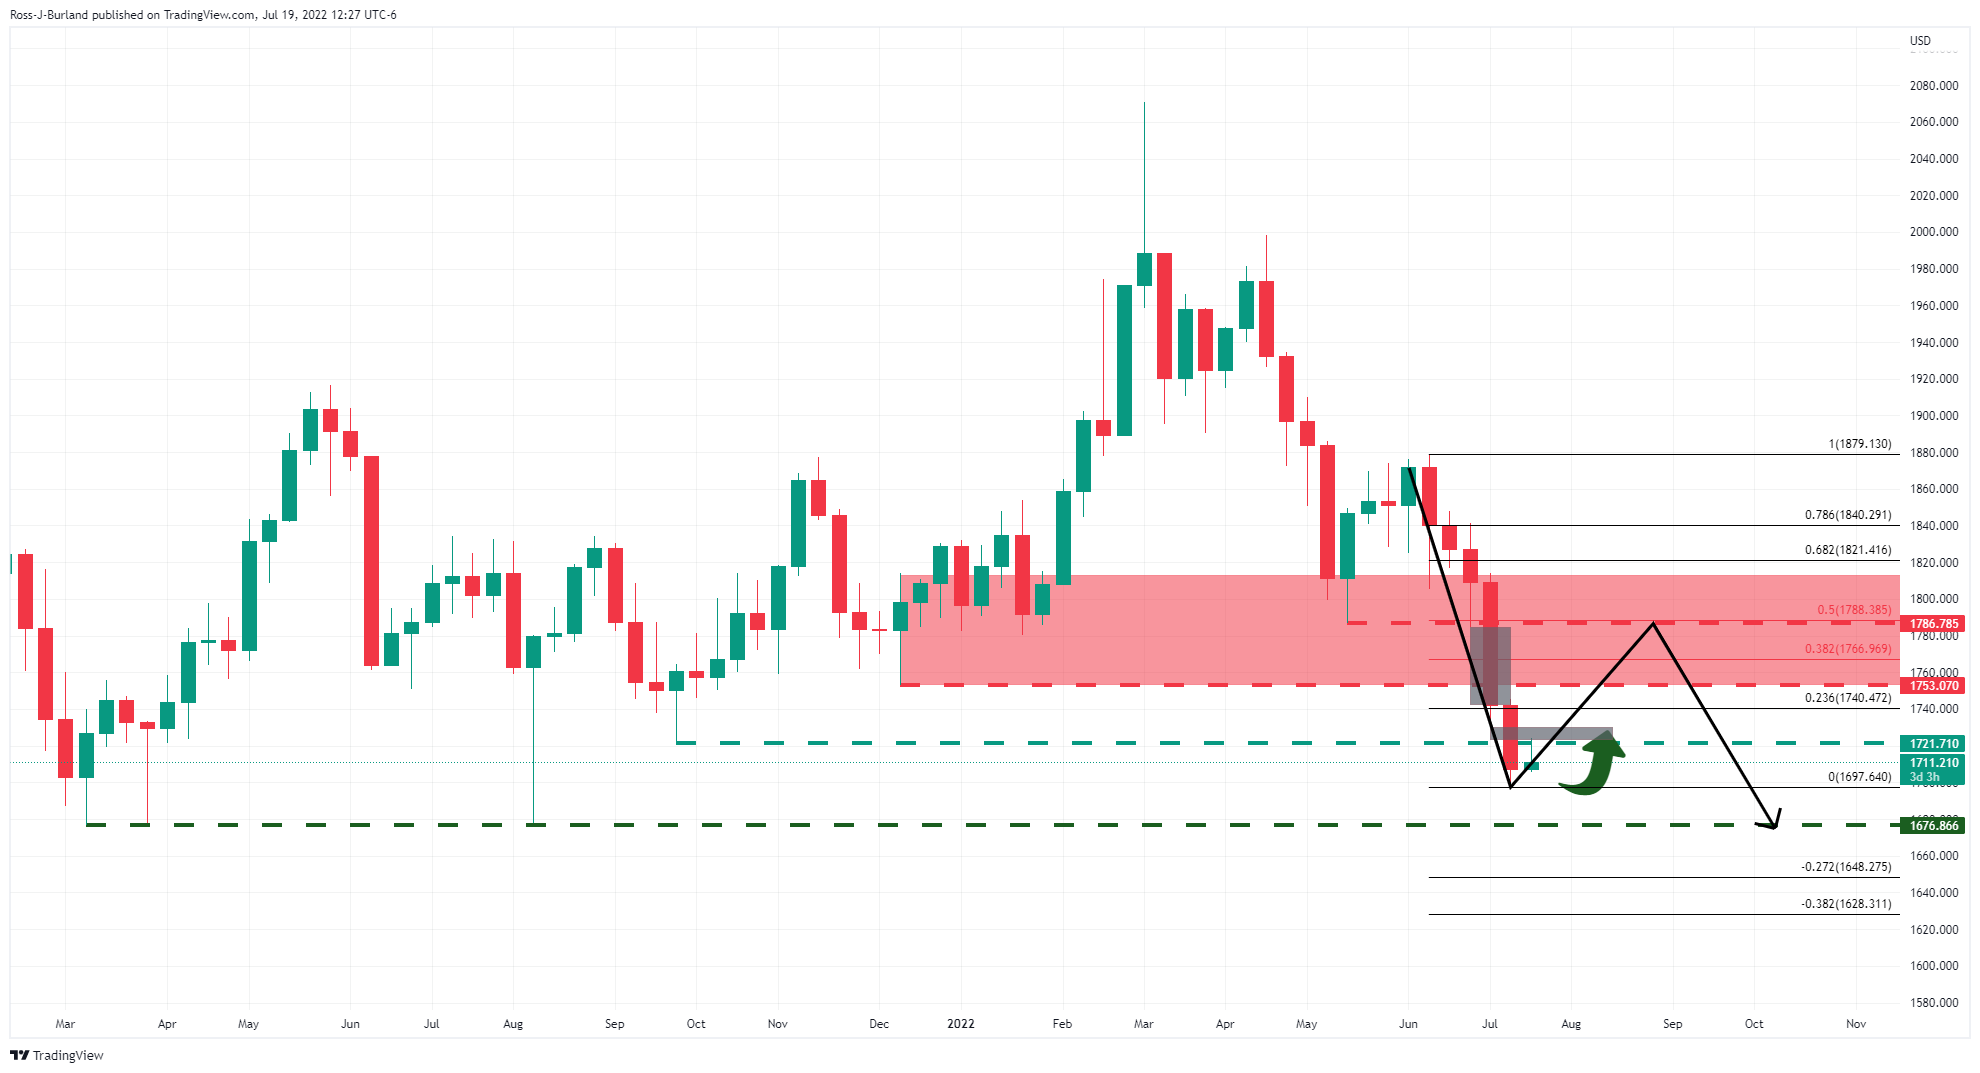
The greyed-out areas on the chart above are void of bids which could draw XAUUSD to test the commitments of bears in a 50% mean reversion. On the way there, however, we have a couple of major pivot points that could offer resistance at $1,721 and $1,753.
- AUD/USD has not displayed any significant move on the maintenance of the status quo by the PBOC.
- PBOC has kept its five-year PLR at 4.45% and one-year PLR at 3.70%.
- RBA Lowe is expecting a higher inflation rate for June and more rate hikes over the months ahead.
The AUD/USD pair has remained muted as the People’s Bank of China (PBOC) has kept its monetary policy unchanged. The PBOC has kept its five-year Prime Lending Rate (PLR) at 4.45%. Also, the one-year loan prime rate has remained stable at 3.70%
It is worth noting that Australia is a leading trading partner of China and eventually has a significant impact on the AUD/USD pair. Meanwhile, the USD/CNH pair has surged strongly and has recorded an intraday high of 6.7457.
The aussie has been performing stronger against the greenback this week after the long-run inflation expectations in the US slipped to 2.8% from June’s print of 3.1%. The US dollar index (DXY) felt the heat as lower inflation expectations indicate that policy tightening measures are near to conclusion. And, the Federal Reserve (Fed) will diminish the momentum of raising interest rates.
Adding to that, the odds of a 1% rate hike by the Fed in its July monetary policy meeting have trimmed significantly. As per CME’s FedWatch Tool, the expectations of a rate hike by 1% were as high as 80% last week, which have trimmed to near 30%. However, higher odds of a rate hike announcement are still intact.
On the Aussie front, comments from Reserve Bank of Australia (RBA) Governor Philip Lowe at ''The Australian Strategic Business Forum – Melbourne'' will strengthen the antipodean further. The comments from RBA Lowe indicate that investors should brace for higher inflation in June. To contain price pressures, the RBA will dictate more rate hikes over the months ahead.
In recent trade today, the People’s Bank of China (PBOC) set the yuan (CNY) at 6.7465 vs. the estimate at 6.7445.
At the same time, China left the five-year loan prime rate unchanged at 4.45% as expected. The PBoC also left the one-year loan prime rate unchanged at 3.70% as expected.
About the fix
China maintains strict control of the yuan’s rate on the mainland.
The onshore yuan (CNY) differs from the offshore one (CNH) in trading restrictions, this last one is not as tightly controlled.
Each morning, the People’s Bank of China (PBOC) sets a so-called daily midpoint fix, based on the yuan’s previous day's closing level and quotations taken from the inter-bank dealer.
- The black gold is facing barricades at around $100.00 as API reported oil build-up.
- OPEC cartel has not promised more oil to cool-off volatility in the oil prices.
- Lockdown fears in China may bring a significant impact on oil prices.
West Texas Intermediate (WTI), futures on NYMEX, is struggling to overstep the psychological resistance of $100.00 in the Asian session. The black gold has observed mild selling pressure after the American Petroleum Institute (API) reported a build-up of oil inventories for the past week by 1.86 million barrels. Gasoline inventories rose by 1.29 million barrels, however, the distillate stocks fell by 2.1 million barrels.
On a broader note, the upside story remains solid as US President Joe Biden has failed to fetch the promise of more oil from the OPEC cartel. The US administration is committed to bringing price stability to oil prices. To fulfill the same, US President Joe Biden visited Saudi Arabia for bringing more oil supply to the table. However, the unavailability of the promise of more oil during the visit has strengthened the oil bulls.
Considering the elevated oil prices, the major oil suppliers Saudi Arabia and the United Arab Emirates (UAE) seem not interested in injecting more oil into the global supply. The OPEC nations are operating near their full-capacity levels and are enjoying premium prices. Therefore, the nations have not shown any interest in adding capacity despite having the right infrastructure.
Other OPEC nations don’t have the ability to expand their capacity. Also, a few OPEC nations are unable to produce the stated oil. Prohibition of oil imports from Russia by the Western leaders will keep haunting the oil bulls for a prolonged period.
No doubt, the escalating odds of lockdown in China due to the recurring resurgence of Covid-19 will bring a slump in demand for oil. The impact is temporary as lockdown measures won’t sustain for a longer period. It is worth noting that China is a leading consumer of oil and any slump in the overall demand in China will bring a significant impact on oil prices.
- USD/JPY bulls have moved in from a key area of support on the daily charts.
- The bulls are eyeing a break of a critical hourly resistance area.
USD/JPY has corrected a significant portion of the last daily bullish impulse and the bulls have moved in from a firm area of support. This raises prospects of a bullish continuation for the coming sessions and the following illustrates this from a bullish perspective on both the daily and hourly charts.
USD/JPY daily chart
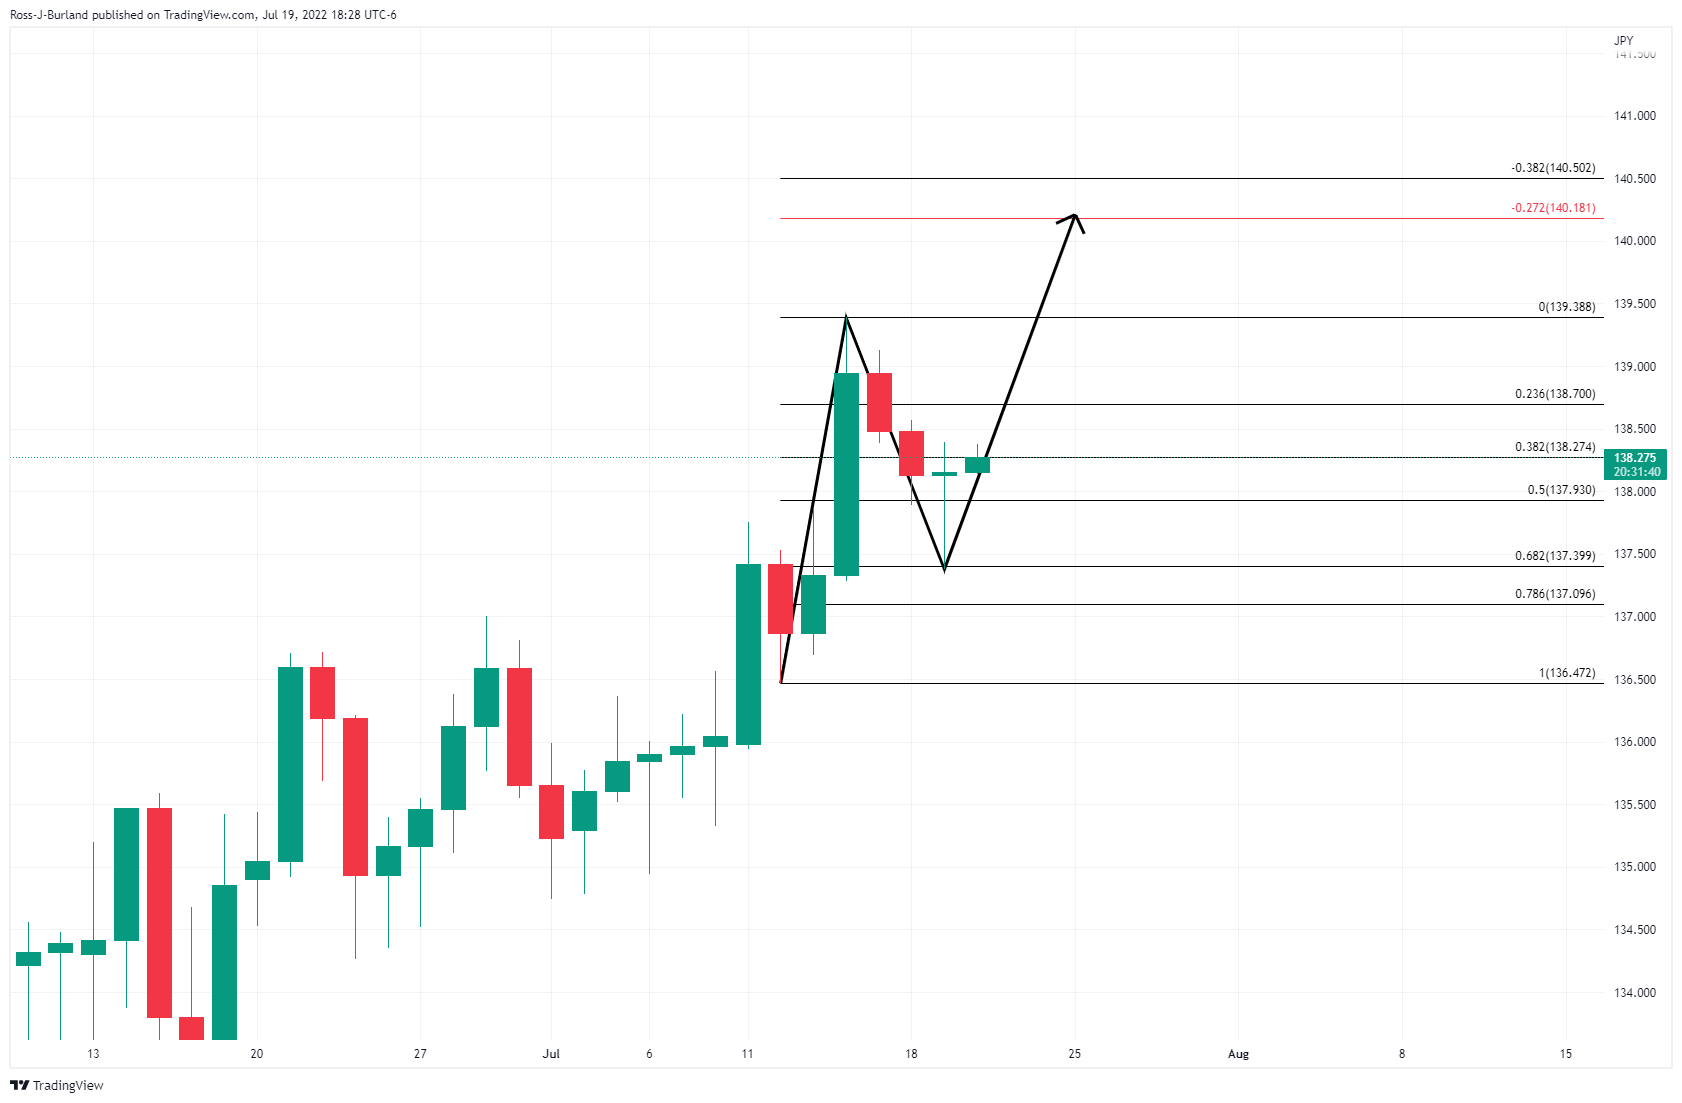
The price has met a 68.2% Fibonacci retracement level which has a confluence with prior highs, reinforcing the prospects of a bullish continuation for the days ahead.
USD/JPY H1 chart

From an hourly perspective, the price is on target to break above what would be presumed to be a level of interest given how it acted as the last stop before the continuation of the sell-off. If this holds as support on initial tests, then the upside bias will remain in play.
- The DXY is hoping for a pullback towards 107.00 as yields extend gains.
- Odds of a 1% rate hike have trimmed while policy tightening expectations are rock solid.
- Inflation rate is likely to reach its full potential sooner as oil prices have remained vulnerable in July.
The US dollar index (DXY) is displaying a balanced market profile in a narrow range of 106.64-106.75 in the Asian session. The asset has remained in the grip of bears for the past three trading sessions. The DXY has surrendered more than 2.60% after failing to sustain the fresh 19-year high at 109.30 last week. A pullback move is likely to be followed after a vertical downside. Also, the US Treasury yields have extended their recovery.
10-year US Treasury yields stabilize above 3%
A divergence has been observed between the US Treasury yields and the DXY over the past few trading sessions. As the 10-year US Treasury yields have reclaimed the psychological figure of 3%, the DXY will surely display a pullback move after a bearish impulsive wave. The odds of a 100 basis point (bps) rate hike by the Federal Reserve (FED) have trimmed drastically. However, the chances of more policy tightening are rock solid.
Inflation sees its potential sooner
The DXY is expected to continue its downside rush on a broader note as the market participants are expecting that inflation has reached its potential. Oil prices have remained vulnerable in the month of July and lower valued ‘paychecks’ received by the households have forced them to drop their consumption quantity-wise. A slippage in overall demand and oil-driven inflation will result in a lower inflation rate.
Key data this week: Initial Jobless Claims, and S&P Global Purchase Managers Index (PMI).
Major events this week: People’s Bank of China (PBOC) monetary policy, European Central Bank (ECB) interest rate decision, and Bank of Japan (BOC) monetary policy.
| Index | Change, points | Closed | Change, % |
|---|---|---|---|
| NIKKEI 225 | 173.21 | 26961.68 | 0.65 |
| Hang Seng | -185.12 | 20661.06 | -0.89 |
| KOSPI | -4.28 | 2370.97 | -0.18 |
| ASX 200 | -37.5 | 6649.6 | -0.56 |
| FTSE 100 | 73.08 | 7296.28 | 1.01 |
| DAX | 348.6 | 13308.41 | 2.69 |
| CAC 40 | 109.31 | 6201.22 | 1.79 |
| Dow Jones | 754.44 | 31827.05 | 2.43 |
| S&P 500 | 105.84 | 3936.69 | 2.76 |
| NASDAQ Composite | 353.1 | 11713.15 | 3.11 |
| Pare | Closed | Change, % |
|---|---|---|
| AUDUSD | 0.68983 | 1.27 |
| EURJPY | 141.359 | 0.86 |
| EURUSD | 1.02274 | 0.79 |
| GBPJPY | 165.757 | 0.39 |
| GBPUSD | 1.19974 | 0.36 |
| NZDUSD | 0.62244 | 1.15 |
| USDCAD | 1.28709 | -0.83 |
| USDCHF | 0.96777 | -0.95 |
| USDJPY | 138.17 | 0.04 |
- AUD/JPY is aiming to recapture a seven-year high at 96.90 on expectations of wider RBA-BOJ policy divergence.
- RBA minutes have shown hawkish guidance amid soaring price pressures.
- A dovish commentary is expected by the BOJ in its monetary policy meeting on Thursday.
The AUD/JPY pair has continued its five-day winning streak and is marching to recapture its seven-year high at 96.90. The risk barometer has been strengthened by the market participants on escalating odds of wider divergence in Reserve Bank of Australia (RBA)-Bank of Japan (BOJ) policy.
The aussie bulls are performing stronger against Tokyo after the release of July’s monetary policy minutes by the RBA. The guidance provided by RBA policymakers is hawkish as price pressures are soaring in the Australian economy. While the RBA is focused on bringing price stability sooner.
At the press time, RBA Governor Philip Lowe is speaking at ''The Australian Strategic Business Forum – Melbourne'' on Inflation, Productivity, and the Future of Money. The comments from RBA Lowe indicate that investors should brace for higher inflation in June. To contain price pressures, the RBA will dictate more rate hikes over the months ahead.
This week, the Australian S&P PMI data will be of utmost importance. The Manufacturing PMI may step up to 56.4 vs. 56.2 in the prior figure. While the Services PMI is seen significantly higher at 55 than the prior release of 52.6.
On the Tokyo front, the announcement of the interest rate decision by the BOJ on Thursday will be the show-stopper event. A dovish commentary is expected from BOJ Governor Haruhiko Kuroda as the central bank is committed to pushing the aggregate demand in the economy. The central bank is focusing on keeping the inflation rate above 2% and to address the same the wage price index is needed to elevate as a higher inflation rate and lower wage levels could enlarge the real income shock.


© 2000-2026. All rights reserved.
This site is managed by Teletrade D.J. LLC 2351 LLC 2022 (Euro House, Richmond Hill Road, Kingstown, VC0100, St. Vincent and the Grenadines).
The information on this website is for informational purposes only and does not constitute any investment advice.
The company does not serve or provide services to customers who are residents of the US, Canada, Iran, The Democratic People's Republic of Korea, Yemen and FATF blacklisted countries.
Making transactions on financial markets with marginal financial instruments opens up wide possibilities and allows investors who are willing to take risks to earn high profits, carrying a potentially high risk of losses at the same time. Therefore you should responsibly approach the issue of choosing the appropriate investment strategy, taking the available resources into account, before starting trading.
Use of the information: full or partial use of materials from this website must always be referenced to TeleTrade as the source of information. Use of the materials on the Internet must be accompanied by a hyperlink to teletrade.org. Automatic import of materials and information from this website is prohibited.
Please contact our PR department if you have any questions or need assistance at pr@teletrade.global.
transfers