- Analytics
- News and Tools
- Market News
CFD Markets News and Forecasts — 18-07-2022
- EUR/JPY has witnessed a modest recovery after a sharp correction towards 140.00.
- The ECB to elevate its interest rates for the first time in 11 years.
- A dovish stance is expected by the BOJ to keep flushing liquidity into the market.
The EUR/JPY pair has displayed a less-confident rebound from the psychological support of 140.00. The cross has sensed barricades around 140.0 after a modest recovery. Going forward, the asset is expected to display wild moves as investors are shifting their focus towards the monetary policy announcement by the European Central Bank (ECB) and the Bank of Japan (BOJ) this week.
Considering the market chatters, the ECB is expected to break its 11-year-long status-quo maintenance and will announce a rate hike. Price pressures are impacting the households as a large real income slump has impacted their consumption and savings patterns significantly.
In order to tame the roaring inflation, the ECB has already announced the conclusion of the Asset Purchase Program (APP) to squeeze liquidity. Now, the focus will shift to interest rate elevation to chase down easy money available in the market.
Apart from that, this week the release of eurozone Consumer Confidence will be of utmost importance. A preliminary estimate for the eurozone Consumer Confidence data is -24.5 vs. -23.6 reported earlier.
On the Tokyo front, the Bank of Japan (BOJ) is expected to maintain the status quo in its interest rate decision announcement. A dovish stance is expected from BOJ Governor Haruhiko Kuroda as the BOJ is bound to revive overall demand in the economy. The BOJ is focusing on keeping the inflation rate above 2% and in order to address the same, it needs to elevate the wage prices simultaneously.
- USD/CAD corrects from out of the 1.2900s with the bullish trend still in place.
- The attention will be turning back to the Fed again.
At 1.2985, USD/CAD is flat ahead of the Tokyo cash open. The pair has been in the hands of the bulls at the start of the week despite the Bank of Canada last week surprised the market by raising rates 100bp to 2.50% which drove the CAD higher to test 1.29 the figure.
''The Bank of Canada continues to be the one of most aggressive developed world central bank having raised rates before the Fed, hiked 50bp before the Fed, and started QT before the Federal Reserve,'' analysts at Rabobank said.
''The Bank is still confident it can engineer a soft landing, and a front-loaded hiking cycle is the best way to achieve that. But, the path to a soft landing has narrowed and the reduction in the growth outlook does imply some pain.''
Meanwhile, speculators’ CAD net long positions edged lower for a second week and the bullish trend remains in place with the analysts at Rabobank saying this will continue to be ''unless 1.285 is broken, on the upside, we still look to 1.3070 as resistance, but a break above there would open up a move to 1.32.''
As for the US dollar, it has lost some shine to trade back below 107 on Monday as per the DXY index which measures the greenback vs. a basket of major currencies. It was trading as high as 109.29 in a fresh bull cycle high last week.
Fedspeak has pushed back against a 100bp hike from some notable hawks, raising the risk of a near-term short-squeeze on the Gold Price prior to the meeting. The Federal Reserve has moved into the blackout period before the next meeting leaving prior statements from Fed speakers following the last meeting and to date for the market to chew on.
At the June FOMC meeting, Chair Jerome Powell stated that he would need ‘compelling evidence’ that inflation is easing for the Fed to change course, which he defined as ‘a series of falling monthly inflation readings’. Since then, we have heard from Fed's Raphael Bostic who said “everything is in play” while Mester said there was no reason for a smaller hike. Mary Daly, CEO of San Francisco said 75 bp was her “most likely posture.”
- The NZD/USD edges lower on Tuesday, down by a minimal 0.02%, as the Asian session begins.
- Asian equity futures tumble, set for a lower open on a dismal market mood.
- NZD/USD Price Analysis: Downward-to-neutral, unless buyers reclaim 0.6200, the majors will be under selling pressure.
The NZD/USD is almost flat as the Asian Pacific session begins, clings above the 0.6150 mark after hitting a daily high above 0.6200 but tumbled on market mood shift, which dented the appetite for risk-sensitive currencies like the kiwi and bolstering the greenback. At the time of writing, the NZD/USD is trading at 0.6151.
Also read:
- NZD/USD struggles around 0.6150 despite hot NZ inflation, and further RBNZ tightening
- Forex Today: Optimism proved ephemeral
NZD/USD Price Analysis: Technical outlook
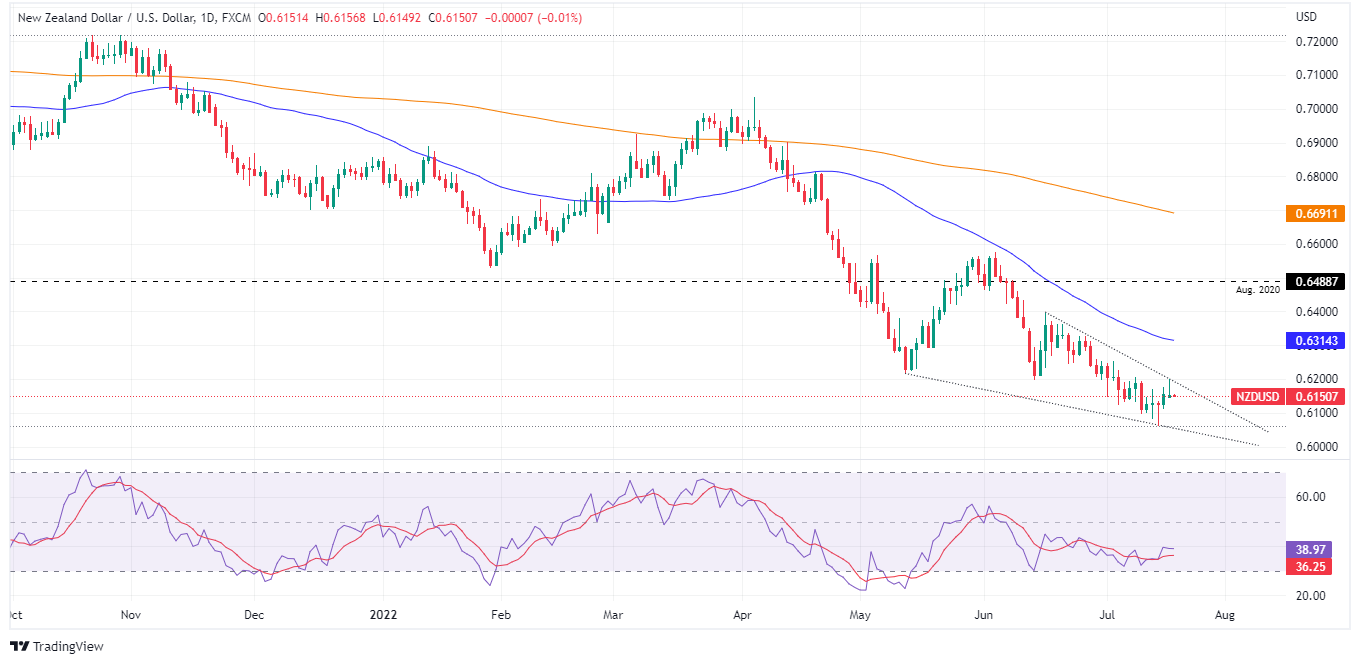
The NZD/USD is still downward-to-neutral biased, printing a successive series of lower lows and lower highs, further reinforcing the previously-mentioned. Also, the Relative Strength Index (RSI) exited from oversold conditions in mid-June and peaked around 45; since then, the RSI has been trending lower, indicating further selling pressure lies ahead. Nevertheless, NZD/USD buyers need to step in and achieve a daily close above the June 14 low at 0.6196 to shift the bias to neutral. Failure to do so, the NZD/USD will remain vulnerable.
NZD/USD Daily chart
NZD/USD price action formed a falling wedge, usually a sign of weak selling pressure. It means that the recent cycle lows have been recorded on less momentum, signaling that buyers might be outpacing sellers. Nevertheless, a flat RSI suggests NZD/USD sellers are booking profits, awaiting a fresh catalyst to record a new YTD low.
Therefore, the NZD/USD first support would be the 0.6150 figure. A break below will expose the 0.6100 figure. Once cleared, the next support would be the YTD low at 0.6060, followed by a test of the triple-zero mark at 0.6000.
NZD/USD Key Technical Levels
- AUD/USD is likely to pick bids around 0.6800 after the conclusion of the corrective move.
- The release of the RBA minutes will unfold the guidance for further monetary policies.
- Weak oil prices in July may barricade price pressures, however, hawkish Fed bets will remain stable.
The AUD/USD pair is juggling in a narrow range of 0.6808-0.6814 in the early Asian session. The asset has witnessed a steep fall after failing to overstep the crucial hurdle of 0.6850 on Monday. The major is eyeing a cushion around 0.6800 as the release of the minutes from the Reserve Bank of Australia (RBA) is expected to strengthen the aussie bulls. On a broader note, the antipodean is performing stronger against the greenback and the corrective phase is expected to get concluded sooner.
The minutes from the RBA for July’s monetary policy meeting will unveil the agenda behind the interest rate elevation. RBA Governor Philip Lowe announced a consecutive rate hike by 50 basis points (bps) so as to bring the inflation rate under the desired figure. The minutes will also provide a detailed study of the economic condition of Australia. Apart from that, the viewpoint on further guidance will be of utmost importance.
Meanwhile, the US dollar index (DXY) is struggling to sustain above 107.40 after a pullback move from near 107.00 as investors are expecting that the price pressures in the US economy are near their peak levels. The consensus is backed by vulnerable oil prices in July and likely lower aggregate demand. Expectations for slippage in the overall demand will shift the raw-material prices lower and therefore, result in a sigh of relief for the inflation rate. Although the odds for a mega rate hike by the Federal Reserve (Fed) will remain stable.
- EURUSD is oscillating around 1.0440, upside remains favored on weaker DXY.
- The ECB is set to elevate its interest rates for the first time in 11 years.
- Price pressures have impacted Consumer Confidence in Eurozone and the US.
EURUSD price is displaying back and forth moves in a minute range of 1.0139-1.0146 in the early Tokyo session. The asset has displayed a corrective phase after a sheer upside move. The pair turned into correction mode after failing to overstep the crucial resistance of 1.0200 on Monday. The major has renewed its weekly high at 1.0201 and is likely to extend gains as the corrective move will turn into a bullish impulsive wave ahead.
The US dollar index (DXY) has attempted a rebound after witnessing a vertical downside move. The asset has rebounded after picking bids from near 107.00. The pullback move by the DXY after a sharp correction is expected to over soon as the asset has reached near the potential resistance of 107.50 and may initiate its south-side move again. The market participants will capitalize on the bargain sell and will initiate shorts on the counter.
Also Read: EUR/USD Forecast: EUR corrects higher ahead of critical ECB decision

ECB to step up interest rates for the first time in 11 years
Price pressures trim Consumer Confidence in Eurozone and the US
Soaring price pressures in the Eurozone and the US have trimmed the Consumer Confidence in their respective economies. Higher inflation rates and lower earnings have resulted in a very real income shock for individuals. Their paychecks are unable to address their recurring savings and consumption pattern. The eurozone will report its Consumer Confidence data on Wednesday, which is seen at -24.5 vs. -23.6. The University of Michigan has already reported the Consumer Sentiment Index (CSI) data. The sentiment data improved minutely but remained near the two-year low.
-637937804531051886.png)
EURUSD to extend rally on hawkish ECB bets
EURUSD price is likely to recapture Monday’s high near 1.0200 as the odds of a rate hike by the European Central Bank (ECB) are advancing vigorously. Price pressures are impacting the paychecks of the households and ECB policymakers are left with no other choice than to tap for interest rate elevation. The ECB has already concluded its Asset Purchase Program (APP) to squeeze liquidity from the market. It is worth noting that the ECB is going to elevate its interest rates for the first time in the past 11 years.
Gas-related concerns escalate in Eurozone
The major catalyst that could turn the firm rally of the EURUSD price into turmoil is the escalating gas-related concerns in eurozone. The eurozone is already facing the heat of an energy crisis after its promise to lower its dependency on oil and energy imports from Russia after its invasion of Ukraine. The Russian Gazprom company has declared force majeure on supplies and said it could not guarantee gas supplies to Europe because of "extraordinary" circumstances.
Stable Eurozone HICP numbers are expected
EURUSD is expected to display wild moves as Eurostat will report the Harmonized Index of Consumer Prices (HICP) on Tuesday, which is seen stable at 8.6% on an annual basis. Steady HICP figures in the eurozone are expected to delight the European Central Bank (ECB) as they won’t require moving furiously toward raising interest rates. Other Western nations are reporting a steep rise in their inflation rates. Also, the expectations are also stalling higher.
-637937804687614703.png)
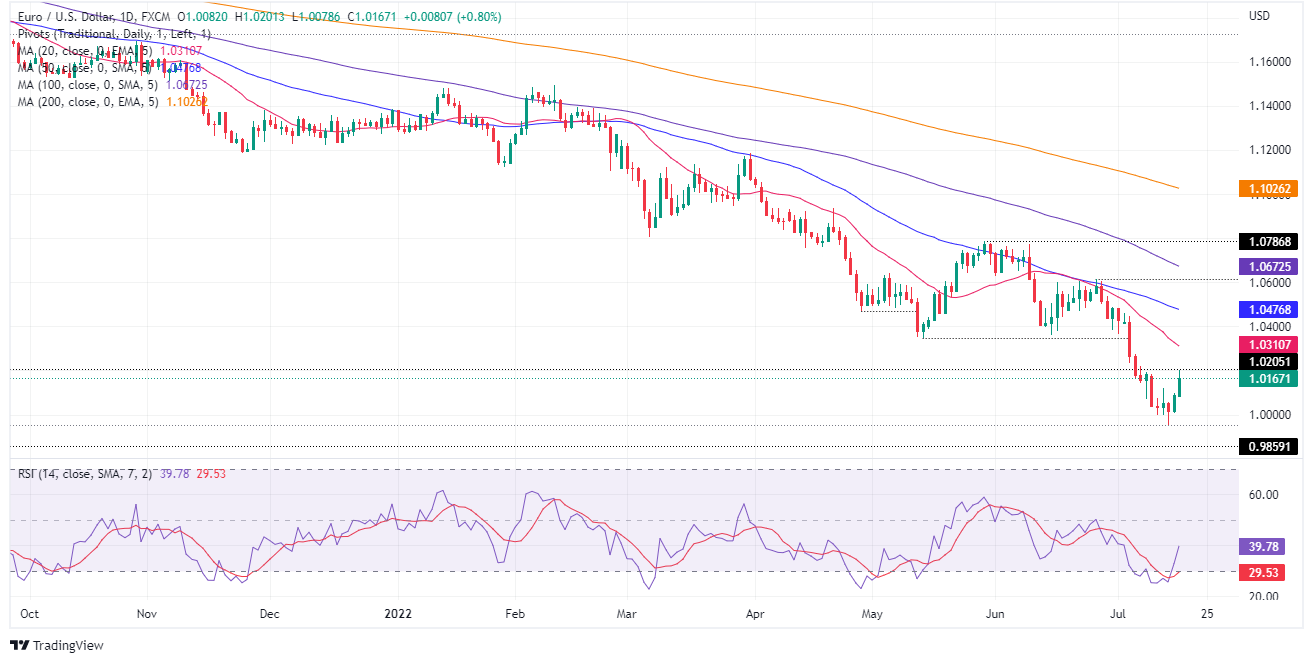
EURUSD technical analysis
EURUSD has attempted to kiss the 38.2% Fibonacci retracement (which is placed from June 28 high at 1.0615 to July 14 low at 0.9952) at 1.0207. The trendline placed from July 14 low at 1.0207 adjoining July 15 low at 1.0008 will act as major support for the counter.
The pair has crossed the 50- and 200-period Exponential Moving Averages (EMAs) at 1.0106 and 1.0130 respectively, which adds to the upside filters. It is worth noting that the 200-period EMA is still higher than the 50-EMA while the asset has crossed both firmly. This indicates a strong responsive buying action after a steep downside.
Meanwhile, the Relative Strength Index (RSI) (14) has slipped below the bullish range of 60.00-80.00 amid a correction.
EURUSD hourly chart
-637937801531105461.png)
Elliott Wave trading strategies: DAX 40, FTSE 100, STOXX 50, Dollar Index, EUR/USD
- GBP/JPY rose close to 190 pips but retraced almost 100 pips, on market mood turning soar.
- The cross-currency pair tumbled below substantial resistance, exposing the 165.00 mark to selling pressure.
- GBP/JPY Price Analysis: Neutral-upwards, but downside risks remain if sellers drag prices below 165.00.
The GBP/JPY finished Monday’s trading session in positive territory, up 0.45%, after reaching a daily high at 166.09, in the middle of the US session, to then tumble on recession fears that some US companies, namely Apple and Goldman Sachs, said that they would halt hiring, meaning that businesses are bracing for slower economic growth.
That said, the GBP/JPY is trading at 165.06 at the time of writing, as Tuesday’s Asian Pacific session begins, around the daily pivot and the 20-hour EMA.
GBP/JPY Price Analysis: Technical outlook
GBP/JPY Daily chart
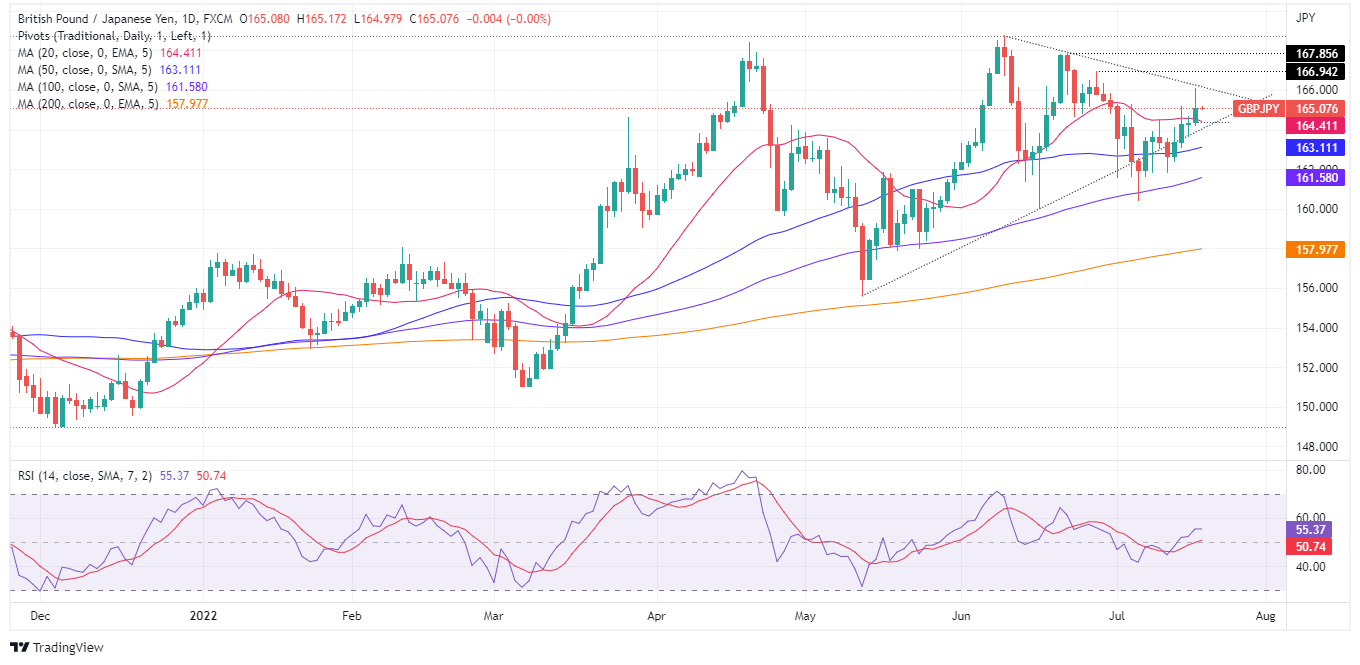
The GBP/JPY is still neutral-upwards biased, with the daily EMAs below the spot price. GBP/JPY traders should notice that whilst the previously mentioned are still bullish positioned, they are closing to price action, meaning that the uptrend is losing steam. Also, the Relative Strength Index (RSI) turned from bullish to flat, meaning that the GBP/JPY price might be about to top, opening the door for shorts.
If that scenario plays out, the GBP/JPY first support would be 165.00. Break of the double-zero support will send the cross towards the 20-day EMA at 164.41, followed by the 50-day EMA at 163.11. Otherwise, if the GBP/JPY aims higher, the cross first resistance would be July’s 18 daily high at 166.09. Once cleared, the next resistance would be June’s 28 high at 166.94, followed by June 22 cycle high at 167.85.
GBP/JPY 1-hour chart
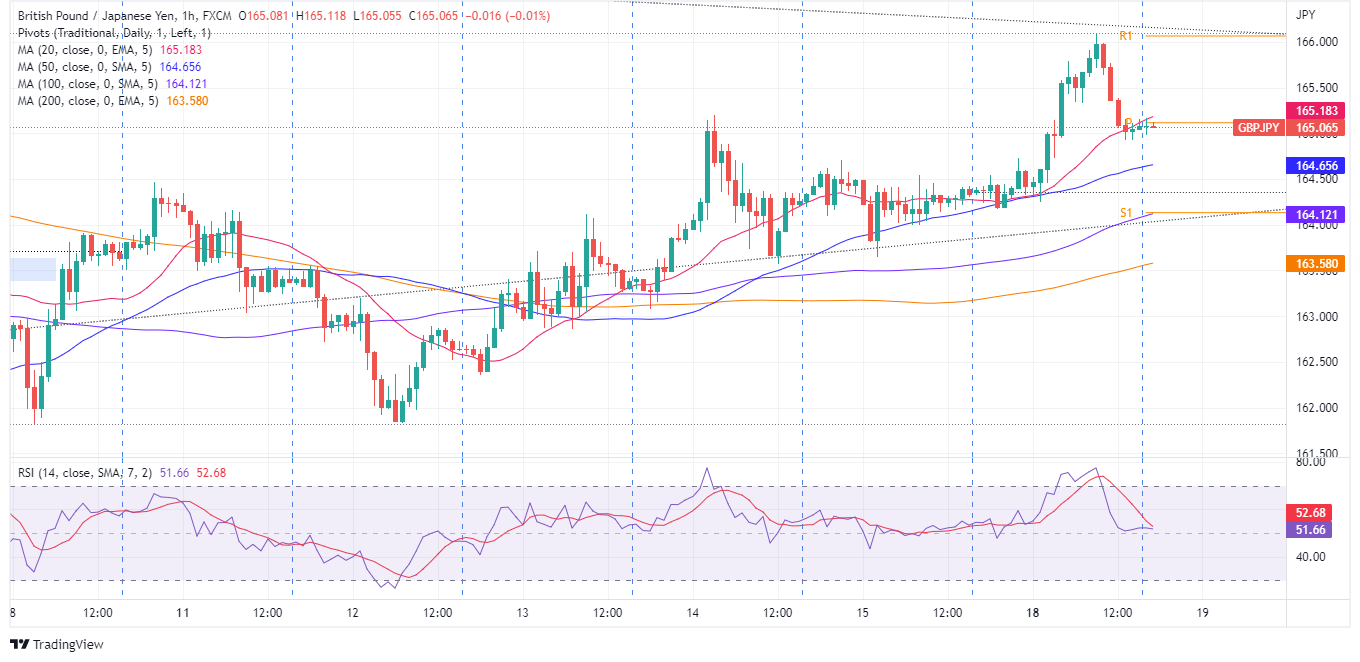
The GBP/JPY near-term perspective depicts the pair as also neutral-upwards. Nevertheless, the later drop in market mood shift sent the cross below July 14 daily high at 165.19, which could open the door for further selling pressure. GBP/JPY traders should be aware that the exchange rate is below the 20-hour EMA at 165.18, usually a sign of bearishness in the near term. Worth mentioning that the GBP/JPY is trading below the daily pivot point, suggesting some solid resistance lies above.
Therefore, the GBP/JPY path of least resistance is downwards. That said, the first support would be the double-zero at 165.00. Break below will expose the 50-hour EMA at 164.66, followed by the confluence of the S1 and the 100-hour EMA At 164.12. Once broken, the next support would be the 200-hour EMA at 163.58.
GBP/JPY Key Technical Levels
- AUD/JPY seesawed within 94.00-94.70s but finished Monday’s session around 94.11.
- Fears about a recession reignited by Apple’s company saying that it would halt hiring.
- AUD/JPY Price Analysis: Neutral-to-upwards, though failure around 94.70s, might open the door for further losses.
On Monday, the AUD/JPY finished almost flat, on a thin liquidity trading session, as Japan was in observance of Marina day, resuming activities on Tuesday, which would see an improvement in Japanese yen crosses, including the AUD/JPY.
The AUD/JPY is trading at 94.13 after opening near the day’s lows, witnessing some selling pressure entering the market at the weekly open, sending the cross towards a daily low below 94.00, followed by a bounce towards its daily highs at around 94.64. However, late news in the US session, stating that the tech giant Apple will halt hiring, fueled recession fears amongst investors.
Also read: Forex Today: Optimism proved ephemeral
AUD/JPY Price Analysis: Technical outlook
AUD/JPY Daily chart
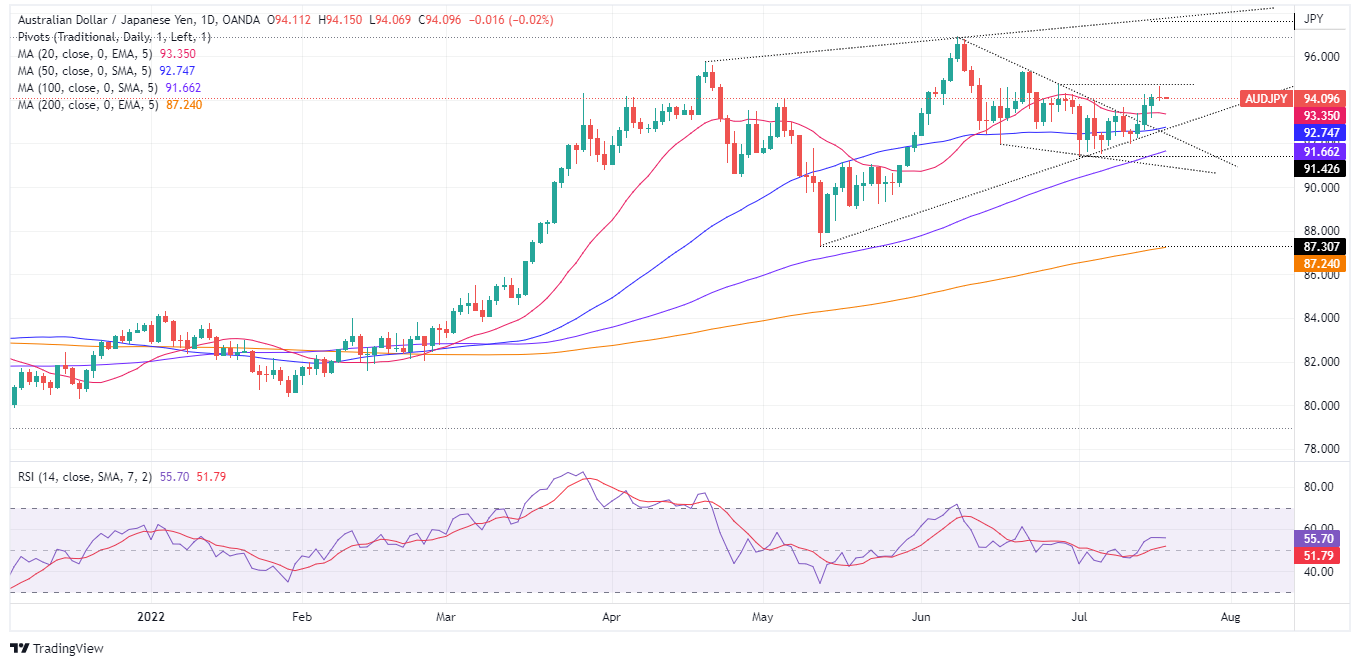
The AUD/JPY depicts the pair as neutral-to-upward biased due to the location of the daily EMAs below the exchange rate. However, its neutral status is derived by price action in consolidation, alongside the Relative Strength Index (RSI), which tumbled from overbought territory towards the 50-midline, faltering to aim higher.
Therefore, the AUD/JPY’s first resistance would be July 18, high at 94.68. Break above will expose the 95.00 mark, followed by the June 21 high at 95.32, which once cleared will expose the YTD high at 96.88
Conversely, the AUD/JPY first support would be 94.00. A breach of the latter will send the cross sliding towards the 20-day EMA at 93.35, followed by the confluence of an upslope trendline and the 50-day EMA near 92.74.
AUD/JPY Key Technical Levels
- GBP/USD is being pressured back to test 1.1950.
- The bears have moved in and a run towards trendline support could be on the cards.
The daily chart's W-formation has seen the price hamstrung towards the neckline area where there is a price imbalance that could be mitigated in the coming sessions to test below 1.19 the figure again.
GBP/USD daily chart
GBP/USD M15 chart
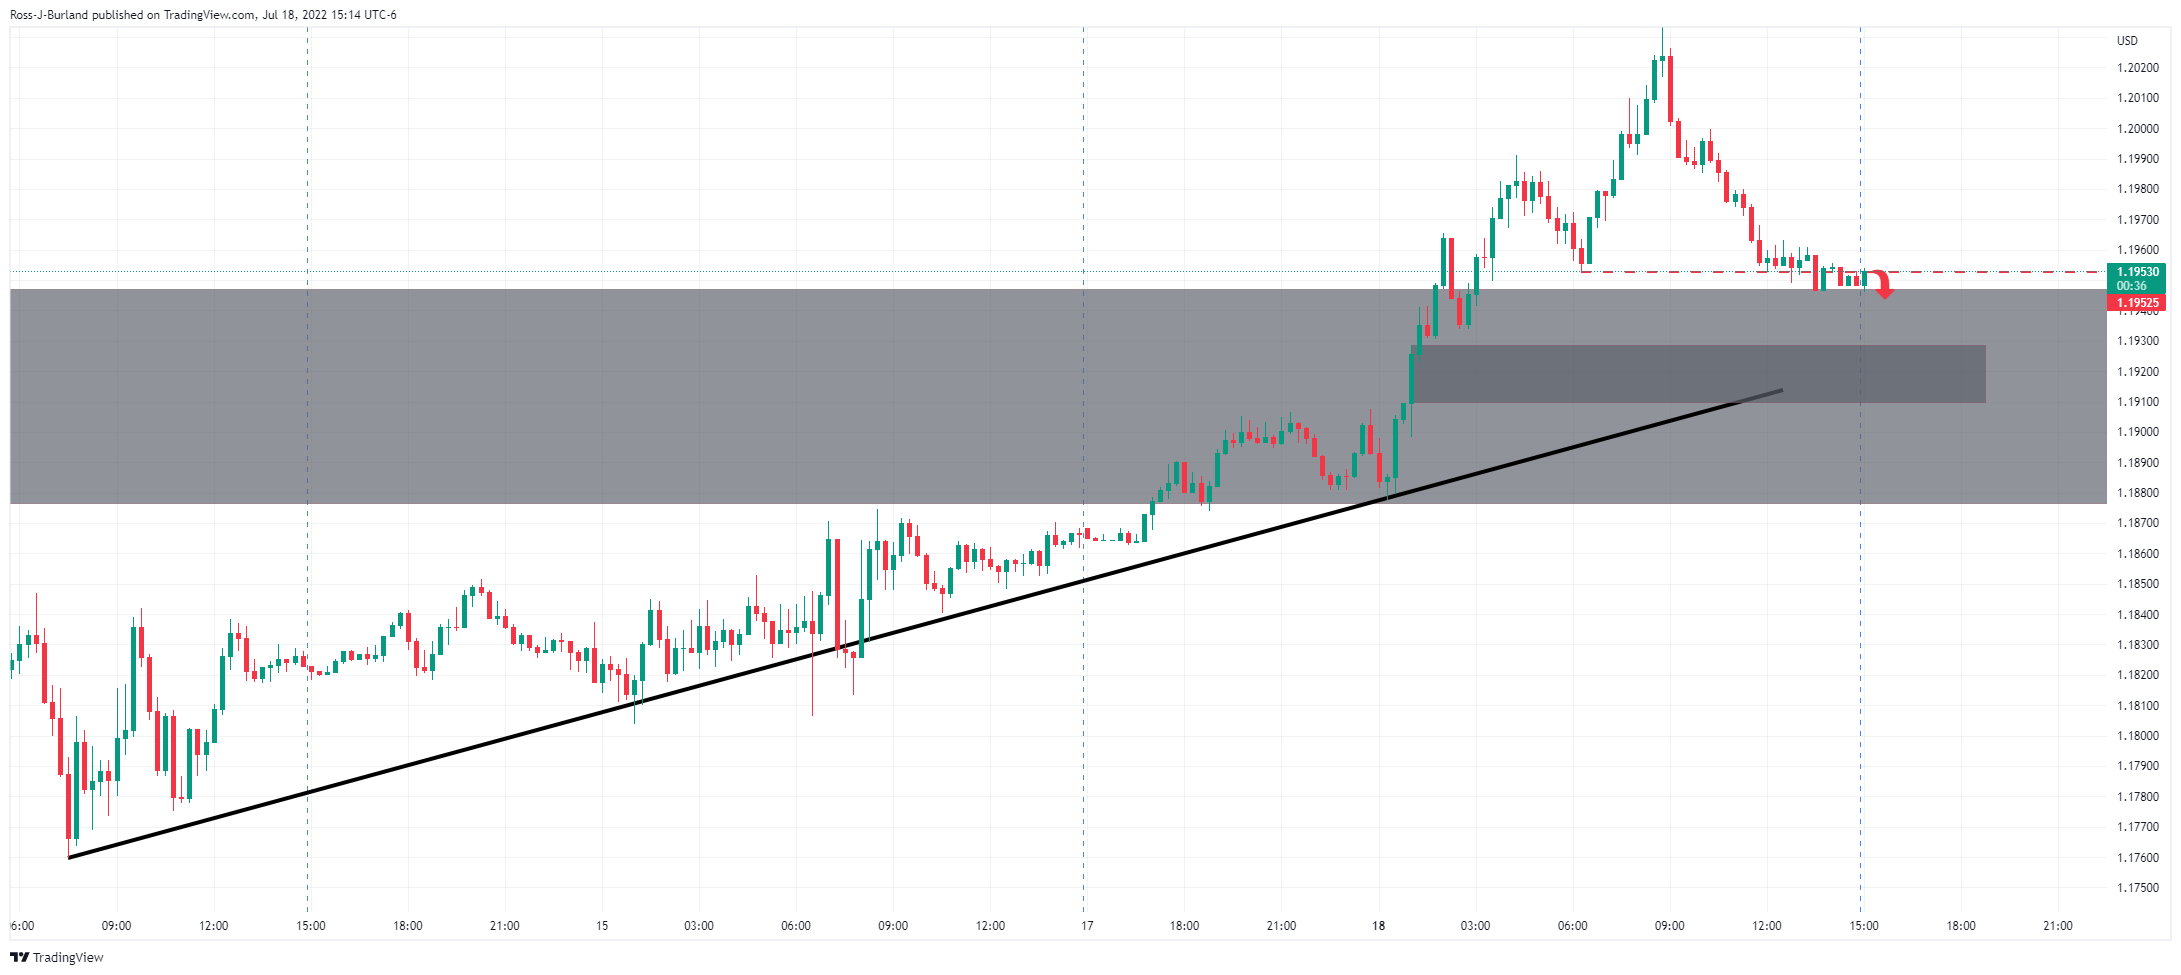
The 15-min chart is accumulated around 1.1950 which could see a breakout to the downside and towards 1.1900 in the day ahead in order to take out the price imbalance within the 1.1880 rally. This will bring the price towards a test the trendline support for the coming days.
- New Zealand inflation topped RBNZ’s and economists’ expectations, will the bank hike 75 bps?
- Sentiment shifted mixed on Apple’s report that hiring will slowdown, reigniting US recession worries amongst investors.
- ANZ Bank expects the RBNZ Overnight Cash Rate (OCR) to end at 4% rather than 3.5%.
The NZD/USD barely recorded gains on Monday, courtesy of a late risk-off impulse spurred by news that the US tech giant Apple plans to slow hiring, fueling US recession fears amongst market participants, which sought safety, which in the FX space, some of the majors, witnessed a trim of its early gains vs. the greenback.
The NZD/USD is trading at 0.6151, up almost 0.06%, after hitting a daily high around 0.6200, but sellers stepped in and outweighed buyers and tumbled the pair towards current price levels.
NZD/USD remains positive on NZ’s high inflation, and expectations of additional hikes
The market mood turned sour, as shown by US equities. The greenback is recovering some ground, as shown by the US Dollar Index, rebounding from daily lows around 106.892 and climbing towards 107.354, though it stays negative by almost 0.60% during the day.
The lack of US economic data leaves traders looking toward last week’s US inflation reports, Retail Sales, and the UoM Consumer Sentiment Index (CSI). US inflation, led by consumer and producer price indices, rose to fresh multi-decade highs, sparked by high energy and food prices. However, the core CPI figure stood below the 6% threshold, falling for the third consecutive month, which would deter Fed officials from triggering a 100 bps rate hike. Further strengthening the case is UoM Consumer Sentiment inflation expectations, which descended from 3.1% to 2.8% in 5 years.
On the New Zealand side, the Consumer Price Index for Q2 rose by 7.3% YoY, higher than the 6.9% estimated by economists and topping the 7% estimated by the Reserve Bank of New Zealand (RBNZ). The NZD/USD reacted positively to the report, jumping from 0.6149 to 0.6170, as further tightening would be needed, as said by analysts at ANZ Bank.
“We have changed our OCR call and now expect the run of 50bp hikes to continue through to November, meaning an OCR endpoint of 4.0% rather than 3.5%. A 75bp hike at the August MPS is a very real possibility, particularly if the labour market data on 3 August delivers another hawkish surprise,” ANZ analysts wrote.
What to watch
The New Zealand economic docket will feature the Global Dairy Trade Price Index on Tuesday. On the US side, the calendar will feature June’s Building Permits and Housing Starts alongside the Redbook.
NZD/USD Key Technical Levels
What you need to take care of on Tuesday, July 19:
The dollar spent most of the first day of the week on the back foot, losing ground against most of its major rivals. However, it bounced back in the US afternoon, as Wall Street was unable to retain its early gains and turned red.
The greenback began easing on Friday as US encouraging data temporarily cooled recession-related concerns. A scarce macroeconomic calendar on Monday kept it on the downside ahead of central banks' decision. The US Federal Reserve entered its blackout period ahead of next week's meeting, while the European Central Bank will announce its monetary policy next Thursday.
The energy crisis in Europe could be a game changer in EUR/USD, which recovered up to 1.0200. The Russian Gazprom company has declared force majeure on supplies and said it could not guarantee gas supplies to Europe because of "extraordinary" circumstances. The International Energy Agency has warned the EU must reduce gas consumption ahead of the winter. The pair currently trades at around 1.0150.
A softer dollar helped GBP/USD to reach 1.2039, but the pair retreated towards the current 1.1960 area amid a worsening mood at the end of the day.
Commodity-linked currencies hold on to most of their early gains, with AUD/USD trading at 0.6815 and USD/CAD at 1.2965. Finally, safe-haven JPY and CHF posted modest gains against the USD.
Gold aimed to recover some ground, but ended the day at around $1,708 a troy ounce and is at risk of falling further. Crude oil prices, on the other hand, retain most of their early gains, with WTI now trading at $98.80 a barrel.
Ethereum Price Prediction: A true bull run or just another suckers' rally?
Like this article? Help us with some feedback by answering this survey:
- Gold Price s correcting the weekly and daily impulses.
- The focus is on the US dollar and the path of the Federal Reserve.
- The 50% mean reversion and a 38.2% Fibonacci retracement are brought into focus.
At $1,079.50c, the Gold Price (XAU/USD) has been attempting to correct as the US dollar pulled back slightly as markets weigh the the prospects of a 75-basis-point interest rate hike over a 100bp hike by the Federal Reserve at its upcoming meeting on July 26-27.
In turn, the US dollar has lost some shine to trade back below 107 on Monday as per the DXY index which measures the greenback vs. a basket of major currencies. It was trading as high as 109.29 in a fresh bull cycle high last week. Overall, both the technical and fundamental bias has been to the downside but a correction is in play in both the US dollar and gold.
To date, within gold's bear cycle, the break in daily market structure and prospects of a strong US dollar as well as higher yields, which gold does not offer to investors, have weighed on the precious metal into pre-pandemic levels. The greenback has tended to strengthen both when the US economy outperforms its peers and also when the US economy looks weak.
Weighing up the Fed
Fedspeak has pushed back against a 100bp hike from some notable hawks, raising the risk of a near-term short-squeeze on the Gold Price prior to the meeting. However, this could create the perfect storm for a downside continuation in gold on a hawkish outcome from the meeting.
The Fed has moved into the blackout period before the next meeting leaving prior statements from Fed speakers following the last meeting and to date for the market to chew on. Ahead of the blackout, the Fed’s Beige Book released last week noted that price increases remained “substantial” across the nation in recent weeks, though some regions saw signs of cooling inflation.
Meanwhile, Fed officials implied that nothing was off the table after the CPI report. US inflation surprised once again to the upside in June, both headline and core measures, with annual inflation jumping to a new four-decade high of 9.1%, up from 8.6% in May. Therefore, supportive of global yields and the US dollar as a headline for gold prices, the market expects that the Fed will be in no rush to signal a pivot from its current path of aggressive rate hikes and is pricing in steeper hikes of 100bs pints for not only in July but September's meeting as well.
At the June FOMC meeting, Chair Powell stated that he would need ‘compelling evidence’ that inflation is easing for the Fed to change course, which he defined as ‘a series of falling monthly inflation readings’. Since then, we have heard from Fed's Raphael Bostic who said “everything is in play” while Mester said there was no reason for a smaller hike. Mary Daly, CEO of San Francisco said 75 bp was her “most likely posture.”
Read more here: Central banks deliver hawkish surprises, what will the Fed do?
The US dollar loses some gloss, supports gold price
The dollar index (DXY) was off its near 20-year high, down 0.6%, making greenback-priced bullion less expensive for buyers holding other currencies. It made a low of 106.892 on Monday which is giving some support to the gold price. Nevertheless, earnings season is upon us. There are likely to be gyrations that could lead to some buying activity in the greenback for its save haven function stemming from its use as an invoicing currency and from the significant amounts of USD-denominated debt issued by non-US residents.
Simply put, in times of uncertainty various market participants take action to secure their access to USDs. In turn, the pull on the gold price is likely to persist, at least until the Fed’s front-loaded policy tightening cycle is near conclusion.
''There is no way around it, the Fed has an inflation problem on its hands and the USD will continue to remain king of FX,'' analysts at TD Securities argued.
Gold Price expectations from TD Securities
Gold prices have crossed the threshold for a trend reversal, marking confirmation of a bear market trading regime in the yellow metal, for the time being, the analysts at TD Securities said. Their ChartVision Trend analytics highlighted that a break below the $1821/oz level by September would cement a downtrend in the yellow metal.
''With gold bugs falling like dominoes, prices have since slashed through various support levels on their way towards the $1600/oz-handle. With prices now challenging pre-pandemic levels, the largest speculative cohort in gold will start to feel the pain under a hawkish Fed regime as their entry levels are tested.''
Finally, the analysts argue that considering the latest CFTC report highlights that although a massive amount of longs was liquidated over the past week, the prop-trader cohort continues to hold an extremely large position size. Therefore, ''in a liquidation vacuum, these massive positions are most vulnerable, which suggests the yellow metal remains prone to further downside still.''
Gold Price technical analysis
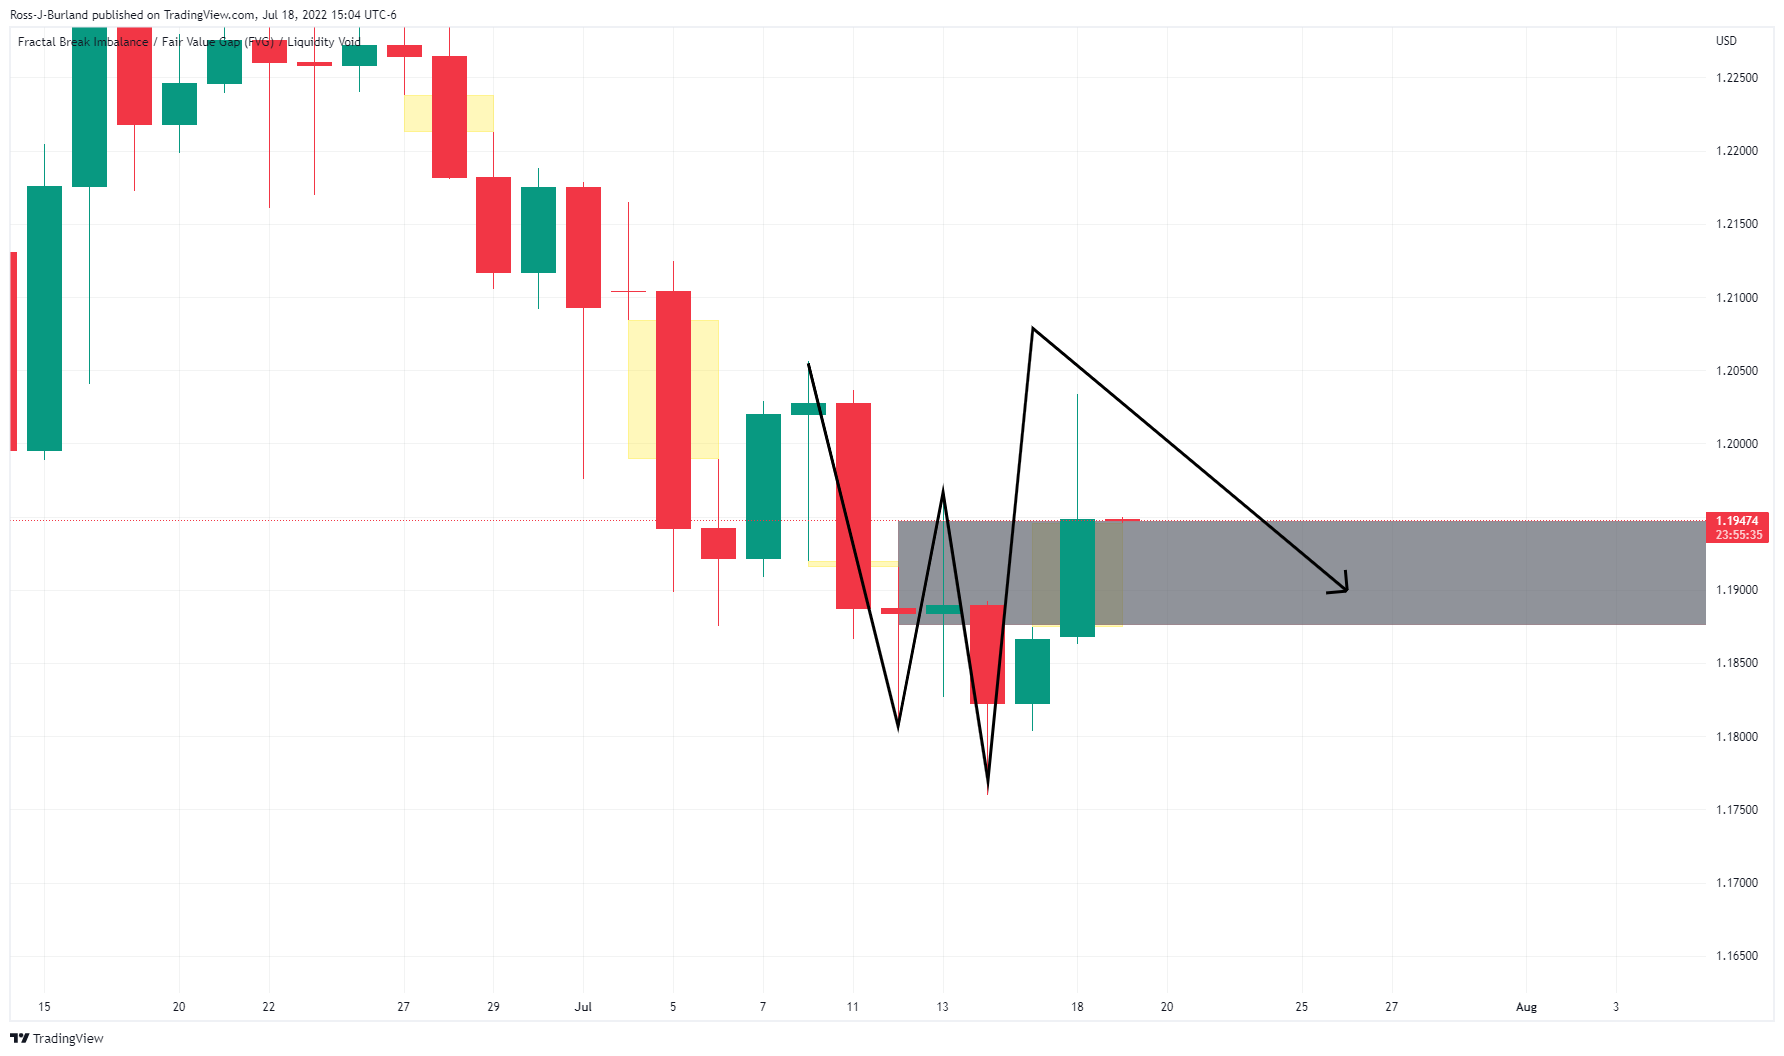
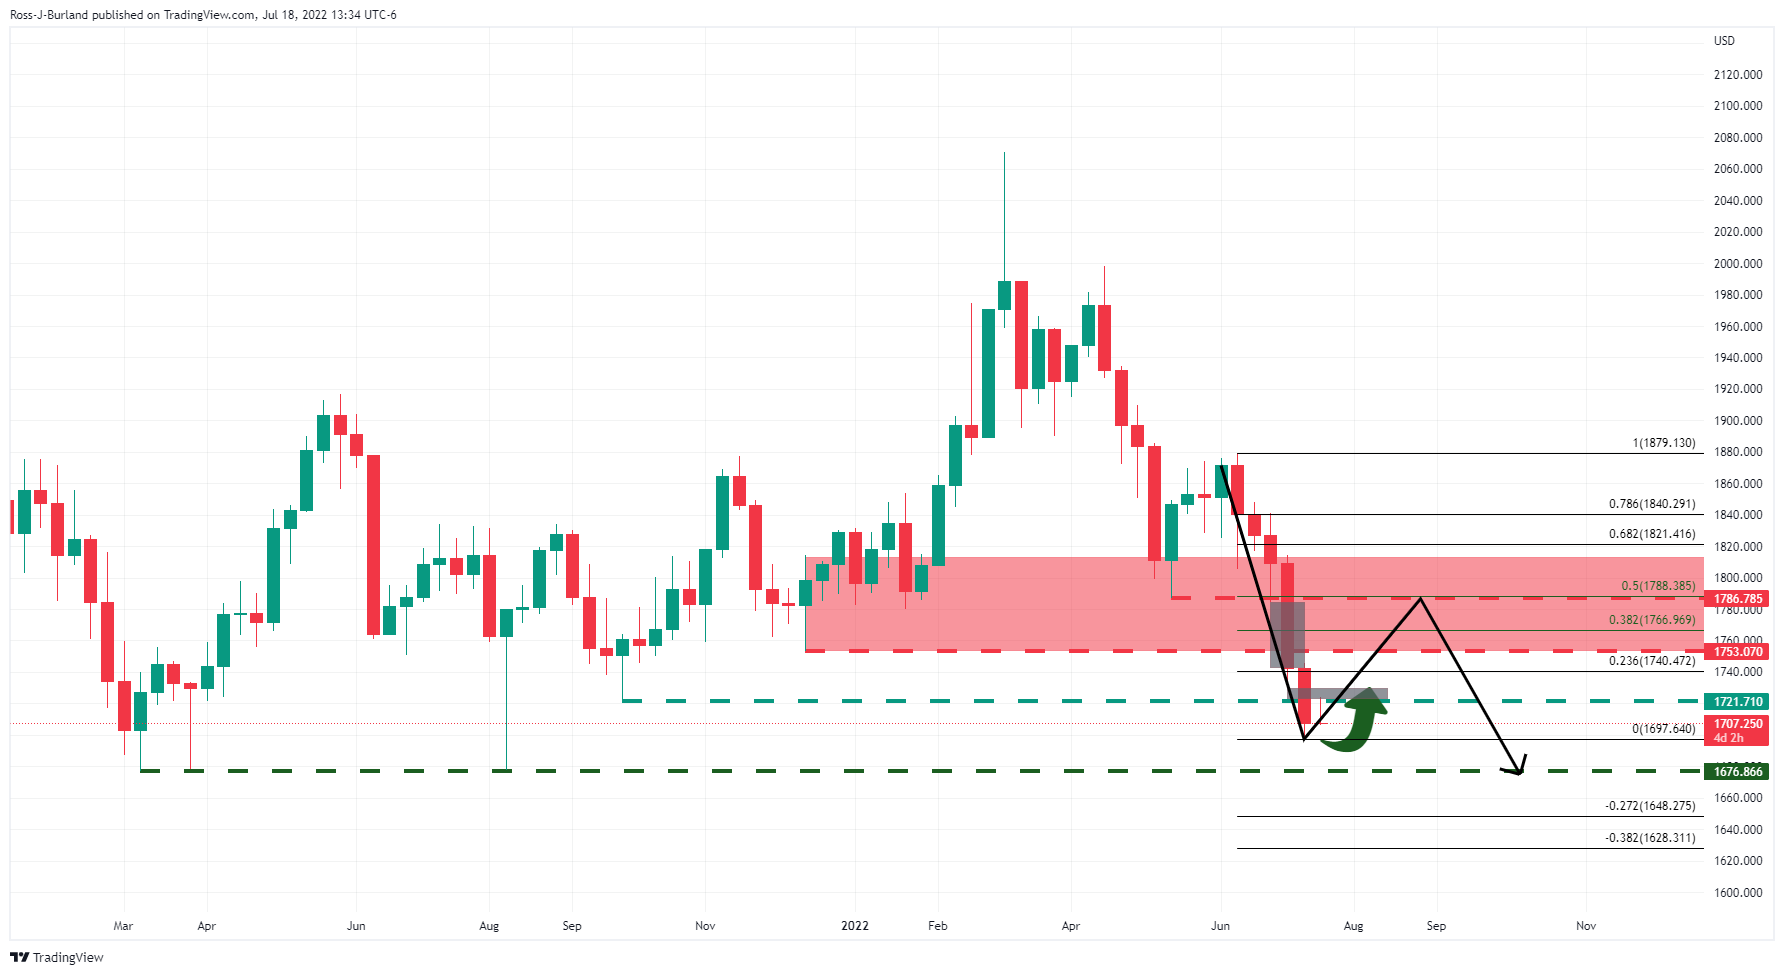
The Gold Price has broken structure on the daily chart but a correction is now in play:
From a weekly perspective, the price could also be regarded as extended and a correction is arguably feasible at this juncture. There are price imbalances as marked in grey in the chart below which could be mitigated in the coming days and or weeks. In doing so, the Fibonacci retracement scale can be drawn up to find confluences in these imbalances to help identify probable areas of interest. This brings in the 50% mean reversion and a 38.2% Fibonacci retracement before then into focus. However, the monthly lows of $1,676.86 as illustrated on the chart below could come within reach sooner than later:
Gold, Silver & Crude Oil Price Forecast: 18 - 22 July 2022
- XAGUSD marches firmly, gaining almost 0.50% on Monday.
- Market players’ sentiment shifted negatively on Apple’s news that would slow hiring, reigniting recession fears.
- Silver Price Forecast (XAGUSD): In the near term is neutral-to-upward biased and might test $19.00.
Silver (XAGUSD) barely recovers some ground but remains trading below the $19.00 mark on Monday, amidst a trading session characterized by a mixed sentiment, which turned sour, despite some solid US corporate earnings, though of late, news of the giant Apple saying that it plans to slow hiring, turned things upside down, reigniting investors recession fears.
XAGUSD is trading at $18.73, after opening near $18.60s, the lows of the day, and edged up, hitting a daily high at $19.01, before retracing below the 100-hour EMA at $18.79, which once broke, would exacerbate a move towards the daily pivot point at $18.55.
Silver remains steady, despite mood shifting mixed
Sentiment shifted from positive to negative. Silver traders should notice that Apple news regarding employment keeps recession worries lingering in investors’ minds and further reinforces the previously mentioned, is the inversion of the US 2s-10s yield curve for the tenth straight day at -0.201%. All that said, it might deter Fed policymakers from moving above the 75 bps rate hike, which could keep US Treasury yields lower, a tailwind for XAGUSD’s prices.
Last week’s data, led by US inflation at higher levels, namely consumer and producer price indices, was higher than expected and hit fresh multi-decade highs. Nevertheless, core CPI stood below the 6% threshold, falling for the third consecutive month, portraying a better-than-expected outlook for inflation. Further strengthening the case is UoM Consumer Sentiment inflation expectations, which descended from 3.1% to 2.8% in 5 years. That said, Fed officials, which entered the blackout period on Saturday, were vocal in supporting a 75 bps hike in July, except for Atlanta’s Fed President Bostic, which said: “everything is on the table” after a dismal CPI report.
In the meantime, the US Dollar Index, a gauge for the greenback’s value vs. its peers, slides 0.58%, sitting at 107.360, faltering to follow suit the US 10-year benchmark note, which is rising four basis points, yielding 2.965%, at the time of typing.
What to watch
The week ahead will reveal critical economic data in the Euro area. Eurostat will report inflation for the bloc on Tuesday, and the ECB will deliver its monetary policy decision. The ECB is expected to raise rates for the first time in 11 years.
On the US front, the calendar will be packed with Housing Starts, Building Permits, Existing Home Sales, Initial Jobless Claims, and July’s S&P Global PMIs.
Silver Price Forecast (XAGUSD): Technical outlook
From the daily chart perspective, XAGUSD is still downward biased, though the Relative Strength Index (RSI) at 31.00, just exited from oversold conditions, might open the door for a test of $19.40. However, silver traders would first need to reclaim $19.00 if they aim to increase prices.
XAGUSD, in the short term, is neutral-to-upward biased, capped by the 200-hour EMA at $18.99 and the 20-hour EMA at $18.85. However, on the flip side, the 100 and 50-hour EMAs, each at $18.79 and $18.62, respectively, are seen as solid buying levels, putting a lid on selling pressure.
If the XAGUSD heads downwards, the first support would be the 50-hour EMA at 18.62. Break below will expose the daily pivot at 18.55, followed by the S1 daily pivot point at 18.33. On the flip side, XAGUSD’s first resistance would be the confluence of the 20 and 200-hour EMAs around $18.85-99. A breach of the latter would expose the R2 daily pivot at $19.14, followed by July 13 high at $19.40.

- AUD/USD awaits a speech by RBA's Lowe that should shed some light.
- The Fed is in a blackout period ahead of the FOMC.
- A 50% mean reversion could unfold in the coming days.
At 0.6827, AUD/USD is trading between a 0.6784 and 0.6854 range but is higher by 0.5% on the first trading day of the week in midday New York trade. However, the pair is significantly higher than the fresh bear cycle low that was printed last week which was the lowest it has been since June 2020, at 0.6682.
Net AUD short positions have moved higher reflecting concerns over the outlook for commodity prices. However, the Aussie is showing some signs of resilience which could be down to the economic rebound from Covid lockdowns, as noted by analysts at Westpac.
''Australia's domestic economy continues to provide the Aussie with support. June business confidence and July consumer sentiment fell but hard data on the likes of retail spending and employment remain consistent with a strong rebound from Covid lockdowns,'' the analysts explained. ''Australian jobs surged 88K in June, slashing the Unemployment Rate from 3.9% to just 3.5%, the lowest since 1974.''
The data was important and the Aussie firmed the sentiment surrounding the reserve Bank of Australia. ''The booming jobs data sparked debate over whether the RBA might speed up the pace of tightening with a 75 basis point cash rate rise in August (especially in the wake of Q2 CPI data on 27 July),'' the analysts explained. However, they are maintaining their call for another 50bp move, to 1.85%. Market pricing is around +55bp. A speech coming up by Governor Lowe should shed some light on the debate.
Eyes on the Fed
As for the US dollar, markets are gearing up for the Federal Reserve meeting on 26-27 July FOMC meeting. The Fed speakers are now in the blackout period and the conclusion from the hawkish rhetoric in statements made by Fed speakers between the last meeting to date is that while US June inflation was even higher than expected, 9.1% year from 8.6% year in May, there is more of a bias of a 74bp move over a 100bp hike. In turn, the US dollar has lost some shine to trade back below 107 on Monday as per the DXY index which measures the greenback vs. a basket of major currencies. It was trading as high as 109.29 in a fresh bull cycle high last week.
AUD/USD technical analysis
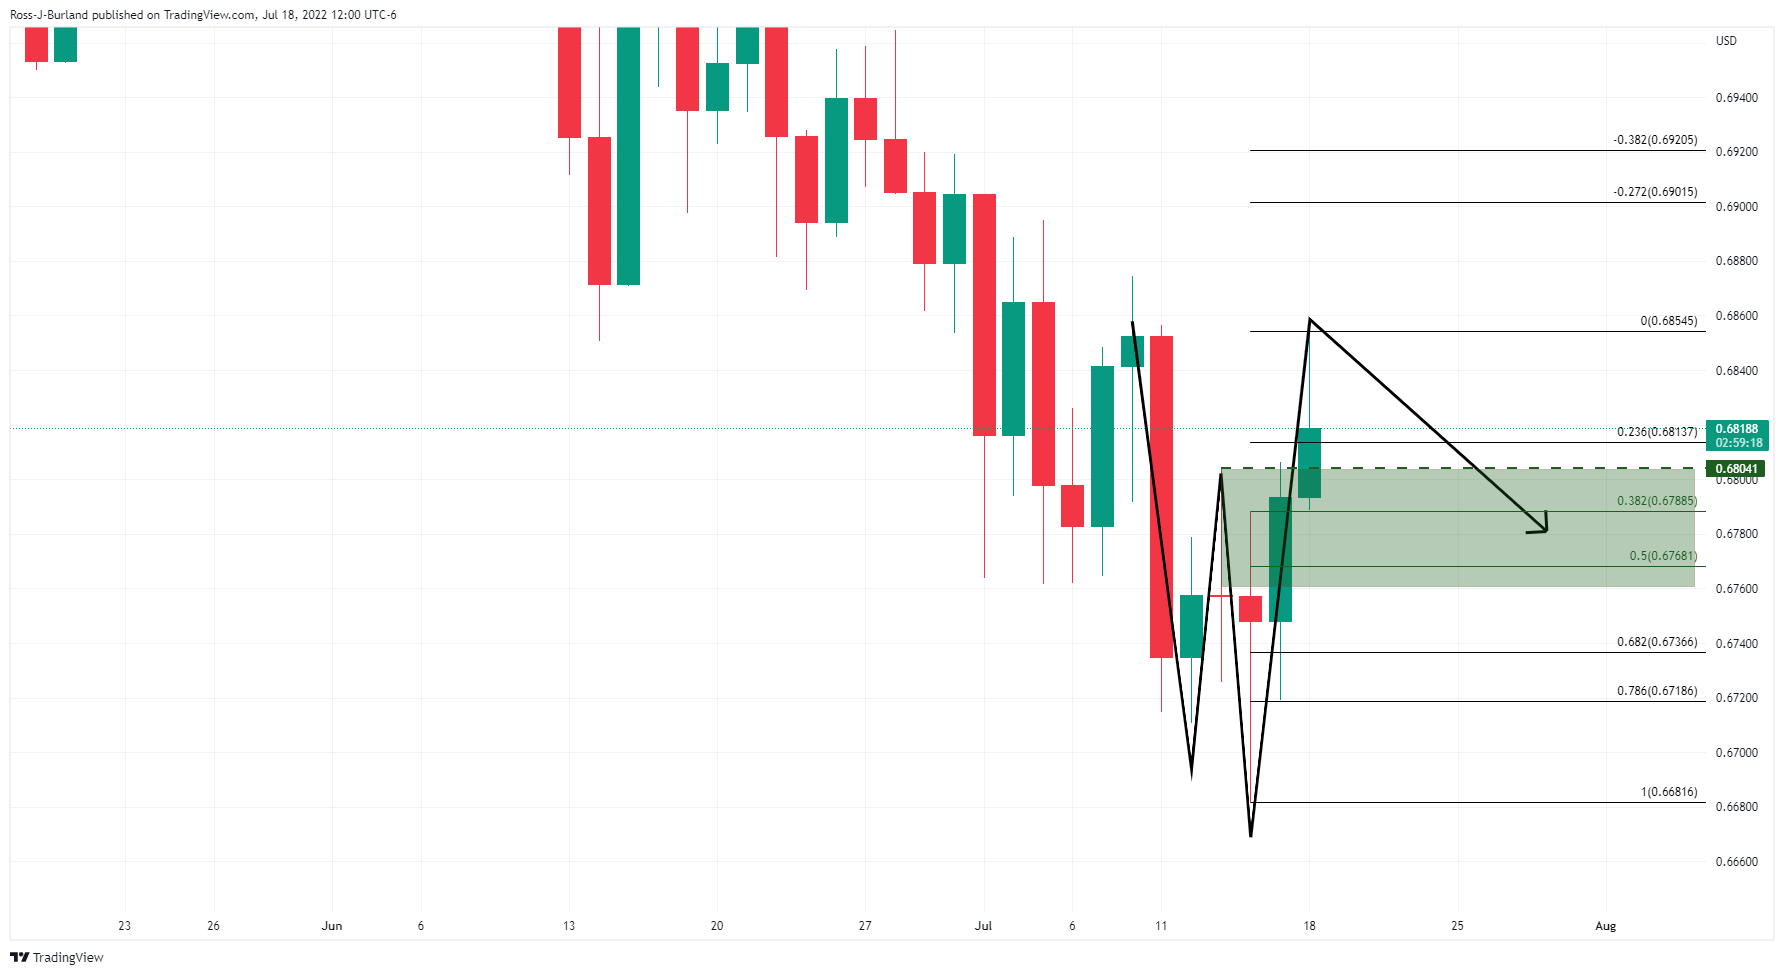
The W-formation is a reversion pattern which can be expected to draw in the price to the area around the neckline as illustrated above. In this daily scenario, there are prospects of a retracement to the 38.2% Fibonacci and the 50% mean reversion target thereafter.
- USD/JPY wobbles in a 70-pip range but stays in losing territory, down 0.27%.
- Risk appetite dented demand for the greenback, which stumbles by almost 0.80%, as shown by the US Dollar Index.
- USD/JPY Price Analysis: Rising wedge in the daily chart might open the door toward July’s lows around 134.70s.
The USD/JPY falls for the second straight day, hitting a daily low near 137.89, amidst an upbeat sentiment, as shown by global equities climbing; while the greenback recoils from 108.000, as demonstrated by the US Dollar Index, tumbling almost 0.80%, at 107.192.
The USD/JPY is exchanging hands at 138.09, seesawing within a narrower 70-pip range, which witnessed the major hitting a daily high at 138.57 before diving and piercing below 138.00, but once the dust settled, buyers reclaimed the 138.00 mark on a thin liquidity day because Japanese markets were closed on Monday, and no economic data was released.
USD/JPY Price Analysis: Technical outlook
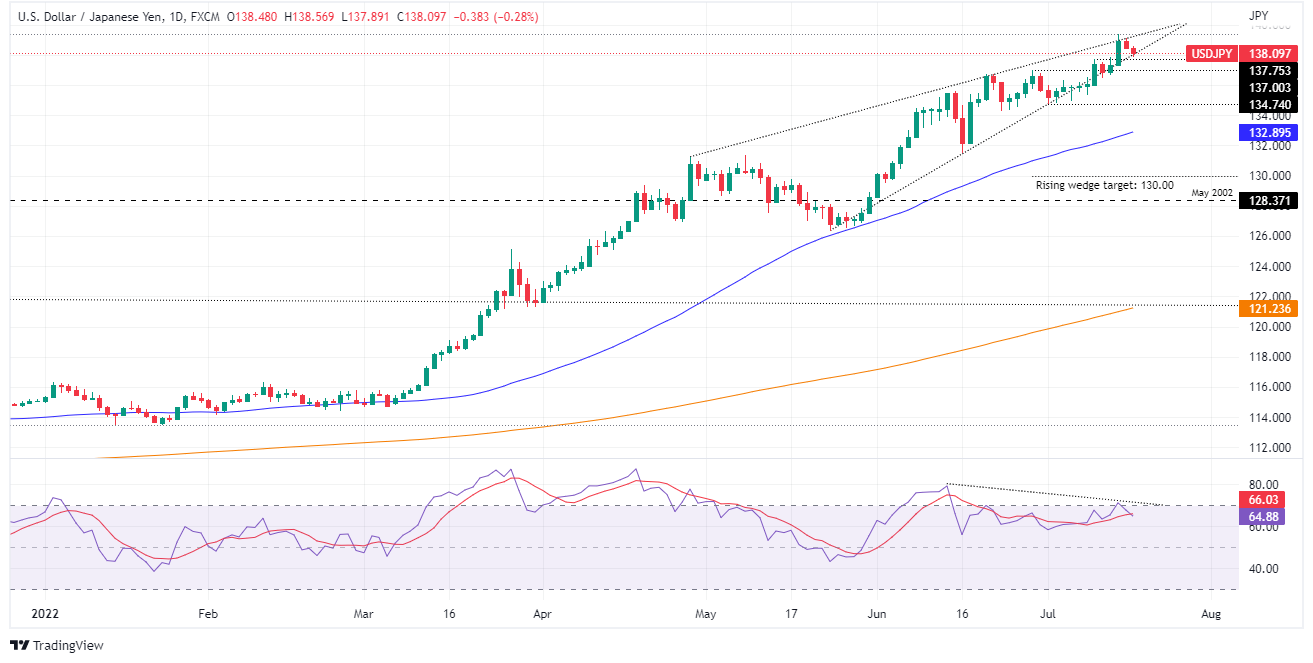
USD/JPY Daily chart
The USD/JPY daily chart depicts the major as upward biased, despite showing signs of losing steam after hitting a 24-year high of around 139.38. Traders should be aware that a rising wedge is still in play and, as portrayed by the price action, stays confined within the top-bottom trendlines of the aforementioned chart pattern, meaning the USD/JPY is about to break in either way.
If the USD/JPY ends upwards, the USD/JPY’s first resistance would be 139.00. A breach of the latter will expose the YTD high at 139.38. Once cleared, the 140.00 mark will be open for a challenge, on the USD/JPY way towards August 1998 high at 147.67.
On the flip side, the USD/JPY first support would be July 11, high at 137.75. Break below will expose the June 29 daily high at 137.00, followed by a test of the July 1 low at 134.74.
USD/JPY Key Technical Levels
- EURUSD begins a crucial week on the right foot, up by 0.82%.
- Last week’s US consumer-related data calmed traders’ expectations of a 100 bps Fed hike.
- EURUSD traders are awaiting the EU’s inflation data and ECB’s monetary policy decision.
EURUSD buyers extended the shared currency gains to two consecutive days after hitting a fresh 20-year low below parity. Since then, the EURUSD pair has not looked back and reached a new two-week high near 1.0200 before settling at around current price levels. The EURUSD is trading at 1.0167 at the time of writing.
The financial markets narrative remains unchanged. Worries of higher inflation, central banks tightening, and recession jitters linger on investors’ minds. Nevertheless, global equities climbed on positive US equity earnings, signaling that companies are preparing for further Fed tightening, while Investors shrugged off China’s coronavirus outbreak, which threatened to keep the supply chain disrupted and consequently higher prices. That said, the greenback is losing 0.73%, underpinning the EURUSD, which will be pressured due to EU inflation data, the ECB’s monetary policy decision, and US S&P Global PMIs by the end of the week.
US Inflation grabbed the attention, but Retail Sales and Consumer Sentiment tempered Fed intentions of going 100 bps
US Retail sales, dented Fed officials of going 100 bps
Last week’s data give USD buyers enough reasons to book profits ahead of the ECB’s monetary policy decision, one of the reasons for the EURUSD appreciation. US Retail Sales and the UoM Consumer sentiment exceeded estimations and tempered worries of a Federal Reserve 100 bps rate hike, which last Wednesday showed odds of an 80% chance, sparked by CPI topping above 9% YoY, further exacerbated by PPI above the 11% YoY threshold.
EURUSD traders are awaiting the ECB’s monetary policy decision

ECB's monetary policy meeting on Thursday
The EURUSD will have a volatile week as the ECB’s monetary policy decision lurks. The central bank is widely expected to hike rates by 25 bps, for the first time in 11 years, amidst a period of elevated inflation and energy bills soaring due to the Russian oil embargo. Despite ECB’s hawkish member’s expressions of looking for a 50 bps move, the ECB President Christine Lagarde expressed intentions of tiptoeing with a 25 bps move, opening the door for a larger hike in September, namely a 50 bps.
EU’s inflation in the spotlight ahead of the ECB meeting
On Tuesday, Eurostat is expected to unveil June’s HICP final inflation rate for the Euro area. Estimations lie around 8.6% YoY, higher than the 8.1% of the May reading. In the meantime, core inflation stood at 3.7% YoY, lower than May’s 3.8%. That shows that Europe’s and US inflation are underpinned by high energy and food prices, spreading worldwide, keeping central banks under pressure. If the report beats the expectations, EURUSD traders should be aware of surprises by the ECB, but due to the economic slowdown, the ECB would stick to 25 bps.
US recession fears remain as the US 2s-10s yield curve stays inverted
In the meantime, the US 2s-10-yield curve extends its inversion for the tenth straight day, though less profound than on previous days- At the time of writing, the spread reduced to -0.181%, as traders’ fears about recession calmed. Nonetheless, unless Fed policymakers express concerns about economic growth, that would not deter them from aggressive tightening, which is negative news for EURUSD longs in the future.
ECB vs. Fed differentials, a headwind for the EURUSD
In July, both banks, the ECB and the Federal Reserve will host their monetary policy meetings. Currently, the ECB’s deposit rate lies at minus 0.50%, while the US Federal Reserve’s Federal funds rate (FFR) is at 1.75%, bolstering the appetite for the greenback. With expectations of the ECB hiking 25 bps and the Fed to move at least by 75 bps, differentials would widen further, to -0.25% (ECB) vs. 2.50% (Fed), meaning that the greenback would keep the upper hand, opening the door for further selling pressure on the EURUSD.
EURUSD Price Technical outlook
EURUSD buyers have stepped in, though the major remains downward biased, with the daily moving averages (DMAs) residing well above the exchange rate. The ongoing upward correction is attributed to EURUSD shorts booking profits, causing a rally towards a fresh six-day high above 1.0200.
If EURUSD buyers keep control, the major’s first resistance would be 1.0200. A breach of the latter will expose the July 6 daily high at 1.0276, followed by the 20-day EMA at 1.0310.
On the flip side, the EURUSD first support would be 1.0100. Break below will expose the fresh 20-year low at 0.9952. Once cleared, EURUSD sellers’ next challenge will be December 2002 lows around 0.9859.
EURUSD Key Trading Levels For The Week Ahead
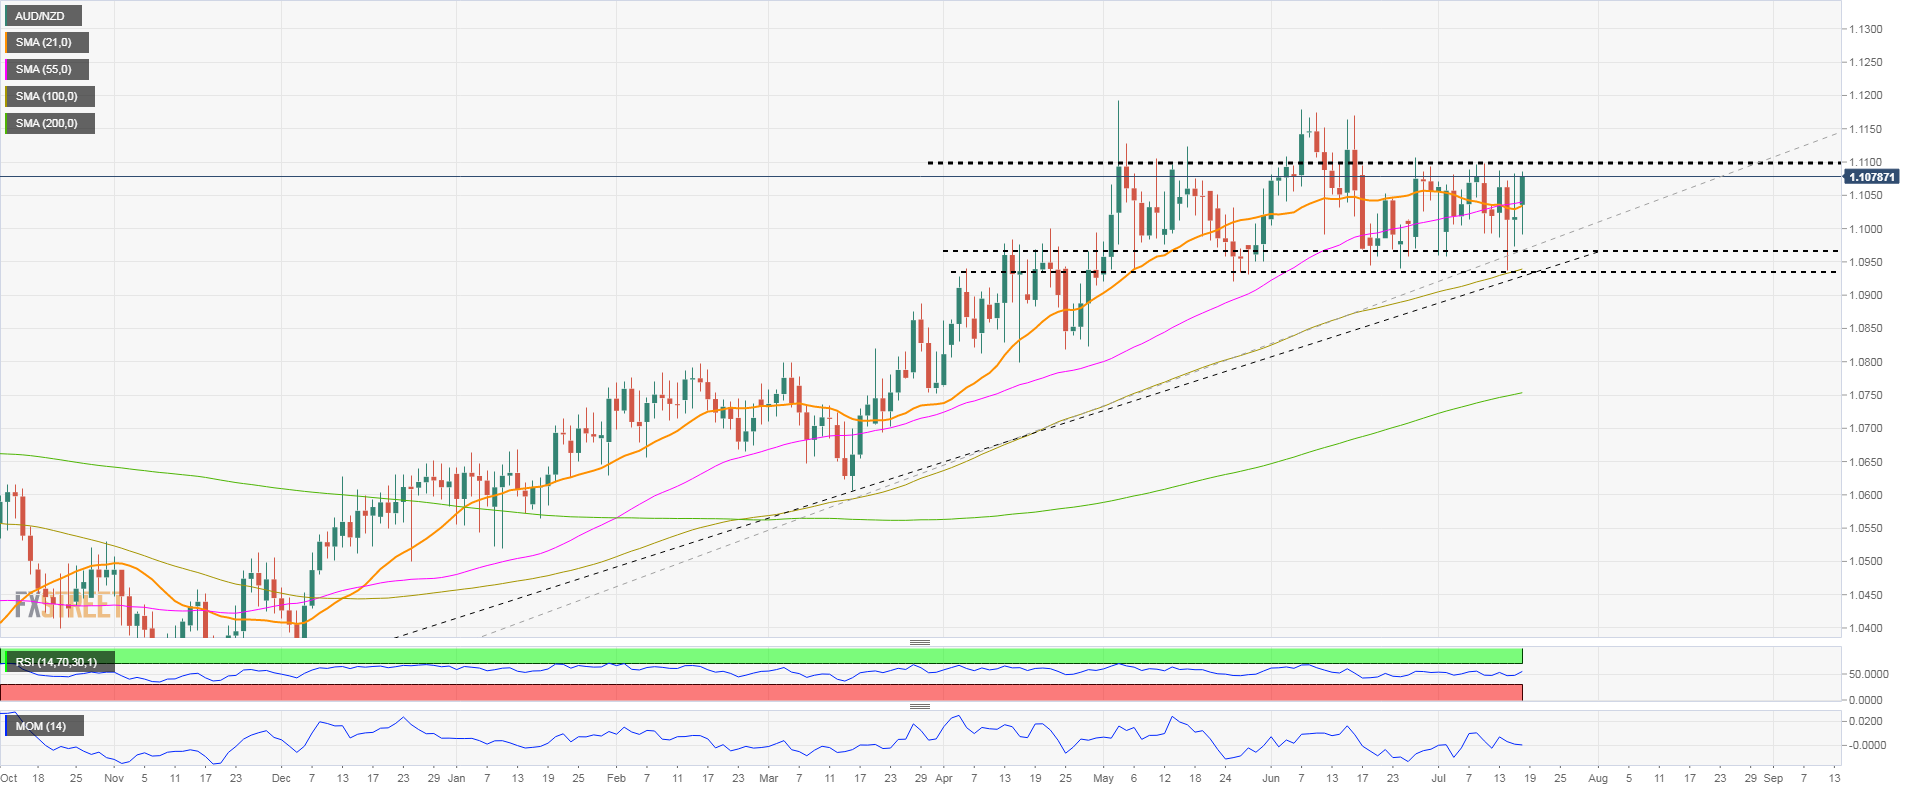
- AUD/NZD continues to move sideways, around the 20 and 55-day SMA.
- Medium-term bullish rally faces resistance at 1.1100.
- Key event ahead: RBA meeting on Tuesday.
The AUD/NZD cross continues moving sideways below 1.1100. The 1.1100 area caps the upside. A break higher should strengthen the aussie, and would target 1.1150 initially and then a test of 1.1180.
The 20 and 55-day Moving Simple Moving averages are flat near the current price, reflecting how the cross has been trading during the last thirty days. Technical indicators offer no clear signs, also affected by recent price action.
On the flip side, a consolidation below 1.1000 should expose an uptrend line at 1.0970. A break lower would open the doors to more losses, initially to 1.0950 (20-week SMA). A confirmation under 1.0920 would be a more solid bearish sign, targeting 1.0800.
While between the uptrend line and the 1.1100 area, volatility in AUD/NZD will likely remain limited. On Tuesday, the Reserve Bank of Australia will announce its decision on monetary policy, an event that could spark sharp moves in AUD crosses.
AUD/NZD daily chart
- The USD/CAD slid almost 0.80% on Monday on a risk-on mood, soft US dollar, and elevated oil prices.
- Last week’s US inflation data, mainly core-CPI, eased worries of a Fed 100 bps rate hike, as most policymakers pushed back against it.
- Canada's inflation and retail sales would shed some light, on the BoC’s forward path, after the BoC jumbo hike.
The USD/CAD slides for the second straight day, erasing last Thursday’s gains, and is back below last week’s low at 1.2936, due in part to a softer US dollar, retracing from 108.000, almost 1% amidst an upbeat market mood, cheered on speculation that the Fed would not tighten as aggressively as previously expected.
Therefore, the USD/CAD is trading at 1.2924, slumping below the 200-hour simple moving average (SMA), breaking under 1.3000, and hitting a daily low at around 1.2898, which would exacerbate a test of the MTD lows at 1.2837 on a week of a light US calendar, and also as Fed speakers entered the blackout period.
USD/CAD drops on a risk-on mood, a softer greenback, and elevated oil price
Global equities are rising sharply. US Treasury yields rise as the US 10-year T-note broke above the 3% threshold, as market players scale back flows to safety. Traders shrugged off worries about China’s recent Covid-19 outbreak, despite reporting 580 local cases on Saturday. In the meantime, high crude oil prices, mainly WTI, climbed 4.549%, exchanging hands at $98.92 BPD, bolstering the Canadian dollar, a headwind for the greenback.
The US calendar will feature housing data as the spotlight on Monday, though market players focus on inflation and growth, so their reaction would be interesting. During last week’s, US inflation kept at higher levels; in both readings, consumers and prices paid by producers. Nevertheless, core CPI stood below the 6% threshold, falling for the third consecutive month, illustrating that food and energy are the most significant contributors to the high inflation rate.
That said, Fed expectations of a 100 bps have faded so far. The CME FedWatchtool shows 30% odds of an extra-large rate rise, but stills show a priced-in 75 bps hike, in line with what most Fed policymakers expressed, namely Waller, Bullard, Mester, and Daly. The only exception was Atlanta’s Fed President Raphael Bostic, which stated that “everything is on the table” after the release of June’s CPI.
Elsewhere, the Bank of Canada surprisingly raised rates more than expected, a 100 bps, emphasizing that they would do what’s needed to tame inflation. Additionally, at the press conference, the BoC Governor Macklem said that front-loading rate increases now would help avoid even higher rates in the future while adding that front-loaded cycles tend to be followed by softer landings.
What to watch
The week ahead, the Canadian docket will feature Housing Starts, Inflation data, and Retail sales. The calendar will be packed on the US front, Housing Starts, Building Permits, Existing Home Sales, Initial Jobless Claims, and July’s S&P Global PMIs.
USD/CAD Key Technical Levels
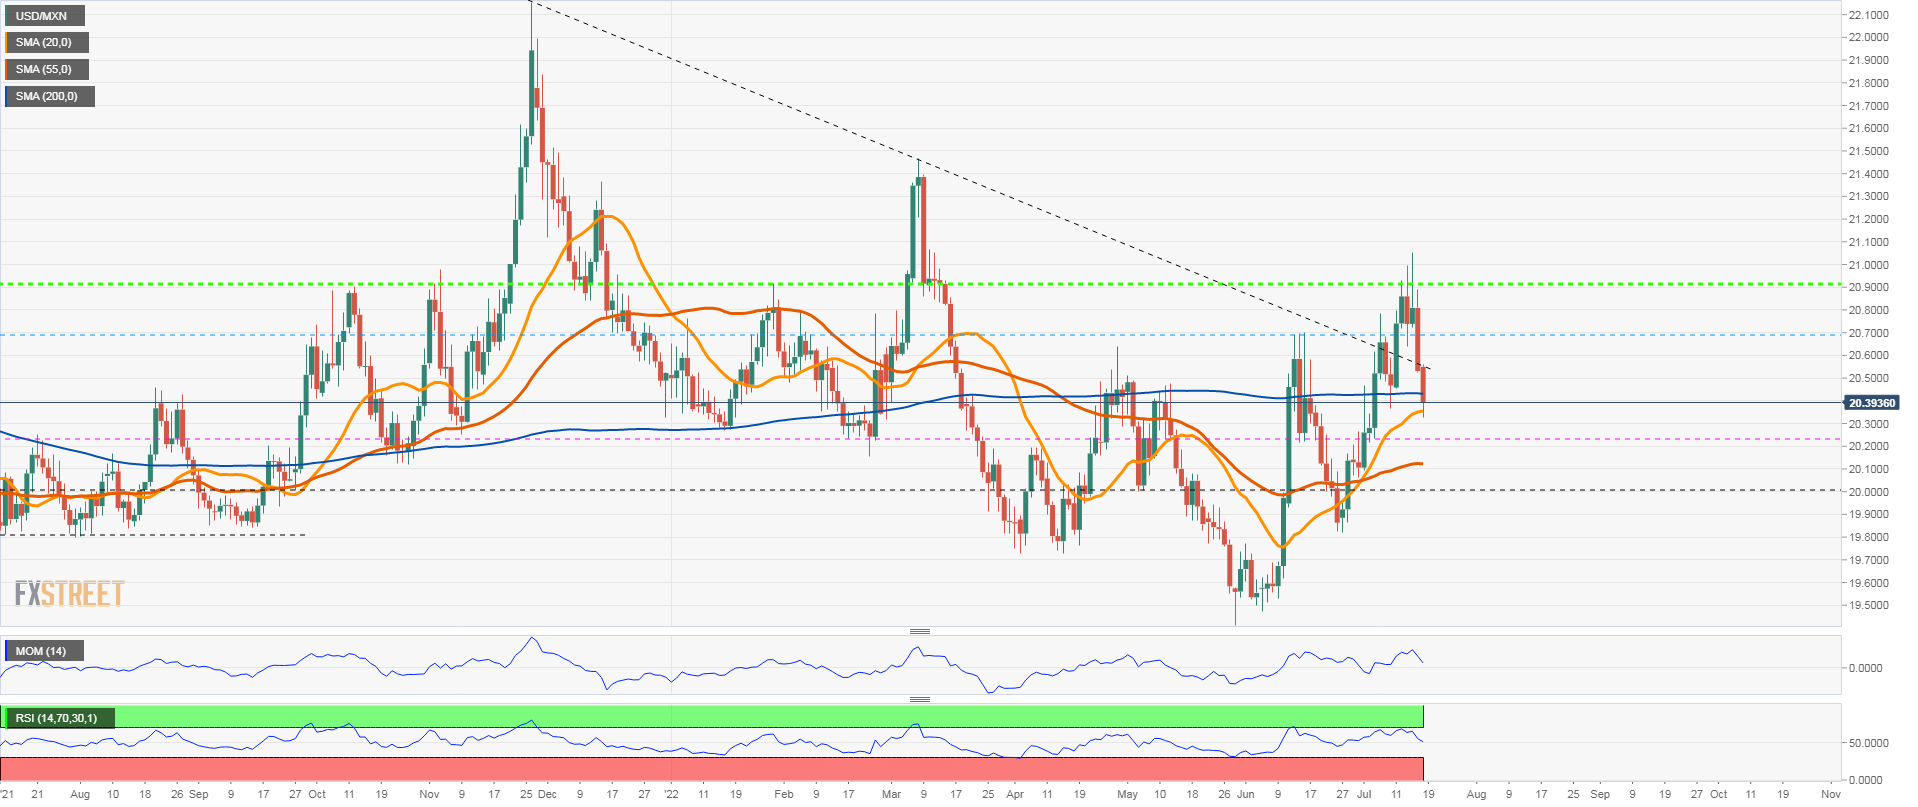
- Mexican peso extends recovery amid improvement in risk sentiment.
- USD/MXN drops for the second day in a row.
- Key support at 20.30/35, dollar to strengthen above 20.45.
Emerging market currencies are rising of the second day in a row on Monday, amid a global improvement in market sentiment. Steady US yields and higher commodity prices offer relief to riskier currencies, like the Mexican peso.
The USD/MXN peaked last week above 21.00, levels not seen since March. It failed to hold above 21.00 (also to post a daily close above 20.90) and it pulled back initially to 20.60. On Friday, it broke lower and bottomed on Monday at 20.32, near the 20-day Simple Moving Average.
During the American session, USD/MXN is rebounding from the key support area around 20.33. If it moves back above 20.45, the Mexican peso would lose strength, opening the doors for a test of 20.70 that is again a critical resistance.
The retreat from monthly highs so far, represents a correction in USD/MXN. The short-term bias remains bullish. A consolidation below 20.45 would keep the upside limited. A close under 20.22 could change the short-term bias to neutral.
USD/MXN daily chart
- Risk sentiment favors the pound on Monday.
- Busy week in the UK between politics and key data.
- Cable faces next resistance levels at 1.2050 and 1.2065.
The GBP/USD broke above 1.1990 during the American session and jumped to 1.2033, reaching the highest level since July 8. It is hovering around 1.2010/15, up 150 pips for the day, boosted by a weaker US dollar.
Improvement in risk sentiment
Equity prices ended higher in Europe and the Dow Jones gains 0.54% on Monday. The latest round of US economic data and signs the Federal Reserve will hike rates by “just” 75 basis points contribute to improving market sentiment. Investors are also looking at the first corporate results for the second quarter.
In the UK, the political drama continues. The final candidates to become Prime Minister should be clear by Thursday. Besides politics, UK economic data will be key during the week. On Tuesday, labor market is due. Later during the week, CPI, PMI and retail sales will be released.
Bank of England’s next meeting is on August 4. A 50 basis points rate hike is priced in. BoE Saunders said on Monday that interest rates could top 2% in 2023 and emphasized the central bank must act to prevent high inflation.
In the US is a quiet week regarding economic data. The attention is set on the Federal Reserve meeting next week. Market participants see a 75 basis point. The odds of a larger increase softened on Friday.
Looking at 1.2050
The very short term bias is bullish for GBP/USD. Although the pair is facing a strong resistance ahead around 1.2050 and also at 1.2065. So a firm break above is needed in order to clear the way to more gains. While below the mentioned area, the upside would be seen as limited. The immediate support might be seen at 1.1950 followed by 1.1920 and 1.1850.
Technical levels
Statistics Canada will release June Consumer Price Index (CPI) data on Wednesday, July 20 at 12:30 and as we get closer to the release time, here are the forecasts by the economists and researchers of six major banks regarding the upcoming Canadian inflation data.
The June Canada inflation rate is expected to rise by +0.9% MoM from +1.4% MoM, clocking in at +8.3% YoY from +7.7% YoY. The Bank of Canada's Core CPI, which excludes volatile food and energy prices, is estimated to rise 0.5% MoM, surging to 6.7% on yearly basis from the 6.1% previous.
TDS
“We look for CPI to firm to a new high of 8.3% in June with prices up 0.8% MoM. Food and energy will provide the main drivers, led by gasoline (+6.8%). Shelter will provide another source of strength as higher rates feed through to mortgage payments, while seasonal headwinds to clothing will provide a slight drag. Core inflation should firm by 0.2pp to 4.9% on average.”
RBC Economics
“We anticipate Canada’s inflation rate will edge up to 8.0% from a year ago. That would be the highest since 1982. This continued acceleration was likely largely driven by higher food and energy prices – both of which have been boosted by global pressures. Oil prices rose another 4.8% from May and consumer food prices have been surging in part due to higher commodity prices and acute supply chain disruptions. Roughly half of inflation recently has been driven by forces beyond our borders by our count. Inflation pressures are unlikely to ease sustainably to the BoC’s 1% to 3% target range until the economy, and labour markets, have cooled substantially.”
NBF
“The food component likely remained very strong given severe supply constraints globally and the increase in this segment may have been compounded by higher gasoline prices. As a result, headline prices could have increased 0.6% MoM before adjustments for seasonality, allowing the year-on-year rate to rise three ticks to 8.0%. The annual rate of common CPI, meanwhile, could move up from 3.9% to 4.2%.”
CIBC
“CPI inflation should have peaked in June at 8.5% year-over-year. While recent pullbacks in the prices of oil and some agricultural commodities should provide relief in the future, it will not be apparent in the June CPI data. There was a further increase in gasoline prices in the month relative to May, and with the long lag between changes in agricultural prices and food prices in stores, we are still living through the impact of past increases. But recent developments mean that we should start to see some relief in the months ahead. Outside of food and energy, we expect CPI inflation to have grown slower on the month and to be roughly stable at an annual rate. Prices linked to the housing market, though still increasing, are not exerting as much upward pressure on CPI as they were just a few months ago. Overall, while we see June as the peak, inflation should stay close to 8% through the summer months.”
Wells Fargo
“We expect Canada's CPI release to show persistently high inflation yet again. We expect Canada's headline CPI to quicken to 7.9% year-over-year and forecast inflation to average 6.6% in 2022.”
Citibank
“Canada June CPI NSA MoM (Jun) – Citi: 0.7%, prior: 1.4%, CPI YoY – Citi: 8.2%, prior: 7.7%. As in May data, inflationary pressures should be broad-based. The three core inflation measures averaged a very strong 4.7% in May and should also remain high and likely even climb higher in June.”
The European Central Bank (ECB) is set to announce its decision on monetary policy on Thursday, July 21 at 12:15 GMT and as we get closer to the release time, here are the expectations as forecast by the economists and researchers of 11 major banks.
The ECB is expected to elevate its key interest rate for the first time in 11 years by 25 basis points (bps). A signal of a 50 bps increase for September is also likely. Furthermore, the central bank is expected to unveil the contours of its new anti-fragmentation backstop.
Danske Bank
“We expect ECB to go ahead with its intention to hike all three policy rates by 25 bps in July. The pace of further rate increases will depend on how the economy evolves, but we do not anticipate any guidance for the Q4 monetary policy outlook at the July meeting. As visibility remains low, we expect increased market volatility to persist in the near-term, but still see ECB as priced too aggressively by the market for 2023, especially with the Federal Reserve priced for a 50 bps rate cut in 2023. Any frontloading ECB hikes is unlikely to support EUR/USD. Designing a credible anti-fragmentation tool is key, for markets not to call the bluff on ECB and send Italian yields sharply higher again. We expect the new instrument to be implemented in a flexible manner, with focus on shorter maturities, but without a pre-set intervention amount or timeframe. We also expect purchases to be sterilized in order not to interfere with the monetary policy stance, but we see only a small probability of ECB outright selling bonds.”
Rabobank
“We expect a 25 bps rate hike, applying symmetrically to the deposit facility rate and refi rate. The Council will probably reaffirm its guidance that a bigger move in September is likely. The ECB will unveil its ‘Transmission Protection Mechanism’. We expect an open-ended instrument with light/medium conditionality and sterilisation via liquidity-draining operations. We don’t expect changes affecting the TLTRO arbitrage.”
Commerzbank
“The ECB has only very rarely signaled its intentions in advance as clearly as it has now: It will raise its key interest rates by 25 bps on Thursday, it already declared at the press conference in June. That's why we expect exactly this move, although, in view of the recent renewed increase in inflation risks, a 50 bps hike seems more appropriate to us.”
TDS
“We expect the ECB to hike rates by 25 bps. But the focus will be on the likely announcement of an anti-fragmentation tool, which needs to be big enough for markets to see as being credible. A review of other measures may also be on the table. We will be interested to see to what extent the ECB draws a line in the sand, if any, on the currency. Parity should be a magnet, and we are wary that we may see a bit of a short-squeeze in EUR if the ECB surprises with more aggressive policy. Ultimately, however, this should be short-lived and the risk of a sub-parity paradigm grows.”
SocGen
“First rate hike in 11 years (25 bps) to be announced. Anti-fragmentation mechanism to be launched, to support vulnerable countries. While downside risks to growth have increased, for now,the guidance for a possible 50 bps hike in September is likely to remain in place, partly linked to the fact that the inflation forecast will need to be revised up again in September, at least with regard to the short-term. No new staff forecasts will be presented, but an updated assessment is likely to point to high uncertainty, in particular over the energy supply situation. Risks to inflation remain to the upside, while risks to growth remain to the downside.”
Wells Fargo
“We expect the ECB to kick off its rate hike cycle at its July monetary policy meeting with a 25 bps hike to -0.25%. Eurozone inflation recently reached a new high of 8.1% YoY in May. We expect inflation to trend even higher in the coming months and possibly peak later this year, and also expect that economic growth will be sturdy enough to take on larger rate hikes. We view the possibility of a 50 bps rate increase in September as more likely than not; however, we think it is unlikely the ECB will deliver multiple 50 bps rate hikes. As such, we forecast a 25 bps hike in July, a 50 bps hike in September, and a 25 bps hike in December, bringing the policy rate to +0.50% by the end of 2022. We then expect the ECB to deliver its last rate hike of the cycle by Q1 next year, finishing with a Deposit Rate of +0.75%.”
BBH
“Despite some hawks calling for a 50 bps hike, it seems clear that the bank will opt for a more cautious move. Updated macro forecasts won’t be released until the September 8 meeting. As usual, Madame Lagarde’s press conference is likely to provide the fireworks, whether good or bad. We know that the divide between the hawks and doves remains wide. A 50 bps hike is fully priced in for the next meeting September 8, with some odds seen of a 75 bps move. Expected moves at the subsequent meetings October 27 (50 bps) and December 15 (25 bps) would see the deposit rate near 1.0% at year-end. Looking ahead, the swaps market is now pricing in 200 bps of tightening over the next 12 months which would see the deposit rate peak near 1.5%. The ECB is also expected to reveal some more details about its new anti-crisis tool. As always, we are braced for disappointment but perhaps the ECB will surprise us. As things stand, it’s very apparent that there is the usual split between the debtor and creditor nations. As a result, it seems likely that the Governing Council will be unable to agree on the trigger and conditionality for the planned anti-crisis tool.”
Deutsche Bank
“The ECB meeting will likely deliver a 25 bps hike, the first rate increase since 2011. Our updated call retains the 2% terminal rate forecast but the hiking cycle is expected to be split. The first phase has hikes of 25 bps, 50 bps, 50 bps and 25 bps in July, September, October and December. By end-2022, the deposit rate will be 1%, helping to balance inflation and growth risks before the anticipated recession forces a pause. The second phase in H1 2024 is now expected to have four 25 bps hikes and push rates into moderately above neutral territory.”
Citibank
“ECB Deposit Facility Rate – Citi Forecast -0.25%, Prior -0.5% (first hike since 2011); Main Refinancing Rate: Citi Forecast 0.25%, Prior 0.0%; Marginal Lending Rate: Citi Forecast 0.5%, Prior 0.25%. We also expect ECB to announce details of its anti-fragmentation tool. This could include no limits in time and size (subject to the 50% issuer limit, and possibly to maturities), strings attached (similar to the recovery fund), and some form of balance-sheet sterilization. The team sees a serious risk that recession, bond market turmoil or the gas crisis shortens the time window for ECB policy normalization.”
MUFG
“We are still confident that the ECB wants to bring an end to the emergency policy settings of negative rates, and will stick to plans to begin raising rates by 25 bps followed by a larger 50 bps hike in September. Logically, we think it makes more sense though to deliver a larger 50 bps hike followed by a smaller hike in September but policymakers have displayed no signs recently of changing the guidance. Beyond September, we are less convinced than the European rate market that the ECB will keep raising rates through to Q1 2023 in light of the increasing risk of a sharper slowdown. The rate market is currently pricing in 158 bps of hikes by year-end and 172 bps of hikes by March 2023. The outcome of ECB’s rate decision could be overshadowed by market participants’ response to the announcement of further details of the new anti-fragmentation policy tool. It is of crucial importance that the ECB’s plans are viewed as credible to help contain fragmentation risks. If the plans disappoint in any way for example should the new facility be viewed as too small and/or the attached conditionality is judged as too stringent then downside risks will be reinforced further for the EUR in the near-term.”
Goldman Sachs
“We expect the Governing Council to hike policy rates by 25 bps and provide additional details of its sovereign backstop. Although the sharp depreciation of the euro, recent central bank actions abroad and the chance of a further rise in survey inflation expectations suggest that a 50 bps move is possible, we believe that a quarter-point increase remains likely. This is because the Council has strongly guided towards 25 bps, the growth outlook has weakened and the ECB has historically not delivered hikes that were less than 70% discounted.”
Economist at UOB Group Enrico Tanuwidjaja assesses the latest trade balance figures in Indonesia.
Key Takeaways
“Indonesia achieved a trade surplus of USD5.1bn in Jun, third highest compared to an all-time high of USD7.5bn in Apr 2022.”
“Exports soared 40.7% y/y in Jun (vs 27.0% in May), significantly higher than the market consensus of 30.3% y/y. Meanwhile, imports similarly sped up to 22.0% y/y in June (vs 30.7%% y/y in May), barely higher than the market consensus of 20.1% y/y.”
“Indonesia may record another small current account surplus in 2Q22 amidst much stronger than expected trade surplus in Mar-Jun period.”
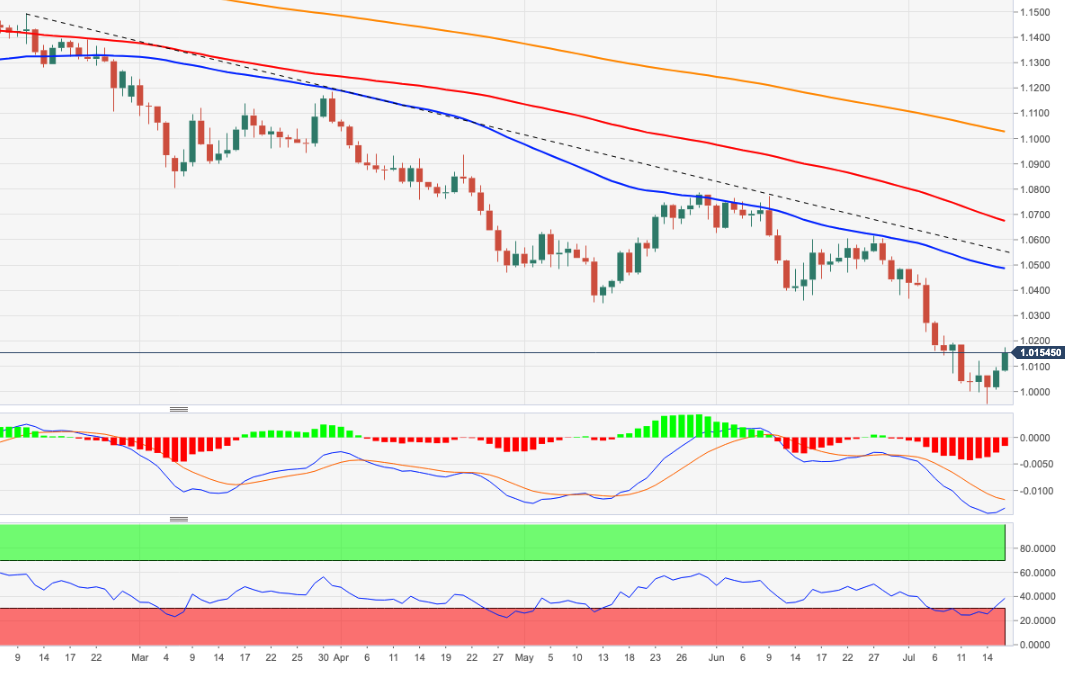
- EUR/USD rebounds sharply from recent oversold levels.
- Extra gains are seen revisiting the 1.0200 neighbourhood soon.
EUR/USD advances further and adds to Friday’s bounce, retesting the 1.0170/75 band at the beginning of the week.
Further gains could revisit the 1.0200 zone sooner rather than later, although the pair’s bearish stance remains in place. Against that, the resumption of the downtrend should meet initial contention at the key parity level ahead of the 2022 low at 0.9952 (July 14).
As long as the pair navigates below the 5-month support line around 1.0540 further losses remain in store.
In the longer run, the pair’s bearish view is expected to prevail as long as it trades below the 200-day SMA at 1.1026.
EUR/USD daily chart
- Gold price gained some positive traction on Monday amid the ongoing USD profit-taking slide.
- Diminishing odds for more aggressive Fed rate hikes weighed on the buck and extended support.
- The risk-on impulse, rebounding US bond yields acted as a headwind and capped the commodity.
Gold price kicked off the new week on a positive note and moved away from a nearly one-year low touched last week. The intraday uptick, however, lacked bullish conviction and lost steam just ahead of the $1,725 level. The XAUUSD was last seen trading around the $1,715-$1,716 region during the early North American session, still up over 0.50% for the day.
Gold price supported by retreating USD
The US dollar extended last week's retracement slide from a two-decade high and witnessed heavy selling for the second straight day amid diminishing odds for a 100 bps Fed rate hike move in July. This, in turn, was seen as a key factor that offered some support to the dollar-denominated gold. Several Federal Reserve officials signalled last week that they did not favour the bigger rate hike that the markets had priced in. It is worth recalling investors lifted their bets for a supersized Fed rate hike move after the US consumer inflation in June accelerated to the highest level since November 1981.
Less hawkish FOMC members weighed on the USD
Two of the most hawkish FOMC members - Fed Governor Christopher Waller and St. Louis Fed President Jim Bullard - pushed back against expectations for more aggressive rate hikes by the US central bank. Adding to this, Atlanta Fed President Raphael Bostic cautioned on Friday that moving too dramatically could undermine positive aspects of the economy and add to the uncertainty. This, in turn, continued weighing on the greenback. That said, a combination of factors held back bullish traders from placing aggressive bets and kept a lid on any meaningful upside for the gold price, at least for the time being.
Fed Chair Jerome Powell
Risk-on impulse acted as a headwind for gold price
The global equity markets witnessed a counter-trend rally amid hopes that the Fed would be less aggressive at its upcoming meeting than previously feared. The risk-on impulse triggered a fresh leg up in the US Treasury bond yields, which, in turn, acted as a headwind for the safe-haven gold. In fact, the yield on the benchmark 10-year US government bond shot back above the 3.0% threshold. This helped limit deeper losses for the USD and further contributed to cap gains for the XAUUSD. Hence, it will be prudent to wait for strong follow-through buying before confirming that spot prices have bottomed out.
Gold price technical outlook
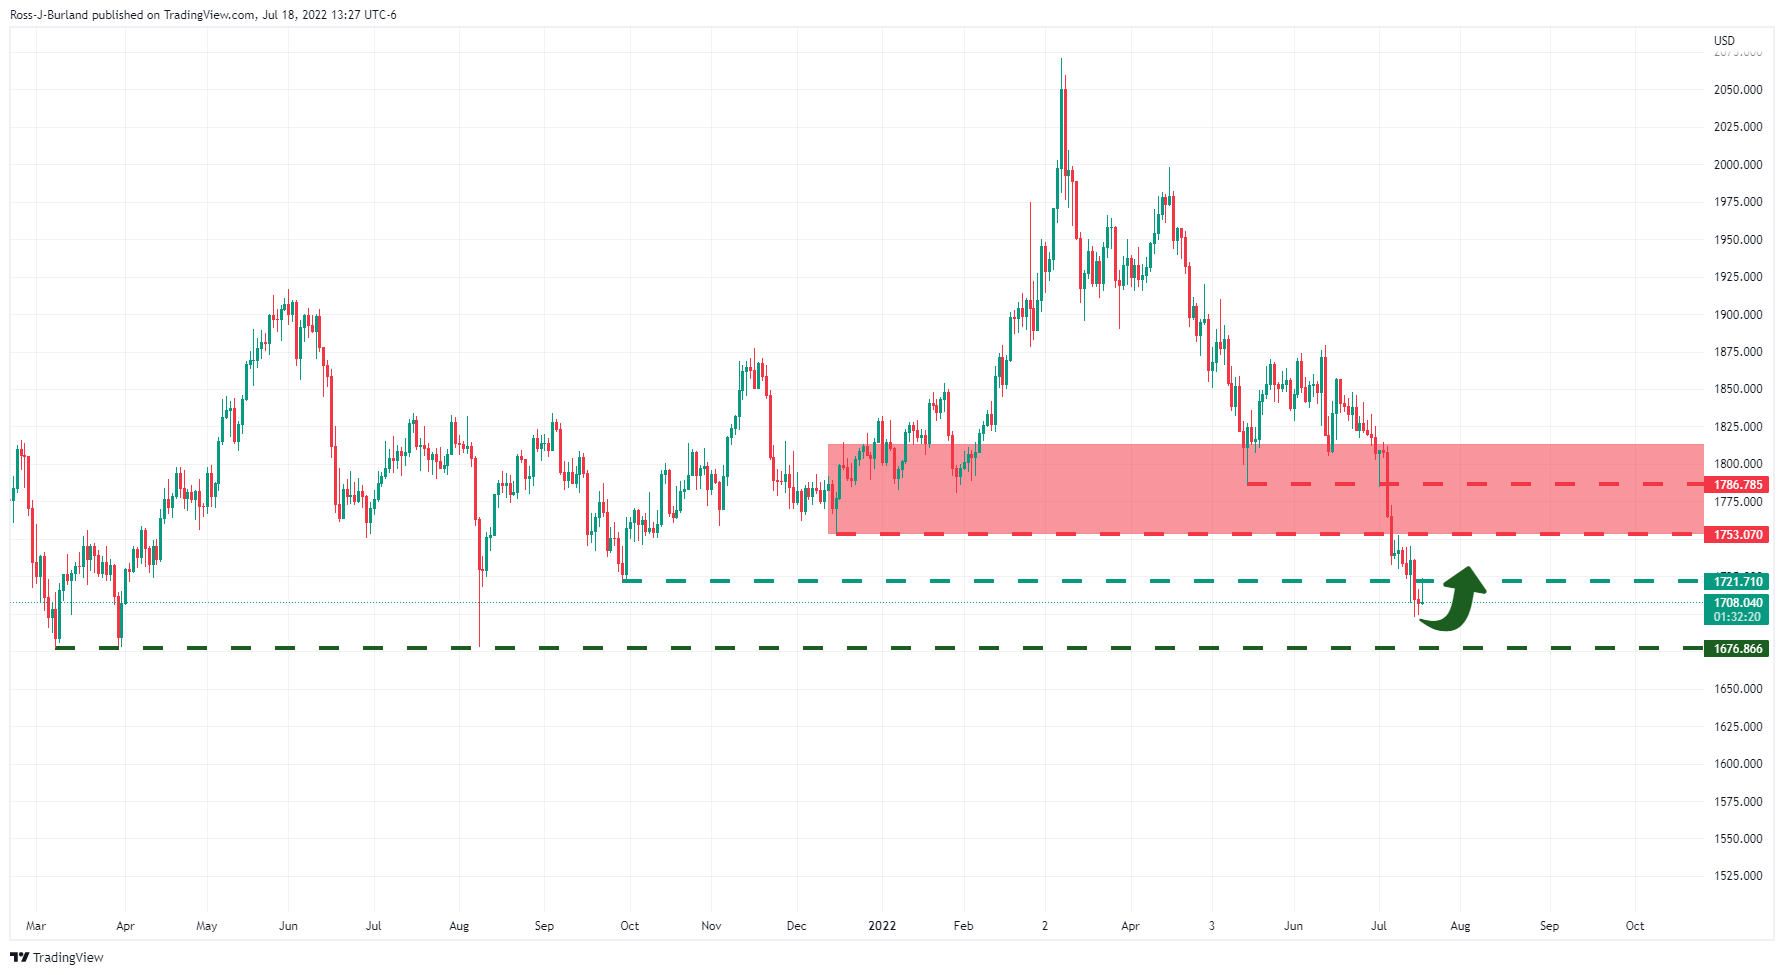
Gold price has repeatedly shown some resilience below the $1,700 round-figure mark. That said, the metal’s inability to gain any meaningful traction suggests that the near-term risks remain skewed to the downside. This, in turn, suggests that any subsequent strength beyond the $1,725-$1,726 immediate resistance might confront stiff resistance near the $1,734-$1,735 horizontal zone. A sustained move above might trigger a bout of short-covering and lift the XAUUSD towards the $1,749-$1,752 supply zone.
On the flip side, last week's swing low, around the $1,698-$1,697 area, now seems to protect the immediate downside. A convincing break below would make the XAUUSD vulnerable and accelerate the fall towards September 2021 low, around the $1,787-$1,786 region. Gold price could extend the downward trajectory towards testing the 2021 yearly low, near the $1,677-$1,676 area.
-637937482873164997.png)
Gold price: Where are commodities heading next?
Senior Economist at UOB Group Alvin Liew and Rates Strategist Victor Yong review the latest release of US inflation figures for the month of June.
Key Takeaways
“US headline consumer price inflation accelerated more than expected, to 9.1% y/y in Jun (from 8.6% y/y in May), ahead of Bloomberg estimates of 8.8% and a fresh 4-decade high since Nov 1981 (9.6%). On a m/m basis, the headline CPI rose at a faster clip of 1.3% in Jun (versus 1.0% in May), fastest since 2005 and matched the top end of the forecast range in the Bloomberg survey.”
“Core CPI inflation (which excludes food and energy) continued to ease from its high recorded in Mar (6.5% y/y), coming in at 5.9% y/y for Jun, from 6.0% y/y for May but it was nevertheless above Bloomberg estimate of 5.7%. But of greater concern was that on a sequential basis, core inflation rose by 0.7% m/m in Jun, above May’s 0.6% m/m and Bloomberg estimate of 0.5%.”
“We expect US inflationary pressures to stay elevated into 3Q 2022, underpinned by upside to commodity prices (especially energy and food), supply chain disruptions while housing costs pressure also remained on the upside although the jump in mortgage rates in recent months may help to slow the price increases. Most concerning is that inflation has yet to peak as it remains very broad-based, extending into higher services cost, and that certain CPI sub-indices which have been prominent inflation drivers and considered a bellweather of the latest round of inflation surge, such as the index for used cars and trucks, continued to see the spring in prices in them. We expect inflation to head higher in 3Q before some easing in 4Q 2022, and as such, we will further raise our headline CPI inflation forecast to average 8.5% (from 7.5% previously) while keeping our core CPI inflation forecast at 6.5% for 2022. Subsequently, we still expect both headline and core inflation to ease in 2023 to average 2.5%.”
“With Jun US headline CPI inflation coming in well above our and market forecasts, this will mean a stronger response from the Fed is required. As such, we expect the Fed Funds Target Rate (FFTR) to be hiked by 100bps in 26/27 Jul FOMC (previous forecast 50bps).”
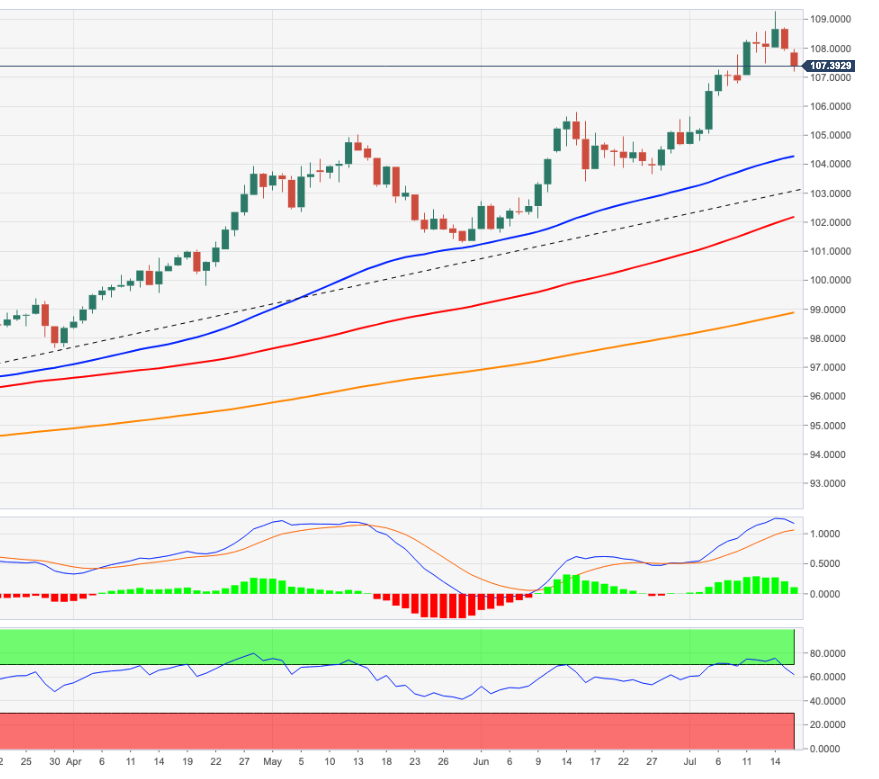
- DXY adds to Friday’s pullback and revisits the 107.20 area.
- In case the downside picks up pace, the index could retest the 105.80 zone.
DXY tumbles further and prints new multi-day lows in the 107.20 zone on Monday.
The index retreats from the overbought territory and opens the door to extra decline in the very near term. That said, the deterioration of the short-term outlook could see the index revisit the post-FOMC highs near 105.80 (June 15).
As long as the index trades above the 5-month line near 103.30, the near-term outlook for DXY should remain constructive.
In addition, the broader bullish view remains in place while above the 200-day SMA at 98.87.
DXY daily chart
USD/IDR is forecast to navigate within the 14,920-15,020 range for the time being, suggested Quek Ser Leang at UOB Group’s Global Economics & Markets Research.
Key Quotes
“We highlighted last week that ‘the combination of weakening upward momentum and overbought conditions suggest USD/IDR is unlikely to advance much further’ and we expected USD/IDR to ‘trade between 14,872 and 15,050’. USD/IDR subsequently traded sideways within a narrower range than expected (14,943/14,997).”
“Shorter-term momentum indicators are mostly neutral and USD/IDR could continue to trade sideways. Expected range for this week, 14,920/15,020.”
Gold suffered heavy losses and registered its lowest weekly close in nearly a year. Strategists at TD Securities expect the yellow metal to sustain further losses.
Bear market trading regime in XAUUSD for the time being
“Gold prices have crossed the threshold for a trend reversal, marking confirmation of a bear market trading regime in the yellow metal for the time being.”
“Prices have since slashed through various support levels on their way towards the $1,600-handle.”
“Fedspeak has pushed-back against a 100 bps hike from some notable hawks, raising the risk of a near-term short-squeeze prior, which would create the ideal set-up for additional downside.”
The S&P 500 has gapped higher on increased volume. Analysts at Credit Suisse see scope for further strength in the broader consolidation range.
Resistance seen at 3902 initially, then 3946
“A positive end to last week has seen the S&P 500 gap higher on improved volume for a close back above the short-term 13-day exponential average. This should reinforce the sideways range of the past few weeks, with the immediate risk now for a deeper recovery within this range.”
“Resistance is seen initially at the top of the downtrend channel from April at 3902, a close above which should clear the way for strength back to 3919 then the late June high at 3946. Above here can see the recovery extend to 3974 next with more important and tougher price, gap and 63-day average resistance seen at 4010/19, which we expect to remain a major barrier.”
“Support is seen at 3833 initially, then the price gap from Friday morning at 3817/3790. Beneath here is needed to reassert a negative bias in the range again with support seen next at 3732/22.”
A spokesperson for Austrian energy firm OMV said on Monday that they are expecting the maintenance work on Nord Stream 1 to be completed as planned and added that deliveries are also expected to resume afterwards, as reported by Reuters.
Market reaction
Risk flows continue to dominate the financial markets after this headline. As of writing, Euro Stoxx 600 Index was up 1.15% on a daily basis. In the meantime, the EUR/USD pair continues to trade in positive territory near the 1.0150 area.
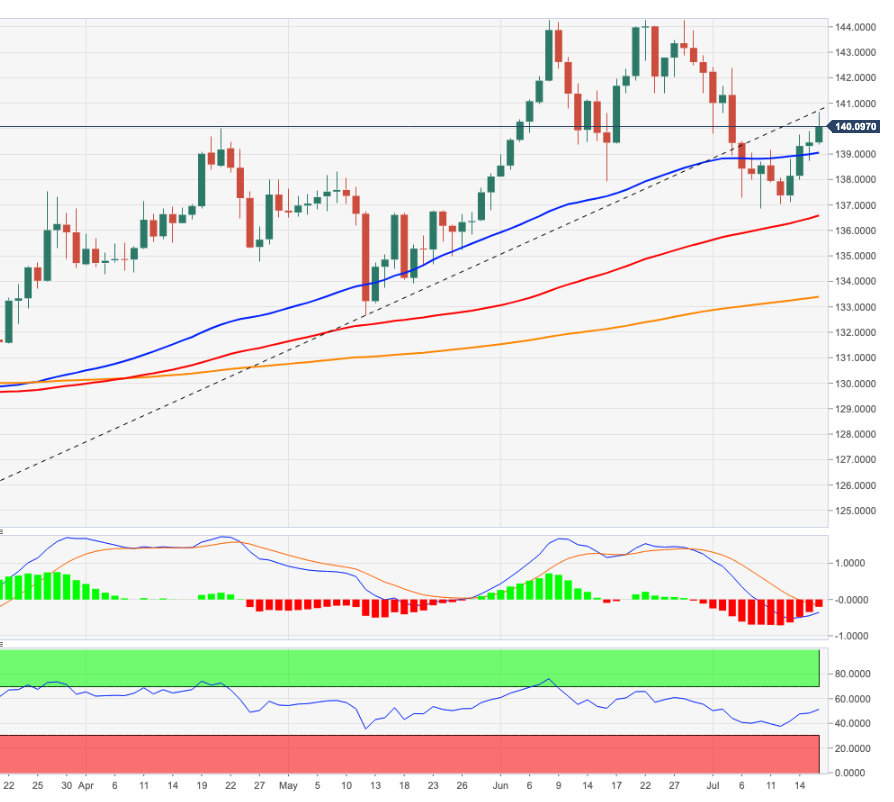
- EUR/JPY advances for the fourth consecutive session on Monday.
- The next hurdle emerges around the 140.30 region.
EUR/JPY keeps the recovery well and sound and surpasses the 140.00 barrier, or 2-week peaks, on Monday.
Further upside appears the 4-month resistance line around 140.70, above which the cross is seen accelerating its gains to, initially, the weekly high at 142.37 (July 5). Once cleared, the next hurdle of relevance is seen at the 2022 top at 144.27 (June 28).
In the longer run, the constructive stance in the cross remains well propped up by the 200-day SMA at 133.36.
EUR/JPY daily chart
Quek Ser Leang at UOB Group’s Global Economics & Markets Research notes USD/MYR could still advance further.
Key Quotes
“In our weekly update from last Tuesday (12 Jul, spot at 4.4350), we highlighted that ‘upward momentum has improved considerably and USD/MYR is likely to advance to the 2020 high at 4.4410’. We added, ‘the next major resistance at 4.4500 is likely out of reach for now’. Our view was not wrong as USD/MYR soared to a high of 4.4480 on Friday (15 Jul). Upward momentum remains strong and the risk for this week is still on the upside.”
“However, in view of the overbought shorter-term conditions, USD/MYR may not be able to maintain a foothold above 4.4500. The next resistance at 4.4590 is unlikely to come into the picture. The major support at 4.4120 is unlikely to come under threat for this week. On a shorter-term note, 4.4250 is already quite a strong support level.”
- NZD/USD edged higher for the second straight day amid the ongoing USD profit-taking slide.
- Stronger-than-expected quarterly inflation data from New Zealand also offered some support.
- Rebounding US bond yields helped limit the USD losses and capped the upside for the major.
The NZD/USD pair built on last week's bounce from the 0.6060 area, or its lowest level since May 2020 and gained traction for the second successive day on Monday. The momentum lifted spot prices to over a one-week low, though lacked any follow-through and faltered near the 0.6200 round-figure mark.
Several Federal Reserve officials signalled last week that they did not favour the bigger rate hike that the markets priced in following the release of red-hot US consumer inflation. This, in turn, forced investors to trim their bets for a supersized 100 bps Fed rate hike move in July, which continued undermining the US dollar and offered some support to the NZD/USD pair.
Apart from this, a generally positive tone around the equity markets dragged the safe-haven USD away from a two-decade high. This, along with stronger-than-expected quarterly inflation data from New Zealand benefitted the risk-sensitive kiwi. The risk-on impulse, meanwhile, pushed the US Treasury bond yields higher, which helped limit the USD losses and capped any further gains.
Spot prices have now retreated to the 0.6165 region, warranting some caution before positioning for any meaningful upside. In the absence of any major market-moving US economic data, the NZD/USD remains at the mercy of the USD price dynamics. This further makes it prudent to wait for a strong follow-through buying to confirm that the pair has formed a near-term bottom.
Technical levels to watch
USD/CAD jumped above 1.3100/23 last week but did not manage to close above this level. Analysts at Credit Suisse expect the pair to continue to consolidate from here.
Break below 1.2816/01 to signal a deeper move lower
“USD/CAD spiked sharply above 1.3100/23 late last week but has not managed to close above this level. Given this development and the mean-reverting environment that the market has been in since H2 of 2021, we stay with our neutral outlook and look for further consolidation below 1.3100/23.”
“A close below 1.2935/11 is still needed to reduce the upside risk, though only a break below the recent low at 1.2816/01 would signal a mean-reversion back towards the bottom of the channel, with next support then seen at 1.2771/52.”
“Only a sustained move above 1.3127 would make room for further upside to the new YTD high at 1.3200/23. Nonetheless, with the current volatile environment in mind, we would stay wary of a potential mean-reversion back lower.”
GBP/USD is seeing a fresh rebound. Cable is expected to consolidate near-term, ahead of an eventual fall to Credit Suisse’s core technical objective at 1.15/1.1409.
Resistance at 1.1968 ideally caps ahead of an eventual fall to 1.15/1.1409
“Key near-term resistance is seen at the recent reaction high and 13-day exponential average at 1.1968. Our bias is for this to ideally cap for a low-level consolidation phase ahead of a move back to 1.1805, then 1.1760.”
“An eventual move below 1.1760 in due course should see a fall to our core objective at 1.1500/1.1409, the bottom of the six-year range and potential long -term trend support stretching back to 1985. Our bias remains to then look for a more important floor to be found here.”
“A close above 1.1968 would be seen to clear the way for a deeper corrective recovery to emerge with resistance seen next at the early July reaction high at 1.2057.”
Markets remain risk-positive at the beginning of the week and the greenback is having a tough time finding demand. Economists at ING expect the US dollar to consolidate around current levels this week.
Consolidation time?
“We see no reason for markets to doubt their 75 bps conviction call for July, and that should continue to put a floor under the dollar in the near term.”
“Expect the large majority of dollar moves this week to be linked to swings in global risk sentiment driven by non-US developments.”
“We could see some consolidation around current levels in the dollar this week, with DXY oscillating around the 107.00-109.00 region although the balance of risks remains tilted to the upside given the numerous threats to the global outlook.”
EUR/USD adds to Friday’s advance and surpasses the 1.0150 level. However, the probability of the pair testing parity again is high, according to economists at ING.
EUR/USD downside risks persist
“The chances of parity being retested remain high, and we struggle to see a significant rebound in EUR/USD for the moment.”
“Expect exacerbated volatility around the 1.00 level.”
Analysts at ING are going to keep an eye on a busy UK data calendar. Nonetheless, global sentiment is likely to play a bigger role in driving GBP/USD which is set to remain below the 1.20 level.
A very busy data calendar this week
“Another round of voting in the Tory leadership contest will cut another candidate from the list and tell us whether Rishi Sunak has managed to hold on to his position as front-runner. Markets will keep an eye on this, but for now, the implications for sterling are likely to remain quite contained.”
“Headline CPI is expected to have accelerated to 9.3% year-on-year in June, while the core rate may have inched lower. Later this week, retail sales and PMIs should also have some market impact.”
“We expect this week’s data flow to help markets fully price in a 50 bps rate hike by the Bank of England (currently, 42 bps is priced in), which could offer some moderate support to sterling.”
“Still, global risk sentiment is expected to play a bigger role in driving GBP/USD for now, and we suspect that a return above 1.20 is not likely at this stage.”
“EUR/GBP may keep oscillating around the 0.85 gravity line this week.”
AUD/USD maintains its pause upon reaching support at 0.6757. Analysts at Credit Suisse think that a potentially lengthier corrective pause is likely to take place for now.
AUD/USD continues to pause around the 0.6757 support
“AUD/USD continues to pause around a major support level at the 50% retracement of the 2020/21 uptrend at 0.6757 and a lengthier pause around this level looks increasingly likely.”
“Resistance for the potential corrective recovery is seen at 0.6860/74 initially and next at 0.6962/64. A move above here would suggest a test to the 55-day moving average at 0.6984/95, which we look to hold to avoid deeper upmove.”
“Big picture, we look for an eventual and sustained move below 0.6757, which would open the door to 0.6643/00 and, potentially, to the next significant support at 0.6461.”
EUR/USD advances for the second straight session after plunging to its lowest level in nearly twenty years at 0.9952 on Thursday. Analysts at Credit Suisse continue to look for a consolidation/recovery phase to emerge.
Parity/0.99 to hold
“With RSI momentum at oversold levels typically associated with a low, we continue to look for a floor at our long-held parity/0.99 objective and for a consolidation/recovery phase to emerge.”
“Resistance for recovery is seen at 1.0134 initially, ahead of the recent reaction highs and 13-day exponential average at 1.0183/1.0205, with sellers expected to show here. Above this latter area though would suggest a deeper recovery can unfold, with resistance seen next at the 38.2% retracement of the May/July fall at 1.0271.”
“Big picture though, our bias is to view a consolidation phase as temporary and we see no reason not to look for an eventual break below 0.99 in due course with support seen next at 0.9799/95.”
USD/JPY saw a strong close to last week and has seen a clear break of the 137.21 high of September 1998 to leave the market approaching the key 140.00 psychological barrier. However, the pair is expected to hold below the latter for now and enter a consolidation phase, economists at Credit Suisse report.
140.00 to cap at first for a consolidation phase
“We suspect USD/JPY will remain capped below 140.00 for now and a consolidation phase can emerge.”
“Support for a pullback is seen at 137.87 initially, ahead of the13 -day exponential average and price support at 137.08/136.94, which we look to try and hold for now. Below though can see a deeper setback to support seen next at 136.20.”
“Big picture though, consolidation will remain seen temporary ahead of an eventual sustained move above 140.00, with 147.62/153.01 still our long-held ultimate objective.”
USD/THB seems to have moved into a consolidative phase within the 36.33-36.75 range for the time being, according to Quek Ser Leang at UOB Group’s Global Economics & Markets Research.
Key Quotes
“Last Tuesday (12 Jul, spot at 36.24), we highlighted that there is room for USD/THB to strengthen further but we were of the view that ‘any further advance is likely limited to a test of 34.60’. We indicated that ‘the major resistance at 35.00 is not expected to come into the picture’. The anticipated advance exceeded our expectations as USD/THB rose to a high of 36.74 on Friday (15 Jul).”
“Overbought conditions coupled with moderating upward momentum suggests that USD/THB is unlikely to advance much further. For this week, USD/THB is more likely to trade between 36.33 and 36.75.”
- EUR/USD adds to Friday’s advance and surpasses the 1.0150 level.
- The dollar remains offered amidst increasing risk-on sentiment.
- NAHB Index and TIC Flows will be the only releases across the pond.
The optimism around the European currency remains on the rise and now lifts EUR/USD to multi-session highs around 1.0160 on Monday.
EUR/USD boosted by risk appetite trends, USD weakness
EUR/USD advances for the second straight session at the beginning of the week, gaining already more than two big figures since last week’s cycle lows in the 0.9950 region.
Renewed and quite strong selling pressure in the US dollar allows the pair to extend the bounce from recent lows, helped at the same time by the change of heart surrounding the risk-linked galaxy ahead of the key ECB event later in the week. It is worth recalling that the central bank is expected to start its normalization of the monetary conditions with a 25 bps rate hike.
Minor releases in the euro area saw the Italian trade deficit at €0.012B in May and the Spanish trade deficit at €4.76B in the same period.
In the US calendar, the NAHB Index is due seconded by TIC Flows as well as short-term auctions.
What to look for around EUR
The improvement in the risk-associated universe in combination with fresh dollar weakness leaves the door open to further recovery in EUR/USD at the beginning of the week.
The ongoing technical rebound in the pair follows current oversold conditions, although it is unlikely to gather serious traction in this context, and especially before the ECB gathering due later in the week.
In the meantime, the price action around the single currency continues to follow increasing speculation of a probable recession in the euro area, dollar dynamics, geopolitical concerns, fragmentation worries and the Fed-ECB divergence.
Key events in the euro area this week: EMU Final Inflation Rate (Tuesday) – Flash Consumer Confidence (Wednesday) – ECB Interest Rate Decision, ECB Press Conference, ECB Lagarde (Thursday) – Germany, France, EMU Flash PMIs (Friday).
Eminent issues on the back boiler: Fragmentation risks. Kickstart of the ECB hiking cycle in July? Asymmetric economic recovery post-pandemic in the euro bloc. Impact of the war in Ukraine on the region’s growth prospects and inflation.
EUR/USD levels to watch
So far, spot is up 0.72% at 1.0159 and a breakout of 1.0483 (55-day SMA) would target 1.0615 (weekly high June 27) en route to 1.0773 (monthly high June 9). On the flip side, the next contention emerges at 0.0052 (2022 low July 14) seconded by 0.9859 (low December 2002) and finally 0.9685 (low October 2002).
- USD/CHF witnessed selling for the second straight day amid the ongoing USD profit-taking slide.
- Diminishing odds for more aggressive Fed rate hikes weighed on the USD and exerted pressure.
- The risk-on mood could undermine the safe-haven CHF and help limit deeper losses for the pair.
The USD/CHF pair extended last week's retracement slide from the 0.9885 region, or a multi-week high and witnessed selling for the second straight day on Monday. Spot prices continued losing ground through the first half of the European session and dropped to over a one-week low, around the 0.9735 region in the last hour.
Several Federal Reserve officials signalled last week that they did not favour the bigger rate hike that the markets priced in following the release of red-hot US consumer inflation. Investors were quick to react and trimmed their bets for a supersized 100 bps Fed rate hike move in July. This, in turn, led to an extension of the US dollar profit-taking slide from a two-decade high and was seen as a key factor exerting downward pressure on the USD/CHF pair.
The downside, however, seems cushioned amid a generally positive tone around the equity markets, which tends to undermine demand for the safe-haven Swiss franc. The risk-on impulse pushed the US Treasury bond yields higher. This could act as a tailwind for the USD and offer some support to the USD/CHF pair, at least for now. Hence, it will be prudent to wait for strong follow-through selling before positioning for any further depreciating move.
In the absence of any major market-moving economic releases from the US, traders on Monday will take cues from the broader market risk sentiment. Apart from this, the US bond yields might influence the USD price dynamics and produce short-term trading opportunities around the USD/CHF pair.
Technical levels to watch
- AUD/USD gained traction for the second straight day amid the ongoing USD corrective pullback.
- Diminishing odds for more aggressive Fed rate hikes, the risk-on impulse undermined the USD.
- Descending trend-channel breakout further contributed to the strong intraday positive move.
- Traders now eye Tuesday’s RBA minutes amid absent relevant US economic data on Monday.
The AUD/USD pair gained positive traction for the second successive day on Monday and recovered further from over a two-year low, around the 0.6680 region touched last week. The momentum lifted spot prices to a one-week high, around the 0.6835-0.6840 area during the first half of the European session and was sponsored by the ongoing US dollar profit-taking slide.
Fed Governor Christopher Waller and St. Louis Fed President Jim Bullard - the biggest Fed hawks - said last Thursday that they were not in favour of the bigger rate hike. Adding to this, Atlanta Fed President Raphael Bostic warned on Friday that moving too dramatically could undermine positive aspects of the economy and add to the uncertainty. This, in turn, forced investors to scale back their expectations for a supersized 100 bps Fed rate hike move in July, which prompted some US dollar profit-taking from a two-decade high.
Apart from this, the risk-on impulse - as depicted by strong gains across the global equity markets - led to an extension of the USD corrective pullback and benefitted the risk-sensitive aussie. The momentum assisted the AUD/USD pair to break through a one-month-old descending trend-channel hurdle. This, in turn, was seen as another factor that provided an additional boost to spot prices. That said, growing recession fears, along with rising COVID-19 cases in China, kept a lid on any meaningful upside for the China-proxy Australian dollar.
In the absence of any major market-moving economic releases, the AUD/USD pair remains at the mercy of the USD price dynamics. Apart from this, traders will take cues from the broader market risk sentiment to grab short-term opportunities. The focus, however, would remain on the minutes of the Reserve Bank of Australia's latest policy meeting, scheduled for release on Tuesday.
Technical levels to watch
Bank of England policymaker Michael Saunders crossed the wires in the last hour, saying that they are not done on rate hikes.
Additional quotes:
Not correct to say that the neutral rate is 1%, it is higher.
The neutral rate is lower than the pre-global financial crisis.
Don't want to lean against the idea that the bank rate could go to 2%.
Market reaction
The comments provided a modest lift to the British pound. This, along with broad-based US dollar weakness, lifted the GBP/USD pair to a one-week high. Bulls might now be aiming to reclaim the 1.2000 psychological mark. That said, fears that the BoE could pause the rate hike cycle, amid growing recession fears, might cap the upside.
USD/CNH could extend the bullish momentum to the 6.8000 region in the next few weeks, commented FX Strategists at UOB Group Lee Sue Ann and Quek Ser Leang.
Key Quotes
24-hour view: “Our expectations for USD to ‘retest the 6.7900 level’ did not materialize as it eased off from a high of 6.7841 before closing largely unchanged at 6.7638 (-0.04%). The price actions appear to be part of a consolidation phase. In other words, USD is likely to trade sideways for today, expected to be within a range of 6.7430/6.7800.”
Next 1-3 weeks: “We continue to hold the same view as from last Friday (15 Jul, spot at 6.7670). As highlighted, the improved upward momentum suggests that USD is likely to advance further. The next level to monitor is at 6.8000. Overall, the positive outlook for USD is intact as long as it does not move below 6.7190 (no change in ‘strong support’ level from yesterday).”
“China is listening to US concerns in other areas,” US Treasury Secretary Janet Yellen said in a Reuters interview on Monday, adding that the US relationship with China is not “totally negative.”
Additional quotes
US wants to eliminate ‘undue dependence’ on China for rare earths, certain goods.
China has used coercion to pressure other countries in the past.
China has made some constructive moves on restructuring debt of low-income countries.
- GBP/USD gained traction for the second straight day amid the ongoing USD profit-taking slide.
- Receding bets for more aggressive Fed rate hikes and the risk-on impulse undermined the buck.
- Brexit woes could act as a headwind for sterling and keep a lid on any further gains for the pair.
The GBP/USD pair built on last week's late bounce from the vicinity of mid-1.1700s, or its lowest level since March 2020 and kicked off the new week on a positive note. The intraday move up extended through the early part of the European session and lifted spot prices to a multi-day high, around the 1.1965 region.
Several Federal Reserve officials signalled last week that they did not favour the bigger rate hike that the markets priced in following the release of red-hot US consumer inflation. Investors were quick to react and trimmed their bets for a supersized 100 bps Fed rate hike move in July. Apart from this, the risk-on impulse led to an extension of the US dollar profit-taking slide from a two-decade high, which, in turn, provided a goodish lift to the GBP/USD pair.
The British pound drew additional support from rising odds for another 50 bps rate hike by the Bank of England in August, bolstered by last week's upbeat UK macro releases. Monday's strong move up of over 100 pips could further be attributed to some technical selling on a sustained strength above the 1.1900 round-figure mark. That said, Brexit woes could act as a headwind for sterling and hold back bulls from placing aggressive bets around the GBP/USD pair.
Investors remain worried that the UK government's controversial Northern Ireland Protocol Bill could trigger a trade war with the European Union amid the ongoing cost-of-living crisis. This makes it prudent to wait for strong follow-through buying before confirming that the GBP/USD pair has formed a near-term bottom. In the absence of any major market moving economic data, either from the UK or the US, the USD price dynamics would be looked upon for some impetus.
Technical levels to watch
Bank of England (BOE) policymaker Michael Saunders said on Monday that he thinks that “the tightening cycle may still have some way to go.”
Additional quotes
Rather than focus on precise forecast for bank rate next year.
Doesn't regard bank rate of 2% or higher next year as being unlikely, implausible.
Cost of not tightening promptly enough is relatively high.
Market reaction
GBP/USD extends the rebound on the hawkish commentary from Saunders, now trading at 1.1958, up 0.92% on the day.
- Gold Price holds the recovery from 11-month highs, as the US dollar corrects further.
- US Treasury yields tick higher amid risk flows, light economic calendar.
- XAUUSD sees more upside amid easing aggressive Fed tightening expectations.
Gold Price has staged an impressive bounce from near 11-month lows of $1,698, as the US dollar is on an extending corrective decline amid a risk-on market profile and easing fears over aggressive Fed tightening expectations. Markets are back to pricing a 75 bps July Fed rate hike after Friday’s UoM Inflation expectations gauge dipped to 2.8%. A less aggressive Fed rate hike path could help the US economy skirt a recession. Meanwhile, China announced policy measures to support the property sector as well as to stimulate economic growth. Investors continue to cheer a better market mood, adding to the pain in the safe-haven dollar. XAUUSD price will remain at the mercy of the broader market sentiment amid the Fed’s ‘blackout” period.
Also read: Gold Price Forecast: XAUUSD could face stiff resistance at $1,730 on the renewed upside
Gold Price: Key levels to watch
The Technical Confluence Detector shows that Gold Price sees the immediate upside barrier at the SMA 5 one-day at $1,723, above which the pivot point one-day R2 at $1,725 will get tested.
Buyers need acceptance above the convergence of the Fibonacci 161.8% one-day and Fibonacci 61.8% one-week at $1,728. The pivot point one-day R3 at $1,734 will be the last line of defense for XAU sellers.
Alternatively, a sustained move below the powerful cluster of support levels around $1,716 will fizzle out the recovery momentum. That level is the confluence of the previous day’s high, Fibonacci 38.2% one-week and pivot point one-day R1.
The next support awaits at the intersection of the Fibonacci 23.6% one-week and the SMA10 four-hour. The Fibonacci 38.2% one-day at $1,706 will be next on the sellers’ radars.
Here is how it looks on the tool
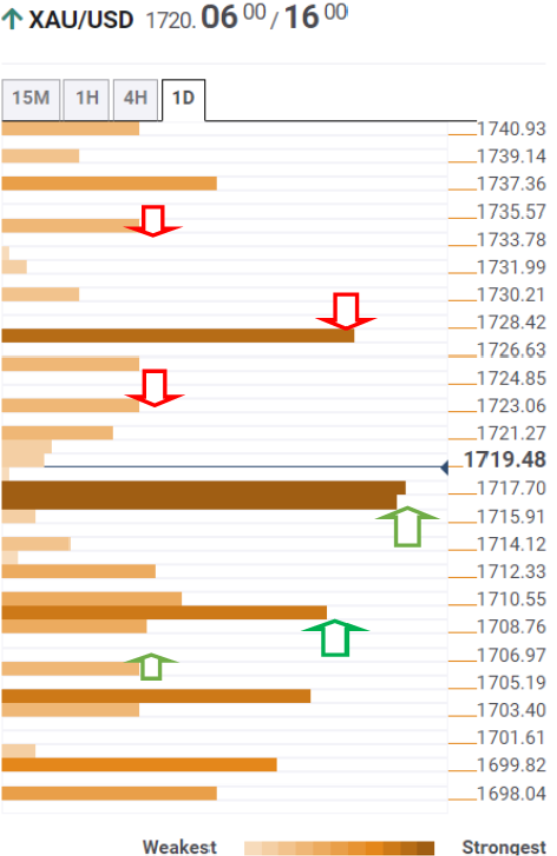
About Technical Confluences Detector
The TCD (Technical Confluences Detector) is a tool to locate and point out those price levels where there is a congestion of indicators, moving averages, Fibonacci levels, Pivot Points, etc. If you are a short-term trader, you will find entry points for counter-trend strategies and hunt a few points at a time. If you are a medium-to-long-term trader, this tool will allow you to know in advance the price levels where a medium-to-long-term trend may stop and rest, where to unwind positions, or where to increase your position size.
- The index extends the corrective downside to multi-day lows.
- The appetite for the risk complex picks up pace on Monday.
- The NAHB Index, TIC Flows next on tap in the NA session.
The greenback, when tracked by the US Dollar Index (DXY), remains under the influx of sellers and visits the area of multi-session lows in the 107.50 zone at the beginning of the week.
US Dollar Index weak on risk-on mood
The index adds to Friday’s pullback and starts the new trading week on the back foot against further improvement in the risk complex. Indeed, the dollar clinches the second daily decline in a row following last week’s cycle peaks north of the 109.00 mark (July 14).
The dollar appears offered as market participants continue to evaluate recent comments from Fed’s rate setters, who somewhat discarded a full point interest rate hike at the July 27 event.
Adding to the upbeat tone among investors, long-term inflation expectations are expected to ease in July, as per the advanced figures from the U-Mich Index published on Friday.

In the US data sphere, the NAHB Index is due later seconded by TIC Flows and 3-month/6-month Bill Auctions.
What to look for around USD
The index comes under pressure following new cycle highs past 109.00 on July 14. It is worth noting, however, that the recent sharp advance in the dollar seems to have come largely in response to the deterioration of the outlook for the euro on the back of persistent uncertainty around a potential recession in the old continent.
Further support for the dollar is expected to come from the Fed’s divergence vs. most of its G10 peers (especially the ECB) in combination with bouts of geopolitical effervescence and the re-emergence of the risk aversion among investors. On the flip side, market chatter of a potential US recession could temporarily undermine the uptrend trajectory of the dollar somewhat.
Key events in the US this week: NAHB Index, TIC Flows (Monday) – Housing Starts, Building Permits (Tuesday) – MBA Mortgage Applications, Existing Home Sales (Wednesday) – Initial Claims, Philly Fed Index (Thursday) – Flash PMIs (Friday).
Eminent issues on the back boiler: Hard/soft/softish? landing of the US economy. Escalating geopolitical effervescence vs. Russia and China. Fed’s more aggressive rate path this year and 2023. US-China trade conflict. Future of Biden’s Build Back Better plan.
US Dollar Index relevant levels
Now, the index is down 0.40% at 107.55 and faces next contention at 107.37 (weekly low July 18) followed by 103.67 (weekly low June 27) and finally 103.41 (weekly low June 16). On the other hand, a break above 109.29 (2022 high July 15) would expose 109.77 (monthly high September 2002) and then 110.00 (round level).
EUR/USD has extended its rebound at the start of the week. 1.0170 aligns as the next critical technical resistance, FXStreet’s Eren Sengezer reports.
Risk perception should continue to impact the market action
“There won't be any high-tier data releases featured in the economic docket on Monday and the greenback could stay on the back foot if risk flows continue to dominate the market action.”
“1.0170 (Fibonacci 38.2% retracement of the latest downtrend) aligns as key resistance. In case buyers manage to flip that level into support, additional gains toward 1.0200 (psychological level), 1.0225 (Fibonacci 50% retracement) and 1.0275 (Fibonacci 61.8% retracement) could be witnessed.”
“1.01 (50-period SMA, Fibonacci 23.6% retracement, psychological level) forms key support before 1.0060 (20-period SMA) and 1.00.”
- USD/JPY witnessed some selling for the second straight day amid modest USD weakness.
- The Fed-BoJ policy divergence, a positive risk tone to undermine the JPY and limit losses.
- Investors might also refrain from placing aggressive bets ahead of the BoJ on Thursday.
The USD/JPY pair edged lower for the second successive day on Monday and retreated further from a 24-year high, around the 139.35-139.40 area touched last week. The steady intraday descent extended through the early European session and dragged spot prices below the 138.00 round-figure mark.
A slew of influential FOMC members pushed back against market expectations for a supersized 100 bps rate hike move at the upcoming policy meeting on July 26-27. In fact, Fed Governor Christopher Waller and St. Louis Fed President Jim Bullard - the biggest Fed hawks - said last Thursday that they were not in favour of the bigger rate hike. Adding to this, Atlanta Fed President Raphael Bostic warned on Friday that moving too dramatically could undermine positive aspects of the economy and add to the uncertainty. This, in turn, prompted some US dollar profit-taking near a two-decade high, which extended through the first half of trading on Monday and exerted some downward pressure on the USD/JPY pair.
That said, a big divergence in the monetary policy stance adopted by the US central bank and Bank of Japan should act as a tailwind for spot prices. Apart from this, a generally positive tone around the equity markets could further undermine the safe-haven Japanese yen and help limit deeper losses for the USD/JPY pair, at least for the time being. Investors might also refrain from placing aggressive bets ahead of the latest BoJ monetary policy update during the latter part of this week. Nevertheless, the fundamental backdrop still seems tilted in favour of bullish traders and supports prospects for the emergence of some dip-buying at lower levels. This warrants some caution before positioning for any further losses.
Hence, it will be prudent to wait for strong follow-through selling before confirming that the pair has topped out in the near term. In the absence of any major market-moving US economic releases on Monday, the US bond yields will influence the USD price dynamics and provide some impetus to the USD/JPY pair. Apart from this, traders will take cues from the broader market risk sentiment to grab short-term opportunities.
Technical levels to watch
The Bank of Japan (BoJ) will announce its monetary policy decision on Thursday, July 21 at 03:00 GMT and as we get closer to the release time, here are the expectations forecast by the economists and researchers of seven major banks.
The central bank is expected to keep interest rates unchanged as the policymakers are committed to keeping a dovish tone to revive the overall demand in the economy. The BoJ is focused to keep the inflation rate to 2%.
Standard Chartered
“We expect it to keep the policy balance rate and 10Y yield target unchanged in July; the ruling LDP’s recent landslide election victory provides a strong mandate for PM Kishida and BoJ Governor Kuroda to maintain the dovish monetary policy stance. The BoJ has been under pressure as Japan’s inflation has risen above 2%. However, Kuroda has reaffirmed that the BoJ will maintain its dovish stance to support the economy. Separately, Japan will release national CPI data on 22 July. We expect CPI inflation to have eased to 2.4% YoY, supporting a dovish stance by the central bank. We think it is too early to say if Japan’s CPI has peaked, with core inflation having risen, indicating that inflationary pressure on the demand side is growing.”
SocGen
“The BoJ will likely apply a -0.1% rate to the policy rate balance in the current account. It will likely purchase the necessary amount of JGBs without setting an upper limit so that the 10y JGB yield remains at around 0%. The BoJ will maintain the current rate guidance that it will continue with QQE and YCC with the aim of achieving the price stability target of 2% for as long as necessary to maintain that target in a stable manner. The BoJ will likely maintain its assessment that Japan's economy has picked up as a trend, although weakness has been seen in some areas, mainly due to the impact of COVID-19 and a rise in commodity prices.”
ING
“Given the recent pick-up in covid cases and weaker-than-expected consumption recovery, we expect the BoJ to stand pat. The BoJ will likely pay more attention to downside risks to growth as inflation remains subdued.”
BBH
“No change is expected for any of the bank’s policy settings. Updated macro forecasts will be released but are unlikely to signal any shift from its current ultra-dovish stance. The weak yen is likely to get a mention of concern but the pace of weakening has slowed in recent weeks. USD/JPY rose nearly 6% in March, nearly 7% in April, fell 1% in May and rose 5.5% in June. So far in July, the pair has risen about 2%. In FX, it’s typically more about the pace than any particular level. That said, once we get to the psychological 140 level, there is not much until the August 1998 high near 147.65.”
Deutsche Bank
“While we expect no change in the current monetary stance and forward guidance on policy rates, the BoJ's Outlook Report is expected to show a downgrade in its growth forecast for FY2022 and an increase in its inflation forecast. The national CPI print will be due the next day and our economist expects core inflation (ex. fresh food) to climb to 2.2% YoY (+2.1% in May) and core-core inflation (ex. fresh food and energy) to 0.9% (+0.8% in May). Small fry in a western context but relatively strong for Japan.”
BofA
“We expect the BoJ to deliver a one-off rates adjustment in 2H CY22 (base case October), consisting of a hike to the short rate target (to 0.0-0.1%) and a shift in the YCC 10yr target permissible trading band to +0.0-0.5%. But we think it is too early for the BoJ to capitulate and see no change to YCC this week. They are right to remain dovish, as core inflation remains well below 2%, while headline inflation at 2.5% is the lowest in G10. Still, given how much JPY has weakened, some verbal intervention is likely. This may prevent further JPY weakness, but is not enough for a turn.”
Citibank
“We assume BoJ policy is kept unchanged at the MPM on July 20-21. However, the BoJ will likely lift Japan’s inflation projections for FY22 and 23. We also expect Japan’s GDP growth outlook to be lowered for both FY22 and FY23 – to c2.0% from 2.9% in April for FY22, and to c1.5% from 1.9% for FY23.”
Gold Price tested below $1,700 at the end of the week. Economists at TD Securities expect the yellow metal to remain under pressure in the weeks to come.
Money managers aggressively cut their net long gold exposure
“Investors cut net length by a very large 6% of open interest (3 million oz) as it became very apparent that real rates on the short end of the curve will continue to increase and there was little chance of upside, as nominal policy rates jumped higher and inflation expectations eroded along with the pending economic slump.”
“Continued Fed hikes and less economic activity should see gold length continue to erode, with prices also likely to remain under pressure in the weeks to come.”
- A combination of factors dragged USD/CAD lower for the second straight day on Monday.
- Reduced bets for an aggressive Fed rate hike move, a positive risk tone weighed on the USD.
- Rebounding oil prices underpinned the loonie and exerted additional pressure on the major.
The USD/CAD pair extended last week's sharp retracement slide from the 1.3225 region, or the highest level since November 2020 and witnessed selling for the second straight day on Monday. The downward trajectory dragged spot prices further below the 1.3000 psychological mark during the early European session and was sponsored by a combination of factors.
Diminishing odds for more aggressive Fed rate hikes, along with signs of stability in the financial markets, dragged the safe-haven US dollar away from a two-decade high. Apart from this, a goodish pickup in crude oil prices underpinned the commodity-linked loonie and prompted some follow-through selling around the USD/CAD pair on Monday.
Two of the most hawkish FOMC members - Fed Governor Christopher Waller and St. Louis Fed President Jim Bullard - said last Thursday that they were not in favour of the bigger rate hike. This, in turn, forced investors to scale back their expectations for a supersized 100 bps Fed rate hike in July, which continued acting as a headwind for the USD.
A weaker greenback and tight global supplies helped offset recession fears, which, along with fresh COVID-19 lockdowns in China, had raised concerns about the fuel demand outlook. Apart from this, the Bank of Canada's surprise 100 bps rate hike last week offered some support to the Canadian dollar and exerted downward pressure on the USD/CAD pair.
With the latest leg down, spot prices have reversed last Thursday's strong move up and moved well within the striking distance of the post-BoC swing low. The mentioned area, around the 1.2935-1.2930 region should act as a pivotal point, which if broken decisively would be seen as a fresh trigger for bearish traders and pave the way for further losses.
In the absence of any major market-moving economic releases, the broader market risk sentiment could drive the USD demand. Apart from this, traders will take cues from oil price dynamics to grab short-term opportunities around the USD/CAD pair.
Technical levels to watch
According to FX Strategists at UOB Group Lee Sue Ann and Quek Ser Leang, further gains in USD/JPY look under pressure on a breach of 137.50 in the next weeks.
Key Quotes
24-hour view: “Our view for USD to ‘continue to advance to 139.50’ was incorrect as it pulled-back to 138.38 before extending its decline during early Asian hours. Further pullback appears likely even though the strong support at 137.50 is not expected to come under threat (there is another support at 137.80). Resistance is at 138.65 followed by 139.00.”
Next 1-3 weeks: “We turned positive USD last Tuesday (12 Jul, spot at 137.20) and indicated that USD could advance to 138.00, as high as 138.50. After USD surged to a high of 139.39, we highlighted last Friday (15 Jul, spot at 139.00) that boost in upward momentum suggests further USD strength. We indicated that the next levels to focus on are at 139.50 and 140.00. USD subsequently pulled back during NY session and upward pressure has eased a tad. That said, there is no change in our view for now. Overall, only a break of 137.50 (no change in ‘strong support’ level from last Friday) would indicate that USD is not strengthening further.”
Considering advanced prints from CME Group for natural gas futures markets, open interest shrank for the second straight session on Friday, this time by around 2.9K contracts. In the same direction, volume faded the previous build and went down by around 49.5K contracts.
Natural Gas now looks to revisit $8.00
Friday’s strong advance in prices of natural gas was in tandem with diminishing open interest and volume, unveiling some lack of sustainability when it comes to the continuation of the uptrend in the very near term. In case bulls push harder, the next target of note for the commodity should emerge around the $8.00 mark per MMBtu (high June 16).
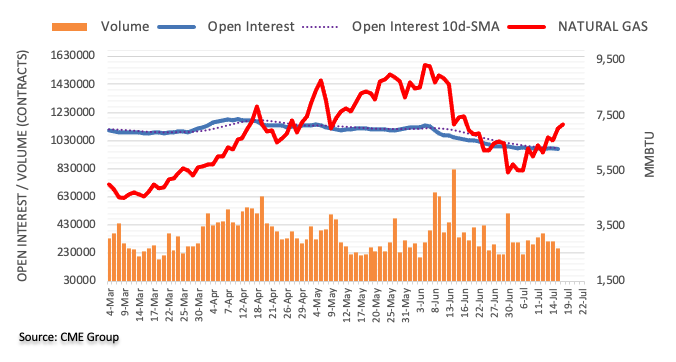
Here is what you need to know on Monday, July 18:
Markets remain risk-positive at the beginning of the week and the greenback is having a tough time finding demand. The US Dollar Index (DXY), which lost 0.6% on Friday, stays on the back foot in the early European session with US stock index futures rising nearly 1%. The European economic docket will not feature any high-tier data releases on Monday. Later in the session, the NAHB Housing Market Index from the US will be looked upon for fresh impetus.
On Friday, the data published by the University of Michigan showed that the Consumer Confidence Index edged higher to 51.5 in July's flash estimate from 49.9. More importantly, the long-run inflation expectation component of the survey declined to 2.8% from 3.1% in June's final print. After this data, the probability of a 100 basis points rate hike in July dropped below 30% from nearly 90% earlier in the week.
Commenting on the rate outlook, Atlanta Fed President Raphael Bostic said that moving "too dramatically" could undermine positive aspects of the economy. Meanwhile, the Wall Street Journal reported that over the weekend Fed policymakers were preparing to raise the policy rate by 75 basis points at the upcoming meeting.
EUR/USD closed the third straight week in negative territory but managed to erase a portion of its weekly losses during Friday's rebound. As of writing, the pair was edging higher toward 1.0150.
Earlier in the day, the data from New Zealand revealed that the Consumer Price Index jumped to 7.3% on a yearly basis in the second quarter from 6.9% in the first quarter. This print came in higher than the market expectation of 7.1%. NZD/USD pair gained traction after this data and started to rise toward 0.6200.
GBP/USD managed to build on Friday's recovery gains early Friday and was last seen trading at its highest level in five days near 1.1950.
Gold suffered heavy losses and registered its lowest weekly close in nearly a year. Supported by the broad-based dollar weakness early Monday, gold gathered recovery momentum and climbed to the $1,720 area.
Bitcoin capitalizes on risk flows early Monday and trades near the upper limit of its one-month-old range near $22,000. Ethereum is already up more than 8% on a daily basis on Monday and continues to push higher toward $1,500.
The US dollar has continued to weaken modestly during the Asian trading session after losing some upward momentum towards the end of last week. The scaling back of expectations for an even larger 100 basis points (bps) hike later this month is the main reason for the USD pullback.
Scaled back expectations for 100 bps Fed hike dampens upward momentum
“The pullback for the US dollar has been driven by a scaling back of expectations for the Fed to deliver a larger 100 bps hike at the upcoming FOMC meeting on 27th July.”
“While the scaling back of expectations for a 100 bps Fed hike later this month has taken some of the upward momentum out of the US dollar, we still believe that current market conditions favour a stronger US dollar.”
In the opinion of FX Strategists at UOB Group Lee Sue Ann and Quek Ser Leang, further upside in AUD/USD is expected to meet a tough barrier around 0.6875 in the near time.
Key Quotes
24-hour view: “We highlighted last Friday that ‘oversold conditions coupled with early signs of slowing momentum suggest AUD is unlikely to weaken much further’ and we expected AUD to ‘trade between 0.6700 and 0.6780’. However, AUD rose to a high of 0.6807 before closing on a firm note at 0.6793 (+0.66%). Upward momentum is beginning to build and the risk for today it tilted to the upside. That said, as upward momentum is only beginning to build, any advance is not expected to challenge the major resistance at 0.6875 (there is another resistance at 0.6840). Support is at 0.6785 but only a break of 0.6760 would indicate that the build-up in upward momentum has fizzled out.”
Next 1-3 weeks: “Last Tuesday (12 Jul, spot at 0.6740), we indicated that AUD could drop below 0.6700 but the chance for AUD to break 0.6650 is not high. After AUD dropped to 0.6683 and rebounded, we highlighted last Friday (15 Jul, spot at 0.6745) that while downward momentum has improved slightly, the odds for a break of 0.6650 have not increased by much. AUD subsequently rebounded strongly to a high of 0.6807 before extending its advance during early Asian hours. While our ‘strong resistance’ level at 0.6815 was not breached, downward momentum has dissipated. In other words, the weakness in AUD has run its course. The current rebound could extend but any advance is expected to face solid resistance at 0.6875. On the downside, a break of 0.6735 (‘strong support’ level) would indicate that AUD is unlikely to rebound further.”
The pullback for the US dollar has helped to lift EUR/USD back above the 1.01-level t after it failed to break decisively below parity last week. As economists at MUFG Bank note, it isn important week for European Central Bank (ECB) policy and Italian politics.
An important week for the EUR
“It is an important policy meeting for ECB as they are expected to begin raising rates for the first time since July 2011. At the same time, market participants are eagerly awaiting details of the ECB’s plans for a new anti-fragmentation policy tool. It is of crucial importance that details of the new tool convince market participants that the ECB can help to keep a lid on fragmentation risk. The last thing that the eurozone needs right now on top of the ongoing negative shock from the Ukraine conflict is a further blow out in peripheral spreads that would reinforce downside risks to growth.”
“The developments have increased the risk of an early election in Italy. A further increase in political uncertainty would result in tighter financial conditions and disrupt efforts to pass the budget and economic reforms needed to access EU Recovery Funds. We still believe risks remain titled to the downside for the euro.”
- USD/TRY regains upside momentum as buyers approach five-week-old resistance.
- Support-turned-resistance line adds to the upside filters, oscillators favor buyers.
- 200-SMA appears a tough nut to crack for bears, buyers can aim for 2021 peak on a successful upside break.
USD/TRY reverses the previous day’s losses, and also adds some more gains, as it picks up bids to $17.45 amid the early Monday morning in Europe.
The Turkish Lira (TRY) pair bounces off an eight-day-old ascending support line to aim for the key 17.50 hurdle comprising multiple tops marked since early June.
Also acting as an upside filter is the previous support line from June 30, close to 17.55, a break of which won’t hesitate to challenge the year 2021 peak surrounding 18.35. However, the 18.00 round figure may entertain USD/TRY bulls before that.
Meanwhile, pullback moves remain elusive until staying beyond the immediate support line, close to 17.28 by the press time.
Even if the quote drops below 17.28, the 200-SMA level of 17.07 precedes the 17.00 round figure to limit the short-term downside of the USD/TRY prices.
It’s worth noting that the bears should remain cautious unless the pair successfully trades below late June’s low of 16.09.
To sum up, the recently firmer RSI (14) joins the pair’s sustained trading above the short-term key supports to favor USD/TRY buyers.
USD/TRY: Four-hour chart

Trend: Limited upside expected
- Silver edged higher for the second straight day and moved further away from a two-year low.
- The set-up favours bearish traders and supports prospects for the emergence of fresh selling.
- Sustained strength beyond the $19.50 zone is needed to negate the near-term negative bias.
Silver gained some positive traction for the second successive day on Monday and moved further away from a two-year low, around the $18.15 region touched last week. The white metal held on to its modest gains through the early European session and was last seen trading just below the $19.00 round figure.
From a technical perspective, the $18.90-$19.00 area represents a short-term trading range support breakpoint and now coincies with the 50-period SMA on the 4-hour chart. Sustained strength beyond might trigger a short-covering move and lift the XAG/USD back towards the $19.45-$19.50 supply zone.
Technical indicators on the daily chart have just recovered from the oversold zone, though are still holding deep in the bearish territory. This, in turn, suggests that the attempted recovery towards the aforementioned barrier could still be seen as a selling opportunity and fizzle out rather quickly.
On the flip side, the $18.50 horizontal zone now seems to protect the immediate downside ahead of the YTD low, around the $18.15 region. This is closely followed by the $18.00 mark, which if broken decisively would be seen as a fresh trigger for bearish traders and pave the way for additional losses.
The XAG/USD might then accelerate the slide towards the $17.45-$17.40 intermediate support en-route the $17.00 round-figure mark. The downward trajectory could further get extended and drag spot prices to the next relevant support near the $16.70-$16.60 region.
Silver 4-hour chart
-637937240113447855.png)
Key levels to watch
Economists at Commerzbank note the increasing perception that investments in China are under pressure due to factors that were perceived as less relevant in the past. Thus, bearish pressure is starting to mount around the Chinese yuan.
CNY-pessimism
“In a world in which households are increasingly considering ethical criteria for their consumption and investment decision the difference between the political systems of the West and the one in China constitutes an increasing reputational risk for Western companies and institutional investors.”
“I get the impression that recently autocratic regimes are being seen as a governance risk.”
“The covid strategy of the Chinese regime illustrates that those who thought that Chinese policy was focussed on high growth as its ultimate goal were wrong. The logical conclusion is likely to be that growth is always merely an interim goal for the Chinese leadership. An investment and growth supporting policy can only be expected for as long as it supports other aims.”
“So far, free-flowing export revenue is supporting CNY. If that eases, once global demand for durable goods normalises, or when the West slides into a recession, the renminbi is likely to get under increasing pressure.”
CME Group’s flash data for crude oil futures markets noted traders scaled back their open interest positions by around 16.7K contracts on Friday, reversing two daily builds in a row at the same time. Volume followed suit and remained erratic, diminishing by around 289.5K contracts.
WTI now looks to regain $100.00 and above
Friday’s rebound in prices of the WTI was amidst declining open interest and volume, which is indicative that the continuation of the bull run could be temporary. Immediately to the upside for crude oil, in the meantime, emerges the key $100.00 mark per barrel.
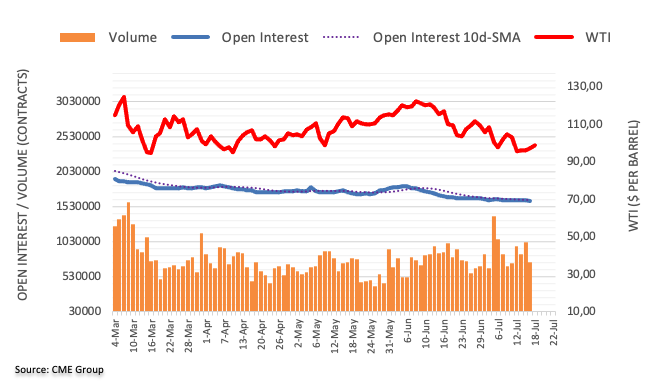
The Polish central bank hiked rates by less than expected this month and signalled a possible end to monetary tightening. In the view of economists at Commerzbank, the zloty will remain under pressure as long as NBP maintains this stance.
NBP to sound sanguine that no further monetary tightening will be required
“NBP governor Adam Glapinski remarked that the zloty’s recent depreciation was not significant enough to delay inflation peaking by Q3. He forecasts inflation to peak at c.16% if the government’s inflation shield measures were extended.”
“The key question is: will this be a technical peak in the year-on-year rate of change as base-effects kick in or a bona fide peaking followed by moderation because of dissipation of inflation drivers and tighter monetary policy? Today’s core inflation reading may give some clues in this respect.”
“But crucially, the zloty will likely extend its underperformance as long as NBP continues to sound sanguine that no further monetary tightening will be required.”
A move above 1.1940 could prompt the selling bias in GBP/USD to subside in the next weeks, suggested FX Strategists at UOB Group Lee Sue Ann and Quek Ser Leang.
Key Quotes
24-hour view: “Last Friday, we expected GBP to ‘trade between 1.1750 and 1.1885’. GBP subsequently traded within a narrower range than expected (1.1805/1.1872). The underlying tone has improved somewhat and GBP is likely to edge higher from here. However, any advance is unlikely to threaten the strong resistance at 1.1940 (there is another resistance at 1.1910). Support is at 1.1850 followed by 1.1815.”
Next 1-3 weeks: “We turned negative GBP early last week. After GBP dropped to 1.1761 and rebounded, we highlighted last Friday (15 Jul, spot at 1.1830) that GBP could continue to weaken but the next major support at 1.1700 may not come into the picture so soon. GBP subsequently rebounded and downward momentum is beginning to wane. That said, only a break of 1.1940 (no change in ‘strong resistance’ level from last Friday) would indicate that the risk for further GBP weakness has dissipated.”
Gold Price rebounds firmly after booking the fifth straight weekly decline. XAUUSD could face stiff resistance at $1,730 on the renewed upside, FXStreet’s Dhwani Mehta reports.
Gold eyes a technical rebound amid Fed’s blackout period, light calendar
“A light US docket combined with the Fed’s blackout period leave XAUUSD in the hands of the broader market sentiment and the dynamics of the dollar, as well as, the yields. The Fed rate hike expectations will also continue to influence the gold price action in the days ahead.”
“Acceptance above the bearish 21-Simple Moving Average (SMA) hurdle at $1,717 is critical to extending the recovery towards the falling 50 SMA at $1,730. A sustained move above the latter will open doors for a test of the $1,750 psychological barrier.”
“On the flip side, a rejection at the 21 SMA could recall sellers, calling for a retest of the wedge resistance now support at $1,694. Bears will, however, challenge the bullish commitments at 11-month lows of $1,698 beforehand.”
How much USD strength is justified? As economists at Commerzbank note, an excess of USD strength also entails risks.
Is the dollar "overbought"?
“The fact that the dollar is appreciating against the yen – the perpetual zero interest rate currency – at a time when the longer-term Fed real interest rate expectations are crumbling, cannot be explained with inflation and monetary policy expectations. If I didn’t hate the word with such a vengeance, I would say that the dollar was ‘overbought’.”
“I would like to be able to argue that the longer-term view of the market for USD exchange rates is more important than what is being expected for the near future. However, if the future is uncertain, that is not necessarily applicable. To be holding USD longs at this stage slightly corresponds to the view that prefers the bird in hand rather than two in the bush.”
“However, the following also applies: as long as it is unclear what the ‘new normal’ will look like following this inflation shock, an excess of USD strength also entails risks.”
Open interest in gold futures markets shrank by around 6.3K contracts at the end of last week and partially reversed the previous daily build, according to preliminary readings from CME Group. Volume, in the same line, dropped for the second session in a row, this time by more than 135K contracts.
Gold remains supported around $1,700
Gold prices revisited the $1,700 region once again on Friday, just to rebound afterwards albeit closing with modest losses. The downtick, however, was amidst diminishing open interest and volume, hinting at the view that a drop below that region appears not favoured for the time being.
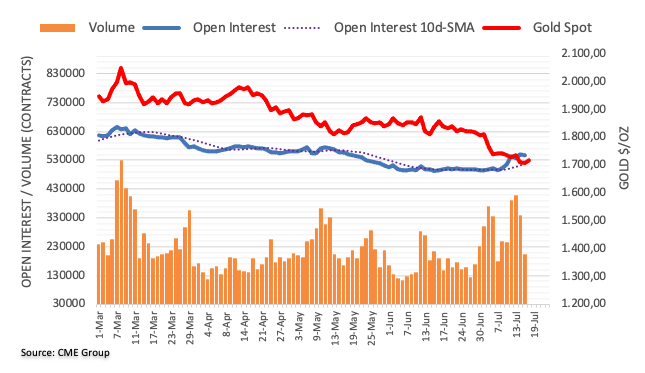
- USD/CHF picks up bids to consolidate intraday losses, struggles to extend Friday’s downside move.
- Market sentiment remains positive but US dollar bounce off daily lows as traders recheck hawkish Fed bets.
- SNB, Fed expected to ease on rate hikes amid recession fears.
USD/CHF bears struggle to keep reins as traders doubt the next moves of the Swiss National Bank (SNB) and the US Federal Reserve (Fed) heading into Monday’s European session. That said, the Swiss currency (CHF) pair picks up bids to 0.9760 as it trims daily loss to 0.05% intraday, after dropping the most in a month the previous day.
Although Friday’s mostly downbeat US data and cautious Fedspeak triggered the US dollar’s weakness, the greenback appears to regain upside momentum as traders recheck dovish Fed bets. On the other hand, talks that the SNB will go for a 0.50% rate hike in September, after the latest 1.0% increase in benchmark rates, also appeared to have favored the USD/CHF bulls.
US Dollar Index (DXY) remains down for the second consecutive day while keeping Friday’s pullback from nearly a two-decade high, recently picking up bids to 107.95. In doing so, the greenback’s gauge versus the six major currencies justifies recently easing hawkish bias over the Fed’s next moves, especially after the previous day’s mixed US data and cautious Fedspeak. Additionally, weighing on the DXY is the Fed policymakers’ silence period ahead of late July’s Federal Open Market Committee (FOMC).
It’s worth noting that Reuters quoted a Swiss newspaper published on Saturday to mention that the SNB is currently planning to raise interest rates by 50 or 75 basis points in its next scheduled monetary policy announcement in September. The news also stated, “Newspaper Schweiz am Wochenende said the central bank was planning a rate hike of 50 basis points to 0.25% from -0.25% at its next scheduled monetary policy announcement on Sept. 22, though the situation could yet change between now and then. It cited one or more unidentified people involved in the matter.”
Amid these plays, stock futures and Asian equities track Wall Street’s gains but the US Treasury yields remain pressured of late.
Moving on, Tuesday’s Swiss trade numbers may entertain USD/CHF traders ahead of Friday’s US flash PMIs for July. However, major attention will be given to the central bank chatters and an absence of Fedspeak, due to the pre-Fed blackout could keep the pair sellers hopeful.
Technical analysis
50-DMA defends USD/CHF bulls around 0.9735 but the USD/CHF recovery remains elusive unless crossing the 0.9875 hurdle on a daily closing basis.
- GBP/USD is expected to balance above 1.1900 as DXY weakens significantly.
- UK’s jobless rate is seen stable at 3.8%. The entire focus will remain on earnings data.
- Rishi Sunak is leading among contenders for Conservative Party leader and UK Prime Minister.
The GBP/USD pair has rebounded strongly after a mild correction towards 1.1880 in the early European session. The cable has refreshed its intraday low at 1.1908 and is expected to extend further amid a sell-off in the US dollar index (DXY).
The DXY has tumbled to near 107.80 and is likely to extend losses as investors are expecting that the price pressures in the US economy are near their peak levels. The consensus is backed by vulnerable oil prices in July and likely lower aggregate demand. Expectations for slippage in the overall demand will shift the raw-material prices lower and therefore, result in a sigh of relief for the inflation rate. Although the odds for a mega rate hike by the Federal Reserve (Fed) will remain stable.
On the UK front, investors are awaiting the release of the employment figures and inflation data. The Unemployment Rate is seen as stable at 3.8%. The focus will remain on the Average Hourly Earnings data. In times, when individuals are facing the headwinds of red-hot inflation, lower earnings will dampen the market mood.
The UK Consumer Price Index (CPI) is seen higher at 9.3% vs. 9.1% recorded earlier. Also, the core CPI could improve minutely to 6% from the prior release of 5.9%. This will compel the Bank of England (BOE) to elevate interest rates further.
Meanwhile, investors have ignored political jitters in the UK economy. Rishi Sunak is leading among the contenders for the leader of the Conservative Party and the UK’s Prime Minister. It will be interesting to see who will grab the second spot and will go head-to-head with Sunak.
Gold suffered heavy losses for the fifth straight week and dropped below $1,700 for the first time in nearly a year. XAUUSD could fall toward $1,680 if $1,700 is confirmed as resistance, FXStreet’s Eren Sengezer reports.
$1,740 aligns as the first resistance
“$1,740 (static level) aligns as the first resistance before $1,760 (mid-point of the descending regression channel) in case gold stages a technical correction next week.”
“On the downside, additional losses toward $1,680 (static level from March 2021) and $1,670 (static level from May 2020) could be witnessed if sellers manage to turn $1,700 (static level, psychological level) into resistance.”
- GBP/JPY prints four-day uptrend inside weekly ascending trend channel.
- Gradually rising RSI, sustained trading above 100-SMA favor bulls.
- Convergence of the previous resistance line, channel’s support offers a tough nut to crack for sellers.
GBP/JPY grinds higher around 164.50 heading into Monday’s London open. In doing so, the cross-currency pair keeps Thursday’s upside break of the monthly resistance line, now support, inside an ascending trend channel from July 06.
In addition to the trend line breakout, the pair’s successful trading above the 100-SMA joins a firmer RSI (14) to keep buyers hopeful.
That said, the 38.2% Fibonacci retracement of June 16-21 upside, near 164.85, appears immediate hurdle for the pair traders to watch before directing bulls to the stated channel’s upper line, at 165.80 by the press time.
Should GBP/JPY bulls keep reins past 165.80, multiple hurdles around 167.00 can test the upside momentum ahead of highlighting the tops marked in June around 167.85 and 168.75.
Meanwhile, the 100-SMA level of 164.12 restricts the immediate downside of GBP/JPY before the 50% Fibonacci retracement level near 163.90.
It’s worth noting, however, that the pair’s declines past 163.90 appear difficult as a confluence of the resistance-turned-support and lower line of the stated channel highlights 163.15 as the key support.
GBP/JPY: Four-hour chart
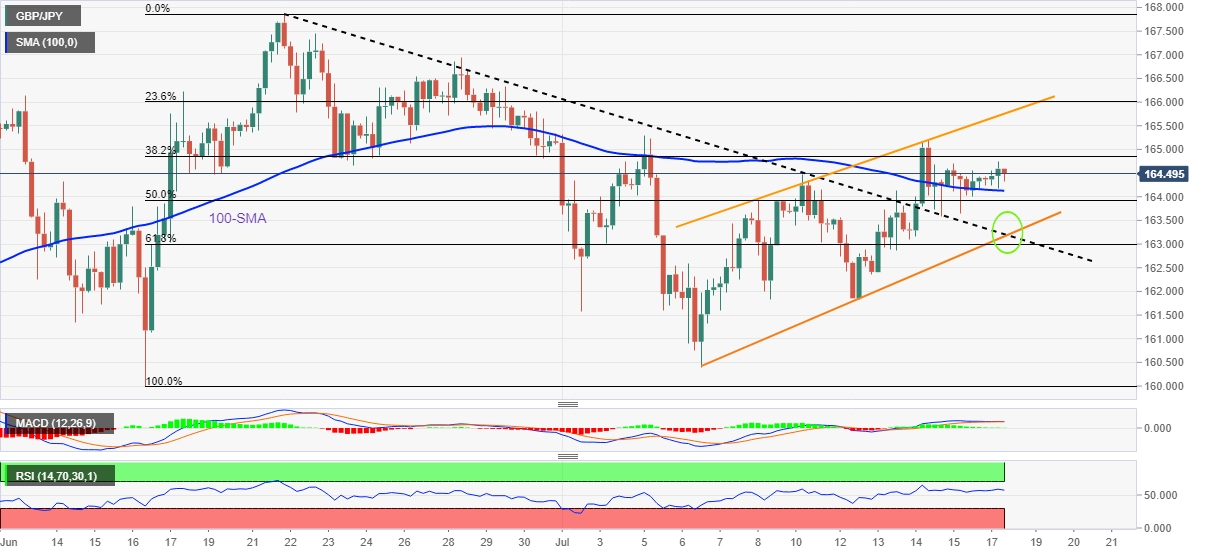
Trend: Further upside expected
FX option expiries for July 18 NY cut at 10:00 Eastern Time, via DTCC, can be found below.
- EUR/USD: EUR amounts
- 0.9975 452m
- 1.0000 1.1b
- 1.0100 583m
- 1.0175 753m
- 1.0200 250m
- USD/JPY: USD amounts
- 135.75 360m
FX Strategists at UOB Group Lee Sue Ann and Quek Ser Leang noted a deeper drop in EUR/USD to the 0.9920 region seems to be losing momentum for the time being.
Key Quotes
24-hour view: “Last Friday, held the view that ‘there is scope for EUR to retest the 0.9950 level before the risk of a stronger rebound would increase’. However, EUR did not retest 0.9950 as it rebounded to a high of 1.0097 before closing on a firm note at 1.0087 (+0.71%). The rebound could extend but a sustained rise above the ‘strong resistance’ at 1.0120 appears unlikely. On the downside, a breach of 1.0040 (minor support is at 1.0065 would indicate that EUR is unlikely to rebound further.”
Next 1-3 weeks: “In our latest narrative from last Friday (15 Jul, spot at 1.0020), we highlighted that EUR could continue to drop, albeit at a slower pace. We noted that downward momentum has not improved by much and the odds for a sustained decline below 0.9920 are not high. EUR subsequently rebounded and closed higher by 0.71% (NY close of 1.0087), its largest 1-day advance in a month. Downward momentum is beginning to wane and this coupled with oversold conditions suggests that the odds for the weakness in EUR to extend to 0.9920 have diminished considerably. However, only a break of 1.0120 (no change in ‘strong resistance’ level from last Friday) would indicate that the weak phase in EUR that started more than two weeks ago has come to an end.”
- Asian equities have displayed a broad-based buying interest amid a fall in the DXY.
- Contaminated US Retails Sales have trimmed the DXY’s safe-haven appeal.
- Oil prices have rebounded firmly as OPEC has not promised any increment in supply.
Markets in the Asian domain are performing strongly as the US dollar index (DXY) has witnessed a steep fall after failing to sustain above the crucial resistance of 109.00. Contaminated US Retail Sales and dull Consumer Confidence have resulted in a steep fall in the DXY.
At the press time, Japan’s Nikkei225 added 0.54%, ChinaA50 gained 0.90%, Hang Seng surged 2.51% and Nifty50 jumped 1.01%.
On Friday, the US Retail Sales remained upbeat after landing at 1%, higher than the estimates of 0.8% and the prior release of -0.3%. One needs to understand that the upbeat economic data is driven by soaring oil prices. Oil prices in June were significantly higher whose effect was accelerating energy bills for the households.
Apart from that, the University of Michigan reported the Consumer Sentiment Index (CSI), which remained minutely above 51. However, the sentiment data is still near the lowest in the past two years. This has brought a significant sell-off in the DXY prices.
On the oil front, expectations of tight supply have brought a rebound in oil prices. U.S. President Joe Biden's trip to Saudi Arabia has failed to bring a promise of more oil supply on the table. OPEC is in no mood in accelerating supplies in the market and a reason behind that could be the high prices. OPEC nations: Saudi Arabia and the United Arab Emirates (UAE) which carries the potential of increasing supplies are getting higher revenues amid higher oil prices and higher supply. This is going to dampen the chances of bringing price stability sooner.
In China, lockdown worries are not finding a sigh of relief as the economy has reported more than 1,200 Covid-19 cases this weekend. The odds of announcing the implementation of the zero-Covid policy by the Chinese administration look favorable. This might impact the Chinese equities principally.
- Copper Price grinds higher while keeping the previous day’s bounce off November 2020 lows.
- China takes measures to avoid potential crisis in real estate market.
- US dollar bears the burden of mixed US data, receding hawkish Fed bets.
Copper traces upbeat industrial metals while posting the second daily gains at around $3.30, as per the most active COMEX Futures, amid the early Monday morning in Europe. In doing so, the red metal cheers optimism among Chinese real housing markets, as well as benefits from the softer US dollar, amid a sluggish Asian session.
“Chinese regulators encouraged lenders to extend loans to qualified real estate projects to ease risks from a widening mortgage-payment boycott on unfinished houses, which helped property and bank stocks recover some recent losses,” said Reuters.
Also concerning China news, which helped copper buyers, was from People’s Bank of China’s (PBOC) Governor Yi Gang. “China's economy is facing downward pressure due to COVID-19 and external shocks, and the central bank will "increase implementation of prudent monetary policy" to support the real economy,” per Reuters. The news also quotes a commentary that appeared in China’s state-owned Securities Times while mentioning, “China's monetary policy has ample room and sufficient tools, including further cutting banks' reserve requirements, to cope with new challenges amid a shaky economic recovery.” It’s worth noting that Xinhua quotes Chinese Vice Premier Liu He as urging stronger steps be taken to boost employment.
The news also mentioned that the three-month copper on the London Metal Exchange (LME) rose 1.7% to $7,131.50 a tonne by 04:01 GMT. Further, the most-traded August copper contract on the Shanghai Futures Exchange (SFE) advanced 2.6% to 56,040 yuan ($8,306.41) a tonne by the press time.
That said, the US Dollar Index (DXY) drops for the second consecutive day while extending Friday’s pullback from nearly a two-decade high. In doing so, the greenback’s gauge versus the six major currencies justifies recently easing hawkish bias over the Fed’s next moves, especially after the previous day’s mixed US data and cautious Fedspeak. Additionally weighing on the DXY is the Fed policymakers’ silence period ahead of late July’s Federal Open Market Committee (FOMC).
Reuters also came out with the news saying, “Global miner BHP Billiton is likely to reconsider its investment plans in top copper producer Chile if the government moves ahead with mining tax hikes, according to a report on Sunday.” The news could weigh on the metal prices on matching reality.
On a different page, a light calendar could keep the US dollar pressured while receding hawkish Fed bets may also help the copper price to stay in the recovery mode. Though, the PBOC Interest Rate Decision, up for Wednesday, could also entertain copper traders.
- Bulls are attempting to get well-placed above the plotted trendline from 0.7070.
- A selling climax below 0.6700 is hinting a responsive buying action structure.
- The RSI (14) is striving to shift into the bullish range of 60.00-80.00.
The AUD/USD pair has witnessed a mild correction after displaying exhaustion signals while attempting to sustain above the crucial resistance of 0.6800. The asset has recorded an intraday high of 0.6820 after carry-forwarding the positive bias of Friday.
On a four-hour scale, the aussie bulls have driven the asset above the trendline placed June 16 high at 0.7070, adjoining June 28 high at 0.6965. A selling climax below 0.6700 last week has resulted in a responsive buying action.
AUD/USD has crossed the 20-and 50-period Exponential Moving Averages (EMAs) at 0.6778 and 0.6790 respectively, which adds to the upside filters. It is worth noting that the 50-period EMA is still higher than the 20-EMA while the asset has crossed both firmly. This indicates a strong responsive buying action after a steep downside.
The Relative Strength Index (RSI) (14) has attempted to cross 60.00 after oscillating in the 40.00-60.00 range. This has cleared that the aussie bulls need more strength to drive the asset higher.
A pullback move towards the 20-EMA at 0.6778 will allow more investors to participate in the ongoing rally. An occurrence of the same will send the major towards Monday’s high at 0.6819, followed by July 8 high at 0.6875.
On the flip side, the greenback bulls could take the charge if the asset drops below July 5 low at 0.6761 decisively. This will send the pair towards Tuesday’s low at 0.6710. A slippage below Tuesday’s low will drag the asset towards Thursday’s low at 0.6680.
AUD/USD four-hour chart
-637937180969345442.png)
Australian Treasurer Jim Chalmers said on Monday, taxpayers will find the upcoming government budget update confronting.
The latest debt forecast will be provided on July 28.
Key quotes
Government had inherited the "trickiest set of economic conditions" in memory.
"The news in that statement will be in many ways confronting when it comes to our expectations of inflation.”
"When it comes to the impact of interest rate rises on growth, when it comes to what this spike in inflation means for real wages."
"If you think about the consequences of those rising interest rates on the budget, more than a billion dollars this year, more than $5 billion in the last year ... these are not small amounts of money.”
"The key task of every budget is to make sure that we are getting maximum bang for buck from taxpayers' dollars, which are costing more and more to service because every additional dollar in the budget is a borrowed dollar."
Market reaction
AUD/USD is struggling to hold above 0.6800, despite the upbeat sentiment and expectations of a 75 bps RBA rate hike next month. The renewed uptick in the US dollar is capping the aussie.
The spot was last seen trading at 0.6802, defending 0.15% gains on the day.
- USD/JPY bounces off intraday low to pare recent losses inside bullish chart pattern.
- Oscillators join multiple supports to challenge bears until the quote stays beyond 137.90.
- Bulls need 138.65 breakout to retake control and refresh the multi-year high.
USD/JPY bears struggle to keep reins as the quote recovers to 138.35 heading into Monday’s European session. In doing so, the yen pair remains inside a bull flag chart pattern during the second negative day.
The quote’s latest rebound took place from the weekly support line, around 138.08 by the press time. The recovery moves also track firmer RSI and the easing bearish bias of the MACD to keep buyers hopeful.
However, a clear upside break of the stated bull flag’s upper lie, at 138.65 by the press time, appears necessary for the USD/JPY buyers to challenge the 23-year high marked during the last week, around 139.40.
In doing so, the 140.00 threshold could lure short-term bulls ahead of the theoretical target surrounding 142.00.
On the contrary, a downside break of the weekly support line near 138.65 isn’t a call to the USD/JPY bears as the support line of the stated flag and the 100-HMA, around 137.95, appears a tough nut to crack for the sellers.
Following that, the corrective pullback may aim for July 12 low near 136.50. However, the one-week-old horizontal support around 137.75-70 could challenge the USD/JPY sellers.
USD/JPY: Hourly chart
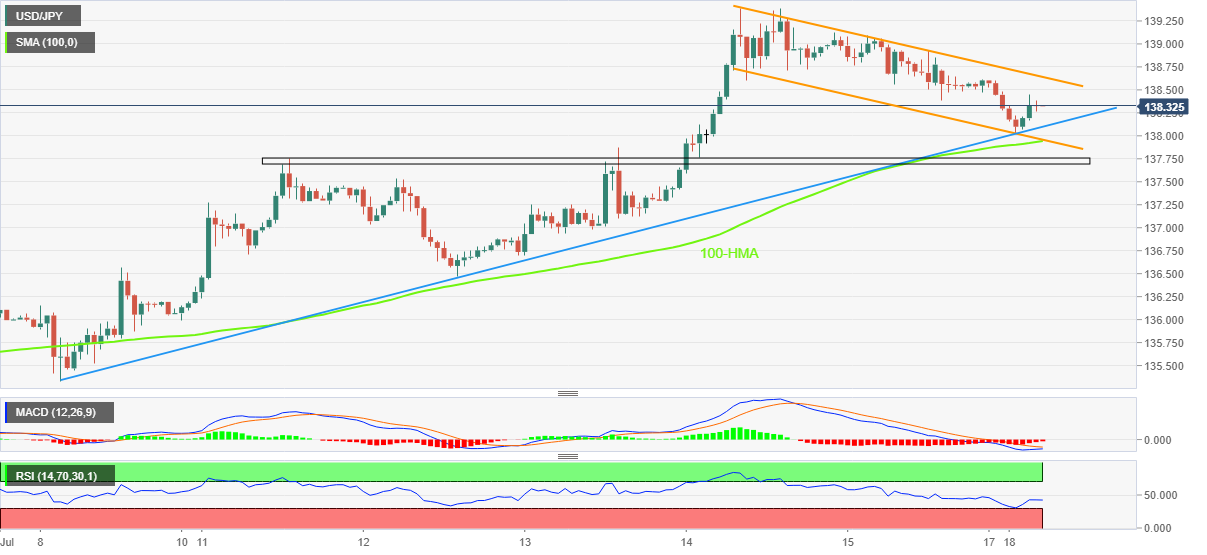
Trend: Bullish
- USD/INR takes the bids to refresh intraday high, reverses Friday’s pullback.
- RBI says India on course to become world's fastest-growing economy.
- Hawkish Fed bets ease on mixed US data, cautious Fedspeak.
- Absence of Fedspeak, major data also allows USD to pare recent gains.
USD/INR renews intraday high around 79.80 during the initial hours of Monday’s Asian session. In doing so, the Indian rupee (INR) pair fails to cheer RBI’s upbeat expectations, as well as a reduction in the market’s hawkish concerns surrounding the US Federal Reserve (Fed).
That said, Reuters came out with the news while quoting the Reserve Bank of India’s (RBI) statement published on Saturday. “India's economy has remained resilient in the face of global headwinds and with inflation coming off its recent peak is expected to stay on course to become the world's fastest-growing economy,” said the RBI.
The RBI Bulletin also mentioned that the recent revival of the southwest monsoon and renewed planting raised expectations that rural demand will soon catch up with urban spending and consolidate a recovery.
On the other hand, the US Dollar Index (DXY) extends Friday’s losses to 107.93, down 0.08% intraday, as traders curtail hawkish calls over the Fed’s next move. Behind the moves could be the recently mixed US data and slightly cautious Fedspeak.
It’s worth noting that the US Index of Consumer Expectations declined to its lowest level since May 1980 while flashing 47.3 at the latest. The reductions in the US inflation expectations joined downbeat US Industrial Production for June, down to -0.20% MoM, as well as pessimistic economic forecasts for Q2 by the US Atlanta Fed’s GDP, also weigh on the US dollar. That said, the Atlanta Fed GDPNow release bolstered recession fears after the estimate for 2Q growth is coming in at -1.5% versus -1.2% last.
On a different page, Atlanta Fed President Raphael Bostic said on Friday that June's 75 basis points rate hike was a "big move" and added that the Fed wants policy transition to be orderly, as reported by Reuters. Further, San Francisco Fed President Mary Daly said on Friday that the "Fed is working on getting down inflation without stalling economy." Additionally, St. Louis Federal Reserve Bank President James Bullard sounded neutral as he said, per Reuters, on Friday that it wouldn't make too much of a difference to do a 100 basis points (bps) or a 75 bps rate hike at the next meeting. In this regard, Wall Street Journal’s (WSJ) Nick Timiraos also came out with a piece that turned down the market’s expectations of a 1.0% Fed rate hike.
Amid these plays, US stock futures and Asia-Pacific shares track Wall Street’s gains to portray cautious optimism in the market and weigh on the US dollar. However, doubts about the RBI’s optimism join comparatively more hawkish Fed than the Indian central bank to keep USD/INR buyers hopeful.
Technical analysis
Despite the latest rebound, USD/INR needs a daily closing beyond a three-week-old resistance line, around 80.00 by the press time, to keep buyers hopeful. Until then, the overbought RSI hints at a pullback towards the monthly support line near 79.50.
- EURUSD price is attempting to hold itself above 1.0100 ahead of stable Eurozone HICP figures.
- The ECB is expected to elevate its interest rates this time.
- The upbeat US Retail Sales are contaminated by higher price pressures.
EURUSD price is juggling in a narrow range of 1.0100-1.0114 in the Asian session. The pair is scaling sharply higher amid a sell-off in the US dollar index (DXY). The asset has displayed a bullish open test-drive price action as a minor downside move after opening found significant bids from the market participants. The major has comfortably established above Friday’s high at 1.0098 and is expected to extend gains further.
Meanwhile, the DXY is dropping firmly following the bearish bias observed on Friday. The DXY has slipped to near 107.77, at the press time, and has displayed a vertical downside move after surrendering the critical support of 108.00. The ongoing slaughter in the asset after failing to sustain above the crucial resistance of 109.00 has shifted the asset into a negative trajectory. Going forward, the asset may find a cushion around 107.50.
Also Read: EUR/USD could recover, gold price slides further

ECB President Christing Lagarde may dictate a rate hike this time
Price pressures accelerate US Retail Sales
EURUSD price is aiming higher as the upbeat US Retail Sales are the outcome of soaring price pressures in the US economy. On Friday, US Retail Sales landed at 1%, much higher than the prior release of -0.3% and the expectations of 0.8%. Costly fossil fuels and food products have resulted in a sharp rise in US Retail Sales. This has underpinned the shared currency bulls against the greenback. Price pressures from oil and food products don’t add up to the upbeat Retail Sales qualitatively.
Lower Consumer Confidence forecasts the gloomy outlook
A broader slippage in consumer confidence as price pressures have bitten their paychecks is indicating a gloomy outlook ahead. This may further accelerate the EURUSD price going forward. There is no denying the fact that the confidence of consumers has trimmed significantly in the US economy. The US Michigan Consumer Sentiment Index (CSI) landed minutely higher at 51.1 that the estimates of 49.9 and the prior release of 50. The figure is well near the lowest in the past two years.
Fed’s interest rate is seen at 3.75% by 2022
Federal Reserve (Fed) policymakers are hiking their interest rates target for 2022 vigorously. St. Louis Fed Bank President James Bullard said on Friday that he expects to see good employment reports through the second half of this year, as reported by Reuters. Also, the interest rates could reach 3.75% by year-end. Fed’s Bullard doesn’t see a recession despite the economy seeing a slowdown in the trend pace of growth. Also, he stated that inflation will continue to surprise the market participants to the upside. On a broader note, the EURUSD price could be under the bear’s grip.
Stable Eurozone HICP numbers are expected
EURUSD is expected to display wild moves as Eurostat will report the Harmonized Index of Consumer Prices (HICP) on Tuesday, which is seen stable at 8.6% on an annual basis. Steady HICP figures in the eurozone are expected to delight the European Central Bank (ECB) as they won’t require moving furiously toward raising interest rates. Other Western nations are reporting a steep rise in their inflation rates. Also, the expectations are also stalling higher.
ECB monetary policy to be the key event this week
The interest rate policy by the ECB will be the key event this week, which will keep the EURUSD price on the tenterhooks. The central bank is likely to elevate its interest rates as higher inflation rates are resulting in large real income shocks for the households. Energy bills are soaring after the prohibition of oil imports from Russia. It is worth noting that the ECB has not elevated its interest rates yet. As a rate hike by 50 basis points these days is a new normal now, a similar rate for testing waters could be a decent approach for the ECB. The central bank has already concluded the Asset Purchase Program (APP). Now, the focus has shifted to interest rate elevation.
EURUSD technical analysis
EURUSD is scaling higher in a Rising Wedge pattern which signals a gradual upside move but holds a negative bias on a broader basis. The upper portion and lower portions of the aforementioned chart pattern are placed from Thursday’s high and low at 1.0048 and 0.9952 respectively.
The 20-and 50-period Exponential Moving Averages (EMAs) at 1.0078 and 1.0061 respectively are scaling higher, which adds to the upside filters.
Meanwhile, the Relative Strength Index (RSI) (14) has shifted into the bullish range of 60.00-80.00, which signals more gains ahead.
A pullback move towards the 20-EMA at 1.0078 will result in a bargain buy for the market participants, which will drive the asset towards Wednesday’s high at 1.0123. A breach of the latter will open doors for July 6 low at 1.0617.
Alternatively, the shared currency bulls could lose momentum if the asset drops below the psychological support of 1.000. This will drag the asset towards Thursday’s low at 0.9952, followed by the round-level support at 0.9950.
EURUSD hourly chart
-637937159681283380.png)
Key Trading Levels For The Week Ahead: AUD/USD, EUR/USD, GBP/USD, and crosses
- Gold Price recovers from yearly low as softer USD, key technical support favor buyers.
- Mixed data, Fedspeak allowed XAUUSD bears to take a breather amid pre-FOMC blackout period.
- Headlines from China, risk reversal adds strength to the corrective pullback with eyes on ECB, PMIs.
Gold Price (XAUUSD) remains on the front foot around the intraday high of $1,717 as it consolidates recent losses around the yearly low, while also snapping a two-day downtrend heading into Monday’s European session. The metal’s recent gains could be linked to the US dollar’s sustained weakness, as well as optimism in the options market. It’s worth observing that a sluggish start to the key week also contributes to the XAUUSD recovery.
US Dollar Index (DXY) drops for the second consecutive day while extending Friday’s pullback from nearly a two-decade high. In doing so, the greenback’s gauge versus the six major currencies justifies recently easing hawkish bias over the Fed’s next moves, especially after the previous day’s mixed US data and cautious Fedspeak. Additionally, weighing on the DXY is the Fed policymakers’ silence period ahead of late July’s Federal Open Market Committee (FOMC).
Also read: Gold Weekly Forecast: Upward correction could be in the books during Fed's blackout
Gold Price rises as Fedspeakers refrain from 100 bps calls
Gold snaps two-day downtrend as Fed hawks retreat.
Fed policymakers intervened to cool down market expectations of a 1.0% rate hike on Friday, which in turn helped the Gold Price to defend the yearly low marked on Thursday, not to forget positing a rebound from the key support line on a closing basis. Atlanta Fed President Raphael Bostic said on Friday that June's 75 basis points rate hike was a "big move" and added that the Fed wants policy transition to be orderly, as reported by Reuters. On the other hand, San Francisco Fed President Mary Daly said on Friday that the "Fed is working on getting down inflation without stalling economy." Further, St. Louis Federal Reserve Bank President James Bullard sounded neutral as he said, per Reuters, on Friday that it wouldn't make too much of a difference to do a 100 basis points (bps) or a 75 bps rate hike at the next meeting. In this regard, Wall Street Journal’s (WSJ) Nick Timiraos also came out with a piece that turned down the market’s expectations of a 1.0% Fed rate hike.
US economics also probe XAUUSD bears
Friday’s mostly downbeat prints of the US economics helped strengthen concerns that the market expectations of a 100 bps Fed rate hike aren’t well-suited amid impending recession fears. The Index of Consumer Expectations declined to its lowest level since May 1980 at 47.3. The downbeat figures also joined a 0.20% contraction by the US Industrial Production for June to favor XAUUSD buyers. However, US Retail Sales for June grew 1.0% MoM versus 0.8% expected and -0.1% prior (revised from -0.3%) whereas the University of Michigan's Consumer Confidence Index edged higher to 51.5 in July's flash estimate, versus 49.9 expected and 50.0 prior.
Atlanta Fed hints at recession
Friday’s Atlanta Fed GDPNow release bolstered recession fears after the estimate for 2Q growth is coming in at -1.5% versus -1.2% last. The concerns gained momentum as the latest forecasts hint at the second negative figures, which technically mark the US recession. That said, the GDPNow model estimate for real GDP growth (seasonally adjusted annual rate) in the second quarter of 2022 is -1.5 percent on July 15, down from -1.2 percent on July 8.
RR snaps a four-week downtrend
One-month XAUUSD risk reversal (RR), a difference between call options and put options, marked the first weekly gain in five while also posting the strongest RR in favor of bulls as it printed a 0.210 weekly figure by the end of Friday’s North American session. That said, the daily RR figures also rose for the past three consecutive days, to 0.015 at the latest. As the receding bearish bias of Gold Price joins recently hawkish options market clues, the latest rebound is likely to prevail.
China also underpins recovery
Headlines suggesting more stimulus from China also help improve Gold Price. Earlier on Monday, People’s Bank of China (PBOC), Governor Yi Gang said, per Reuters, “China's economy is facing downward pressure due to COVID-19 and external shocks, and the central bank will "increase implementation of prudent monetary policy" to support the real economy.” Reuters also quotes a commentary that appeared in China’s state-owned Securities Times while mentioning, “China's monetary policy has ample room and sufficient tools, including further cutting banks' reserve requirements, to cope with new challenges amid a shaky economic recovery.” It’s worth noting that Xinhua quotes Chinese Vice Premier Liu He as urging stronger steps be taken to boost employment. It should be noted that China is among the world’s biggest gold consumers and hence positive from the dragon nation can favor XAUUSD bulls.
ECB, PMIs in focus
European Central Bank’s (ECB) Monetary Policy Meeting and flash PMIs for Eurozone and the US will be crucial for the Gold Price during this week. While the ECB hawks are all set to announce a 0.25% rate hike, the first in many years, concerns surrounding the recession in Germany appear to challenge the policymakers. On the other hand, the preliminary PMIs for July are likely to portray easing. However, the risk of marking a pessimistic outcome is more for the bloc than the US, which in turn could weigh on XAUUSD.
Gold Price technical outlook
Gold Price extends bounce off an upward sloping support line from March 2021. That said, the corrective pullback from the yearly low also takes clues from the oversold RSI (14) to direct XAUUSD buyers towards a horizontal area comprising multiple levels marked since early 2021, surrounding $1,721-22.
It’s worth noting, however, that the 78.6/% Fibonacci retracement of March 2021-22 upside, near $1,760, could test the metal’s upside past $1,722, a break of which could quickly propel Gold Price to May’s low near $1,787.
On the contrary, the aforementioned support line from March 2021 joins oversold RSI (14) to restrict short-term XAUUSD declines around $1,709. Also acting as a downside filter is the $1,700 threshold.
In a case where Gold Price remains weak past $1,700, the odds of witnessing a south-run towards early 2021 bottom of $1,676 can’t be ruled out.
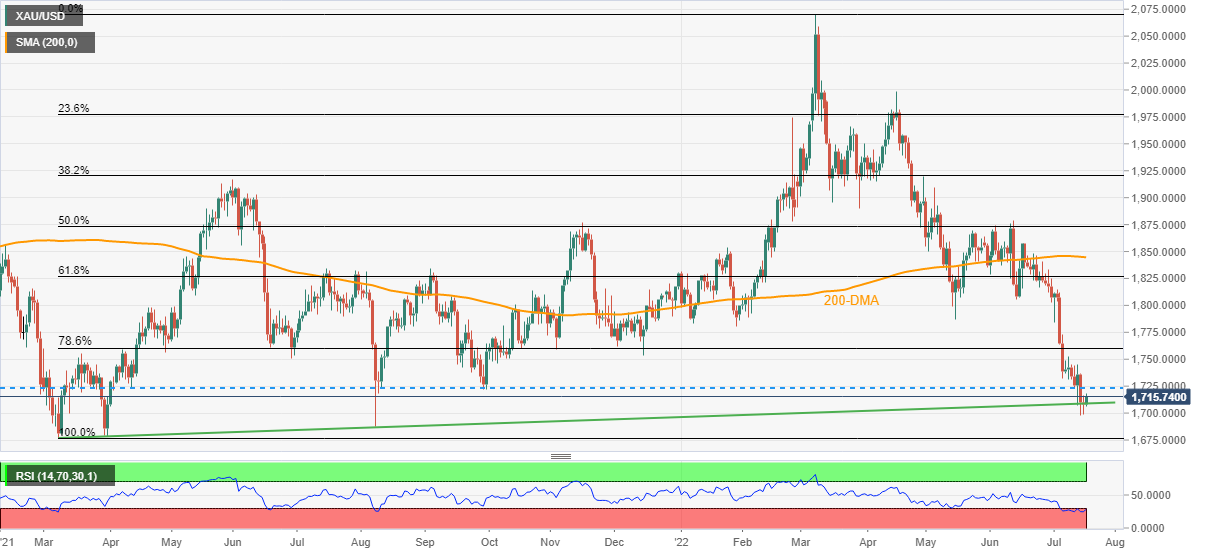
Can gold prices hold above $1700 as focus shifts to inflation data?
- Steel prices are picking offers on lower consumer confidence globally.
- Renewed fears of lockdown in China have trimmed the demand forecast for steel.
- The Chinese economy has reported more than 1,200 new Covid-19 cases this weekend.
Steel prices have dropped significantly as production expectations have been trimmed significantly to the worse for the first time in two years after the pandemic. The market participants have slashed the output forecasts as higher price pressures are biting the margins of the company.
Higher raw material prices and a simultaneous decline in the overall demand due to real income shocks and lower consumer confidence have dampened the demand for various commodities.
As per the report on Global Business Outlook from S&P Global, the net balance of companies globally is indicating a rise in business activities over the year by 22%, which is well below the decade high of 41%. The recorded figure of 22% is the lowest since the emergence of Covid-19.
Interest rate escalation by the central banks has squeezed liquidity from the market, which has forced companies to tap cost money to fund their investment opportunities. This has forced the think tanks of the market to trim their forecasts for growth significantly. Consumer confidence has dropped to the lowest in two years in the US and eurozone.
Also, renewed fears of lockdown in China have forced the market participants to wind-up longs in steel. The Chinese administration has reported 1,200 new Covid-19 cases this weekend. There is no denying the fact that the Chinese economy will resort to a zero-Covid policy again and will announce lockdown curbs to contain the spread.
The Reserve Bank of New Zealand (RBNZ) released its Sectoral Factor Model Inflation gauge for the second quarter of 2022 this Monday.
The gauge accelerated to 4.8% YoY in Q2 2022 vs. 4.6% seen in Q1 (revised sharply higher from 4.2%).
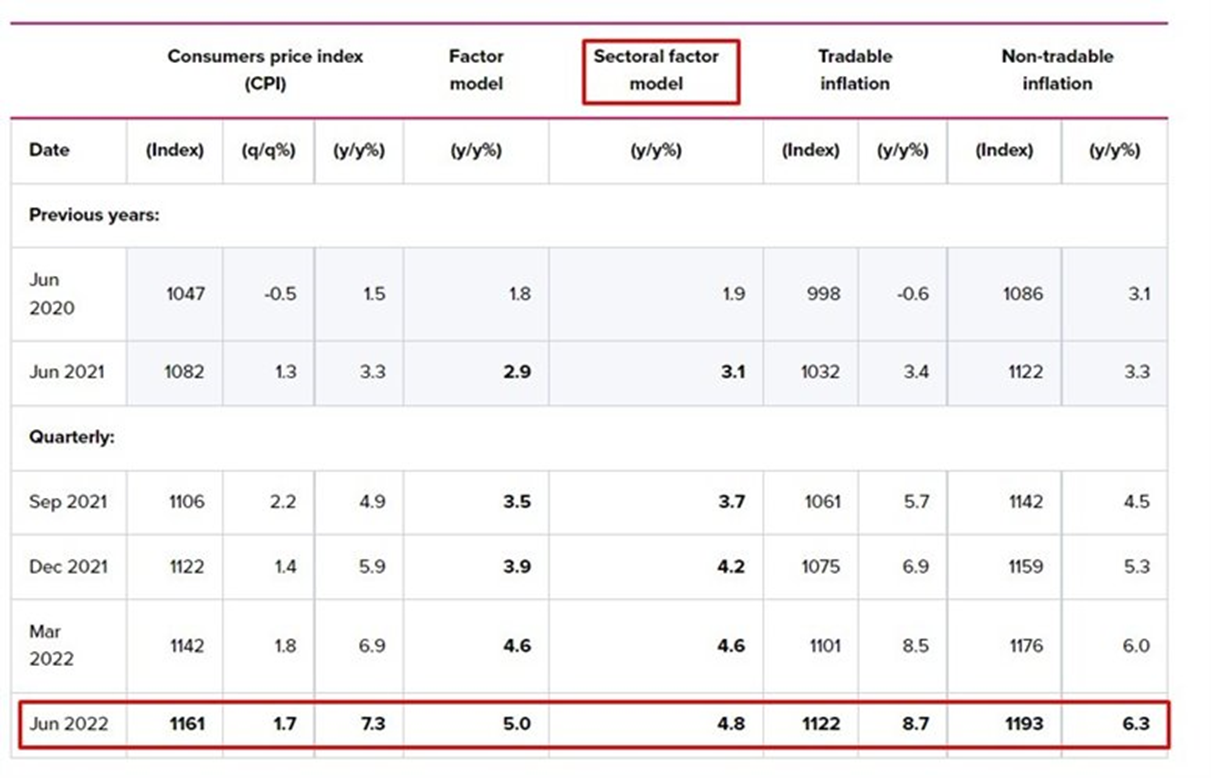
In early Asia, New Zealand’s Consumer Price Index (CPI) rose 1.7% QoQ in the second quarter, beating expectations of a 1.5% increase. Meanwhile, the annualized inflation surged to a 32-year high of 7.3% vs. 7.1% expected.
FX Implications
The Kiwi dollar is little moved on the RBNZ inflation gauge, as NZD/USD is consolidating the latest rally triggered by the above forecast Q2 CPI release.
At the time of writing, the kiwi is trading at 0.6188, up 0.49% on the day.
About the RBNZ Sectoral Factor Model Inflation
The Reserve Bank of New Zealand has a set of models that produce core inflation estimates. The sectoral factor model estimates a measure of core inflation based on co-movements - the extent to which individual price series move together. It takes a sectoral approach, estimating core inflation based on two sets of prices: prices of tradable items, which are either imported or exposed to international competition, and prices of non-tradable items, which are those produced domestically and not facing competition from imports.
NZD/USD Technical levels to watch
“China's monetary policy has sufficient space and tools to cope with any new challenges in the second half of the year,” the Economic Daily said in its editorial op-ed piece on Monday.
Key takeaways (via Reuters)
“There is still room for lowering the reserve requirement ratio, as the weighted average deposit reserve ratio of financial institutions is currently 8.1%.”
“Meanwhile, the foreign exchange market is more resilient with more stable cross-border capital flows, as market players are more adaptable and tolerant to the ups and downs of the yuan, providing a better foundation to resist external shocks.”
- AUD/USD remains firmer past 0.6800 amid cautious optimism, RBA/Fed chatters in focus
- USD/CAD takes offers to renew intraday low, down for the second consecutive day.
- Concerns surrounding China’s covid, OPEC output and Biden’s Middle East visit entertain oil buyers.
- Receding hawkish bets on the Fed, light calendar can help sellers ahead of Friday’s Canada inflation data, US PMIs.
USD/CAD holds lower ground near the intraday low, down for the second consecutive day, as the US dollar prints broad weakness while the prices of WTI crude oil recover from daily lows. In doing so, the Loonie pair sellers attack 1.3000 psychological magnet with eyes on Friday’s key data, as well as recession-linked chatters and oil updates, for fresh impulse.
US Dollar Index (DXY) extends Friday’s losses to 107.73, down 0.22% intraday, as traders curtail hawkish calls over the Fed’s next move. Behind the moves could be the recently mixed US data and slightly cautious Fedspeak.
Talking about the data, US Retail Sales for June grew 1.0% MoM versus 0.8% expected and -0.1% prior (revised from -0.3%) whereas the University of Michigan's Consumer Confidence Index edged higher to 51.5 in July's flash estimate, versus 49.9 expected and 50.0 prior. However, the Index of Consumer Expectations declined to its lowest level since May 1980 at 47.3. Further, the US Industrial Production also contracted by 0.2% MoM in June while the New York Empire State Manufacturing Index rose to 11.1 versus -2.0 expected and -1.2 prior.
On the other hand, Atlanta Fed President Raphael Bostic said on Friday that June's 75 basis points rate hike was a "big move" and added that the Fed wants policy transition to be orderly, as reported by Reuters. On the other hand, San Francisco Fed President Mary Daly said on Friday that the "Fed is working on getting down inflation without stalling economy." Further, St. Louis Federal Reserve Bank President James Bullard sounded neutral as he said, per Reuters, on Friday that it wouldn't make too much of a difference to do a 100 basis points (bps) or a 75 bps rate hike at the next meeting.
Elsewhere, US President Joe Biden’s struggle in the Middle East, to convince major producers to increase oil production, appears to help the WTI crude oil buyers of late. That said, the black gold picks up bids to consolidate intraday losses around $94.25 by the press time.
It’s worth noting, however, that China’s covid concerns and hopes of the US Senior Adviser for Energy Security Amos Hochstein’s expectations of more oil production from the Organization of the Petroleum Exporting Countries (OPEC) appear to weigh on the prices of the energy benchmark. It should be observed that WTI crude oil is Canada’s biggest export item and the same could actively direct USD/CAD moves.
Looking forward, traders’ indecision over the Fed’s next moves, despite recent optimism, could test USD/CAD moves ahead of Friday’s US preliminary PMIs for July and Canada’s Consumer Price Index (CPI) details.
Also read: USD/CAD Weekly Forecast: Will the central bank pas de deux continue?
Technical analysis
USD/CAD bears attack a five-week-old ascending support line as they poke the 1.3000 psychological magnet. That said, the impending bear cross on the MACD and recently steady RSI (14) appear to favor sellers of late. Alternatively, recovery moves need sustained trading beyond an ascending trend line from May 12, near 1.3085, to recall buyers.
Analysts at Morgan Stanley remain bearish on the EUR/USD pair, predicting the main currency pair to test 0.9700 on the downside amid a dire Eurozone economic outlook.
Key quotes
"We turn outright bearish on the EUR and recommend EUR/USD shorts targeting 0.97. The Eurozone outlook is looking increasingly challenged with gas prices rising, growth data softening, and inflation remaining elevated.”
"Risks appear to be rising that European nations may be unable to sufficiently stockpile natural gas ahead of the high demand winter months, which may reduce market expectations for future growth. In the long term (2023+), ECB normalization may reduce fixed income outflows, supporting the currency, but this theme is unlikely to be kicking off anytime soon."
- GBP/USD remains on the front foot for the second consecutive day, renews intraday high of late.
- Bullish MACD, firmer RSI joins clear break of two-week-old descending trend line to favor bulls.
- Sellers need to break 1.1800 support area to retake control.
GBP/USD takes the bids to refresh intraday high around 1.1900 during Monday’s Asian session. In doing so, the Cable pair justifies its upside break of a two-week-old descending trend line.
Also keeping the pair buyers hopeful is the firmer RSI (14), not overbought, as well as bullish MACD signals.
However, a convergence of the 200-HMA and 38.2% Fibonacci retracement of July 04-14 downside, near 1.1915, acts as the validation point for the GBP/USD pair’s further advances.
Following that, the previous weekly top surrounding 1.1970 and the 1.2000 psychological magnet could challenge the pair buyers before directing them to the July 08 swing high near 1.2055.
Meanwhile, pullback remains elusive until the quote stays past the previous resistance line, around 1.1890 by the press time.
Even so, an upward sloping support line from the last Thursday and weekly horizontal region, respectively around 1.1830 and 1.1800, could challenge the GBP/USD bears.
Overall, GBP/USD recently cleared a short-term key hurdle and is ready to consolidate losses marked since mid-June.
GBP/USD: Hourly chart
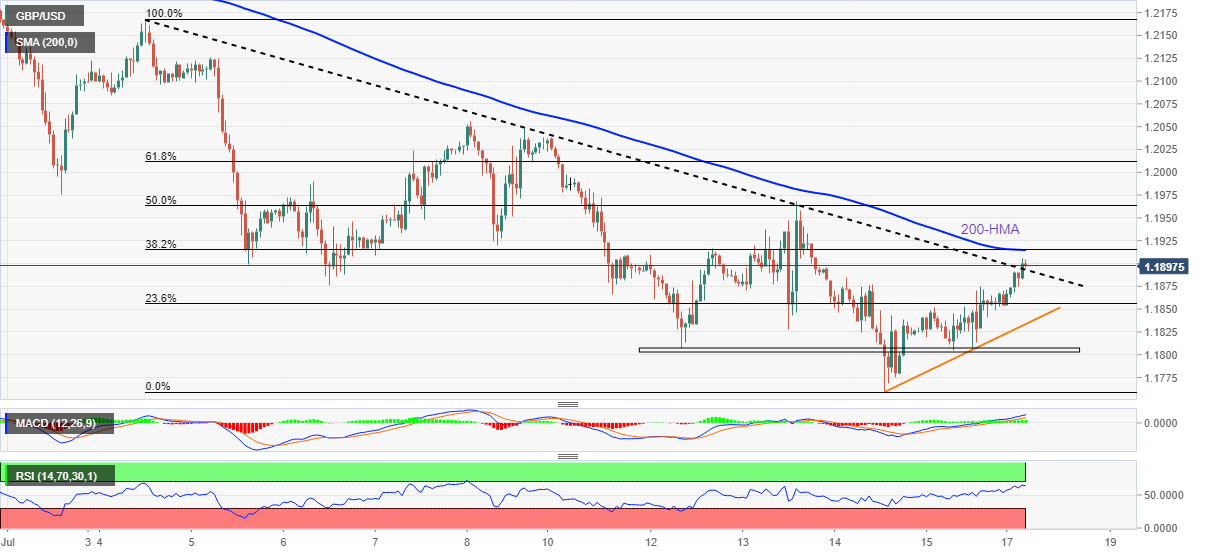
Trend: Further upside expected
| Raw materials | Closed | Change, % |
|---|---|---|
| Silver | 18.702 | 1.4 |
| Gold | 1707.05 | -0.23 |
| Palladium | 1825.17 | -3.63 |
- Market sentiment improves amid easing hawkish bets on the Fed’s next moves.
- China’s hints of more stimulus adds strength to the positive mood amid pre-Fed blackout.
- ECB, PMIs will be in focus but recession chatters are the key for fresh impulse.
Risk profile improved during early Monday, extending the previous day’s upbeat sentiment, as markets curtail hopes of the Fed’s 100 bps rate hike. The positive sentiment could be linked to the mixed US data and Fedspeak, not to forget risk-positive news from China.
While portraying the mood, the S&P 500 Futures print 0.20% intraday gains around 3,875 while the US 10-year Treasury yields remain mostly pressured around 2.92% by the press time. It’s worth noting that Wall Street printed heavy gains the previous day and helped in improving the risk appetite during the early Asian session.
That said, the US Retail Sales for June grew 1.0% MoM versus 0.8% expected and -0.1% prior (revised from -0.3%) whereas the University of Michigan's Consumer Confidence Index edged higher to 51.5 in July's flash estimate, versus 49.9 expected and 50.0 prior. However, the Index of Consumer Expectations declined to its lowest level since May 1980 at 47.3. Further, the US Industrial Production also contracted by 0.2% MoM in June while the New York Empire State Manufacturing Index rose to 11.1 versus -2.0 expected and -1.2 prior.
On the other hand, Atlanta Fed President Raphael Bostic said on Friday that June's 75 basis points rate hike was a "big move" and added that the Fed wants policy transition to be orderly, as reported by Reuters. On the other hand, San Francisco Fed President Mary Daly said on Friday that the "Fed is working on getting down inflation without stalling economy." Further, St. Louis Federal Reserve Bank President James Bullard sounded neutral as he said, per Reuters, on Friday that it wouldn't make too much of a difference to do a 100 basis points (bps) or a 75 bps rate hike at the next meeting.
Elsewhere, the Fed’s blackout period ahead of late July’s FOMC and China’s readiness for more stimulus, as well as hawkish hopes from the European Central Bank (ECB), add strength to the market’s positive sentiment.
Given the market’s cautious optimism, as well as a lack of major data/events up for publishing on Monday, traders should keep their eyes on the European Central Bank (ECB) and Fed chatters for fresh clues. Also important will be the preliminary PMI readings for July. Furthermore, headlines suggesting China’s active role to propel the dragon nation’s economy also need attention.
The UK Foreign Minister Liz Truss said in an interview with The Independent, Britain is predicted to experience a recession due to Rishi Sunak 's increase in taxes.
Key quotes
"It is cutting back on growth. It is preventing companies from investing and it's taking money out of people's pockets.”
"That is no way to get the economy going during a recession."
"I think the tax cuts I've outlined are not inflationary."
"I think the tax cuts I've outlined are not inflationary."
Truss clashed over tax policy with former finance minister Sunak on Friday in the first of three televised debates. They tussled over economic policy.
Market reaction
GBP/USD is capitalizing on the risk-on flows driven by broad US dollar weakness, witnessing an impressive turnaround at the start of the week.
At the time of writing, cable is trading at 1.1900, up 0.41% on the day.
- NZD/USD prints three-day uptrend on firmer New Zealand inflation data.
- MACD prints the strongest bullish signals in five weeks to keep buyers hopeful.
- Sustained break of 10-DMA, descending trend line from mid-June also favor upside momentum.
- Sellers need validation from 0.6100 to retake control.
NZD/USD begins the trading week on a positive note, backed by upbeat New Zealand Q2 Consumer Price Index (CPI) data, as the bulls attack 0.6200 during Monday’s Asian session.
In doing so, the Kiwi pair pierces a downward sloping resistance line from June 16, now support around 0.6175, while also justifying sustained trading beyond the 10-DMA. Additionally, MACD signals the strongest bullish histogram since early June, which in turn hints at the pair’s further advances.
However, multiple levels marked since May 12 join the 21-DMA to highlight 0.6220-30 area as the key hurdle for the NZD/USD bulls.
Following that, the monthly high surrounding 0.6255 may entertain the pair buyers before directing them to the June 16 high close to 0.6400.
Meanwhile, the resistance-turned-support line and the 10-DMA, respectively around 0.6175 and 0.6150, may test NZD/USD sellers.
Even if the quote drops below 0.6150, multiple levels marked since early July could restrict the short-term downside to around 0.6100.
It’s worth noting, however, that the NZD/USD pair’s weakness below 0.6100 won’t hesitate to challenge the 0.6000 psychological magnet. That said, the recent multi-month low near 0.6060 can offer an intermediate halt during the fall.
NZD/USD: daily chart
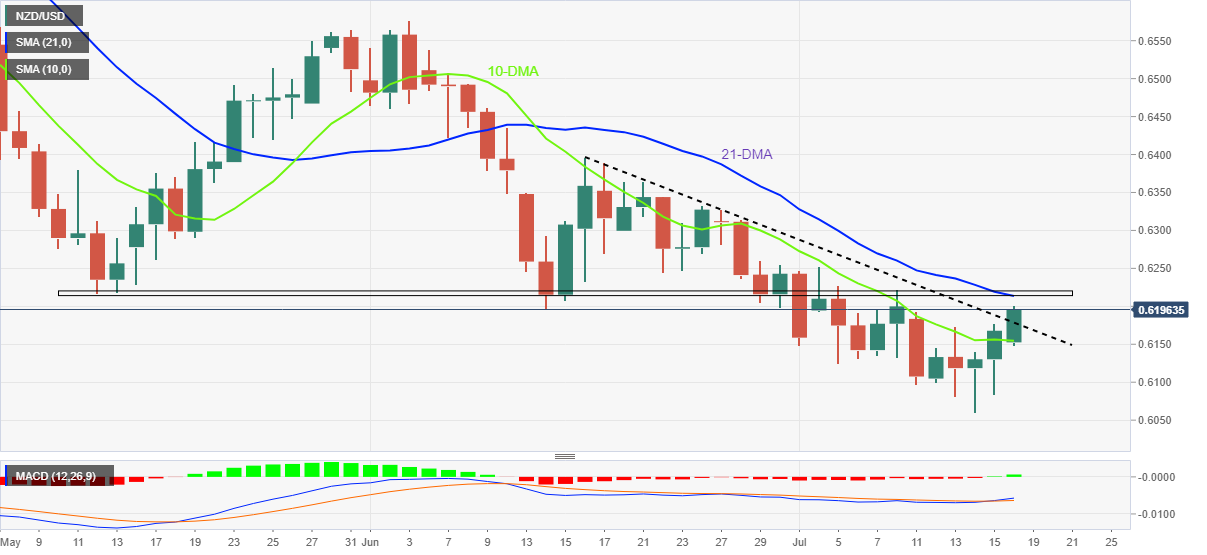
Trend: Limited recovery expected
Analysts at Goldman Sachs said in the latest note released on Monday, upside CPI surprise "relative to the RBNZ's already-elevated forecasts clearly raises the risk that the RBNZ steps up the pace of tightening at its August meeting (we see a 35% chance of a 75bp hike).
Additional quotes
“However, we note that in its meeting last week the RBNZ had already flagged the 'near-term upside risk' to inflation, but this was balanced against the 'emerging medium-term downside risks to economic activity' in driving its decision for a 50bp hike.”
“With the OCR already at a modestly restrictive level of 2.50%, we think the bar for the RBNZ to accelerate the pace of tightening at this point in the cycle is relatively high - and will likely require clearer signs of a breakout in long-term inflation expectations rather than high spot inflation.”
“We maintain our call for a 50bp hike in August and 3.50% OCR by year-end, and will be watching closely at the upcoming data on Q2 labor force and inflation expectations ahead of the August RBNZ meeting."
- WTI has displayed signs of reversal after picking significant bids around $93.00.
- OPEC has not promised more oil supply to US President Joe Biden.
- Renewed lockdown worries in China may affect the rally in the oil prices.
West Texas Intermediate (WTI), futures on NYMEX, has attempted a rebound after hitting a low of $92.77 in the Asian session. The rebound is extremely strong and the black gold has recovered the majority of its intraday losses. The asset has picked significant bids despite the rising odds of lockdown in China and OPEC’s no promise on supplying more oil.
Covid-19 cases have increased dramatically in China. On average, the economy is displaying more than 500 new cases each day. This has escalated the odds of lockdown in China. In order to contain the spread of the pandemic, the Chinese administration has to bank upon lockdown curbs. No doubt, the restrictions on the movement of men, materials, and machines will bring a serious slump in the aggregate demand.
On the supply side, U.S. President Joe Biden's trip to Saudi Arabia has failed to bring a promise of more oil supply on the table. OPEC is in no mood in accelerating supplies in the market and a reason behind that could be the high prices. OPEC nations: Saudi Arabia and the United Arab Emirates (UAE) which carries the potential of increasing supplies are getting higher revenues amid higher oil prices and higher supply. This is going to dampen the chances of bringing price stability sooner.
- AUD/USD picks up bids to stay upbeat during the second positive day after renewing a two-year low.
- Easing fears of hawkish Fed rate hikes, absence of Fedspeak join optimism surrounding China to favor buyers.
- RBA Minutes, Deputy Governor Bullock’s comments will be important for fresh impulse.
AUD/USD remains firmer for the second consecutive day as bulls flirt with the 0.6800 threshold, up 0.20% intraday around 0.6810 during Monday’s Asian session. In doing so, the Aussie pair takes clues from the softer US dollar, as well as mildly positive sentiment in the market, to keep buyers hopeful ahead of a busy week.
That said, the US Dollar Index (DXY) stretches Friday’s losses to 107.75, down 0.22% intraday, as traders curtail hawkish calls over the Fed’s next move. That said, mostly downbeat US data and mixed Fedspeak appeared to have cut the hawkish Fed bets of late.
US Retail Sales for June grew 1.0% MoM versus 0.8% expected and -0.1% prior (revised from -0.3%) whereas the University of Michigan's Consumer Confidence Index edged higher to 51.5 in July's flash estimate, versus 49.9 expected and 50.0 prior. However, the Index of Consumer Expectations declined to its lowest level since May 1980 at 47.3. Further, the US Industrial Production also contracted by 0.2% MoM in June while the New York Empire State Manufacturing Index rose to 11.1 versus -2.0 expected and -1.2 prior.
In addition to the mixed data, Fedspeak also retreat from the previous calls of 75 bps rate hike and triggered the AUD/USD pair’s recovery. Atlanta Fed President Raphael Bostic said on Friday that June's 75 basis points rate hike was a "big move" and added that the Fed wants policy transition to be orderly, as reported by Reuters. On the other hand, San Francisco Fed President Mary Daly said on Friday that the "Fed is working on getting down inflation without stalling economy." Further, St. Louis Federal Reserve Bank President James Bullard sounded neutral as he said, per Reuters, on Friday that it wouldn't make too much of a difference to do a 100 basis points (bps) or a 75 bps rate hike at the next meeting.
Furthermore, the Fed’s blackout period ahead of late July’s FOMC and China’s readiness for more stimulus, as well as hawkish hopes from the European Central Bank (ECB) add strength to the AUD/USD upside.
Against this backdrop, Wall Street closed higher and the US Treasury yields ended the week on a negative note. However, the S&P 500 Futures remain firmer around 3,870 while the US 10-year Treasury yields drop 1.1 basis points (bps) to 2.91% at the latest.
Looking forward, risk catalysts could entertain AUD/USD traders amid a light calendar at home. However, Tuesday’s Minutes Statement from the Reserve Bank of Australia (RBA), as well as comments from RBA Deputy Governor Guy Bullock, will be important for the pair traders to watch.
Technical analysis
A daily closing beyond the convergence of a monthly resistance line and the 21-DMA, around 0.6855 by the press time, appears necessary for the AUD/USD bulls to retake control. Until then, bears can keep their eyes on the 0.6700 threshold.
The People’s Bank of China (PBOC) set the USD/CNY reference rate at 6.7447 on Monday when compared to the previous fix and the previous close at 6.7503 and 6.7574 respectively.
It’s worth noting that the PBOC’s USD/CNY fix dropped to the lowest levels since June 15 the previous day. Further, Monday’s crossed market expectations of printing 6.7458 figure.
Following the data, Reuters also mentioned, "China central bank injects 12 billion yuan via 7-day reverse repos at 2.10% vs prior 2.10%."
About the fix
China maintains strict control of the yuan’s rate on the mainland.
The onshore yuan (CNY) differs from the offshore one (CNH) in trading restrictions, this last one is not as tightly controlled.
Each morning, the People’s Bank of China (PBOC) sets a so-called daily midpoint fix, based on the yuan’s previous day's closing level and quotations taken from the inter-bank dealer.
- A formation of Double Top has displayed a decline in buying interest at elevated levels.
- Bear cross, represented by the 20- and 50-EMAs signal more downside ahead.
- The RSI (14) has shifted into the bearish range of 20.00-40.00.
The USD/CHF pair is declining in the Asian session following the footprints of the US dollar index (DXY). The asset is on the verge of dropping below Friday’s low at 0.9756. A slippage below the same will bring significant offers on the counter.
A Double Top formation on an hourly scale is signaling a bearish reversal. The asset witnessed a steep fall after failing to sustain above Tuesday’s high at 0.9859. The above-mentioned chart pattern indicates lower buying interest at elevated levels. The formation of the selling tail has strengthened the formation of the chart pattern.
The downside move elevated on a bear cross, represented by the 20-and 50-period Exponential Moving Averages (EMAs) near 0.9820, which adds to the downside filters.
Meanwhile, the Relative Strength Index (RSI) has shifted into the bearish range of 20.00-40.00, which signals more pain ahead.
A decisive downside below the demand zone placed in a 0.9750-0.9758 range will drag the asset towards July 5 high at 0.9705. A breach of the latter will expose the asset to more downside towards July 1 high at 0.9642.
Alternatively, the greenback bulls could defend the double top formation after violation of Wednesday’s high at 0.9827. This will drive the asset towards Thursday’s high at 0.9886, followed by psychological resistance at 1.0000.
USD/CHF hourly chart
-637937034922461193.png)
- US Dollar Index extends Friday’s pullback amid cautious optimism.
- Downbeat US inflation expectations, mixed Fedspeak weigh on DXY during pre-Fed blackout.
- Hopes for more stimulus from China, US recession fears also favor greenback sellers.
- Light calendar emphasizes on risk catalysts for fresh impulse.
US Dollar Index (DXY) portrays the market’s cautious optimism as it stays pressured around 107.90 during Monday’s Asian session. In doing so, the greenback’s gauge versus the six major currencies drops for the second consecutive day.
Receding fears of the 100 bps rate hike from the US Federal Reserve (Fed), as well as the pre-Fed blackout period, could be cited as the key catalysts behind the market’s latest optimism. That said, the reduction in the hawkish Fed bets could be linked to Friday’s mostly downbeat US data and mixed Fedspeak.
A softer US inflation expectations and mixed comments from the Fed policymakers appeared to have weighed on the US Dollar Index the previous day. That said, US Retail Sales for June grew 1.0% MoM versus 0.8% expected and -0.1% prior (revised from -0.3%) whereas the University of Michigan's Consumer Confidence Index edged higher to 51.5 in July's flash estimate, versus 49.9 expected and 50.0 prior. However, the Index of Consumer Expectations declined to its lowest level since May 1980 at 47.3. Further, the US Industrial Production also contracted by 0.2% MoM in June while the New York Empire State Manufacturing Index rose to 11.1 versus -2.0 expected and -1.2 prior.
Talking about the Fedspeak, Atlanta Fed President Raphael Bostic said on Friday that June's 75 basis points rate hike was a "big move" and added that the Fed wants policy transition to be orderly, as reported by Reuters. On the other hand, San Francisco Fed President Mary Daly said on Friday that the "Fed is working on getting down inflation without stalling economy." Further, St. Louis Federal Reserve Bank President James Bullard sounded neutral as he said, per Reuters, on Friday that it wouldn't make too much of a difference to do a 100 basis points (bps) or a 75 bps rate hike at the next meeting.
It’s worth noting that the fear of the US recession also exerts downside pressure on the DXY. Fears of a second negative GDP print, which technically triggers US recession fears, appeared to have gained momentum after Friday’s Atlanta Fed GDPNow release. That said, the Atlanta Fed GDPNow estimate for 2Q growth is coming in at -1.5% versus -1.2% last. The GDPNow model estimate for real GDP growth (seasonally adjusted annual rate) in the second quarter of 2022 is -1.5 percent on July 15, down from -1.2 percent on July 8.
Elsewhere, China’s hints of more stimulus and an impending rate hike from the European Central Bank (ECB) keeps DXY sellers hopeful.
Amid these plays, Wall Street closed higher and the US Treasury yields ended the week on a negative note. However, the S&P 500 Futures remain firmer around 3,870 while the US 10-year Treasury yields drop 1.1 basis points (bps) to 2.91% at the latest.
Moving on, the pre-Fed silence and a light calendar could restrict DXY moves and may help the counter-trend traders to keep reins for a bit more days ahead of Thursday’s European Central Bank (ECB) meeting, as well as Friday’s July PMIs.
Technical analysis
A daily closing below an ascending support line from July 06, now resistance around 108.25, directs DXY bears towards the previous resistance line from May 13, close to 106.50 by the press time.
“China's economy is facing downward pressure due to COVID-19 and external shocks, and the central bank will "increase implementation of prudent monetary policy" to support the real economy, China's central bank, People’s Bank of China (PBOC), Governor Yi Gang said,” said Reuters during the weekend.
The news adds that PBOC Governor Yi made the comments via video link during the meeting of G20 finance leaders in Indonesia, the People's Bank of China said in a statement on Saturday.
Elsewhere, Reuters also quotes a commentary that appeared in China’s state-owned Securities Times while mentioning, “China's monetary policy has ample room and sufficient tools, including further cutting banks' reserve requirements, to cope with new challenges amid a shaky economic recovery.”
It’s worth noting that Xinhua quotes Chinese Vice Premier Liu He as urging stronger steps be taken to boost employment.
FX reaction
The news helps AUD/USD prices to keep Friday’s recovery beyond 0.6800.
Also read: AUD/USD sees upside above 0.6800 as focus shifts to RBA minutes
- USD/CAD is hovering above 1.3000 despite a decent slippage in the DXY.
- A preliminary estimate for Canada's inflation is 8.8% vs. 7.7% reported prior.
- Declining oil prices have weakened the loonie bulls.
The USD/CAD pair is oscillating in a narrow range of 1.3006-1.3023 in the Asian session. The asset is displaying a subdued performance amid a recovery in the risk appetite of the market participants. One concern that demands attention from investors is that the US dollar index (DXY) is dropping significantly while the USD/CAD pair has displayed a negligible fall. This indicates that loonie is also weaker and the asset is auctioning lackluster.
Weakness in the Canadian dollar could be tagged to higher estimates for Canada’s inflation rate. The economic data is due on Wednesday and the market consensus for the inflation rate is 8.8%, significantly higher than the former release of 7.7%. The inflation rate in the Canadian economy is soaring like there is no tomorrow. It is hurting the paycheck of the households principally.
Meanwhile, the US dollar index (DXY) has violated Friday’s low at 107.92 as the market mood has turned positive. Investors are expecting that the price pressures in the US are reaching their peak levels. However, St. Louis Federal Reserve Bank President James Bullard said on Friday warned that inflation could surprise to the upside.
On the oil front, oil prices are declining strongly amid soaring recession fears. Major central banks are focusing on bringing price stability to their economy. For that, policy tightening measures are highly required to contain the inflation mess. This is hurting the market sentiment as demand forecasts for oil have trimmed significantly. It is worth noting that Canada is the largest exporter of oil to the US and lower oil prices have weakened the loonie bulls.
- EURUSD Price remains firmer amid cautious optimism, easing hawkish Fed bets.
- Softer US data, Fed blackout period joins mixed Fedspeak to ease fears of 1.0% Fed rate hike.
- ECB to begin rate hikes with 0.25% increase even if recession fears loom.
EURUSD Price extends the previous day’s recovery as buyers attack the 1.0100 threshold during Monday’s initial Asian session. In doing so, the major currency pair cheers easing concerns over the Federal Reserve’s (Fed) 100 bps rate hike while bracing for the European Central Bank (ECB) monetary policy meeting.
US Dollar Index weakness could also be linked to the EURUSD Price strength as the quote rises for the second consecutive day. In doing so, the pair ignores recession fears emanating from Germany and Italy while cheering downbeat US data and mixed Fedspeak.
Also read: EUR/USD Weekly Forecast: Gear up for a too conservative ECB meeting
EURUSD Price cheers mixed Fedspeak
Fed policymakers are on a blackout period ahead of late July monetary policy meeting.
During the latest Fedspeak, the last before the pre-Fed blackout, the majority of the policymakers tried to tame the hopes of a 1.0% hike in the benchmark interest rates, which in turn enabled the EURUSD Price to consolidate losses around a multi-month low. Atlanta Fed President Raphael Bostic said on Friday that June's 75 basis points rate hike was a "big move" and added that the Fed wants policy transition to be orderly, as reported by Reuters. On the other hand, San Francisco Fed President Mary Daly said on Friday that the "Fed is working on getting down inflation without stalling economy." Further, St. Louis Federal Reserve Bank President James Bullard sounded neutral as he said, per Reuters, on Friday that it wouldn't make too much of a difference to do a 100 basis points (bps) or a 75 bps rate hike at the next meeting. In this regard, Wall Street Journal’s (WSJ) Nick Timiraos also came out with a piece that turned down the market’s expectations of a 1.0% Fed rate hike.
Downbeat US data favor EURUSD bulls
On Friday, the Index of Consumer Expectations declined to its lowest level since May 1980 at 47.3. The downbeat figures also joined a 0.20% contraction by the US Industrial Production for June to favor EURUSD buyers. Elsewhere, US Retail Sales for June grew 1.0% MoM versus 0.8% expected and -0.1% prior (revised from -0.3%) whereas the University of Michigan's Consumer Confidence Index edged higher to 51.5 in July's flash estimate, versus 49.9 expected and 50.0 prior.
Fears of US recession also weigh on DXY
Fears of a second negative GDP print, which technically propels US recession fears, appeared to have gained momentum after Friday’s Atlanta Fed GDPNow release. That said, the Atlanta Fed GDPNow estimate for 2Q growth is coming in at -1.5% versus -1.2% last. The GDPNow model estimate for real GDP growth (seasonally adjusted annual rate) in the second quarter of 2022 is -1.5 percent on July 15, down from -1.2 percent on July 8.
Germany, Italy could probe ECB hawks
The gas crisis in Germany joins Italy’s political drama to challenge the European Central Bank (ECB) hawks as they brace for the first rate hike in many years. Recently, the Financial Times (FT) quoted German Economy Minister Robert Habeck as he said, “We just don’t know. Everything is possible,” when asked what will happen as the 10-day scheduled maintenance to the Nord Stream 1 pipeline ends on July 21. Elsewhere, Politico marked more political jitters in Italy, after Prime Minister Mario Draghi offered his resignation but was rejected, to signal more pain for the nation and the bloc, which in turn could weigh on the EURUSD Price. “Mario Draghi’s Italian government tilted even further toward collapse Sunday, as the leaders of the two right-wing parties within the ruling coalition said they could no longer work with the 5Star Movement,” mentioned Politico.
ECB eyed but PMIs are important too
Preliminary Purchasing Managers Index (PMI) readings of July will also be important for the pair watchers, in addition to the ECB, amid an absence of Fedspeak and a light calendar in the US before then. Forecasts suggest reductions in the headline PMIs but any upside surprises from the US could quickly recall EURUSD bears amid more fears of an economic slowdown from the bloc than the US. That said, th ECB is up for 0.25% rate hike but chatters over the aggression in the rate hikes will highlight President Christine Lagardge's press conference for fresh moves.
EURUSD Price technical outlook
EURUSD Price justifies Thursday’s bounce off 61.8% Fibonacci Expansion (FE) of March-May 2022 moves, as well as an upside break of a two-week-old descending trend line, as bulls attack the 50-SMA hurdle surrounding 1.0100.
Given the recently improving RSI and MACD conditions, in addition to the aforementioned recovery moves, EURUSD can easily overcome the immediate 50-SMA resistance surrounding 1.0105. The breakout could lead the major currency pair towards the 38.2% Fibonacci retracement of June 27 to July 14 declines, around 1.0200.
It’s worth noting that the pair buyers could remain cautious unless witnessing a clear upside break of 1.0285 resistance confluence, comprising the 100-SMA and 50% Fibonacci retracement level.
Alternatively, pullback moves need a clear downside break of the 0.9950 mark including the latest low, as well as the 61.8% FE of March-May 2022 moves. Following that, the December 2002 low near 0.9860 will gain the market’s attention.
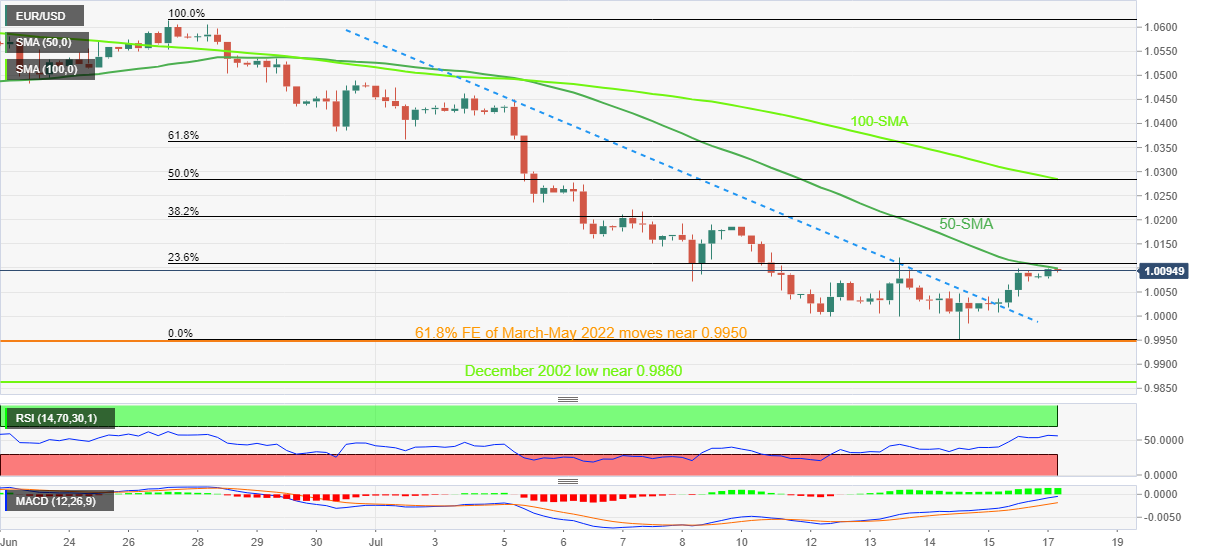
Draghi drama is a problem for the ECB hawks
| Index | Change, points | Closed | Change, % |
|---|---|---|---|
| NIKKEI 225 | 145.08 | 26788.47 | 0.54 |
| Hang Seng | -453.49 | 20297.72 | -2.19 |
| KOSPI | 8.66 | 2330.98 | 0.37 |
| ASX 200 | -45 | 6605.6 | -0.68 |
| FTSE 100 | 119.2 | 7159 | 1.69 |
| DAX | 345.06 | 12864.72 | 2.76 |
| CAC 40 | 120.59 | 6036 | 2.04 |
| Dow Jones | 658.09 | 31288.26 | 2.15 |
| S&P 500 | 72.78 | 3863.16 | 1.92 |
| NASDAQ Composite | 201.23 | 11452.42 | 1.79 |
| Pare | Closed | Change, % |
|---|---|---|
| AUDUSD | 0.67923 | 0.66 |
| EURJPY | 139.735 | 0.3 |
| EURUSD | 1.00858 | 0.65 |
| GBPJPY | 164.361 | -0.03 |
| GBPUSD | 1.18643 | 0.32 |
| NZDUSD | 0.61556 | 0.52 |
| USDCAD | 1.30279 | -0.72 |
| USDCHF | 0.97642 | -0.71 |
| USDJPY | 138.539 | -0.34 |
- USD/JPY has dropped below 138.50 as DXY has picked offers despite the upbeat Retail Sales data.
- A minute recovery in Michigan CSI after a steep fall over the past three months doesn’t warrant a rebound.
- The BOJ is likely to keep its interest rates unchanged this week.
The USD/JPY pair is on the verge of delivering a downside break of the consolidation formed in a narrow range of 138.39-138.66 on Friday. The asset is declining gradually as the US dollar index (DXY) witnessed a steep fall in early trading hours on Monday.
The DXY is dropping sharply and has surrendered the critical support of 108.00 despite the upbeat Retail Sales data and Michigan Consumer Sentiment Index (CSI) released on Friday. The US Retail Sales landed at 1%, higher than the prior release of -0.3% and the estimates of 0.8%. The economic data has remained upbeat on costly fossil fuels, which have soared the energy bills of the households in the US.
Also, a mild recovery in the Michigan CSI was not meaningful to support the DXY bulls. The sentiment data came minutely higher at 51.1 than the estimates of 49.9 and the prior release of 50. A mild recovery has been recorded in the economic data after consecutive three downside figures. However, investors should not consider this recovery a meaningful one until other filters support it.
On the Tokyo front, investors are awaiting the announcement of the interest rate decision by the Bank of Japan (BOJ), which is due on Thursday. The central bank is expected to keep interest rates unchanged as the policymakers are committed to keeping a dovish tone to revive the overall demand in the economy. The BOJ is focused to keep the inflation rate to 2% and seldom higher oil prices are not a decent way to attain desired goals.


© 2000-2026. All rights reserved.
This site is managed by Teletrade D.J. LLC 2351 LLC 2022 (Euro House, Richmond Hill Road, Kingstown, VC0100, St. Vincent and the Grenadines).
The information on this website is for informational purposes only and does not constitute any investment advice.
The company does not serve or provide services to customers who are residents of the US, Canada, Iran, The Democratic People's Republic of Korea, Yemen and FATF blacklisted countries.
Making transactions on financial markets with marginal financial instruments opens up wide possibilities and allows investors who are willing to take risks to earn high profits, carrying a potentially high risk of losses at the same time. Therefore you should responsibly approach the issue of choosing the appropriate investment strategy, taking the available resources into account, before starting trading.
Use of the information: full or partial use of materials from this website must always be referenced to TeleTrade as the source of information. Use of the materials on the Internet must be accompanied by a hyperlink to teletrade.org. Automatic import of materials and information from this website is prohibited.
Please contact our PR department if you have any questions or need assistance at pr@teletrade.global.
transfers