- Analytics
- News and Tools
- Market News
CFD Markets News and Forecasts — 14-07-2022
- AUD/JPY is aiming to recapture its weekly high at 94.26.
- The upbeat Aussie employment data has empowered the RBA to accelerate rates unhesitatingly.
- Australia’s Consumer inflation expectations have trimmed to 6.3% vs. 6.7% recorded earlier.
The AUD/JPY pair is advancing firmly to reclaim its weekly high at 94.26 as the odds of a wider Reserve Bank of Australia (RBA)-Bank of Japan (BOJ) policy divergence is underpinning the aussie bulls. Broadly, the risk barometer is sideways in a wider range of 91.42-94.26 in July and is awaiting a potential trigger that could bring a decisive move.
The antipodean is performing well against the yen bulls on the release of the upbeat Australian employment data. The Australian Bureau of Statistics reported the Employment Change at 88.4k while the Unemployment Rate has trimmed to 3.5%. As per the market consensus, the Australian economy was expected to report an addition of 25k jobs in its labor market. Also, the jobless rate was seen at 3.8%.
This has delighted the RBA to tighten its policy further without much hesitation. Last week, the RBA elevated its Official Cash Rate (OCR) by 50 basis points (bps) to 1.35%. The inflation rate is sky-rocketing in the aussie zone and in order to tame the same, the RBA will elevate its OCR continuously.
Apart from that, the consumer inflation expectations have been trimmed on a decent note. The inflation indicator landed at 6.3%, lower than the prior release of 6.7% but remained higher than the expectations of 5.9%. This indicates that the policy tightening measures have started showing their multiplier effects.
On the Tokyo front, the BOJ’s ultra-loose monetary policy will widen the policy divergence with other nations. BOJ governor Haruhiko Kuroda is committed to its dovish commentary in order to spurt the aggregate demand in its respective economy.
- Silver Price remains sidelined after bouncing off two-year low.
- Oversold RSI favors buyers but $19.10 appears a tough nut to crack.
- Support line of the short-term falling wedge restricts the immediate downside.
Silver Price (XAG/USD) struggles to extend corrective pullback from the lowest level since July 2020, taking rounds to $18.45 during Friday’s initial Asian session.
In doing so, the bright metal keeps the previous day’s rebound from a one-month-old falling wedge’s support line amid oversold RSI (14).
However, the support-turned-resistance trend line from May 13, around $18.60 by the press time, probes the XAG/USD buyers.
Also acting as the key hurdle is the convergence of the stated bullish chart pattern falling wedge’s upper line and the 10-DMA, near $19.10.
Should silver rises past $19.10, it can rally towards a downward sloping resistance line from April, close to $20.30.
Meanwhile, silver’s fresh declines may aim to retest the aforementioned wedge’s bottom, surrounding $18.00 by the press time.
Following that, lows marked during June 2020, around $16.95, will gain the market’s attention.
Overall, silver bears appear to have run out of steam but the buyers need validation to retake control.
Silver: Daily chart

Trend: Further weakness expected
- EURUSD Price struggles to extend corrective pullback from a two-decade low.
- Easing hawkish Fed bets, mixed comments from policymakers allowed bears to take a breather ahead of blackout period.
- US Retail Sales will be important, Fed speakers may also try to use force before pre-meeting silence.
EURUSD Price seesaws around 1.0020 after bouncing off the lowest levels since December 2002, near 0.9950, as traders seek fresh clues during Friday’s Asian session. The major currency pair’s latest rebound also marks the traders’ indecision, as well as chances of a rebound amid recently mixed signals.
The mixed comments from the Fed speakers who tried to talk down the odds of the 100 bps rate hike are the key catalyst to triggering the EURUSD Price recovery. On the same line was the CME’s FedWatch tool that showed receding probabilities favoring the 75 basis points (bps) of Fed rate hike during July. Additionally, the receding difference between the 2-year and the 10-year US Treasury yields also helped ease the EURUSD trader’s pain of late.
Also read: EUR/USD Forecast: Battle around parity continues, bulls to be disappointed
EURUSD Price bounced on Fedspeak
Fedspeak talked down 100-bps rate hike.
Receding hawkish bias of the Fed policymakers, known as Fedspeak, appears to have recently tamed the risk-aversion wave. Among the key hurdles for the hawks were comments from St. Louis Federal Reserve President James Bullard and Federal Reserve Governor Christopher Waller. That said, Fed’s Bullard said, "So far, we've framed this mostly as 50 versus 75 at this meeting." On the same line, Fed’s Waller mentioned that markets may have gotten ahead of themselves by pricing a 100 basis points rate hike in July, as reported by Reuters.
Yield curve inversion also favored bulls
It’s worth noting that a reduction in the US Treasury yield curve inversion also underpinned the EURUSD Price recovery from the 20-year low. That said, the US 10-year Treasury yields ended Thursday around 2.95%, up 0.95% intraday, whereas the 2-year bond coupon dropped 0.75% to 3.12% at the latest. With this, the difference between the near-term and the longer-term bond coupons eased, which in turn allowed EURUSD bears to step back, mainly due to the reduction in the recession fears that initially favored the US dollar bulls.
Hawkish Fed forecasts eased as well
Markets curtailed bets for the heavier Fed rate hikes in the July meeting, after witnessing a reduction in the hawkish calls from the Fed policymakers and mixed performance of the yields. That said, the latest print from the CME’s FedWatch tool suggests nearly 52% chance of a 75 bps rate hike in July versus showing an almost certain case for the said rate lift the previous day.
US data keep EURUSD bears hopeful
Despite the recently mixed catalysts, firmer US data favored the EURUSD bears to remain hopeful of refreshing the multi-year low. On Thursday, the US Bureau of Labor Statistics mentioned that the Producer Price Index (PPI) for final demand in the US climbed to 11.3% on a yearly basis in June from 10.9% in May. This print surpassed the market expectation of 10.7%. Additionally, there were 244,000 Initial Jobless Claims in the week ending July 9 versus the previous week's print of 235,000 and market expectation of 235,000. The Weekly Jobless Claims were the highest in five months and raised market fears of the start of the recession.
Downbeat EU projections weigh on quote
Pessimistic economic forecasts from the European Commission also drown the EURUSD Price. As per the latest quarterly EU projections, published the previous day, EU Commission expects GDP growth of 2.6% in the euro area in 2022, down from 2.7% in the previous outlook. The predictions also expect euro area inflation of 7.6% in 2022, up from 6.1% prior forecast.
US Retail Sales is the key
Given the recently firmer US inflation data and mixed Fedspeak, today’s US Retail Sales will be crucial for EURUSD traders. Market forecasts suggest that the US Retail Sales could rise to 0.8% MoM in June from -0.3% marked in May. In this regard, analysts at the Australia and New Zealand Banking Group said, “A strong retail sales number would be illustrative of strong demand and the need for the FOMC to maintain, and possibly intensify, its hawkish guidance.”
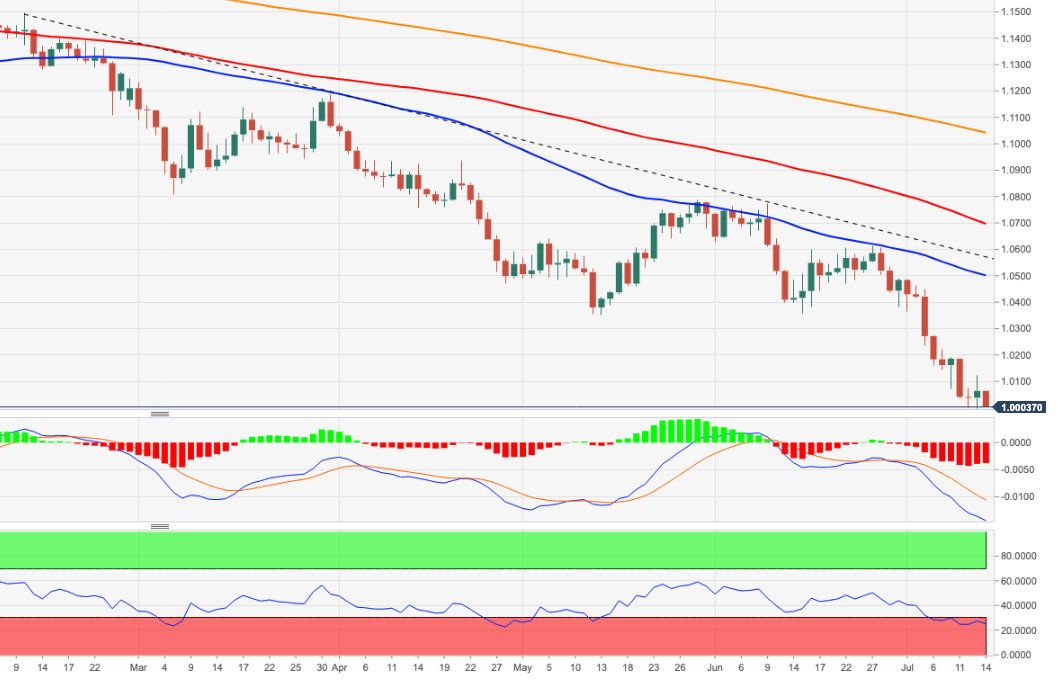
EURUSD Price technical outlook
EURUSD Price remains inside the monthly bearish channel despite bouncing off the 61.8% Fibonacci Expansion (FE) of March-May 2022 moves, around 0.9950.
Even if the major currency pair manages to cross the resistance line of the aforementioned descending trend channel, around 1.0055 by the press time, the 50-SMA level of 1.0140 could test the EURUSD buyers before directing them to the last Friday’s peak of 1.0190.
It’s worth noting that the bearish bias needs validation from the monthly high near 1.0475 to push back the EURUSD sellers.
Alternatively, the 61.8% FE level near 0.9950 and the December 2002 low surrounding 0.9860 appear the immediate support levels to watch during the pair’s fresh downside.
Following that, the oversold RSI (14) and the lower line of the stated channel, near 0.9825, will be important to watch.
Overall, EURUSD is likely to witness a further rebound but the trend reversal is far.

Elliott Wave view: Bearish trend in EUR/USD remains intact
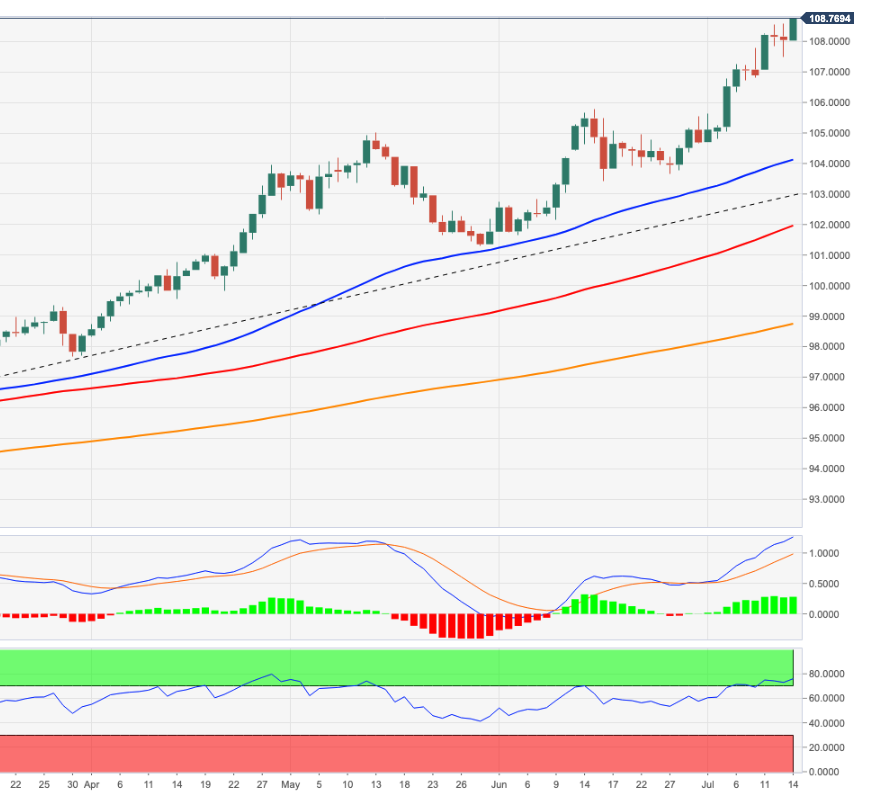
- USD/JPY extended its rally for the seventh consecutive week, gaining some 2.19%.
- The USD/JPY negative divergence in the daily chart might pave the way for a pullback.
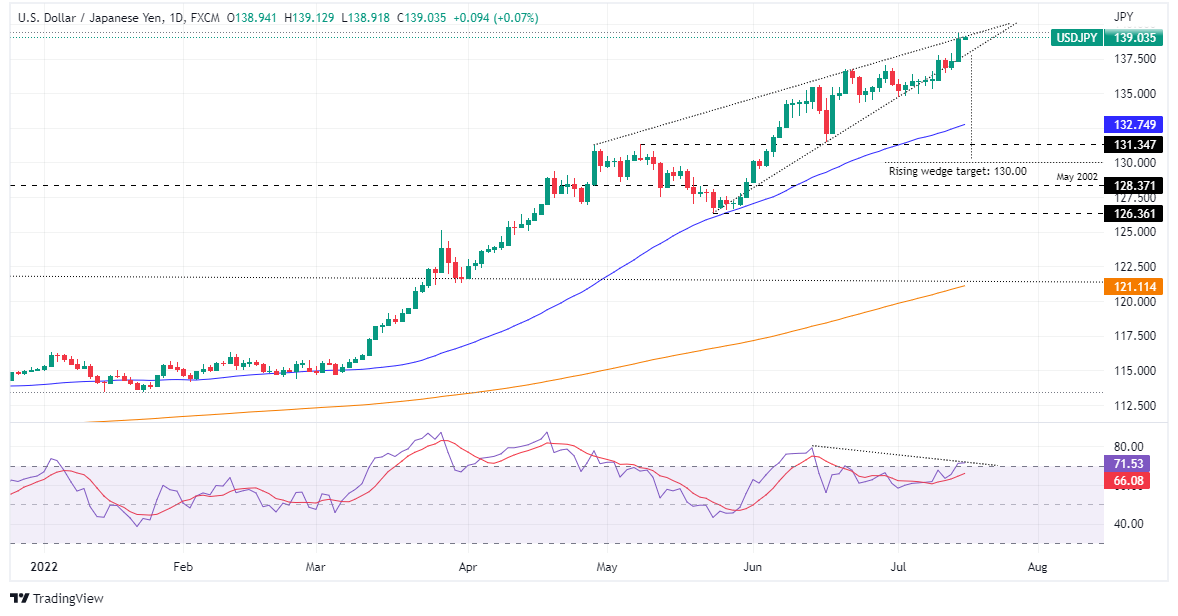
- A rising wedge remains in play and, once broken, targets the USD/JPY might fall towards 130.00.
The USD/JPY reached a fresh 24-year high around 139.38, though of late dipped near the 139.10s area, as market participants scaled back expectations of a 100 bps rate hike following Wednesday’s hot US CPI reading, which opened the door for speculations of the aforementioned. At the time of writing, the USD/JPY is trading at 139.03, recording a minimal gain of 0.03%.
USD/JPY Thursday’s session began around the 137.50 figure, near the bottom of a rising wedge, and rallied sharply towards a fresh 24-year high at 139.38. However, the major retreated near 138.50 before launching a renewed assault above 139.00, where the price settled near the end of the New York session.
USD/JPY Daily chart
The USD/JPY daily chart remains upward biased, though price action looks overextended due to the parabolic rally, which began around March 2022. Oscillators are again entering overbought conditions, illustrating a negative divergence, which means that price action is printing higher highs, while the Relative Strength Index (RSI) is registering lower peaks, opening the door for a pullback.
Therefore, if the above scenario plays out, the USD/JPY's first support would be July 14 daily low at 137.28. A breach of the latter will send the pair tumbling towards the July 6 low at 134.94, followed by the June 16 cycle low at 131.49.
USD/JPY Key Technical Levels
- Pound bulls have rebounded after hitting the lower portion of the Falling Channel.
- The cable is expecting a pullback as the RSI (14) has displayed momentum loss.
- Declining 50-EMA is still favoring the greenback bulls.
The GBP/USD pair is oscillating in a narrow range of 1.1817-1.1828 in early Asia after a firmer rebound from Thursday’s low at 1.1760. On a broader note, the cable has remained in the grip of bears after failing to sustain above the critical resistance of 1.1900.
The cable has rebounded after sensing a cushion from the lower portion of the falling channel formed on an hourly scale. The upper portion of the above-mentioned hart pattern is placed from July 4 high at 1.2165 while the lower portion is plotted from July 5 low at 1.1900. A rebound from the lower portion of the above-mentioned chart pattern doesn't resemble a bullish reversal but a pullback move, which may meet offers soon.
The greenback bulls are defending the 20-period Exponential Moving Average (EMA) at 1.1831. While the 50-EMA is still higher than the cable prices and indicates the short-term trend is still down.
Meanwhile, the Relative Strength Index (RSI) (14) has displayed signs of momentum loss as the asset is continuously forming lower highs while the momentum oscillator is forming higher lows. The formation of a bullish negative divergence dictates a bullish reversal but needs more filters for validation.
The cable is expected to display more losses if the asset drops below the round-level support of 1.1800. An occurrence of the same will drag the asset towards the 26 March 2020 low at 1.1777, followed by a 25 March 2020 low at 1.1638.
Alternatively, a decisive move above the July 8 high of 1.2056 will send the asset towards July 4 high at 1.2161. A breach of the latter will drive the cable towards June 28 high at 1.2292.
GBP/USD hourly chart
-637934371427804501.png)
- AUD/USD struggles to extend the corrective pullback from two-year low.
- Risk-aversion takes clues from fears of recession, aggressive Fed actions.
- US PPI offered strength to inflation fears but yield curve inversion eased afterwards on mixed Fedspeak.
- China’s Q2 GDP, Retail Sales and US Retail Sales will be important for fresh impulse.
AUD/USD steadies around the mid-0.6700s after bouncing off the lowest levels since June 2020. In doing so, the Aussie pair portrays the market’s cautious mood ahead of important data from the key customer China, as well as from the US. However, risk-aversion due to the fears of the economic slowdown and faster rate hikes by the US Federal Reserve (Fed) keeps the pair sellers hopeful.
The quote’s latest rebound could be linked to the mixed comments from the Fed speakers who tried to talk down the odds of the 100 bps rate hike. On the same line was the CME’s FedWatch tool that showed receding probabilities favoring the 75 basis points (bps) of Fed rate hike during July. Additionally, the receding difference between the 2-year and the 10-year US Treasury yields also helped ease the AUD/USD trader’s pain of late.
At home, the upbeat jobs report for June and Consumer Inflation Expectations for July helped AUD/USD to battle the bears when got the chance. Australia’s Employment Change rose to 88.4K versus 25K expected and 60.6K prior. Further, the Unemployment Rate dropped to 3.5% from 3.9% previous readouts and 3.8% market consensus. Earlier in the day, Australia’s Consumer Inflation Expectations for July came out as 6.3% versus 5.9% expected and 6.7% prior.
Even so, the markets remain dicey as recession fears remain on top ahead of the crucial economics, which in turn exert downside pressure on the AUD/USD pair. The reason for the economic slowdown woes could be linked to Thursday’s firmer US data. That said, the US Bureau of Labor Statistics mentioned that the Producer Price Index (PPI) for final demand in the US climbed to 11.3% on a yearly basis in June from 10.9% in May. This print surpassed the market expectation of 10.7%. Additionally, there were 244,000 Initial Jobless Claims in the week ending July 9 versus the previous week's print of 235,000 and market expectation of 235,000. The Weekly Jobless Claims were the highest in five months.
Amid these plays, Wall Street closed mixed and the US 10-year Treasury yields ended the day around 2.95%, up 0.95% intraday, whereas the 2-year bond coupon dropped 0.75% to 3.12% at the latest.
Moving on, China’s Q2 Gross Domestic Product (GDP) is expected to drop to -1.5% QoQ versus 1.3% prior while the Retail Sales may print a 0.0% YoY figure for June compared to -6.7% previous reading. Further, the US Retail Sales is likely to rise to 0.8% MoM in June from -0.3% marked in May. Should the scheduled data print upbeat figures in China and marked a negative surprise in the US, the AUD/USD may extend the latest rebound.
Also read: US June Retail Sales Preview: Has the consumer turning point arrived?
Technical analysis
Unless providing a daily closing below the one-month-old descending support line, at 0.6695 by the press time, AUD/USD can offer intermediate bounces towards the downward sloping resistance line, around 0.6860 at the latest.
- USD/CAD is juggling around 1.3120 as investors await the release of US Michigan CSI.
- A preliminary estimate for the Michigan CSI says a minute slippage that is not lucrative for the DXY.
- Oil prices have rebounded strongly after slipping below the critical support of $90.00.
The USD/CAD pair is oscillating in a narrow range of 1.3090-1.3140 from the New York session after displaying a corrective action. The major attracted significant offers after failing to hold the fresh yearly highs above 1.3200. The asset has followed the footprints of the US dollar index (DXY) and has turned sideways ahead of the US Michigan Consumer Sentiment Index (CSI).
As per the market consensus, the US Michigan CSI is expected to slip minutely to 49.9 from the prior release of 50. It is worth noting that the prior release of 50 was the lowest in the past 15 years and even an expectation of a minute slippage this time may bolster the statements of critics.
The economic data resembles the confidence of the consumers in the financial prospects of the country. A slippage in the economic data dictates a drop in the buying conditions for real estate and durable goods in the economy. No doubt, the persistent price rise has trimmed the demand for durable goods and higher interest rates are becoming a nightmare for home buyers. Also, the announcement of a rate hike by 1% from the Federal Reserve (Fed) will bring a serious slump in the demand for real estate.
On the loonie front, investors are still in the hangover of the 1% rate hike announcement by the Bank of Canada. Energy bills and food products are driving the inflation rate higher vigorously, which forced the BOC to announce the unusual and has set an example for other central bankers that a sky-rocketing rate hike can be announced.
Meanwhile, the oil prices have rebounded strongly as a responsive buying action pushed the black gold higher after slipping below the critical support of $90.00. This indicates that the extremely oversold signals have supported the oil prices, however, the downside is still warranted.
- USD/CHF is expected to display more downside after violating 0.9820 amid a correction in DXY.
- The DXY has renewed its 19-year high at 109.20 on soaring hawkish Fed bets.
- A 1% rate hike by the Fed may put an extreme burden on the growth prospects of the US economy.
The USD/CHF pair is declining gradually after failing to kiss the crucial resistance of 0.9900 on Thursday. The asset has displayed a squeeze in volatility and is likely to display an expansion in the same after surrendering the cushion of 0.9820
The US dollar index (DXY) has entered into a correction phase after failing to sustain above the dynamic hurdle of 109.00. The asset is refreshing its 19-year high in each trading session, which is sufficient to claim that the bulls' party is not over and the correction would turn into a bullish impulsive wave sooner.
The odds of a 100 basis points (bps) rate hike by the Federal Reserve (Fed) are advancing firmly and eventually are haunting the market participants as it is not necessary that the economy may handle the unusual burden. Fed policymakers are empowered by solid growth prospects and employment generation to sound hawkish in their interviews. The rate hike by 1% could test the strength of the economy and there is no surety that it may handle the burden more comfortably this time. Failing to do the same may drive the economy towards recession.
In today’s session, the release of the US Retail Sales will remain in focus. A preliminary estimate for the economic data is 0.8%, and outperformance is expected in comparison to the prior release of -0.3%.
On the Swiss franc front, the less dependency of the Swiss economy on oil imports from Russia is making it a lucrative bet as the economy won’t face the energy issues despite being in Europe. The focus will remain on commentary over interest rates by the Swiss National Bank (SNB), which will guide the market participants.
- NZD/USD continues extending its fall during the week, set to finish with losses for the third straight week.
- A risk-off impulse weighed on the NZD/USD, courtesy of the red hot US PPI report.
- Fed officials push back against 100 bps; investors scale back 100-bps rate hike.
The New Zealand dollar snapped two days of consecutive gains on Thursday and is trading with minimal losses of 0.12% amidst a dampened market mood, spurred by another high US inflation report, in this case, the Producer Price Index for June, which exceeded expectations, while the greenback rises.
The NZD/USD is exchanging hands at 0.6125, almost pairing its earlier losses, after dipping to a fresh YTD low around 0.6060, though buyers stepped in, and the major rose shy of the daily high around 0.6134.
The main drivers are the US Dollar and a dismal mood
Risk aversion is still dominating the financial markets. US equities finished Thursday’s session with losses, reflecting worries about a stickier than expected inflation, recession jitters, and expectations of a larger-than-expected US Federal Reserve hike.
During the New York session, which had just finished, the US Department of Labour reported the June Producer Price Index, also known as the PPI, which showed that prices rose by 11.3% YoY, higher than the 10.7% estimated. Although portraying persistent cost pressures, producers got a respite as commodity prices recoil on concerns about global demand. That, alongside consumer inflation overshooting 9% annually, further cemented the case for a Fed’s 75 bps rate hike.
Fed speaking continued throughout the day as officials will enter a blackout period ahead of the July meeting. Fed’s Christopher Waller and James Bullard downplayed the chance of a 100 bps hike, with both backing up a 75 rate rise. Later in the day, the new Boston Fed President, Susan Collins, expressed that inflation is “too high” and said she would address it as her priority.
Investors’ reaction to that was felt in Eurodollars money market futures, with the July contract pricing in 268 bps of tightening, meaning that it’s fully priced in a 75 bps, while odds of a 100 bps are down at 44%, a tailwind for the NZD/USD, which staged a late recovery, erasing some earlier losses.
In the meantime, the NZD/USD capped its losses due to the recent RBNZ rate hike and market participants scaling back Fed interest rate rises.
What to watch
The New Zealand economic calendar will feature Business PMI for June on Friday. The economic docket is packed on the US front, led by Retail Sales, the University of Michigan (UoM) Consumer Sentiment, and further Fed speaking, ahead of entering the blackout period.
NZD/USD Key Technical Levels
- The Gold Price is offered below critical market structure and the focus in the main is on the downside towards monthly lows of $1,676.86.
- Price pressures are still much too strong to delay Fed rate hikes.
- US dollar could continue to derive support from the fears of a recession at home and away.
The Gold Price (XAU/USD) has been pressured on Thursday due to a rising US dollar and hawkish sentiment surrounding the Federal Reserve which is widely expected to raise the federal funds rate by 75 basis points at its July 26-27 meeting. trading at $1,710.10, the price is 1.47% lower at the time of writing, sliding from a high of $1,736.60 to a low of $1,697.64. Overall, both the technical and fundamental bias has been to the downside.
The break in daily market structure and prospects of a strong US dollar as well as higher yields, which gold does not offer to investors, have weighed on the precious metal. The greenback has tended to strengthen both when the US economy outperforms its peers and also when the US economy looks weak.
Gold Price weighed by Fed sentiment
There are concerns that the Federal Reserve is caught between a rock and hard place, but overall, the Gold Price is being weighed into pre-pandemic levels and there are risks of a significant capitulation event in precious metals. Firstly, US inflation surprised once again to the upside in June, both headline and core measures, with annual inflation jumping to a new four-decade high of 9.1%, up from 8.6% in May. Therefore, supportive of global yields and the US dollar as a headline for gold prices, the market expects that the Fed will be in no rush to signal a pivot from its current path of aggressive rate hikes and is pricing in steeper hikes of 100bs pints for not only in July but September's meeting as well. At the June FOMC meeting, Chair Powell stated that he would need ‘compelling evidence’ that inflation is easing for the Fed to change course, which he defined as ‘a series of falling monthly inflation readings’.
Fears of global recession, support of the US dollar
The US dollar could continue to derive support from the fears of a recession at home and away. Despite the slowing in demand that we are now seeing and the risk of recession, the Fed is clearly more worried about a de-anchoring of inflation expectations, which would be much harder to deal with. A global recession could stem from no other than the second largest economy in the world, China which is battling with Covid infections. Barely six weeks after Shanghai fully lifted a prolonged and harshly enforced lockdown, China's biggest city is again grappling with a surge of the virus.
The worries that the Middle Kingdom could miss its official growth forecast this year have been mingling with recession fears for both the Eurozone and the US. This is expected to continue to play into the hands of the US dollar bulls. The US dollar smile theory has been playing out since the advent of Covid and is sucking up the world's capital.
The greenback’s safe haven function also stems from its use as an invoicing currency and from the significant amounts of USD-denominated debt issued by non-US residents. Simply put, in times of uncertainty various market participants take action to secure their access to USDs. In turn, the pull on the gold price is likely to persist, at least until the Fed’s front-loaded policy tightening cycle is near conclusion.
''There is no way around it, the Fed has an inflation problem on its hands and the USD will continue to remain king of FX,'' analysts at TD Securities argued.
Gold Price expectations from TD Securities
''The single largest speculative cohort in gold appears to be holding a complacent position, with the average trader holding twice their expected position size,'' analysts at TD Securities said.
Key quotes:
''The epicentre of speculative gold markets has shifted away from money managers and towards the often-ignored prop-trader cohort. Their length was accumulated in 2020 and does not appear to be correlated to inflation or Fed narrative, which instead points to some complacency in this legacy position.''
''The latest data suggests that prop-trader bulls were still adding on the dip, as the breadth of traders long grew, but the pressure is building towards a capitulation if prices trade below their pandemic-era entry levels. In a liquidation vacuum, these massive positions are most vulnerable, which suggests the yellow metal remains prone to further downside still.''
Gold Price technical analysis
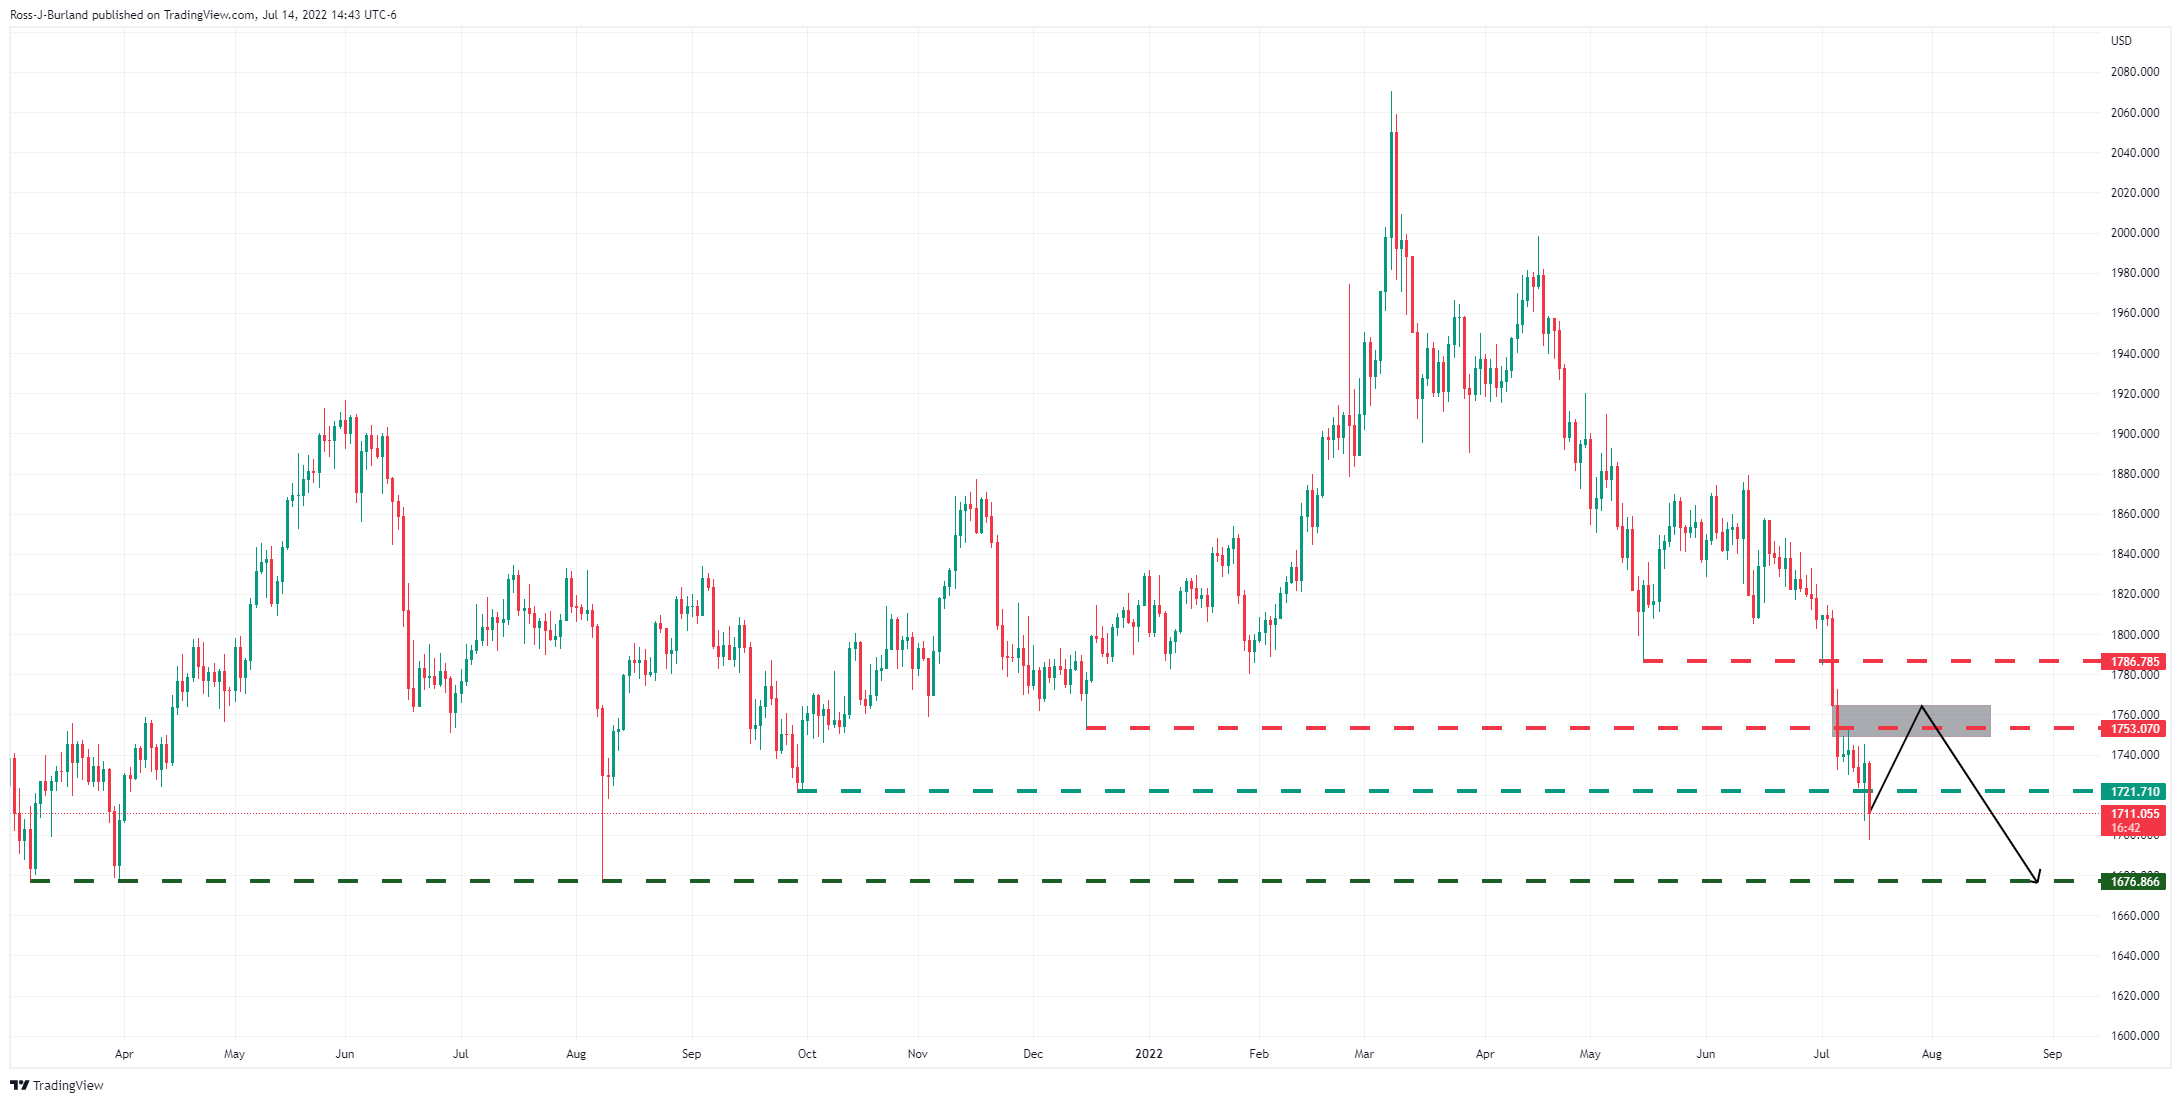
The Gold Price has broken structure on the daily chart although there are prospects of a correction in order to mitigate the imbalance of price above resistance as illustrated above. The downside target, however, is in play.
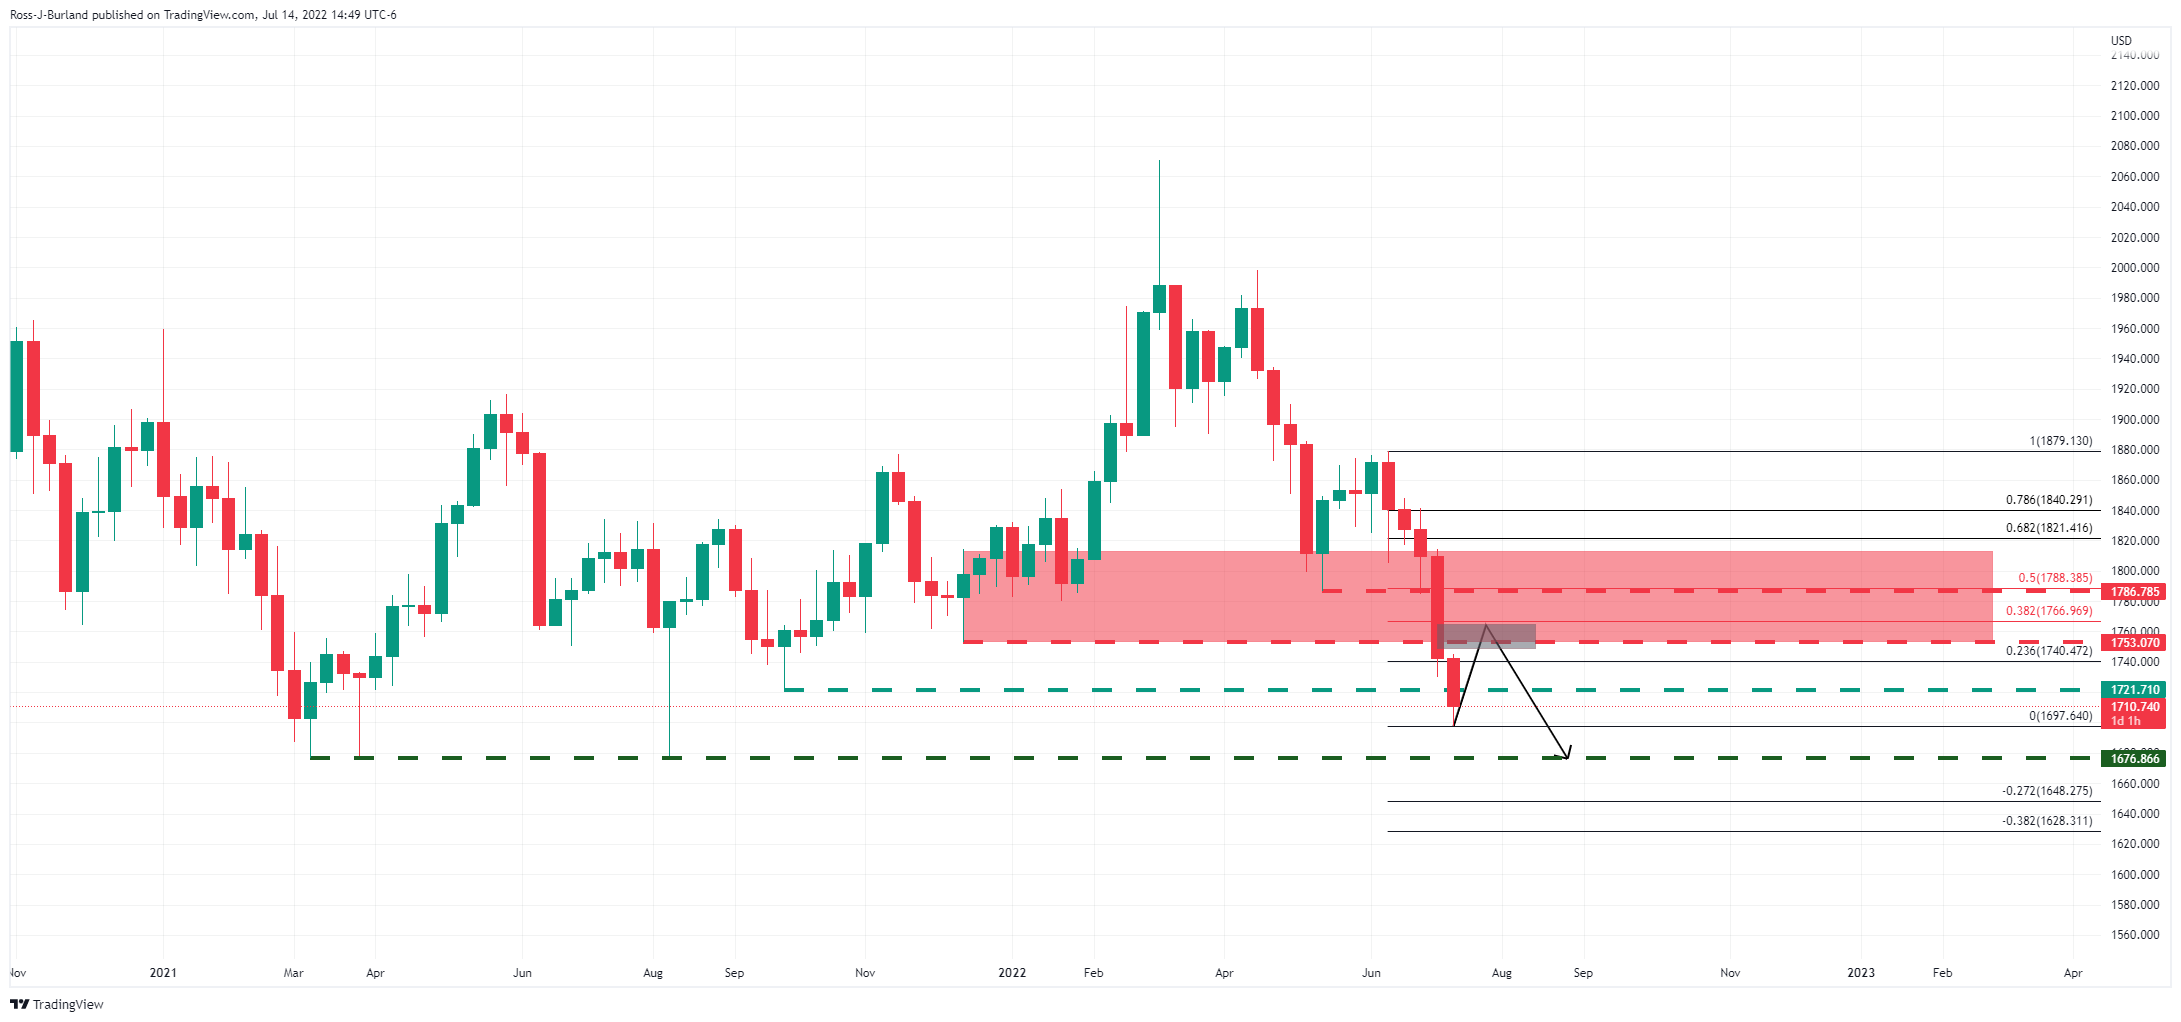
From a weekly perspective, the price could also be regarded as extended and a correction is arguably feasible at this juncture. There is a price imbalance from the current week's highs to the week commencing June 27 low. This area meets a 50% mean reversion and a 38.2% Fibonacci retracement before then. However, the focus in the main is on the downside towards monthly lows of $1,676.86 as illustrated on the chart above.
What you need to take care of on Friday, July 15:
Fears of recession maintained the dollar on the bullish path throughout the first half of the day, although cooling expectations of a 100 bps rate hike in the US triggered a corrective slide.
Federal Reserve Governor Christopher Waller noted that markets may have gotten ahead of themselves by pricing a 100 basis points rate hike in July, adding that a 75 bps hike will bring them to be neutral. CME FedWatch is now showing a 52% chance of a 75 bps rate hike in July.
Global indexes plummeted at the beginning of the day, although Waller's words helped Wall Street to trim most of its intraday losses. As a result, high-yielding currencies recovered some of the ground lost against the greenback.
The EUR/USD pair plunged to 0.9951 but finished the day at around 1.0020. Turmoil in Europe added to the shared currency's weakness. Gazprom, the Russian energy giant, said that it would not guarantee to resume the functioning of the Nord Stream 1 pipeline after it was shut down for repairs. German Economy Minister Robert Habeck said that the uncertainty around gas deliveries "is clouding the economic outlook considerably heading into the second half of the year." Also, Italian Prime Minister Mario Draghi announced he is resigning.
The GBP/USD pair fell to 1.1759, its lowest since March 2020, and now trades around 1.1820. Political noise in the United Kingdom, after Prime Minister, announced his resignation and Tories began an election process, weighed on the pound.
The USD/CAD pair soared to 1.3223, weighed by equities and falling oil prices but retreated towards the 1.3100 price zone. The barrel of WTI traded as low as $90.53 a barrel, now hovering around $96.30.
The AUD/USD pair edged modestly lower and trades at 0.6750, despite upbeat Australian employment figures.
Gold reached a fresh 2022 low of $1,697.56 a troy ounce, now hovering around $1,710.
Ripple's XRP price is a dangerous bull-trap until this level is touched
Like this article? Help us with some feedback by answering this survey:
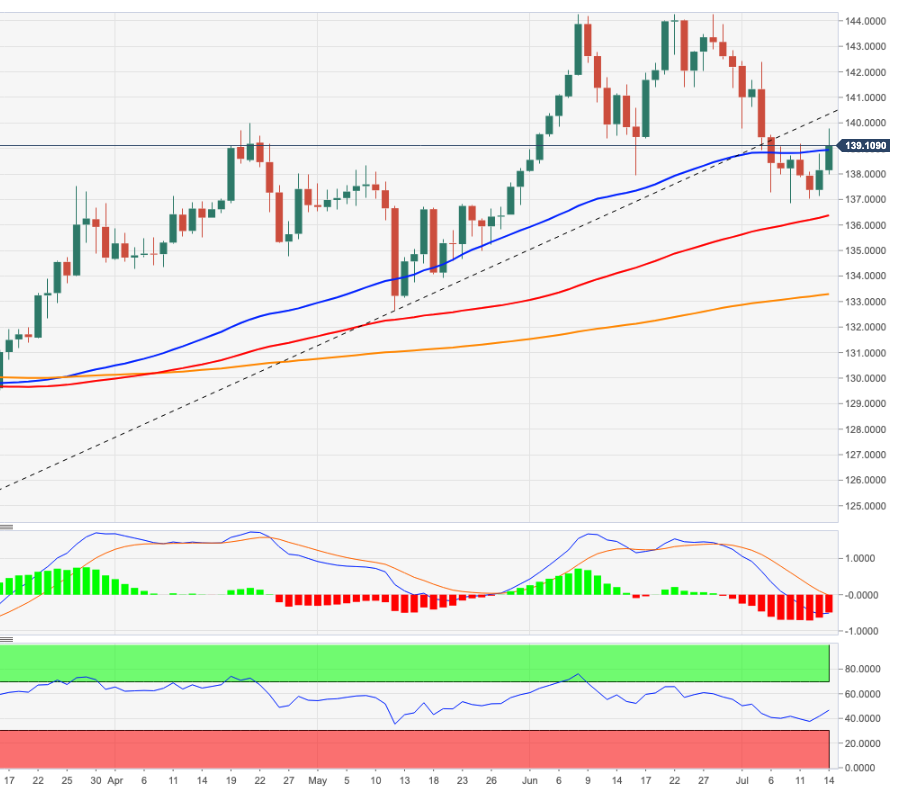
- The EUR/JPY erases its weekly losses and is up 0.50%.
- A risk-off impulse was no excuse for the euro to rally against the JPY.
- EUR/JPY is neutral-upwards as buyers stepped in, reclaiming the 139.00 mark.
The EUR/JPY rises during the North American session, refreshing weekly highs around 139.76, but retreated some as the Wall Street session winds down on Thursday, amidst a dampened investors’ mood, sparked by another US elevated inflation report, in this time, the PPI. At the time of writing, the EUR/JPY is trading at 139.22, gaining 0.78%.
EUR/JPY’s price action portrays the cross, opening near the daily pivot point of the day, around 138.10s, dipping to the daily low at 137.99, before rallying more than 150 pips, hitting a fresh weekly high at the R2 daily pivot at 139.76. After that, the EUR/JPY dipped towards the 139.10 lows but stayed positive in the day, as the EUR/USD is also back above parity at around 1.0020s.
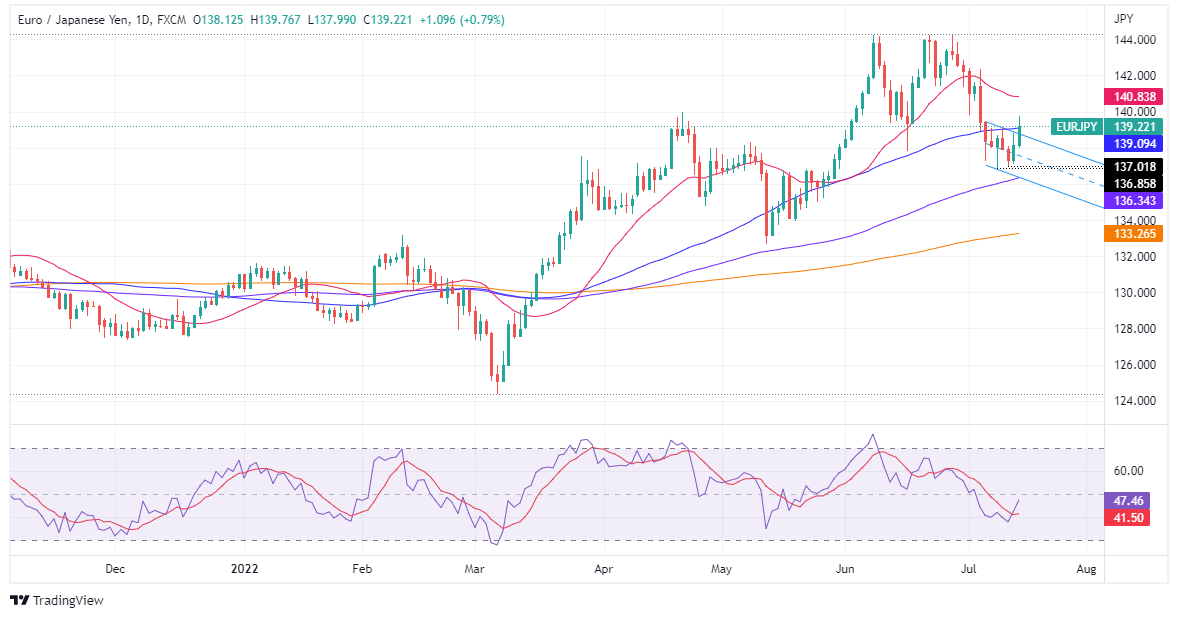
EUR/JPY Daily chart
From a technical perspective, the EUR/JPY shifted from neutral to neutral-upwards as EUR/JPY buyers reclaimed the 50-day EMA around 139.05, as well as breaking above a descending channel, which has opened the door for further upside. EUR/JPY traders should notice that oscillators are aiming higher, particularly the Relative Strength Index (RSI), closing to the 50 line at 47.57.
Therefore, the EUR/JPY path of least resistance is upwards, and its first resistance would be July 6 daily high at around 139.50. Break above will expose the 140.00 figure, followed by a challenge of the 20-day EMA at 140.83. Once cleared, the EUR/JPY’s next resistance would be the July 5 high at 142.37.
EUR/JPY Key Technical Levels
- GBP/USD is suffering in the hands of a firm US dollar and UK political uncertainties.
- Traders have ramped up bets that the U.S. central bank could raise rates by 100 basis points.
GBP/USD is trading down on the day by some 0.7% at the time of writing with the pair falling from a high of 1.1892 to a low of 1.1759. The US dollar resumed its relentless move higher on Thursday, charting new 24-year highs in the DXY index that tracks the greenback against six counterparts up more than 13% this year. It was last up 0.64% on the day at 108.710.
Markets are fixated on the Federal Reserve which is widely expected to raise the federal funds rate by 75 basis points at its July 26-27 meeting. The Consumer Price Index data for June that was released Wednesday morning surprised to the upside, coming in far stronger than expected. The Fed's Beige Book report on Wednesday afternoon also indicated that inflation remains brisk and labour markets tight, but there were signs that demand has slowed. This is concerning investors in anticipation of a recession which too is supporting the US dollar on safe-haven flows.
As for domestic fundamentals, the pound will be subject to political uncertainties. ''The combination of slow growth, debt and high inflation is likely to provide very tricky for the new Tory leadership,'' analysts at Rabobank explained. ''Several candidates have proposed sweeping tax cuts that threaten both public finances and the inflation outlook.''
''On the other hand, if used carefully tax cuts could boost investment that would increase productivity, growth potential and tax revenue. That said, Sunak, the former Chancellor has accused the pledges of many of his rivals in the leadership race as “comforting fairy tales” and is expected to argue that his approach during his tenure was “responsible”. The UK had been on course to see the highest tax burden in 70 years by the end of the current parliament.''
- Silver plummets during the week, extending its losses by almost 5%.
- Risk-aversion, rising US Treasury yields, and a buoyant US dollar weighed on XAGUSD.
- Fed’s Waller and Bullard backed a 75 bps rate hike; money market futures expectations for 100 bps fall.
Silver (XAGUSD) is tumbling on Thursday during the North American session as US Treasury yields rise, led by 2s and 5s, keeping the US 2s-10s yield curve inverted for the eighth consecutive day, meaning traders’ recession fears are increasing. However, high US inflation readings on the consumer and producer side continued their upward trajectory, making the Fed’s job even harder. At the time of writing, the XAGUSD is trading at $18.35, losing more than 4% in the day.
Pessimism surrounds the markets; cheered by US dollar bulls
Global equities remain under pressure, extending their fall as investors seek safety. Weighed by a hot US Producer Price Index for June, topping above 11% YoY, added fuel to higher inflation expectations, following Wednesday’s CPI at 41-year highs above the 9% YoY threshold.
Investors’ reaction to that can be seen in the greenback’s strength. The US Dollar Index, a gauge of the buck’s value vs. six currencies, reached a 20-year high around 109.200s, though, at the time of writing, it sits at 108.765, up 0.69%. US T-bond yields are also rising, exerting further downward pressure on precious metals, with the US 10-year T-note coupon at 2.959%, up two bps.
In the meantime, the Fed parade continues with Fed’s Waller, Collins, and Bullard crossing wires. Fed’s Waller and Bullard still back a 75 bps rate hike. Waller added that if retail sales and housing data come stronger than expected, he would lean toward a higher July hike. In the meantime, the newest Boston Fed President, Susan Collins, said that inflation is too high and addressing it is her priority. Traders should notice that Collins is a voter in 2022 and will participate in the July FOMC meeting.
Also read: Fed’s Waller: Markets may have gotten ahead of themselves on 100 bps hike in July
XAGUSD traders should also take clues about gold prices, which remain heavy at around $1709 a troy ounce. At the same time, the Bloomberg Commodity Index is falling almost 2%, portraying traders’ worries about current and future demand, spurred by China’s Covid-19 reemergence during the week.
Also read: Fed's Bullard calls for a 75bp hike in July
What to watch
On Friday, the US economic docket will feature Tier 1 data, with Retail Sales, the NY Empires State Manufacturing Index, and the University of Michigan (UoM) Consumer Sentiment survey.
XAGUSD Key Technical Levels
Reuters reported that St. Louis Federal Reserve President James Bullard would prefer to lift interest rates by 75 basis points at the central bank's next meeting later this month, was telling the Japanese news service Nikkei in an interview released on Thursday that he does not back a larger increase for now.
"So far, we've framed this mostly as 50 versus 75 at this meeting," Bullard said. "I think 75 has a lot of virtue to it, because the long-run neutral that the committee has, according to the Summary of Economic Projections, is actually about 2.5%."
Asked if the Fed's policy rate, currently in a range of 1.5-1.75%, could exceed 4% by year end, Bullard said: "I suppose it's possible," but cautioned that would require data on inflation to continue coming in in "an adverse way."
- AUD/USD remains heavy during the week, extending its losses by almost 1.80%.
- Sentiment remains negative due to high US inflation reports, further cementing aggressive Fed tightening.
- AUD/USD Price Analysis: Tilted to the downside; unless buyers reclaim 0.6800, the further downside pressure remains.
The AUD/USD trims two consecutive days of gains and slides during the North American session, on dismal market sentiment, following a report that prices paid by producers continued high, following suit the path of consumer inflation, further cementing the case for further aggressive tightening by the Fed.
The AUD/USD is trading at 0.6732 after recovering from an early trip towards daily lows at 0.6681 on broad US dollar strength, though it recovered some ground once the dust settled, stabilizing at current price levels.
AUD/USD falls on USD strength, despite upbeat Australia job report
Early in the New York session, the US Department of Labour reported that the Producer Price Index heightened above the 11% threshold on a year-over-year reading. Although it was a negative report, it shows that producers are getting a respite as commodity prices recoil on concerns about global demand. Following Wednesday’s CPI, that report might open the door for a larger than expected 75 bps rate hike by the Fed, as Eurodollars July money market futures contract shows 271.50 bps of tightening.
All that weighed on the AUD/USD, which tumbled towards 0.6680s in the release. At the same time, US Initial Jobless Claims, for the week ending on July 9, rose by 244K, though was mainly ignored by investors, which are focused on inflation.
In the meantime, during the Asian session, the AUD/USD got bolstered by a better-than-expected employment report, which showed that the unemployment rate dropped to its lowest level in 50 years. In the meantime, expectations of a Reserve Bank of Australia (RBA) 50 bps rate hike are fully priced in. Although the AUD/USD climbed on the release, the appetite for US dollar safety weighed on the major.
What to watch
The Australian economic calendar will feature New Home Sales for June on Friday. The economic docket is packed on the US front, led by Retail Sales, the University of Michigan (UoM) Consumer Sentiment, and further Fed speaking, ahead of entering the blackout period.
AUD/USD Price Analysis: Technical outlook
The Aussie dollar remains tilted to the downside, though remains capped by the July 12 daily low at 0.6710, which in case of being broken again in the day, sellers would step, paving the way for further losses. Additionally to that, oscillators remain favoring shorts, further cementing the case. Therefore, the AUD/USD first support would be 0.6700. Break below will expose the YTD Low at 0.6681, followed by May 2020 lows at 0.6616.
AUD/USD Key Technical Levels
Reuters reports that Mario Draghi said he would resign as Italian prime minister on Thursday after a party in his ruling coalition did not participate in a confidence vote.
"I will tender my resignation to the president of the republic this evening," Draghi told the cabinet, according to a statement released by his office."The national unity coalition that backed this government no longer exists," he added.
Key notes
- 5-star's non-participation in the confidence vote was "very significant from a political point of view".
- The "national unity" coalition that backed this government no longer exists.
- The conditions are no longer in place for me to carry on.
- I will tender my resignation to the president this evening.
Meanwhile, the euro remains pressured around 1.0000 vs the greenback on Thursday after falling to its lowest level yet to 0.9952 on Thursday.
The Bank of England will announce its next monetary policy decision on August 4. According to analysts from Danske Bank, the EUR/GBP could move higher if the BoE does not hike interest rates as it is priced in by investors. They forecast EUR/GBP at 0.85 in one month, at 0.86 in three months, at 0.85 in three months and at 0.84 in a year.
Key Quotes:
“Over the past month, EUR/GBP moved back below 0.85, as GBP benefitted from the broad USD appreciation (GBP/USD is now trading below 1.19).”
“We still see a case for a slight move higher in EUR/GBP near-term if we are right that the Bank of England will not hike as aggressively as priced in by investors.”
“Looking further ahead, on the one hand, the positive USD environment is usually benefitting GBP relative to EUR. On the other hand, relative rates now seem supportive for EUR relative to GBP. Overall, we still expect the cross to trade around 0.84 in 12M.”
The Bank of Canada hiked the key interest rate by 100 bps on Wednesday to 2.50%. Despite the larger-than-expected hike, analysts at Danske Bank continue to see the USD/CAD pair moving to the upside over the next quarters, reaching 1.34 in six months.
Key Quotes:
“We still consider USD/CAD as a low beta version of USD/NOK. With our expectations of a stronger USD and a general continued pressure on cyclically sensitive assets we continue to see risks skewed to the topside for the cross. Bank of Canada has now joined the camp of central banks front-loading monetary tightening by delivering both earlier and larger rate hikes. Meanwhile, paradoxically, larger rate hikes pose a headwind to CAD via the CAD asset market taking a hit. According to the CFTC IMM data speculative positioning in USD/CAD is fairly neutral.”
“We forecast USD/CAD at 1.31 in 1M (from 1.31), 1.33 in 3M (1.33), 1.34 in 6M (1.34) and 1.34 in 12M (1.34).”
The US Dollar hit a fresh 20-year high on Thursday versus the euro and the yen. Analysts at Wells Fargo, continue to forecast dollar strength over the remainder of 2022 and into 2023. They warn the greenback could peak by early next year and then soften against G10 and emerging market currencies through much of 2023.
Key Quotes:
“The tight stance of policy alongside still high inflation suggests a recession is more likely than not next year. We look for the U.S. economy to enter a mild recession in the first quarter of 2023. The downturn should help alleviate inflation pressures enough to where the Fed begins easing policy in the second half of 2023.”
“Given the outlook for U.S. recession and a quicker end to the Fed tightening cycle at a slightly lower terminal rate than we had in our forecast last month, our outlook for the U.S. dollar has also changed. We still expect the greenback to gain against most foreign currencies through 2022 until early 2023 as the Fed tightens more quickly than most foreign central banks. However, that shorter Fed rate hike cycle, accompanied by U.S. recession and followed by Fed easing, means we now see a peak in the U.S. dollar by Q1-2023. Beyond that, we expect the greenback to soften steadily during most of next year.”
- EURUSD erased Wednesday’s losses, diving below parity, reaching a daily low below 0.9960.
- US PPI rose as well as consumer inflation; will the Fed go 100 bps?
- Federal Reserve interest rates expectations of a rate hike lie at around 89%.
- Interest rate differentials between the Fed and the ECB boost the EURUSD fall.
EURUSD gave up on sellers and broke below parity for the first time since December of 2002, finishing a period of 20 years above the €1/$1 figure, reaching a fresh 20-year low around 0.9952, before recovering some ground and trimming its earlier losses of 0.43%, on Thursday. At the time of writing, the EURUSD is seesawing around 1.0004.
Global equities are tumbling, displaying investors’ pessimistic mood. In the meantime, the US Dollar Index, a measurement of the greenback’s value against a basket of six of the G8 currencies, printed a fresh 20-year high, around 109.294, before retreating some, but remains up 0.67% underpinned by higher US Treasury yields, and is sitting at 108.720, a headwind for the EURUSD.
Also read: EUR/USD Forecast: Third time a charm? Parity under pressure again
US inflation remains high, as PPI exceeds estimates
US PPI report continues high
Before Wall Street opened, the US docket reported prices paid by producers, also known as PPI. The PPI continued its upward trajectory, topping the 11% mark at 11.3%, beating expectations of 10.7%. Albeit a negative reading, showing persistent cost pressures, producers get a respite as commodity prices recoil on concerns about global demand. This adds to Wednesday, Consumer’s Price Index (CPI), which at 9.1% YoY, inflicts substantial pressure on the Federal Reserve to move quickly and aggressively if they would not like inflation expectations to anchor at higher levels. Consequently, this would be a headwind for the EURUSD, despite the ECB’s guidance that it would begin raising rates for the first time in 11 years.
Fed speakers began to be vocal about rate hikes and emphasized that inflation is high
Meanwhile, EURUSD traders should be aware of additional Fed speakers piling up before entering the blackout period. On Wednesday, after the lousy inflation report in the US, Atlanta’s Fed President Raphael Bostic said everything is in play when asked about raising rates 100 bps in the July meeting. Later, the Cleveland Fed President Loretta Mester said they don’t need to decide on rates today but emphasized that inflation is “too high,” and the CPI report was uniformly negative. In the meantime, backing 75 bps is San Francisco’s Fed Mary Daly, but she also said that 100 bps is within the range of possibilities.
US 2s-10s yield curve remains inverted; a Fed 100 bps hike in July is possible
The US 2s-10-yield curve is still inverted for the eighth consecutive day, deepening into further negative territory towards -0.243%, a level last seen in 2000. However, at the time of writing, the spread reduced to -0.172%, as traders’ fears about recession easied a tone. Nevertheless, that would not deter the Federal Reserve from aggressive tightening, which is terrible news for EURUSD longs. According to money market futures STIRs, the eurodollars July’s futures contract, at 97.295, displays 270 bps of tightening, implying that the Fed could hike rates close to 100 bps in the July meeting.

Eurodollars discount a 270 bps tightening by July
ECB vs. Fed differentials, a headwind for the EURUSD
In July, both banks, the ECB and the Federal Reserve will host their monetary policy meetings. Currently, the ECB’s deposit rate lies at minus 0.50%, while the US Federal Reserve’s Federal funds rate (FFR) is at 1.75%, bolstering the appetite for the greenback. With expectations of the ECB hiking 25 bps and the Fed to move at least by 100 bps, differentials would widen further, to -0.25% (ECB) vs. 2.75% (Fed), meaning that the greenback would keep the upper hand, opening the door for further selling pressure on the EURUSD.
Also read: EURUSD Price holds parity on hawkish Fedspeak, EU Economic Forecasts eyed
EURUSD Price Technical outlook
EURUSD remains heavy, as shown by the daily chart, with the daily moving averages (DMAs) residing well above the exchange rate. Wednesday’s correction offered EURUSD shorts a better entry price after hitting a daily high around 1.0122, but on Thursday, the major extended its losses, pushing below the parity. Therefore the EURUSD path of least resistance might continue to the downside.
Therefore, the EURUSD first support would be 1.0000. A breach of the latter will expose the fresh 20-year low at 0.9952. Once cleared, EURUSD sellers’ next challenge will be December 2002 lows around 0.9859.

EURUSD Key Trading Levels
- USD/JPY back under 139.00 after hitting a fresh high since 1998.
- US PPI shows inflation remains the main concern.
- US dollar retreats during American hours, still up for the day across the board.
Despite risk aversion, the USD/JPY is rising more than a hundred pips on Thursday. The monetary policy divergence between the Bank of Japan and the Federal Reserve is keeping the pair on demand. After it hit a new high at 139.38, it pulled back to 138.80.
Inflation data justifies divergence in monetary policy
The US Consumer Price Index rose 9.1% (annual) in June, reaching the highest since 1981. The Producer Price Index climbed 11.3%. Both numbers came in above expectations and did not show a slowdown. With inflation running hotter-than-expected, the Federal Reserve (Fed) is seen raising rate aggressively. A 100 bps rate hike at the next meeting is now not a distant possibility.
At the same time, the Bank of Japan (BoJ) is seen continuing its ultra-easing monetary policy. The divergence between the BoJ and the Fed remains the main fuel behind the USD/JPY rally.
Not even risk aversion is helping the yen. On Thursday, the Dow Jones is falling by 1.09% (at one-month lows) and US yields are steady. Still, the Japanese yen is among the worst performers and USD/JPY is up by more than a hundred pips.
If the pair rises back above 139.00, a test of the top seems likely. Above 139.40, the next resistance could emerge at 139.70. Then attention would turn to the psychological area around 140.00. On the flip side, a consolidation below 138.80 could trigger a correction. The next support could be located at 138.15, followed by a stronger area at 137.70.
Technical levels
Federal Reserve Governor Christopher Waller argued on Thursday that markets may have gotten ahead of themselves by pricing a 100 basis points rate hike in July, as reported by Reuters.
Additional takeaways
"It is a very hard game to predict a recession."
"The labor market would have to deteriorate incredibly fast to throw us into recession."
"Yesterday's inflation number was not a big surprise."
"To go above 75 bps at next meeting, I need to assess data over next couple of weeks."
"We don't want to take a knee-jerk reaction to yesterday's inflation data."
Market reaction
The US Dollar Index continued to retrace its daily rally on these comments and was last seen rising 0.45% on the day at 108.48.
"I think it is plausible that we have a growth recession where it goes below longer-run average but doesn't go negative," Federal Reserve Governor Christopher Waller said on Thursday, as reported by Reuters.
Additional takeaways
"For me, 75 bps hike at this meeting gets us to neutral."
"Recent jobs numbers are amazing figures."
"Inflation expectations data before next meeting will help shape my view on the size of hike needed at July meeting."
"Retail sales on Friday will show the level of strength in consumer spending."
"If we get a good report, that will tell me consumer demand is still strong and we can keep tightening."
"A large amount of excess savings still in US bank accounts."
"75 bps hike is my base case."
"We knew this inflation report would be ugly, but it was uglier than thought."
"You don't want to overdo rate hikes but if incoming data over the next two weeks shows me demand is still robust, I would lean into a higher rate hike."
Market reaction
The US Dollar Index edged lower after these comments and was last seen gaining 0.5% on the day at 108.55.
"I support another 75 basis points (bps) rate hike in July," Federal Reserve Governor Christopher Waller said on Thursday, as reported by Reuters. Waller further noted that he could lean toward a bigger rate increase if retail sales and housing data come in stronger than expected.
Additional takeaways
"I expect rate increases will continue after July at a pace that's dependent on incoming data."
"After July, further increases will be restricting demand."
"I expect policy to be restrictive until there has been a sustained reduction in core PCE inflation."
"A soft landing is very plausible, based on strong labor market; recession can be avoided."
"Until I see a significant moderation in core prices, I support further rate hikes."
"Fed is now, and must be, utterly focused on inflation fight."
"US labor market is very strong, data does not show weakening."
"Inflation is far too high, we are far from our goal of stable prices."
"June inflation report was a major league disappointment."
"There are signs of slowing in economic activity, but not convinced it will damage the labor market."
"Causes of inflation don't affect approach to policy."
"Financial market response to Fed's actions show Fed retains credibility."
"With inflation so high, there is a virtue in front-loading policy tightening."
Market reaction
The US Dollar Index edged lower from multi-decade highs it set earlier in the day after these comments but was last seen still rising 0.7% on the day at 108.80.
- USD/CAD posts biggest daily gain in months.
- Loonie is under pressure despite a larger-than-expected BoC rate hike.
- US dollar firm across the board amid risk aversion.
The USD/CAD made an impressive reversal during the latest sessions, rising from weekly lows to the highest since November 2020. Recently it climbed to 1.3223 before pulling back toward 1.3150.
CAD weakens the day after BoC's surprise
On Wednesday, the Bank of Canada rose the key interest rate by 100 basis points to 2.50%, a larger-than-expected move. The loonie rose across the board after the decision. It started to decline during Thursday’s Asian session and accelerated the move higher in European hours.
After breaking above the key resistance at 1.3080 it jumped above 1.3100 and then peaked at 1.3223. As of writing, it trades at 1.3140, up almost 200 pips for the day.
A stronger US dollar across the board, a decline in crude oil prices and risk aversion boosted USD/CAD. The greenback, measured by the DXY, reached the highest level in almost 20 years at 109.29 before trimming losses.
Data from the US showed the Produce Price Index rose 1.1% in June above the 0.8% of market consensus. Inflation concerns remain the top priority for central bankers.
Technical levels
The US Census Bureau will release the June Retail Sales report on Friday, July 15 at 12:30 GMT and as we get closer to the release time, here are the forecasts of economists and researchers of six major banks regarding the upcoming data.
Retail Sales are forecast to rebound to 0.8% in June with the ex-autos to 0.6% and control rising to 0.3%.
Commerzbank
“We expect June retail sales to rise by 1.0%, but higher prices, especially at gas stations, are largely responsible for this.”
TDS
“We look for retail sales to recover in June (0.5%), following the series' first contraction this year in May. Spending was likely aided by another firm showing in gasoline station sales and a rebound in the auto segment. We also look for another gain in the eating/drinking segment as consumers continue to transition away from goods. That said, control group sales likely fell again (-0.5%).”
SocGen
“We expect an increase in real consumption of 1.0-1.5%, which is a further slowing of consumption back to a longer-term trend. Largely this is as expected. In June, new motor vehicle sales recovered to 13 m.u. pace from 12.68 in May. Gasoline prices soared in June, which lifts the retail sales excluding autos measure. The control group strips out vehicles and gasoline sales, and we expect a more moderate 0.4% increase.”
NBF
“Car dealers likely contributed positively to the headline number, as auto sales increased during the month. Gasoline station receipts, for their part, may have expanded steeply judging from a sharp increase in pump prices. All told, headline sales could have advanced 0.9% MoM. Spending on items other than vehicles may have been a tad weaker, rising 0.8%.”
CIBC
“With higher gas prices and auto unit sales in June, retail sales likely more than made up for the weakness seen in May and rose by 0.9%. However, things likely won’t look as rosy elsewhere, as higher prices for essential goods will likely squeeze discretionary spending volumes, while the slowdown in housing activity could have weighed on furniture and appliance sales. The 0.3% advance expected in the control group (ex. gasoline, autos, restaurants, and building materials) will therefore reflect price increases, and implies a contraction in real spending.”
Wells Fargo
“We forecast retail sales rose 0.8% last month. But price gains were again likely a key factor boosting these nominal sales estimates, as we expect goods prices continued to rise. While inflation continues to cloud this nominal read on sales, the retail data remain an important indication of how goods spending is evolving. Auto sales should provide a decent boost to overall sales in June based on previously reported vehicle sales data. Supply chains have shown notable signs of improvement, but until there is a further thawing in supply, we view it as unlikely for a sustained recovery in the hard-hit sector. More broadly, we forecast goods spending to decline on-trend as households continue to dedicate more wallet share to services this summer. The dwindling demand for goods has sparked concern of the potential for retail inventories being overbuilt. It is true that inventories are starting to be rebuilt, but there is little indication of a large enough overstocking to cause discounting and consequently sharp goods disinflation anytime soon.”
- GBP/USD witnessed aggressive selling on Thursday amid the relentless USD buying interest.
- Descending channel formation supports prospects for a further near-term depreciating move.
- A slightly oversold RSI on the daily chart suggests that bears could pause near the 1.1700 mark.
The GBP/USD pair added to its heavy intraday losses and dropped to its lowest level since March 2020, further below the 1.1800 mark in the last hour. The relentless US dollar buying picked up pace during the early North American session, which, in turn, was seen as a key factor behind the latest leg down.
From a technical perspective, Wednesday's attempted recovery move faltered near the 1.1965-1.1970 confluence resistance. The said region comprises the top end of a two-and-a-half-week-old descending channel and the 50-period SMA on the 4-hour chart. The subsequent downfall could be seen as a fresh trigger for bearish traders and supports prospects for an extension of the ongoing depreciating move.
Hence, some follow-through weakness towards challenging the descending channel support, around the 1.1700 round-figure mark, remains a distinct possibility. That said, RSI (14) on the daily chart is already flashing slightly oversold conditions. This, in turn, suggests that bearish traders could pause near the said handle, which might prompt some near-term short-covering move around the GBP/USD pair.
Any attempted recovery, however, might now confront stiff resistance near the 1.1800 mark. This is followed by resistance near the 1.1830-1.1835 region, above which the GBP/USD pair could aim to reclaim the 1.1900 round figure. Any further move up could be seen as a selling opportunity and runs the risk of fizzling out quickly near the aforementioned confluence, currently around the 1.1925-1.1930 area.
GBP/USD 4-hour chart
-637934034432286976.png)
Key levels to watch
GBP/USD has just lost the 1.18 handle. Thus, economists at Scotiabank see considerable downside risk for cable towards the 1.15 area.
Resistance seen at 1.1875/85
“The GBP is holding a broad long-lasting bearish trajectory that points to an eventual break under 1.18 with little to hold it up until the 1.15 area as a big psychological trigger with the 2020 low of 1.1412 following.”
“Resistance is 1.1875/85, the 1.19 figure area, and the mid-1.19s.”
The EUR is tracking losses against the strong USD. Economists at Scotiabank expect the world’s most popular currency pair to suffer a sustained move below 1.00, targeting 0.96.
Resistance aligns at 1.0050/60
“Price action suggests it’s only a matter of time for a sustained move below 1.00, targeting the 0.96 figure zone as key support – with intermediate at mid/big-figure areas.”
“Resistance is 1.0050/60 followed by the 1.01 big figure and yesterday’s peak of 1.0122.”
EUR/USD finally broke below parity during the American trading hours on Thursday and was last seen losing 0.8% on the day at 0.9975.
Developing story...
- Gold price dropped to a fresh 11-month low during the early North American session.
- The USD shot to a nearly two-decade high and continued exerting downward pressure.
- Aggressive Fed rate hike bets, rising US bond yields contributed to the intraday selling.
- Recession fears, the risk-off mood failed to impress bulls or lend support to the metal.
Gold price struggled to capitalize on the previous day's goodish recovery move from the $1,707 area and came under renewed selling pressure on Thursday. The intraday downfall extended through the early North American session and dragged the XAUUSD to its lowest level since August 2021, with bears still awaiting a sustained break below the $1,700 mark.
Gold price pressured by sustained USD buying
The US dollar resumed its relentless rise and shot to a fresh two-decade high amid the prospects for a more aggressive policy tightening by the Federal Reserve. A stronger USD was seen as a key factor that exerted heavy downward pressure on the dollar-denominated gold. The US Labor Department reported that the headline US CPI accelerated to 9.1% in June - the highest level since November 1981. The data sealed the case for another supersized Fed rate hike move and continued underpinning the buck.
Also Read: Gold Price Forecast: For how long can XAUUSD defend $1,700?
Elevated bond yields further weighed on XAUUSD
The US Treasury bond yields moved higher after Atlanta Fed President Raphael Bostic said on Wednesday that everything is in play to curb the persistent rise in inflationary pressures. The markets were quick to react and started pricing in the possibility of a historic 100 bps rate hike later this month and pushed the yield on the benchmark 10-year US government bond back closer to the 3.0% threshold. Elevated US Treasury bond yields further contributed to driving flows away from the non-yielding gold.
Stronger PPI print validated hawkish Fed expectations
Thursday's release of the US Producer Price Index (PPI), which surpassed expectations by a big margin, reaffirmed hawkish Fed expectations. Data published by the US Bureau of Labor Statistics showed that the gauge for final demand goods accelerated to 11.3% on a yearly basis in June as against consensus estimates pointing to a modest downtick to 10.7% from 10.9% in May. This, to a larger extent, helped offset a rise in the US Weekly Initial Jobless Claims to the highest level since November 2021.
-637934018062336492.png)
US PPI historic chart
Recession fears failed to lend any support
Even the worsening global economic outlook failed to impress bulls or lend support to the safe-haven gold. Investors remain concerned that rapidly rising higher borrowing costs, the ongoing Russia-Ukraine war and fresh COVID-19 lockdowns in China would pose to global economic growth. In fact, Bank of America economists forecast a “mild recession” in the US this year. This continued taking its toll on the risk sentiment, which was evident from an extended selloff in the equity markets.
Gold price technical outlook
Gold price, for now, has managed to hold above the $1,700 mark to lend some support, which if broken decisively would be seen as a fresh trigger for bearish traders. The XAUUSD could then accelerate the downfall towards testing September 2021 low, around the $1,787-$1,786 region. The downward trajectory could further get extended towards the 2021 yearly low, near the $1,677-$1,676 area.
On the flip side, the overnight swing high, around the $1,745 region, now seems to act as an immediate strong barrier ahead of the $1,749-$1,752 supply zone. Sustained strength beyond could trigger a short-covering move towards the $1,767-$1,770 strong horizontal support breakpoint, above which bulls might aim to reclaim the $1,800 round-figure mark.
-637934017667481815.png)
Gold Price: Can gold prices hold above $1,700?
Economist at UOB Group Lee Sue Ann comments on the recent RBNZ event.
Key Takeaways
“The Reserve Bank of New Zealand (RBNZ) decided to raise its official cash rate (OCR) by 50bps to 2.50%. Today’s decision was an interim review rather than a quarterly Monetary Policy Statement (MPS), so no new forecasts were issued and there was no press conference by RBNZ Governor Adrian Orr.”
“We had previously expected the RBNZ to tune back to the more usual pace of 25bps hikes from Jul onwards. Today’s 50bps move to a 2.50% policy rate would make the RBNZ ahead of most other central banks in lifting borrowing costs to combat rising inflation, but also seen taking the benchmark rate above a neutral level, which it deems to be 2%.”
“It is now looking likely that the RBNZ may hike by 50bps at the Aug and Oct meetings, after which we think it will tune back to the more usual pace of 25bps hikes. We will, however, be finalising our OCR forecasts only following the CPI release.”
- EUR/USD flirts once again with the key parity level.
- Below parity comes the December 2002 low at 0.9859.
EUR/USD quickly fades Wednesday’s bullish attempt to the 1.0120 region and re-focuses on the downside, particularly on the parity zone.
The pair’s bearish stance remains everything but abated for the time being. Against that, a convincing breakdown of the parity level should open the door to the triggering of massive stop-loss orders, while the next support level of note is expected to appear at the December 2002 low at 0.9859.
As long as the pair navigates below the 5-month support line near 1.0550, further losses remain in store.
In the longer run, the pair’s bearish view is expected to prevail as long as it trades below the 200-day SMA at 1.1040.
EUR/USD daily chart
- Initial Jobless Claims rose by 9,000 in the week ending July 9.
- The greenback continues to outperform its rivals on Thursday.
There were 244,000 initial jobless claims in the week ending July 9, the weekly data published by the US Department of Labor (DOL) showed on Thursday. This print followed the previous week's print of 235,000 and came in worse than the market expectation of 235,000.
Further details of the publication revealed that the advance seasonally adjusted insured unemployment rate was 0.9% and the 4-week moving average was 235,750, an increase of 3,250 from the previous week's average.
"The advance number for seasonally adjusted insured unemployment during the week ending July 2 was 1,331,000, a decrease of 41,000 from the previous week's revised level," the DOL said in its publication.
Market reaction
The dollar preserves its strength after this report with the US Dollar Index rising 0.65% on the day at 108.70.
Economists at Rabobank have revised lower their AUD/USD forecasts across the board to take account of USD strength. They expect the pair to march forward on a six-to-twelve month horizon.
AUD/USD could again struggle to advance in the near term
“While we see AUD/USD as remaining range bound for the remainder of this year, we continue to see the currency pair edging higher on a 6 to 12 mth horizon. This is on the anticipation that USD strength will have peaked and in consideration of robust Australian fundamentals.”
“While we expect AUD/USD to hold around current levels on a 1-to-3-month view, we see scope for the currency pair to edge up to 0.70 on a 6-month view and 0.74 in 12 months.”
- Annual PPI in US jumped above 11% in June.
- US Dollar Index clings to strong daily gains above 108.50.
The Producer Price Index (PPI) for final demand in the US climbed to 11.3% on a yearly basis in June from 10.9% in May, the data published by the US Bureau of Labor Statistics revealed on Thursday. This print surpassed the market expectation of 10.7%.
The annual Core PPI edged lower to 8.2% in the same period from 8.3% but came in slightly higher than analysts' estimate of 8.1%. On a monthly basis, Core PPI was 0.4%.
Market reaction
The US Dollar Index showed no immediate reaction to these figures and was last seen rising 0.65% on the day at 108.70.
Economist at UOB Group Ho Woei Chen, CFA, reviews the latest interest rate decision by the Bank of Korea (BoK).
Key Takeaways
“Bank of Korea (BOK) raised the benchmark base rate by 50 bps to 2.25% at its meeting today (13 Jul), in line with expectation. This marks the first time the BOK hiked by a 50bps quantum and the 6th rate increase since Aug 2021 with a cumulative 175 bps hike since then.”
“Governor Rhee Chang-yong said the decision was unanimous but the 50 bps hike was an ‘exception’, indicating that it will be ‘desirable’ to keep future rate increase in clips of 25 bps. However, he also warned that the stance could change if there are unexpected developments that sharply increase inflation risks. Notably, the government is also stepping up measures to contain inflation such as expanding a zero percent quota tariff for imported food items.”
“The BOK also highlighted its view of a higher inflation and lower growth forecast for this year, compared to its forecasts in May.”
“On the assumption that inflation will peak in 2H22, we maintain our forecast for the BOK to revert to 25 bps hike for the remaining meetings this year in Aug, Oct and Nov to bring the benchmark base rate to 3.00% by year-end. With an expected moderation in inflation rate next year, the BOK is likely to stay on hold thereafter, or even begin to trim interest rate should growth risks mount.”
- DXY resumes the upside with strong conviction on Thursday.
- The index surpasses the December 2002 top at 108.74.
DXY rapidly leaves behind the weakness seen in the last couple of sessions and resumes the upside to new cycle highs near 108.80 on Thursday.
Further upside in the dollar remains in store in the short-term horizon. That said, once the 2022 high is cleared, the index could attempt a move to the round level at 109.00 ahead of the September 2002 top at 109.77 (September 16).
As long as the index trades above the 5-month line near 103.15, the near-term outlook for DXY should remain constructive.
In addition, the broader bullish view remains in place while above the 200-day SMA at 98.73.
Of note, however, is that the index trades well into the overbought territory and it therefore could trigger a corrective decline in the not-so-distant future.
DXY daily chart
- AUD/USD came under renewed selling pressure on Thursday and dropped to a fresh two-year low.
- A fresh wave of the USD buying and the risk-off mood exerting pressure on the risk-sensitive aussie.
- The formation of a descending channel supports prospects for an extension of the depreciating move.
The AUD/USD pair struggled to capitalize on the upbeat Australian jobs data-inspired modest gains and witnessed a turnaround from the 0.6800 neighbourhood on Thursday. The downward trajectory dragged spot prices to the lowest level since June 2020, with bears still awaiting a sustained break below the 0.6700 round figure.
The US dollar resumed its relentless rise and climbed to a fresh two-decade high, which, in turn, was seen as a key factor that acted as a headwind for the AUD/USD pair. Apart from this, a fresh bout of intense selling around the equity markets underpinned the safe-haven buck and weighed on the risk-sensitive aussie.
From a technical perspective, the emergence of fresh selling at higher levels and sustained weakness below the 0.6700 mark would be seen as a fresh trigger for bearish traders. The negative outlook is reinforced by the fact that the AUD/USD pair has been trending lower along a four-week-old downward-sloping channel.
Furthermore, oscillators on the daily chart are holding deep in the bearish territory and are still far from being in the oversold zone. The set-up remains titled firmly in favour of bearish traders and supports prospects for a slide towards challenging the lower end of the descending channel, near the 0.6665-0.6660 area.
The latter should act as a strong base for spot prices, which if broken decisively should pave the way for an extension of the near-term downward trajectory. The AUD/USD pair might then accelerate the fall towards and challenge the 0.6600 round-figure mark before eventually dropping to the 0.6570 horizontal support zone.
On the flip side, the 0.6190-0.6210 region now seems to have emerged as an immediate strong barrier. Any subsequent move up might still be seen as a selling opportunity and remain capped near the 0.6850-0.6860 confluence, comprising 100-period SMA on the 4-hour chart and the top end of the aforementioned descending channel.
AUD/USD 4-hour chart
-637933974000138160.png)
Key levels to watch
The Canadian dollar had a slow-burn response to the larger-than-expected Bank of Canada (BoC ) rate hike. Economists at Scotiabank feel the Bank’s decision to “front-load” rate hikes should provide the loonie with some clear support and, at the very least, strengthen the cap on USD/CAD that has developed above 1.30.
BoC’s tightening should support the CAD against the likes of the EUR, GBP and JPY
“The bottom line for the CAD for us is that the BoC’s tightening should support the CAD broadly – particularly against the likes of the EUR, GBP and JPY where policy tightening will lag.”
“Against the USD, more CAD-favourable short-term yield spreads should reinforce the cap on USD/CAD above 1.30 and potentially launch spot towards 1.28 in the next few weeks. CAD gains may be limited beyond that point for now as markets assess the peak in the rate cycle and the impact of tighter policy on the domestic economy.”
“External factors – the broader USD tone, the risk backdrop – may limit deeper USD/CAD losses for now.”
The USD/JPY pair has reached fresh multi-decade highs above 139.00. Economists at Credit Suisse expect USD/JPY to extend its race higher towards the 142.00 level.
USD/JPY to move towards 142 over the coming weeks
“One view that we are not inclined to change yet is our call for USD/JPY to test 142.00 in coming weeks. When we initially targeted this level, we were not expecting US yields to drop back as far as they have done in recent weeks. In that context, we are pleasantly surprised by how resilient USD/JPY has proved to be despite that retracement.”
“With our core logic for a bullish USD/JPY view having been the expectation that the Bank of Japan would hang tight with its current stance, we see no reason to shift position after these events gave new reasons to hold that view.”
- EUR/JPY adds to the weekly rebound beyond the 139.00 mark.
- Further gains look likely above the resistance line near 140.30.
EUR/JPY adds to Wednesday’s uptick and regains the 139.00 hurdle and beyond on Thursday.
Further upside should surpass the 4-month resistance line around 140.30 to allow for the continuation of the recovery to, initially, the weekly high at 142.37 (July 5). Beyond the latter, the cross could attempt a visit to the 2022 top at 144.27 (June 28).
In the longer run, the constructive stance in the cross remains well propped up by the 200-day SMA at 133.26.
EUR/JPY daily chart
- USD/JPY caught aggressive bids and surged past the 139.00 mark, to a fresh 24-year high.
- Rising bets for a supersized Fed rate hike in July boosted the USD and remained supportive.
- The prevalent risk-off mood offered some support to the safe-haven JPY and capped gains.
The USD/JPY pair stalled its strong intraday positive move near the 139.35-139.40 region and retreated a few pips from a new 24-year high touched earlier this Thursday. The pair was last seen trading just below the 139.00 mark, still up over 1% for the day.
The US dollar resumed its relentless rise and climbed to a fresh two-decade high, which, in turn, was seen as a key factor that provided a strong boost to the USD/JPY pair. The red-hot US consumer inflation figures released on Wednesday reaffirmed bets that the Fed would stick to its faster policy tightening path. In fact, the markets have now started pricing in the possibility of a supersized, historic 100 bps rate hike move on July 27.
Hawkish Fed expectations kept the US Treasury bond yields elevated and continued acting as a tailwind for the greenback. In contrast, the Bank of Japan has promised to conduct unlimited bond purchase operations to defend its near-zero target for 10-year yields. This has resulted in a further widening of the US-Japan yield differential, which continued weighing on the Japanese yen and lifted the USD/JPY pair beyond the 139.00 mark.
That said, an extended selloff in the equity markets offered some support to the safe-haven JPY and held back bulls from placing fresh bets around the USD/JPY pair. This, in turn, was seen as the only factor that led to an intraday pullback of over 50 pips amid slightly overbought RSI (14) on the daily chart. The downside, however, remains cushioned amid a big divergence in the monetary policy stance adopted by the Fed (hawkish) and the BoJ (dovish).
Market participants now look forward to the US US economic docket - featuring the release of the Producer Price Index and the usual Weekly Initial Jobless Claims. This, along with the US bond yields, will influence the USD price dynamics later during the early North American session. Apart from this, the broader market risk sentiment will drive demand for the safe-haven JPY and produce short-term trading opportunities around the USD/JPY pair.
Technical levels to watch
Economist at UOB Group Ho Woei Chen, CFA, assesses the latest trade balance figures in China.
Key Takeaways
“The lifting of COVID-19 lockdowns in Shanghai further boosted China’s exports in Jun but imports grew at a slower than expected pace which raised concerns of weaker domestic demand. China’s imports remained weighed down by weaker domestic demand for planes, motor vehicles, vegetable oil, iron ore and steel products, and mechanical & electrical products.”
“As a result, trade surplus surged to record high at US$97.94 bn from US$78.76 bn in May.”
“In the first half of 2022, export and import were up 14.2% y/y and 5.7% y/y respectively. Looking ahead, global demand could be sapped by tightening monetary policy, high inflation and increasing uncertainties. Meanwhile, domestic COVID-19 resurgence could pose disruption to China’s trade flows but we think the worst could be over as the government looks for a more balanced approach to manage economic and health risks from COVID-19.”
“Given the high comparison base in 2021 when China’s export and import rose 29.9% and 30.1% respectively, we expect a more moderate growth of 10-12% for export and around 5% for import this year.”
- Gold Price remains overwhelmed by markets’ pricing in of a 1% July Fed rate hike.
- US dollar is a clear winner, benefiting from risk-off flows and firmer yields.
- XAUUSD downside to accelerate on a break below the key $1,703 level.
Gold Price loses its shine once again, as aggressive Fed tightening bets bump up following the hotter-than-expected US inflation data. According to the CME FedWatch Tool, markets are pricing in a nearly 80% probability of a full percentage-point rise at the coming meeting. The Fed’s ‘front-loading’ commitment may not go down too well for the market, as a recession looks imminent. Against this backdrop, the US dollar is likely to remain in a win-win situation, as a flight to safety mode could boost its haven demand. Investors also remain unnerved, with the US earnings season kicking off and ahead of Friday’s release of the Fed’s most closely watched inflation gauge – the Index of Common Inflation Expectations (CIE). The Fedspeak will also grab attention, as the ‘blackout period begins from next week.
Also read: Gold Price Forecast: For how long can XAUUSD defend $1,700?
Gold Price: Key levels to watch
The Technical Confluence Detector shows that Gold Price has resumed its downward spiral, looking to take out the strong support around $1,714, which is the convergence of the pivot point one-day S1 and the previous low four-hour.
The next critical downside target is envisioned at $1,711, where the Bollinger Band one-day Lower meets with the pivot point one-week S1. Further south, the previous day’s low of $1,707 will be attacked.
Failure to resist above the latter will put the final line of defense at $1,703 under threat.
Alternatively, if the Fibonacci 61.8% one-day resistance at $1,722 holds the fort, it will pose a nightmare for XAU bulls to initiate any meaningful recovery towards a dense cluster of upside hurdles placed around $1,731.
At that level, the Fibonacci 38.2% one-day, SMA5 four-hour and the previous week’s low coincide.
The previous high four-hour at $1,737 will be back on buyers’ radars.
The next stop for bulls is seen at the Fibonacci 38.2% one-day at $1,744. The Fibonacci 23.6% one-week at $1,750 will guard the further upside, a failure of which will challenge the convergence of the pivot point one-month S2 and pivot point one-day 1 at $1,753.
Here is how it looks on the tool
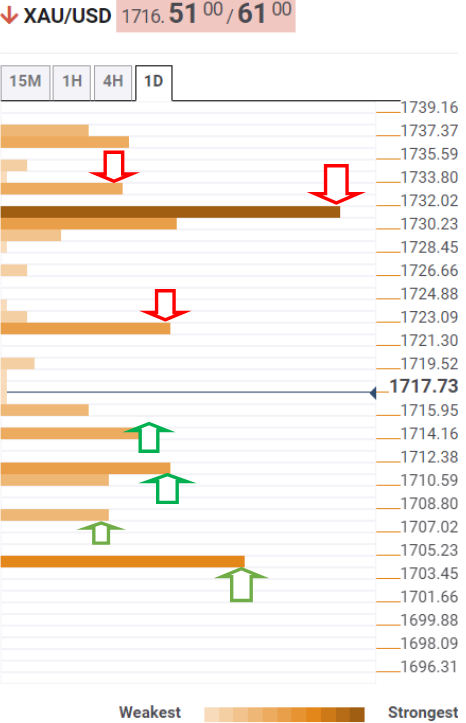
About Technical Confluences Detector
The TCD (Technical Confluences Detector) is a tool to locate and point out those price levels where there is a congestion of indicators, moving averages, Fibonacci levels, Pivot Points, etc. If you are a short-term trader, you will find entry points for counter-trend strategies and hunt a few points at a time. If you are a medium-to-long-term trader, this tool will allow you to know in advance the price levels where a medium-to-long-term trend may stop and rest, where to unwind positions, or where to increase your position size.
- Silver once again failed near the $19.50 supply zone and edged lower on Thursday.
- The formation of a rectangle could be categorized as a bearish consolidation phase.
- Oversold RSI on the daily chart warrants caution before placing fresh bearish bets.
Silver struggled to capitalize on the overnight positive move from the vicinity of a two-year low and attracted fresh selling near the $19.45-$19.50 region. The intraday slide extended through the first half of the European session and dragged spot prices back below the $19.00 round-figure mark.
Looking at the broader picture, the recent range-bound price action witnessed over the past one-and-a-half week or so constitutes the formation of a rectangle. This points to indecision over the next leg of a directional move for the XAG/USD and warrants caution before placing fresh directional bets.
Given the recent decline from mid-$22.00 or June monthly high, the rectangle could be categorized as a bearish consolidation phase and supports prospects for an extension near-term depreciating move. That said, the oversold RSI (14) on the daily chart could hold back bearish traders on the sidelines.
Nevertheless, acceptance below the $19.00 round-figure mark validates the negative outlook. Some follow-through selling below the $18.75 area, or a two-year low, would make the XAG/USD vulnerable to accelerate the downward trajectory towards the $18.00 en-route the $17.65 support zone.
On the flip side, the top boundary of the aforementioned trading range, around the $19.50-$19.55 area, might continue to act as an immediate strong barrier hurdle. Any subsequent move up is more likely to meet with a fresh supply and run out of steam just ahead of the $20.00 psychological mark.
That said, a sustained move beyond the latter might trigger a short-covering move and allow the XAG/USD to surpass an intermediate barrier near the $20.60-$20.65 region, which coincides with the 100-period SMA on the 4-hour chart. The recovery could further get extended towards the $21.00 mark.
Silver 4-hour chart
-637933889911317743.png)
Key levels to watch
- EUR/USD returns to the negative territory and approaches parity… again.
- The European Commission released its Economic Forecasts.
- Across the pond, Initial Claims and Producer Prices will take centre stage.
Sellers return to the single currency and drag EUR/USD back to the proximity of the parity level on Thursday.
EUR/USD weaker on USD-buying, recession talks
EUR/USD’s “dead cat bounce” on Wednesday ran out of steam around 1.0120, prompting sellers to eventually return to the market and expose the pair to keep challenging the key parity zone.
Indeed, the higher-than-expected US inflation figures on Wednesday prompted investors to start pricing in a probable 100 bps rate hike at the FOMC event in late July, which morphed into fresh oxygen to both the buck and US yields.
According to CME Group’s FedWatch Tool, the probability of a full point raise at the July 27 gathering is now at around 76% from just near 7% a month ago. A 75 bps hike sees its chances reduced to nearly 24% so far.
In the domestic calendar, the updated Economic Forecasts from the European Commission now sees the euro area expanding 2.6% this year (from 2.7%) and 1.4% in 2023 (from 2.3%). Inflation, in the meantime, is expected at 7.6% in 2022 and 4.0% in the next year, up from 6.1% and 2.7%, respectively.
Later in the NA session, Initial Claims are due seconded by Producer Prices.
What to look for around EUR
Bears maintain the EUR/USD under heavy pressure and the acceleration of the downside should open the door to another potential breach of the parity level any time soon.
In the meantime, the price action around the single currency continues to follow increasing speculation of a probable recession in the euro area, dollar dynamics, geopolitical concerns, fragmentation worries and the Fed-ECB divergence.
Key events in the euro area this week: EMU Balance of Trade (Friday).
Eminent issues on the back boiler: Fragmentation risks. Kickstart of the ECB hiking cycle in July? Asymmetric economic recovery post-pandemic in the euro bloc. Impact of the war in Ukraine on the region’s growth prospects and inflation.
EUR/USD levels to watch
So far, spot is down 0.28% at 1.0024 and faces the next contention at 1.9997 (2022 low July 13) seconded by 0.9859 (low December 2002) and finally 0.9685 (low October 2002). On the upside, a breakout of 1.0498 (55-day SMA) would target 1.0615 (weekly high June 27) en route to 1.0773 (monthly high June 9).
- A combination of factors assisted USD/CAD to regain strong positive traction on Thursday.
- Aggressive Fed rate hike bets, recession fears lifted the greenback to a fresh 20-year high.
- A slump in crude oil prices undermined the loonie and contributed to the strong move up.
The USD/CAD pair regained positive traction on Thursday and reversed the overnight losses that followed the Bank of Canada policy decision. The intraday buying picked up pace during the first half of the European session and lifted spot prices to over a one-week high, back above mid-1.3000s.
The market reaction to the BoC's surprise move to hike interest rates by 100 bps turned out to be short-lived amid the relentless US dollar buying, bolstered by hawkish Fed expectations. Wednesday's red-hot US consumer inflation figures cemented the case for a more aggressive policy tightening by the Fed. In fact, the markets have now started pricing in the possibility of a historic 100 bps rate hike move later this month.
The prospects for further interest rate hikes, along with the ongoing Russia-Ukraine war and fresh COVID-19 curbs in China, have been fueling fears about global recessions. This continued weighing on investors' sentiment, which was evident from an extended selloff in the equity markets. The anti-risk flow was seen as another factor that boosted the greenback's safe-haven status and pushed it to a fresh two-decade high.
The worsening global economic outlook has raised concerns about the fuel demand outlook and dragged crude oil prices to a fresh multi-month low. This, in turn, undermined the commodity-linked loonie and further contributed to the USD/CAD pair's strong intraday positive move. Bulls now await sustained strength beyond the 1.3080-1.3085 supply zone, or the YTD peak, before positioning for a further near-term appreciating move.
Technical levels to watch
In its quarterly publication released on Thursday, the European Commission cut its forecasts for the euro area economic growth for 2022 while upgrading its estimates for inflation, in the face of the Russia-Ukraine war.
Key takeaways
EU Commission expects GDP growth of 2.6% in euro area in 2022, down from 2.7% in previous outlook.
Expects GDP growth of 1.4% in euro area in 2023, down from 2.3% in previous outlook.
Expects euro area inflation of 7.6% in 2022, up from 6.1% in previous outlook.
Expects euro area inflation of 4.0% in 2023, up from 2.7% in previous outlook.
Expects German GDP growth of 1.4% in 2022, down from 1.6% in previous outlook.
Expects German GDP growth of 1.3% in 2023, down from 2.4% in previous outlook.
Expects German inflation of 7.9% in 2022, up from 6.5% in previous outlook.
Expects German inflation of 4.8% in 2023, up from 3.1% in previous outlook.
Expects French GDP growth of 2.4% in 2022, down from 3.1% in previous outlook.
Expects French GDP growth of 1.4% in 2023, down from 1.8% in previous outlook.
Expects French inflation of 5.9% in 2022, up from 4.9% in previous outlook.
Expects French inflation of 4.1% in 2023, up from 3.1% in previous outlook.
Expects GDP growth of 2.7% in EU in 2022, unchanged from previous outlook.
Expects GDP growth of 1.5% in EU in 2023, down from 2.3% in previous outlook.
Expects Italian GDP growth of 2.9% in 2022 and 0.9% in 2023, vs 2.4% and 1.9% in previous outlook.
Market reaction
The quarterly forecasts have little to no impact on the shared currency, as EUR/USD continues to gyrate above parity so far this Thursday.
At the time of writing, the pair is trading at 1.0022, down 0.37% on a daily basis.
British former finance minister and Conservative Party’s leadership candidate Rishi Sunak said on Thursday, “I think our no.1 economic priority is to tackle inflation.”
Additional quotes
I will get taxes down but I will do responsibly.
We will do tax cuts in a measured way.
Yes, I will keep Rwanda deportation plan.
We are going to make sure that the Rwanda plan works.
Market reaction
GBP/USD was last seen trading down 0.35% on the day at 1.1845, undermined by a broad strong US dollar on aggressive Fed tightening expectations.
According to FX Strategists at UOB Group Lee Sue Ann and Quek Ser Leang, USD/CNH could attempt some consolidation ahead of the probable resumption of the upside.
Key Quotes
24-hour view: “We expected USD to ‘trade between 6.7260 and 6.7500’ yesterday. During NY session, USD popped to a high of 6.7480, dropped sharply to 6.7100 before rebounding to close at 6.7253 (-0.19%). The outlook is mixed and further choppy movement is not ruled out, likely between 6.7130 and 6.7430.”
Next 1-3 weeks: “We turned positive USD on Tuesday (12 Jul, spot at 6.7255). Yesterday (13 Jul, spot at 6.7400), we highlighted that USD could consolidate for 1 to 2 days first before moving higher to 6.7700. USD subsequently traded in choppy manner between 6.7100 and 6.7480. While there is no change in our view, the odds for USD to advance to 6.7700 have diminished. From here, a break of 6.7050 (no change in ‘strong support’ level from yesterday) would indicate that USD is not ready to rise to 6.7700.”
- USD/CHF caught fresh bids on Thursday and climbed back closer to a multi-week high.
- Aggressive Fed rate hike bets continued underpinning the USD and remained supportive.
- Investors now look forward to the US PPI and Jobless Claims for a fresh trading impetus.
The USD/CHF pair regained strong positive traction on Thursday and build on the previous day's late bounce from the weekly low, around the 0.9755 area. The momentum extended through the early European session and lifted spot prices above mid-0.9800s, back closer to a multi-week high touched on Tuesday.
The US dollar was back in demand and stood tall near a 20-year high amid the prospects for a more aggressive policy tightening by the Fed, which, in turn, provided a fresh lift to the USD/CHF pair. In fact, the red-hot US consumer inflation, which accelerated to the highest level since 1981, sealed the case for another supersized Fed rate hike move later this month.
Adding to this, Atlanta Fed President Raphael Bostic said that everything is in play to curb rising inflationary pressures. The markets were quick to react and started pricing in the possibility of a historic 100 bps rate hike at the upcoming FOMC meeting. This was seen as a key factor that continued underpinning the greenback and acted as a tailwind for the USD/CHF pair.
Meanwhile, the rapidly rising interest rates, along with the ongoing Russia-Ukraine war and fresh COVID-19 curbs in China, have been fueling fears about a possible recession. This further boosted the greenback's status as the global reserve currency and contributed to the USD/CHF pair's strong intraday gains, setting the stage for a further near-term appreciating move.
With the USD price dynamics turning out to be an exclusive driver, traders now look forward to the US economic docket - featuring the release of the Producer Price Index and Weekly Jobless Claims. The data might provide short-term impetus, though the fundamental backdrop seems tilted firmly in favour of bullish traders and supports prospects for additional gains.
Technical levels to watch
- The index fades the recent weakness and clinches new 2022 peaks.
- US yields show some signs of recovery across the curve.
- Weekly Claims, Producer Prices next on tap in the US docket.
The greenback, in terms of the US Dollar Index (DXY), leaves behind two consecutive daily drops and advances to new cycle tops past 108.60 on Thursday.
US Dollar Index looks stronger post-CPI
The index resumes the upside following a brief correction and trades in fresh peaks beyond 108.60, an area las visited in October 2002.
The move higher in the dollar appears to be supported by renewed speculation of a full-point interest rate hike at the next Fed gathering on July 27. This view was particularly exacerbated after the US inflation rose more than estimated in June, running at new 40-year highs beyond 9% YoY.
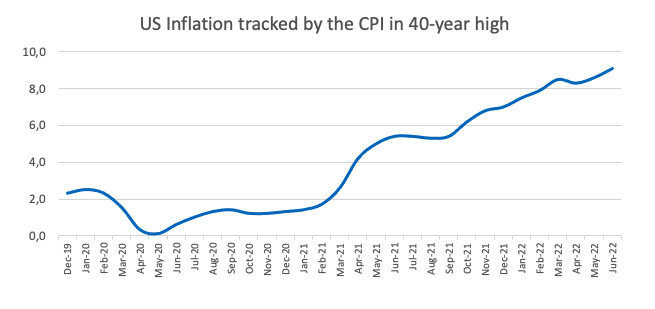
Further tailwinds for the greenback come, as usual, from the unabated weakness in the risk complex, which in turn appears reinvigorated by the likelihood of a recession in the euro area amidst the persevering energy crunch.
In the US docket, June Producer Prices are due along with the usual weekly Claims. In addition, the Fed’s black-out period kicks in today.
What to look for around USD
The index pushed higher and clinched new cycle highs past 108.60 on Thursday. It is worth noting, however, that the recent sharp move in the dollar comes largely in response to the accelerated decline in the euro and persistent uncertainty around a potential recession in the old continent.
Further support for the dollar is expected to come from the Fed’s divergence vs. most of its G10 peers (especially the ECB) in combination with bouts of geopolitical effervescence and the re-emergence of the risk aversion among investors. On the flip side, market chatter of a potential US recession could temporarily undermine the uptrend trajectory of the dollar somewhat.
Key events in the US this week: Producer Prices, Initial Claims (Thursday) – Retail Sales, Industrial Production, Flash Consumer Sentiment, Business Inventories (Friday).
Eminent issues on the back boiler: Hard/soft/softish? landing of the US economy. Escalating geopolitical effervescence vs. Russia and China. Fed’s more aggressive rate path this year and 2023. US-China trade conflict. Future of Biden’s Build Back Better plan.
US Dollar Index relevant levels
Now, the index is up 0.45% at 108.50 and a break above 108.63 (2022 high July 14) would expose 108.74 (monthly high October 2002) and then 109.00 (round level). On the flip side, the next support aligns at 103.67 (weekly low June 27) seconded by 103.41 (weekly low June 16) and finally 101.29 (monthly low May 30).
The uncertainty over the continuation of Russian gas deliveries is clouding the economic outlook considerably heading into the second half of the year," German Economy Minister Robert Habeck said on Thursday, as reported by Reuters.
"The German economy had a strong first half of the year despite the Ukraine war," Habeck added.
Market reaction
These comments don't seem to be having a significant impact on risk sentiment. As of writing, Germany's DAX 30 Index was down 0.3% on a daily basis. Meanwhile, EUR/USD continues to trade in negative territory near 1.0030.
The Monetary Authority of Singapore (MAS) added fuel to the volatility with another surprising aggressive policy tightening. USD/SGD fell sharply post-announcement but the Fed and the USD will remain the key drivers and the bias is still to the upside to year-end, economists at Commerzbank report.
Another surprising tightening
“MAS raised the mid-point of the SGD NEER to the prevailing level. It was the second off-cycle announcement and the second one-off appreciation in the SGD NEER. It highlights continued concerns over inflation and the urgency to prevent a wage-price spiral. This is particularly given rising wages pressures and the tight labour market despite the easing in border controls post-covid. Q2 GDP grew 4.8% yoy from 4% in Q1.”
“Looking into next year, the Fed Fund Futures are pricing in a 50 bps rate cut by end-2023. This could provide some reprieve for SGD and Asian currencies in general. At the same time, however, it may be premature to expect smooth sailing for Asian currencies in 2023. They would have to contend with a less favourable and slowing global growth. Under these circumstances, we could continue to see SGD outperform the region given its sound fundamentals and its safe-haven status.
“Near term, we could see USD/SGD head towards the 1.43-1.45 area by year-end before pulling back as recession fears in the US kick in and supersede rate hike expectations.”
Also read: USD/SGD should revisit the 1.41 handle soon – TDS
US Treasury Secretary Janet Yellen said on Thursday that inflation in the US remains unacceptably high and added that bringing it down is US President Joe Biden administration's top priority, as reported by Reuters.
Additional takeaways
"Russia's war in Ukraine causing negative spillover effects around the world, particularly on higher energy prices and rising food insecurity."
"International community must be clear-eyed in holding Russian President Putin accountable for global economic and humanitarian consequences of war in Ukraine."
"Representatives of Putin regime have no place at G20 forum."
"Price cap on Russian oil would limit revenues for Putin's war machine, help maintain global oil supply."
Market reaction
These comments don't seem to be having a noticeable impact on the greenback's performance against its rivals. As of writing, the US Dollar Index was up 0.45% on the day at 108.50.
- AUD/USD gained some traction on Thursday in reaction to a stellar Australian jobs report.
- Aggressive Fed rate hike bets lifted the USD to a 20-year high and capped gains for the pair.
- Recession fears continued weighing on investors’ sentiment and the risk-sensitive aussie.
The AUD/USD pair struggled to capitalize on its modest bounce on Wednesday and seesawed between tepid gains/minor losses through the early European session. The pair was last seen trading in neutral territory, around the 0.6765-0.6770 region, and remains at the mercy of the US dollar price dynamics.
The Australian dollar got a minor lift following the release of the stellar domestic jobs report, which showed that the unemployment rate dropped to the lowest level in almost 50 years. The data bolstered the case for a supersized interest rate hike by the Reserve Bank of Australia (RBA) at its next policy meeting in August. The intraday uptick, however, lacked bullish conviction amid the emergence of fresh US dollar buying.
In fact, the USD Index climbed to a fresh 20-year high and continued drawing support from the prospects for a more aggressive policy tightening by the Fed. The red-hot US consumer inflation figures released on Wednesday reinforced bets for another large interest rate hike by the Federal Reserve. Adding to this, Atlanta Fed President Raphael Bostic said that everything is in play to combat persistently rising inflation pressures.
The markets were quick to react and started pricing in the possibility of a historic 100 bps Fed rate hike move later this month. This, in turn, kept the US Treasury bond yields elevated and continued underpinning the buck. This, along with growing fears about a possible global recession and the prevalent risk-off environment, benefitted the safe-haven greenback and acted as a headwind for the risk-sensitive aussie.
Even from a technical perspective, the AUD/USD pair, so far, has struggled to capitalize on its bounce from the vicinity of the 0.6700 mark or the lowest level since June 2020. Furthermore, the recent leg down has been along a downward sloping channel, which points to a well-established short-term bearish trend. This makes it prudent to wait for strong follow-through buying before positioning for any meaningful recovery move.
Technical levels to watch
USD/SGD fell by 1% to 1.3940 after the surprise tightening announcement by The Monetary Authority of Singapore (MAS). Still, economists at TD Securities think it is an uphill task for SGD to strengthen against the USD and expect the pair to edge higher towards 1.41.
Another off-cycle move by the MAS
“The MAS recentred the midpoint of the SGD NEER (S$NEER) policy band up to its prevailing level but there was no change to the slope and width of the S$NEER band.”
“With core inflation not expected to return below its medium-term average of 2% this year and inflation risks leaning to the upside, we expect MAS to tighten monetary policy settings again at the upcoming October meeting.”
“Despite a stronger S$NEER, we think it is an uphill task for the SGD to strengthen against the USD and expect USD/SGD to revisit 1.41 amid broad USD strength in the near-term.”
USD/CAD is trading slightly above the 1.30 level. Economists at Rabobank note that a break above 1.3070 would open up a move to 1.32.
Key levels for USD/CAD remain 1.2860 and 1.3070
“We expect the USD/CAD pair to primarily trade around the 1.30 handle in the coming weeks but we are of course seeing heightened volatility across asset classes. That said, we expect continued demand for USD and a reversal of the recent oil sell-off will keep the pair relatively well trapped.
“A confirmed close below the 1.2860 support level will nullify the recent bull trend, while a confirmed close above resistance at 1.3070 would likely usher in a test of 1.32 in short order.”
EUR/USD is trading at 1.0023 at the time of writing. A more decisive break below parity is possible, economists at ING report.
0.98-0.99 seen as a potential short-term bottom
“The potential re-pricing higher in Fed rate expectations is another element of downside risk for EUR/USD, along with the already negative macro picture and the growing risk premium related to the Russia-EU spat on gas supply.
“Another attempt at breaking below 1.00 appears likely over the coming sessions, and this time we could see a more decisive move lower.”
“We continue to see 0.98-0.99 as a potential short-term bottom for EUR/USD.”
After the Bank of Canada's unexpected decision to raise its policy rate by 100 basis points, USD/CAD dipped below 1.2950 in the American session on Wednesday but recovered above 1.30 early Thursday. Economists at ING expect the loonie to struggle to gain some ground in the near-term.
Chances of USD/CAD moving back below 1.25 by year-end have risen
“We think that the BoC’s faster hiking could help the currency in the longer run but for now, external factors (eg, global risk sentiment, oil prices) continue to play a much bigger role and may keep CAD gains capped in the near-term.”
“However, with CAD now sharing the highest policy rate in the G10 (2.50%) with the New Zealand dollar, and still counting on a decent economic outlook thanks to positive commodity exposure, the chances of USD/CAD moving back below 1.25 by year-end (barring a prolonged USD strength) have risen.”
After markets suffered their worst first-half-year performance in decades, stocks have bounced on hopes the Fed may ease up on monetary tightening. See three reasons why this could be wishful thinking, according to economists at Morgan Stanley.
Inflation is far from being tamed
Granted, supply chains may be clearing, and energy prices are dropping. But this is partly the result of short-term fixes, such as added supply from strategic oil reserves, which could be offset quickly. In addition, even if energy-related inflation does cool, overall US inflation may be slower to fall given that a significant portion of it is linked to the fast-recovering services sector, where prices for items like rent and medical services may remain stubbornly high.”
The Fed’s policy rate still has room to rise
“Currently inflation is 8.6%, per the consumer price index, and 5.2%, per the Fed’s preferred personal consumption expenditures gauge. At this pace, we would need to see genuine damage to the labor market before the Fed would change course. And, as evidenced by June’s job report, the market remains robust.”
Consumer and corporate spending outlooks are strong
“Though consumer confidence and CEO sentiment are weak, consumer behavior has not changed. Households’ cash and money market deposits, estimated at about $2.3 trillion, could cushion balance sheets and consumption. In addition, corporate capital-spending intentions have remained strong, durable goods orders have continued to beat expectations, and housing-sector activity levels are nowhere near recessionary. Such economic resilience would likely suggest the Fed’s current hawkish path can continue.”
Current recession risks rising from Russian gas flow uncertainty are weighing on the euro. It is trading at parity vs USD. The risk of the euro falling sharply below parity cannot be ruled out, according to economists at ANZ Bank.
Growth risks are skewed to the downside
“If worst-case fears over gas supplies eventuate, the risk of a sharp move below parity cannot be ruled out.”
“Energy uncertainty is complicating the ECB’s planned monetary normalisation. Growth risks are skewed to the downside as winter approaches, and higher energy costs are driving inflation to record highs (HICP 8.6% YoY).”
“Uncertainty is fostering a hesitant approach at the ECB, which is in sharp contrast to the Fed’s hawkishness. Differing policy guidance and reaction functions are driving a policy wedge between the US and the EU and contributing to euro weakness.”
The US Dollar Index gathered bullish momentum early Thursday and started to push higher toward multi-decade tops above 108.50. The next target aligns at the 111 area, economists at Westpac reprot.
Yield spreads could boost the USD to fresh 20-year highs
“A clear break above 108 would technically signal a move to 111.”
“Yield spreads have been a major source of support for the USD during the past 18 months. With the ECB likely to deliver an underwhelming 25 bps next week, the DXY index is set to make a fresh 20-year high.”
How to hedge against the risk of headline or core inflation? Analysts at Natixis look at equities, residential real estate and commodities to see which asset classes provide a hedge against the risk of headline or core inflation.
Equities and real estate provide a weak hedge against inflation
“We see a low correlation between headline and core inflation and equities in the US; No hedge against headline or core inflation by equities in the eurozone.”
“Residential real estate provides a weak hedge against headline and core inflation in the US, and a weak hedge against headline inflation only in the eurozone.”
“In the US, oil, non-precious metals and agricultural commodities provide a good hedge against headline and core inflation; In the eurozone, oil and non-precious metals provide a good hedge against headline inflation alone; agricultural commodities provide a good hedge against both headline and core inflation.”
- GBP/USD met with a fresh supply on Thursday and dropped back closer to the YTD low.
- Aggressive Fed rate hike bets, recession fears underpinned the USD and exerted pressure.
- Brexit woes continued acting as a headwind for sterling and contributed to the selling bias.
The GBP/USD pair came under some renewed selling pressure on Thursday and remained on the defensive through the early European session. The pair was last seen trading around the 1.1850-1.1845 region, just a few pips above its lowest level since March 2020 touched earlier this week.
The US dollar was back in demand and climbed to a fresh two-decade high amid the prospects for a more aggressive policy tightening by the Fed, which, in turn, exerted downward pressure on the GBP/USD pair. The red-hot US consumer inflation, which accelerated to the highest level since November 1981, cemented the case for another large interest rate hike by the Federal Reserve.
Furthermore, Atlanta Fed President Raphael Bostic said that everything is in play to curb rising inflationary pressures and lifted bets for a historic 100 bps Fed rate hike move in July. Apart from this, growing fears about a possible global recession turned out to be another factor that continued benefitting the greenback's relative safe-haven status against its British counterpart.
Investors remain concerned that rapidly rising interest rates, the ongoing Russia-Ukraine war and fresh COVID-19 curbs in China would pose challenges to global economic growth. This, along with worries that the UK government's controversial Northern Ireland Protocol Bill could trigger a trade war with the European Union, overshadowed the upbeat UK macro data released on Wednesday.
The combination of the aforementioned factors exerted downward pressure on the GBP/USD pair and supports prospects for a further near-term depreciating move. The negative outlook is reinforced by the fact that spot prices have been trending lower along a downward-sloping channel over the past two-and-half weeks or so. This points to a well-established short-term bearish trend.
A convincing breakthrough below the 1.1800 round-figure mark or the YTD low touched on Tuesday, will reaffirm the bearish bias and make the GBP/USD pair vulnerable. Bears might then aim to challenge the lower boundary of the descending trend channel, currently around the 1.1710-1.1700 region, which could act as a near-term base for spot prices.
Technical levels to watch
Further upside in USD/JPY could reach the 138.00 area and beyond in the short term, commented FX Strategists at UOB Group Lee Sue Ann and Quek Ser Leang.
Key Quotes
24-hour view: “We expected USD to ‘trade between 136.50 and 137.50’ yesterday. Our expectations were incorrect as USD soared to a fresh high of 137.86 before closing on a firm note at 137.42 (+0.41%). Despite the advance, upward momentum has not improved by much. That said, USD could edge higher but a sustained rise above 1.38.00 is unlikely for today (next resistance is at 138.50). Support is at 137.30 followed by 137.00.”
Next 1-3 weeks: “There is no change in our view from two days (12 Jul, spot at 137.20). As highlighted, the risk for USD has shifted to the upside and USD could advance further to 138.00, as high as 138.50. All in, only a break of 136.30 (no change in ‘strong support’ level from yesterday) would invalidate our view for a higher USD.”
Here is what you need to know on Thursdayednesday, July 14:
Following Wednesday's volatile action, the US Dollar Index gathered bullish momentum early Thursday and started to push higher toward multi-decade tops above 108.50. Safe-haven flows and hawkish Fed bets fuel the dollar's rally in the second half of the week as focus shifts to weekly Initial Jobless Claims and Producer Price Index (PPI) data from inflation. The European Commission will release its Economic Growth Forecasts during the European trading hours as well.
On Wednesday, the US Bureau of Labor Statistics reported that inflation in the US, as measured by the Consumer Price Index (CPI), jumped to 9.1% on a yearly basis in June from 8.6% in May. Although the greenback initially struggled to capitalize on hot inflation data, market pricing of the Fed's rate outlook triggered provided a boost to the currency. According to the CME Group FedWatch Tool, there is now a 75% probability of the Fed hiking its policy rate by a total of 175 basis points in the next two meetings.
The Bank of Canada's unexpected decision to raise its policy rate by 100 basis points also seems to be ramping up Fed rate hike bets. Commenting on the policy outlook, "front-loading rate increases now helps avoid the need for even higher interest rates down the road," BOC Governor Tiff Macklem said. After having dipped below 1.2950 in the American session on Wednesday, USD/CAD recovered above 1.3000 early Thursday. Later in the day, Statistics Canada will release Manufacturing Sales data for May.
Meanwhile, the data from Australia showed that Unemployment Rate declined to 3.5% in June with Employment Change arriving at 88.4K in the same period. Both of these figures came in much better than analysts' estimates and AUD/USD climbed toward 0.6800 during the Asian trading hours before erasing its daily gains amid renewed dollar strength.
EUR/USD advanced beyond 1.0100 in the second half of the day on Wednesday but retraced a large portion of its daily rebound to close little changed near 1.0050. With the dollar preserving its strength early Thursday, the pair turned south and started to edge lower toward all-important parity.
GBP/USD failed to gather recovery momentum and dropped below 1.1850 early Thursday with the dollar's valuation continuing to influence the pair's action.
The widening policy divergence between the Fed and the Bank of Japan continues to boost USD/JPY. The pair was last seen trading at fresh multi-decade highs near 139.00, rising 1% on the day.
Gold snapped a two-day losing streak on Wednesday as the benchmark 10-year US Treasury bond yield lost more than 1%. The broad-based dollar strength, however, forced XAUUSD to reverse its direction and the pair was last seen testing $1,720.
Bitcoin recovered modestly on Wednesday but trades within a touching distance of $20,000 on early Thursday. Ethereum rose more than 7% after having tested $1,000 on Wednesday. ETH/USD stays on the back foot in the European morning and falls more than 1% at $1,100.
- USD/JPY stays on the front foot at the highest levels since September 1998.
- US inflation propels hawkish Fed bets, yield curve inversion amplifies recession woes.
- Japan policymaker showed concerns over the weakening yen but talks down intervention.
- US PPI, risk catalysts will be important for intraday directions.
USD/JPY takes the bids around 138.77 to refresh the 23-year high during the early Thursday morning in Europe. The yen pair’s latest run-up could be linked to the firmer US Treasury yields and the US dollar amid hopes of the Fed’s aggression after witnessing the multi-year high inflation data.
The US 10-year Treasury yields rose three basis points (bps) to 2.93% at the latest while the S&P 500 Futures drop 0.50% to portray the risk-off mood by the press time. More importantly, the spread between the 2-year US Treasury yields and its 10-year counterpart widens and in turn portrays the market’s fears of economic slowdown. The yield curve inversion, the condition of higher short-term rates, hints at the investors’ rush for risk safety.
The yield curve inversion magnified the previous day after the US Consumer Price Index (CPI) for June, jumped to the highest level in 40 years to 9.1% YoY versus 8.8% expected and 8.6% prior. That said, the Core CPI, which excludes volatile food and energy prices, eased to 5.9% from 6% prior but crossed analysts' forecast of 5.8%.
It should be noted that the multi-year high US inflation also fuelled the market’s bets for hawkish Fed actions in July. Reuters cites CME data to mention the USD/JPY bulls while saying, “They are now pricing in a nearly 80% probability of a full percentage-point rise at the coming meeting, according to an analysis of the contracts by CME Group,” said Reuters.
The hawkish Fed bets also gain support from the Fed policymakers as San Francisco Federal Reserve Bank President Mary Daly said that her most likely posture is a 75bp hike in July but a 100bp is possible, as reported by the New York Times. Before that, Richmond Federal Reserve President Thomas Barkin conveyed his support for higher rates in the last meeting while Cleveland Federal Reserve President Loretta Mester also said, “The data on CPI does not suggest a rate hike in July any smaller than that in June.” More recently, the Atlanta Fed President Raphael Bostic said “everything is in play” for policy action after data showed that US inflation accelerated again to a fresh four-decade high last month, as reported by Bloomberg.
On the other hand, Japanese Chief Cabinet Secretary Hirokazu Matsuno came out on the wires, via Reuters, attempting some verbal intervention as soon as the USD/JPY prices rose past 138.00. The policymaker said, “Watching FX market even more closely while working with BOJ.”
Looking forward, the Producer Price Index for June and the weekly Jobless Claims will decorate the calendar whereas the risk catalysts like recession fears and Fed bets could offer more details to forecasts short-term USD/JPY moves.
Technical analysis
USD/JPY bulls cheer a clear upside break of the three-week-old resistance line, now support around 137.60, to aim for the 140.00 threshold.
NZD/USD is grinding lower towards 0.60. Global risk sentiment and the strong USD continue to weigh on the kiwi, ecoomists at Westpac report.
NZ CPI next week could cause a minor bounce
“NZD/USD is grinding lower towards the 0.60 area, where we expect some congestion.”
“The main drivers of NZD/USD at present remain global risk sentiment and the US dollar, with both arguing for further NZD/USD downside during the week ahead at least.”
“NZ CPI data next week could follow the global script, and beat expectations, which would support the NZD on the day.”
The aussie printed fresh lows against the USD since June 2020 during the week but has performed well on most crosses. Booming jobs data fuels debate over the RBA hiking 75 bps in August, so outperformance on crosses can continue. However, global picture and mighty USD suggest risks still to 0.6670, according to economists at Westpac.
Australia’s domestic economy continues to provide support
“Business and consumer sentiment are down but hard data on retail spending and employment remain consistent with a strong rebound from covid lockdowns.”
“The unemployment rate is down to just 3.5%, fuelling debate over the Reserve Bank of Australia hiking 75 bps in August. So outperformance on crosses should continue, but the global picture and powerful USD suggest risks still to 0.6670.”
The eurozone economy faces a summer of energy discontent and with the Nord Stream pipeline closed for maintenance from July 11-21, the temperature may rise further. A sustained break below parity looks to be just a week or so away, in the view of economists at Westpac.
European Central Bank to begin the process of normalising policy
“Growth projections will also have been marked down materially. And depending on whether the Nord Stream pipeline returns at full capacity or not on the same day as the ECB meeting, could be downgraded even further.”
“Given the recent run of 100 bps shocks/unscheduled central bank moves, it is increasingly likely the ECB begins the process of normalising policy with a series of 50 bps moves, rather than a 25 bps opening salvo. However, this will arguably pale into insignificance versus what the Fed will deliver the following week with a likely 100 bps move July 28.”
“With the key 1.0340 level well and truly broken, a sustained break below parity looks to be just a week or so away.”
The Bank of Canada (BoC) surprised with a whopping 100 basis points rate hike to 2.5%. The loonie benefited against the USD, but gains were limited. Economists at Commerzbank expect the Canadian dollar to struggle to beat the US dollar.
BoC is giving absolute priority to fighting inflation
“The BoC raised its overnight rate yesterday by a whopping 100 bps to now 2.5%. In its statement, it explained that it was thereby front-loading interest rate hikes. In doing so, it wants to counter the risks of a wage-price spiral, and it signaled further interest rate hikes.”
“The interest rate decision, statement and monetary policy report underpin the fact that the BoC is giving absolute priority to fighting inflation and is willing to take rigorous measures. We expect further significant rate hikes.”
“ In addition to the risk-off mood in the markets, uncertainty about how high the BoC will push its key interest rate and whether a soft landing will be successful or whether a recession is imminent is likely to contribute to this.”
“The BoC's decisive action is likely to influence market expectations regarding other central banks, such as the US Federal Reserve in particular, it could fuel rate hike expectations and ultimately global recession fears. Against this backdrop, the loonie is likely to continue to find it difficult to gain significant ground for the time being.”
CME Group’s flash data for natural gas futures markets saw open interest extend the choppy activity and rise by around 3.8K contracts on Wednesday. Volume, on the flip side, shrank by around 61.5K contracts after two daily builds in a row.
Natural Gas: Upside looks capped by $7.00
Natural gas prices charted decent gains on Wednesday amidst rising open interest, which appears supportive of the continuation of the rebound. However, the moderate uptick in volume could slow the pace of the bounce or motivate some consolidation in the near term. So far, recent peaks near the $7.00 mark per MMBtu seem to cap the continuation of the uptrend for the time being.
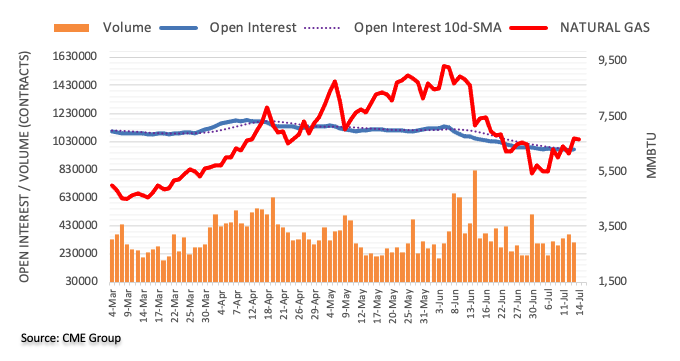
GBP/USD bears keep reins below 1.19. Given the strength of the US dollar’s momentum, support levels at 1.1777 and 1.1673 seem likely to be tested in the coming days, economists at Westpac report.
Tory leadership battle doesn’t help the mood
“There is at least a little breathing room for cable ahead of the March 2020 pandemic panic lows near 1.14.”
“Given the strength of the US dollar’s momentum, support levels at 1.1777 and 1.1673 seem likely to be tested in coming days, though a hawkish Bailey might lend some support.”
“Conservative Party MPs jostling to replace Boris Johnson as PM are happily pledging to cut taxes, which appears to be what Tory members want to hear. But with a budget deficit near -6%/GDP and little talk of substantial spending cuts, this is probably not boosting the confidence of international investors.”
Atlanta Fed President Raphael Bostic said “everything is in play” for policy action after data showed that US inflation accelerated again to a fresh four-decade high last month, as reported by Bloomberg.
Key quotes
“The top-line number is a source of concern,”
“Everything is in play.”
Asked if that included by raising rates by a full percentage point, he replied, “it would mean everything.”
“I am not wedded to any specific course of action. I’ll let the broad collected intelligence that we are gathering guide me in terms of what’s appropriate.”
“If the top-line number is driven by one or two factors that have outsized weight I might think of it differently than if it is broad-based.”
Lat Friday, he said that he is "fully supportive" of one more 75 basis points rate hike in July.
Market reaction
The US dollar index remains within a touching distance of the two-decade highs of 108.58, adding 0.46% on the day.
developing story ...
How long can inflation surprise on the upside? In the event the Federal Reserve cuts rates in order to fight inflation, the US dollar is unlikely to sustain a downmove, economists at Commerzbank report.
Exorbitant USD optimism would be inappropriate on high inflationary momentum despite US recession
“If the Fed is considering more aggressive interest rate moves despite the growing risk of recession in the US, this has a signaling effect. It signals that the Fed is prioritizing the fight against inflation. All of this presupposes, of course, that a US recession would actually be capable of breaking the inflation dynamic so significantly that interest rate cuts would then also be possible from an inflation-fighting perspective. If this were to happen (and this is implied by inflation expectations), Fed rate cuts would do little harm to the greenback.”
“If, contrary to market expectations, inflationary momentum were to remain at a higher level despite the US recession, the Fed would soon find itself in a similar conflict of objectives as the ECB would be in the event of a European gas crisis: torn between fighting inflation and fighting recession. Exorbitant USD optimism would then be inappropriate.”
- GBP/JPY grinds higher during the second positive daily performance of the week.
- Firmer RSI, a clear upside break of one-week-old trend line favor buyers.
- 200-SMA, three-week-long resistance line challenge short-term upside.
GBP/JPY picks up bids around 164.05 heading into Thursday’s London open. In doing so, the cross-currency pair crosses the one-week-old resistance line, now support, to lure the bulls.
In addition to the trend line breakout, the firmer RSI (14), not overbought, also keep GBP/JPY buyers hopeful.
That said, the 200-SMA surrounding 164.45 appears the immediate resistance for the pair traders to watch during the quote’s further upside.
Following that, a downward sloping trend line from June 21, close to 164.60, appears as the latest defense for GBP/JPY bears.
Alternatively, pullback remains elusive until the quote stays beyond the resistance-turned-support line near 163.85.
In a case where GBP/JPY declines below 163.85, the odds of witnessing the pair’s another fall towards one-week-old horizontal support near 161.80 can’t be ruled out.
However, a monthly support line near 160.55 and the 160.00 psychological magnet appear the key support for GBP/JPY bears to consider if the quote drops below 161.80.
GBP/JPY: Four-hour chart
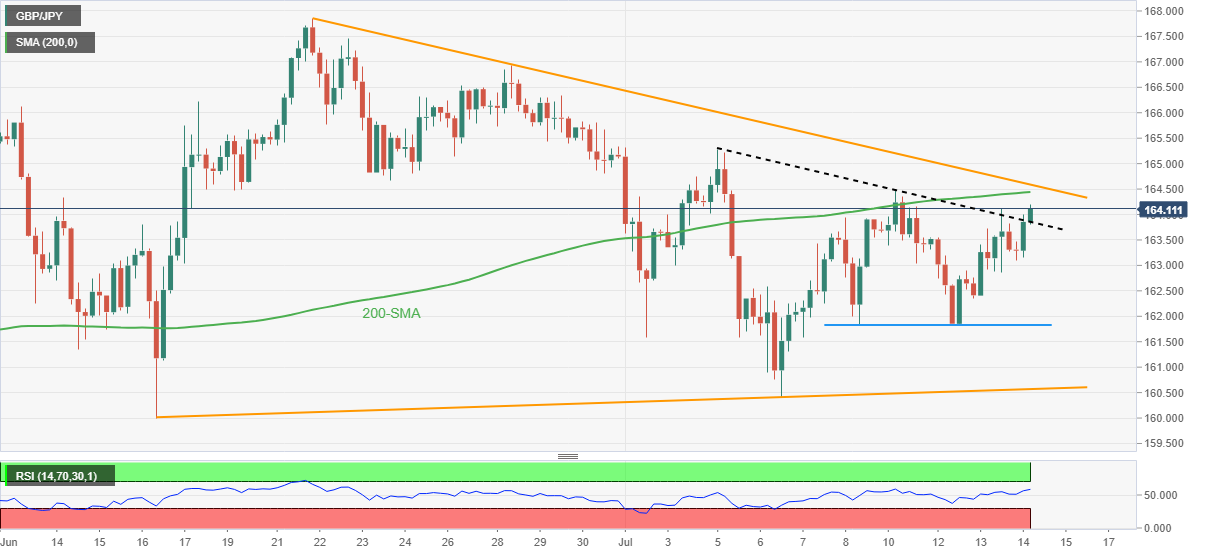
Trend: Further upside expected
FX option expiries for July 14 NY cut at 10:00 Eastern Time, via DTCC, can be found below.
- EUR/USD: EUR amounts
- 1.0000 (234m
- 1.0095-00 854m
- 1.0150-60 968m
- GBP/USD: GBP amounts
- 1.1700 488m
- 1.1820 616m
- USD/JPY: USD amounts
- 137.50 340m
- 137.75 350m
- 138.00 365m
- 139.00 1.48b
- USD/CHF: USD amounts
- 0.9735 250m
- 0.9780-90 910m
- 0.9825 380m
- 0.9850 225m
- AUD/USD: AUD amounts
- 0.6765 382m
- 0.6865-75 458m
- 0.6890-00 549m
- USD/CAD: USD amounts
- 1.2925 420m
- 1.2945 405m
- NZD/USD: NZD amounts
- 0.6090-00 1.03b
- 0.6120 1.33b
- EUR/CHF: EUR amounts
- 1.0020 400m
In the opinion of FX Strategists at UOB Group Lee Sue Ann and Quek Ser Leang, NZD/USD still faces a probable drop to the mid-0.6000s in the next few weeks.
Key Quotes
24-hour view: “Yesterday, we expected NZD to ‘trade between 0.6100 and 0.6155’. We did not expect the spike in volatility as NZD plunged to 0.6081, snapped up to a high of 0.6171 before dropping back down. The whippy price actions have resulted in a mixed outlook. Further choppy price actions are not ruled out, likely between 0.6080 and 0.6160.”
Next 1-3 weeks: “There is not much to add to our update from Tuesday (12 Jul, spot at 0.6115). As highlighted, the weak phase in NZD from late Jun is still intact and NZD could weaken further to 0.6050. That said, after the strong bounce from 0.6080 yesterday, the odds for NZD to decline to 0.6050 have diminished somewhat. Overall, only a break of 0.6190 (no change in ‘strong resistance’ level from yesterday) would indicate that the weak phase has run its course.”
The Bank of Canada (BoC) surprised with a 100 bps hike in July. In the view of economists at TD Securities, more policy aggression accelerates the perverse effect of higher rates on FX. The CAD is living on borrowed time, and the USD/CAD pair is set to trade above the 1.32 level.
The BoC is bringing forward the pain to the overly indebted consumer
“The BoC is far too late to this and front-loading rate hikes accelerates the perverse impact of higher rates on FX; that is, the higher that rates go the more that macro imbalances manifest in the currency. For the CAD, that means that Macklem is bringing forward the reckoning facing the overly indebted consumer.”
“At this point, with 75 bps being the expected outcome for this meeting, the shock value of doing an extra 25 bps is relatively small. The question then becomes if the BoC will deliver another 100 bps for the next meeting. We have reservations about that. What today's surprise 100 bps hike does, however, is it raises the prospect of the Fed following suit.”
“We highly doubt the CAD can hold its own versus the USD. By our measure, the CAD is the least short G10 currency against the USD. The CAD is also one of the most correlated currencies to global equities. We think the outlook for the latter is still very much challenged and combined with our cross-asset fair value measure suggesting USD/CAD should be north of 1.32 leaves us thinking that dips in the pair will be short-lived.”
Considering preliminary readings from CME Group for crude oil futures markets, open interest rose by nearly 6K contracts after two consecutive daily retracements on Wednesday. On the other hand, volume dropped by around 117.2K contracts following two daily advances in a row.
WTI: Decent contention emerged at the 200-day SMA
Wednesday’s recovery in prices of the barrel of the WTI was amidst rising open interest and a moderate drop in volume. That said, some consolidation could emerge in the very near term while the downside remains so far limited by the 200-day SMA around the $94.00 neighbourhood per barrel.
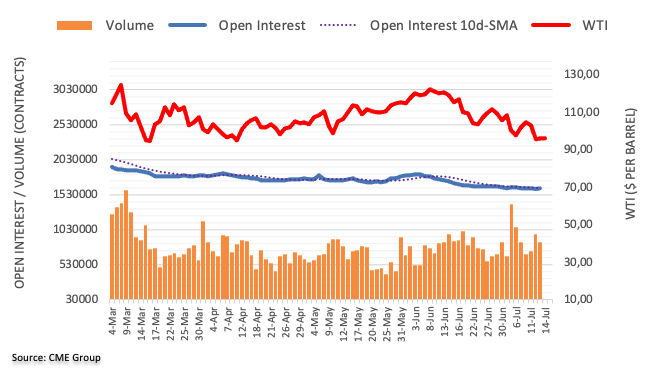
- Gold Price has returned to its intraday low at $1,725.55 as DXY advances.
- The higher inflation rate has underpinned recession fears and a 1% rate hike expectation by the Fed.
- The harmful duo of higher US CPI and lower Average Hourly Earnings will trim the overall demand.
Gold Price (XAUUSD) has recaptured its day’s low after failing to sustain above the critical resistance of $1,730.00 in the Asian session. The precious metal is declining gradually after printing a high of $1,745.43 on Wednesday. A sideways movement is expected in the asset as the wild move of $1,707.16-1,745.43 recorded on Wednesday will take time in getting faded. Entering the European session, a significant drop below $1,725.00 will weaken the gold bulls.
The US dollar index (DXY) is displaying a lackluster performance in the Asian session after a strong opening at around 108.30. The DXY is auctioning back and forth in a narrow range of 108.20-108.47. It looks like the market participants are building an initiative buying structure that will drive the asset beyond the fresh 19-year high at 108.58.
Also Read: Gold Price Forecast: For how long can XAUUSD defend $1,700?

Red-hot inflation escalates recession fears
Higher inflation harms paychecks
The US Bureau of Labor Statistics reported the annual inflation rate at 9.1%, higher than the prior release of 8.6% and the estimates of 8.8%. This is going to trim the value of ‘paychecks’ received by US households. A very large real income shock to the US households will not only display its multiplier effects on the aggregate demand and growth forecasts but will also reduce Consumer Confidence.
Considering the last week’s US employment data, the Average Hourly Earnings remained lower than their prior print. A situation of a higher inflation rate and lower Average Hourly Earnings will reduce the consumption and savings of the households significantly.
-637933754894100682.png)
Odds of a surprise rate hike by 100 bps advances
The release of the soaring inflation rate has underpinned the expectations of a rate hike by 100 basis points (bps) by the Fed. There is no denying the fact that the Federal Reserve (Fed) won’t make a historic move of elevating interest rates by 1%. The Fed is unintentionally dedicated to bringing price stability and in order to achieve the same, it may choose to announce the unusual. The announcement of a 1% rate hike by the Bank of Canada (BOC) has infused fresh blood into the psychology of central banks’ policymakers that a 1% rate hike could be a viable option.
-637933756560228279.png)
Fed policymakers turn extremely hawkish for July interest rate policy
The statement from Fed policymakers for July monetary policy has turned extremely hawkish now after the price pressures surpass 9%. San Francisco Fed chief Mary Daly, in an interview with New York Times, stated that “My most likely posture is 0.75%, because of the data I have seen”. In today’s session, Fed Governor Christopher Waller is scheduled to bring forward his views on inflation and expected rate hike.
Recession situation seems more visible now
The global economy is going through the phase of cost-push inflation and the market participants and critics are blaming the Fed for a delayed response to the price pressures. No doubt, the upbeat employment opportunities and solid growth prospects in the US economy are efficient to take the bullet in place of the Fed. The upbeat catalysts are supporting the Fed to tighten policy further vigorously. However, the inflation rate is not displaying any sign of making even an interim top.
There is a limit for the economic catalysts to take forward the burden of a higher inflation rate. In case of exhaustion, demand will shift extremely lower and the recession situation will be for real.
Gold technical analysis
Gold price is oscillating in a tad longer inventory distribution phase which is plotted in a range of $1,707.16-1,745.43 on the four-hour scale. Taking into account the prior vertical downside move, the gold prices are expected to scale southwards again.
The bright metal has failed to sustain above the 20-period Exponential Moving Average (EMA) at $1,734.16, which signals that the reversal move from the gold bulls was less confident. Also, the 50-EMA at $1,751.16 remained untouched, which adds to the downside filters.
Meanwhile, the Relative Strength Index (RSI) (14) has returned to the bearish range of 20.00-40.00, which indicates a fresh leg of downside impulsive wave ahead.
Gold four-hour chart
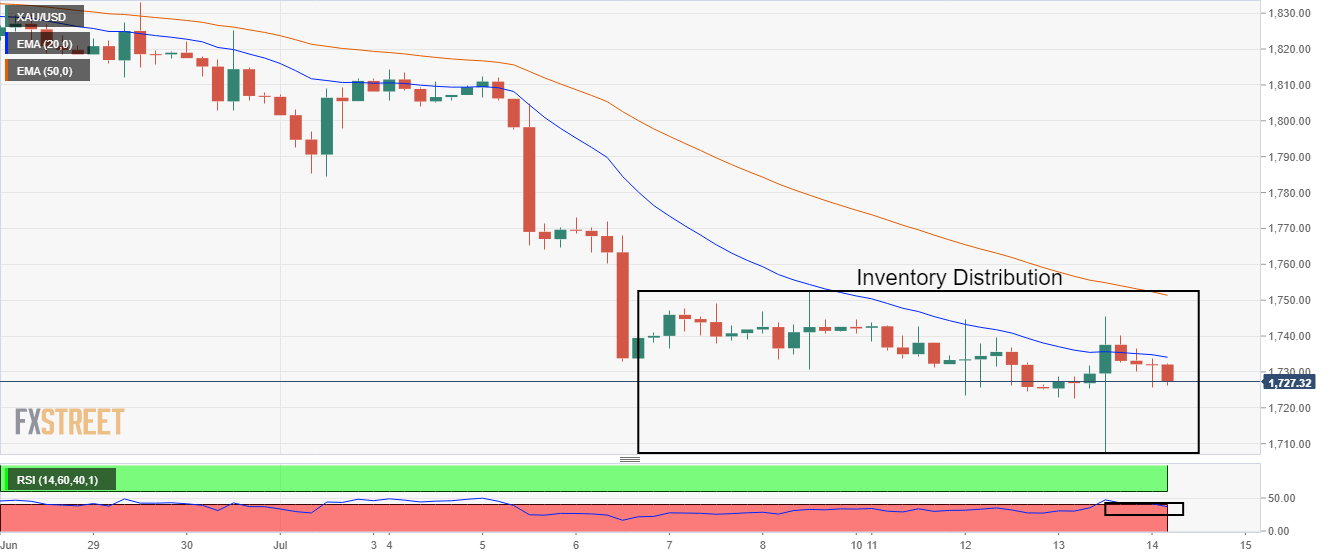
Can gold prices hold above $1700 as focus shifts to inflation data?
Bearish bets on nearly all Asian currencies firmed to new multi-year highs, as fears of an impending recession from rapidly rising interest rates to rein in sky-high inflation dampened sentiment, a Reuters poll showed on Thursday.
Key findings
Short positions on the Thai baht, the Philippine peso and the Singapore dollar were at their highest since 2018, when data was first available, according to a fortnightly poll of 13 respondents.
Analysts on average have not held net long positions on any Asian currency since late April.
Bearish bets on the baht firmed the most, with a worsening COVID-19 situation in China, which pursues a 'zero-COVID' strategy, stoking fears of a delay in return of Chinese tourists to Thailand.
Pessimism levels on the Chinese yuan, seen as a safer bet among Asia currencies, remained largely unchanged.
The Philippine peso was the most shorted Asian currency after it hit a 17-year low earlier this week, as investors feared the Bangko Sentral ng Pilipinas' (BSP) rate hikes would still leave it behind the curve in fighting inflation.
India, like many other economies, is battling soaring inflation in spite of policy tightening and wheat export curbs.
Also read: Asian Stock Market: Trades mixed amid China tech gains, recession risk
USD/INR grinds higher around intraday top close to 79.85 during early Thursday morning in Europe. In doing so, the Indian rupee (INR) pair justifies bullish signals from the options market amid broad US dollar strength, as well as downbeat Indian fundamentals.
USD/INR one-month risk reversal (RR), the difference between the call options and put options, hints that the pair optimists, namely the call buyers, have an upper hand over the bears. As per the latest print, the weekly RR braces for the biggest jump in two months while positing the first negative closing in four, around 0.0500. The daily RR, however, prints -0.1550 figures versus the previous two-day uptrend.
Elsewhere, Reuters said, “Analysts raised their short positions on the Indian rupee, which has hit record lows every day so far this week despite efforts from the central bank to boost foreign exchange inflows.”
Also read: US Dollar Index stays firmer above 108.00 as US inflation underpins hawkish Fedspeak
FX Strategists at UOB Group Lee Sue Ann and Quek Ser Leang noted the increasing likeliness of a breach of the 1.1800 in GBP/USD in the short-term horizon.
Key Quotes
24-hour view: “We highlighted yesterday that GBP ‘is unlikely to weaken further’ and we expected GBP to ‘trade between 1.1825 and 1.1925’. GBP subsequently plummeted briefly to 1.1828, soared to 1.1968 before dropping back down to close at 1.1895 (+0.09%). Despite the choppy price actions, the underlying tone appears to be soft and we see chance for GBP to weaken but a break of the major support at 1.1800 appears unlikely for now (there is another support at 1.1825). Resistance is at 1.1905 followed by 1.1940.”
Next 1-3 weeks: “There is no change in our view from yesterday (13 Jul, spot at 1.1880). As highlighted, while downward momentum has not improved by much, the chance for GBP to break 1.1800 has increased. A break of 1.1800 would shift the focus to 1.1750. The downside risk is intact as long as GBP does not move above 1.1980 (no change in ‘strong resistance’ level from yesterday).”
Gold price is fading its stellar recovery this Thursday. For how long can XAUUSD defend $1,700? FXStreet’s Dhwani Mehta analyzes the pair’s technical picture.
There is room for the additional downside
“The bullion confirmed a bear flag formation on the daily timeframe after closing below the rising trendline support of $1,733 on Tuesday. This has paved the way for a test of the $1,700 mark should Wednesday’s low of $1,707 yield on a sustained basis. The immediate support, however, is seen at $1,720 the figure.”
“a sustained break above the daily highs of $1,737 will kick in a fresh upswing towards the $1,750 psychological level. Ahead of that, the bear flag support now turned resistance at $1,743 could challenge the road to recovery in the near term.”
The US dollar has already enjoyed an appreciable bid this month. In any event, the USD remains king of FX and it will be incredibly brave and naive – to assume otherwise, economists at TD Securities report.
USD flexing in places where it has not really done so yet
“There is no way around it, the Fed has an inflation problem on its hands and the USD will continue to remain king of FX.”
“Bounces in EUR/USD are a fade and will likely be short-lived.”
“EUR/USD parity will likely be more durable and contain broad USD variation, but it will eventually fail so a sub-parity paradigm is a very real risk.”
“We think USD strength will spread to places where it has not flexed yet, like vs. the CAD.”
- Asian equities part ways from Wall Street as China allows bears to take a breather.
- 40-year high US inflation propelled hawkish Fed bets, economic slowdown fears.
- Aussie jobs report, inflation expectations favor hawkish RBA rate hike calls.
Asia-Pacific traders struggle to gain traction amid mixed concerns as China tries to renew optimism while updates from the West hint at recession. Strong inflation, hawkish bets on the key central banks and yield curve inversion are an extra burden to the market sentiment even if Beijing struggles to defend bulls.
While portraying the mood, the MSCI’s index of Asia-Pacific shares ex-Japan prints 0.20% intraday gains while staying around the two-year low hit on Tuesday. Further, Japan’s Nikkei 225 rises 0.70% to 26,665 heading into Thursday’s European session.
Elsewhere, “China's blue-chip index CSI300 rose 0.5% by the lunch break, while the Shanghai Composite Index gained 0.3%. In Hong Kong, the benchmark Hang Seng Index rose 0.2%,” said Reuters. The news also adds, “The markets are lifted by a surge in tech shares, as investors brushed aside overnight losses on Wall Street after 40-year-high U.S. inflation data fuels bets on faster U.S. monetary policy tightening.”
It should be noted that Australia’s ASX 200 rises over 1.0% even as Aussie employment and inflation numbers propelled the expectations of aggressive rate hikes from the Reserve Bank of Australia (RBA).
Australia’s Employment Change rose to 88.4K versus 25K expected and 60.6K prior. Further, the Unemployment Rate dropped to 3.5% from 3.9% previous readouts and 3.8% market consensus. Earlier in the day, Australia’s Consumer Inflation Expectations for July came out as 6.3% versus 5.9% expected and 6.7% prior. Following the data, Bloomberg said, “The result spurred traders to start pricing in a 75-basis-point rate hike for August by the Reserve Bank of Australia, with bets rising to 47% from no chance before the data.”
That said, stocks in India and New Zealand track gains from China while markets in the Philippines print losses amid hopes of more covid-linked pain.
On a broader front, the Bank of Canada’s (BOC) 100 basis points (bps) rate hike joined the 40-year high US Consumer Price Index (CPI) to propel the hawkish Fed bets. Reuters cites CME data to mention the hawks while saying, “They are now pricing in a nearly 80% probability of a full percentage-point rise at the coming meeting, according to an analysis of the contracts by CME Group.”
It should be noted that the US 10-year Treasury yields rose three basis points (bps) to 2.95% at the latest while the S&P 500 Futures drop 0.10% to portray the risk-off mood by the press time. More importantly, the spread between the 2-year US Treasury yields and its 10-year counterpart widens and portrays the market’s fears of economic slowdown. The yield curve inversion, the condition of higher short-term rates, hints at the investors’ rush for risk safety.
Moving on, risk catalysts and the US Producer Price Index (PPI) for June may entertain intraday traders.
Open interest in gold futures markets noted traders reversed three daily builds in a row and shrank by nearly 5K contracts on Wednesday, according to advanced prints from CME Group. Volume, instead, increased for the second consecutive session, now by more than 19K contracts.
Gold appears supported around $1,700
Gold prices charted decent gains after bottoming out near the $1,700 mark per ounce troy on Wednesday. The uptick, however, was on the back of shrinking open interest, leaving the prospects for further gains somewhat curtailed for the time being. In the meantime, the $1,700 region continues to hold the downside in the very near term.
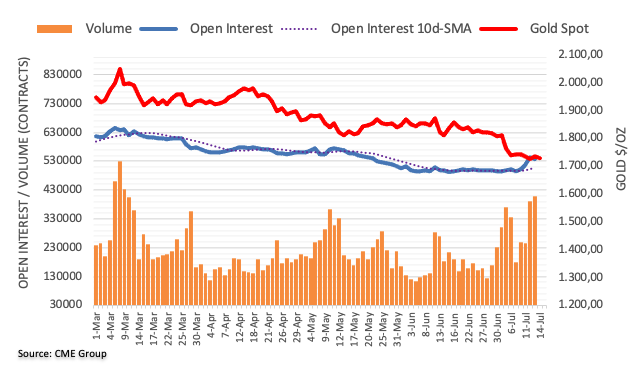
- USD/CAD pares the biggest daily fall in a week as US dollar cheers hawkish Fed bets.
- WTI crude oil prices rebound amid mixed concerns surrounding China, sluggish session.
- BOC’s larger-than-expected rate hike triggered chatters over Fed’s 100 bps rate hike.
- US PPI, second-tier Canada data will be important for fresh impulse.
USD/CAD remains sidelined at around 1.2980. consolidating the previous day’s losses heading into Thursday’s European session. The Loonie pair slumped the most in over a week after the Bank of Canada’s (BOC) rate hike. However, hawkish expectations from the US Federal Reserve (Fed), mainly inspired by the US inflation data, appeared to have fuelled the quote afterward.
Bank of Canada (BOC) hiked its policy rate by 100 basis points (bps) to 2.5% in June, compared to the market expectation for a rate increase of 75 bps. “With the economy clearly in excess demand, inflation high and broadening, and more businesses and consumers expecting high inflation to persist for longer, the Governing Council decided to front-load the path to higher interest rates”, said BOC Statement. After the BOC drama, the USD/CAD dropped 80 pips before bouncing off 1.2936.
It’s worth noting that the US Consumer Price Index (CPI) for June jumped to the highest level in 40 years to 9.1% YoY versus 8.8% expected and 8.6% prior. The Core CPI, which excludes volatile food and energy prices, eased to 5.9% from 6% prior but crossed analysts' forecast of 5.8%.
The pair’s rebound gained momentum afterward amid escalating bets on the hawkish Fed move. The multi-year high US inflation fuelled the market’s bets for hawkish Fed actions in July. Reuters cites CME data to mention the USD/CAD bulls while saying, “They are now pricing in a nearly 80% probability of a full percentage-point rise at the coming meeting, according to an analysis of the contracts by CME Group,” said Reuters. The hawkish Fedbets also gain support from the Fed policymakers as San Francisco Federal Reserve Bank President Mary Daly said that her most likely posture is a 75bp hike in July but a 100bp is possible, as reported by the New York Times. Before that, Richmond Federal Reserve President Thomas Barkin conveyed his support for higher rates in the last meeting while Cleveland Federal Reserve President Loretta Mester also said, “The data on CPI does not suggest a rate hike in July any smaller than that in June.”
Against this backdrop, the US 10-year Treasury yields rose three basis points (bps) to 2.95% at the latest while the S&P 500 Futures drop 0.10% to portray the risk-off mood and favor the US dollar.
Looking forward, US Producer Price Index for June and the weekly Jobless Claims will decorate the calendar and entertain USD/CAD traders. However, major attention will be given to the Fedspeak and risk catalysts like chatters surrounding recession. Also important will be Canada’s monthly Manufacturing Sales and prices of WTI crude oil, up 0.30% around $94.50 by the press time.
Technical analysis
Unless crossing a seven-day-old resistance line, at 1.3055 by the press time, USD/CAD bulls could stay cautious. Alternatively, pullback moves remain elusive beyond an upward sloping support line from June 08, around 1.2960 at the latest.
EUR/USD could slip back below the parity level and visit 0.9960 ahead of 0.9920 in the next weeks, suggested FX Strategists at UOB Group Lee Sue Ann and Quek Ser Leang.
Key Quotes
24-hour view: “We expected EUR to ‘trade sideways within a range of 1.0000/1.0070’ yesterday. We did expect the spike in volatility as EUR plunged briefly to 0.9997, snapped to a high of 1.0122 before easing off to close at 1.0060 (+0.24%). Further choppy price actions are not ruled out, likely between 1.0000 and 1.0100.”
Next 1-3 weeks: “Our update from yesterday (13 Jul, spot at 1.0035) still stands. As highlighted, EUR is still weak and the next levels to monitor are at 0.9960 and 0.9920. That said, after the sharp bounce from just below the parity level during NY session, 0.9960 may not come into the picture so soon. Overall, only a break of 1.0150 (no change in ‘strong resistance’ level from yesterday) would indicate that the weakness in EUR that started two weeks ago has stabilized.”
- USD/JPY has refreshed its 23-year high at 138.30, more upside looks likely on hawkish Fed bets.
- A higher inflation rate will trim the value of paychecks for US households.
- The downbeat inflation data has weakened the yen bulls.
The USD/JPY pair has renewed its fresh 23-year high of 138.30 in the Asian session. The asset is holding its elevated levels firmly and is expected to accelerate further as the market participants have started betting on a surprise rate hike of 100 basis points (bps) by the Federal Reserve (Fed) later this month.
The release of the improved inflation report by the US Bureau of Labor Statistics has paddled up the fears of enlarging real income shocks in the US. The annual US Consumer Price Index (CPI) has landed at 9.1%, much higher than the estimates of 8.8% and the prior release of 8.6%. This is going to trim the value of ‘paychecks’ received by US households. In order to tame the inflation monster, the Fed is bound to hike its interest rates as its foremost agenda is to bring price stability.
In today’s session, the release of the US Producer Price Index (PPI) excluding food and energy will be of utmost importance. As per the market consensus, the economic data is expected to land at 8.1%, lower than the prior release of 8.3%. An expectation of a slippage in the producer inflation data indicates that volatile oil and food prices are driving inflation higher.
On the Tokyo front, the downbeat Industrial Production data has weakened the yen bulls. The economic data has landed at -4.7% lower than the estimates and the prior release of -2.8% on an annual basis. Also, the monthly figures have slipped to -7.5% from the consensus and the former print of -7.2%.
“Australia’s hiring boom gathered pace in June, sending the unemployment rate to the lowest in almost 50 years and bolstering the case for a supersized interest rate hike next month,” said Bloomberg after Australia released June month’s employment data on Thursday.
Key quotes
The result spurred traders to start pricing in a 75-basis-point rate hike for August by the Reserve Bank of Australia, with bets rising to 47% from no chance before the data. Local bonds sold off, sending the three-year yield higher by as much as 19 basis points to 3.06%.
The data adds to the case for an oversized hike from the Reserve Bank of Australia at its August meeting. With inflationary pressures remaining elevated, we expect the RBA to continue with its rapid tightening pace.
Market reaction
With the firmer Aussie jobs report and increasing hawkish bets on the Reserve Bank of Australia’s (RBA) next move, AUD/USD grinds higher around 0.6775, up 0.21% intraday by the press time.
- EURUSD Price reverses the bounce off 20-year low as sour sentiment underpins US dollar’s safe-haven demand.
- Fears of downbeat European Commission Economic Forecasts, Moody’s outlook for Germany and Italy weigh on pair.
- 40-year high US inflation propelled bets for 100 bps rate hike in July.
EURUSD Price remains on the back foot at around 1.0030, after a failed attempt to recover from a nearly two-decade low the previous day. That said, the major currency pair’s rebound from the lowest levels since December 2002 reversed from 1.0122, extending the pullback towards the 1.0000 parity level of late.
The major currency pair portrays the market’s pessimism surrounding the Eurozone economic conditions while also justifying the hawkish Fed bets after the multi-year high US inflation. It’s worth noting, however, that the quarterly economic forecasts from the European Union (EU) appear to be the key for the intraday traders, even if the recession fears could keep bears happy.
Also read: EUR/USD Forecast: Panic takes over post-US CPI data
EURUSD Price drops on US Inflation
US inflation jumped to 40-year high in June.
US inflation, as per the US Consumer Price Index (CPI) for June, jumped to the highest level in 40 years to 9.1% YoY versus 8.8% expected and 8.6% prior. That said, the Core CPI, which excludes volatile food and energy prices, eased to 5.9% from 6% prior but crossed analysts' forecast of 5.8%. The jump in the US price pressure propels the market toward the US dollar demand and weighs on the EURUSD Price. Following the US data, White House (WH) Economic Adviser Brian Deese told CNBC that the CPI data shows the urgency for Congress to pass legislation to spur semiconductor manufacturing in the US, as reported by Reuters. On the other hand, US President Biden mentioned that CPI data is ‘out of data’ as gas prices have fallen.
Hawkish Fed bets also favor bears
The multi-year high US inflation fuelled the market’s bets for hawkish Fed actions in July. Reuters cites CME data to mention the EURUSD Price bears while saying, “They are now pricing in a nearly 80% probability of a full percentage-point rise at the coming meeting, according to an analysis of the contracts by CME Group,” said Reuters. The hawkish Fedbets also gain support from the Fed policymakers as San Francisco Federal Reserve Bank President Mary Daly said that her most likely posture is a 75bp hike in July but a 100bp is possible, as reported by the New York Times. Before that, Richmond Federal Reserve President Thomas Barkin conveyed his support for higher rates in the last meeting while Cleveland Federal Reserve President Loretta Mester also said, “The data on CPI does not suggest a rate hike in July any smaller than that in June.”
Moody’s sounds grim Germany, Italy
Global rating giant Moody's latest outlook for Germany and Italy appears grim. “When looking at Germany and Italy, the immediate economic repercussions of Russia's plan to restrict supply in mid-June are likely to be limited,” said the rating giant. The report also mentioned, “When Russian gas supplies are cut off, negative economic impacts that will increase both countries' debt burdens.”
EU Forecasts eyed
The quarterly readings of the EU Economic Forecasts will be crucial for the EURUSD Price mainly due to the recently downbeat expectations from the bloc’s key economies, namely Germany and Italy. Ahead of the release, Bloomberg hints at the weaker figures while stating the draft report seen. “Gross Domestic Product (GDP) is likely to advance 2.6% this year and 1.4% in 2023 -- down from May predictions for gains of 2.7% and 2.3%,” mentioned Bloomberg. The news also mentioned that Inflation is now seen at 7.6% in 2022 and 4% next year, up from 6.1% and 2.7%.
US PPI also appears important for bears
Following upbeat US CPI, EURUSD traders will also follow the Producer Price Index (PPI) details for immediate directions, other than the EU forecasts. As per the market consensus, the PPI is likely to ease to 10.7% YoY in June from 10.8% prior. More importantly, PPI ex Food & Energy is also expected to edge lower to 8.1% YoY during the stated month, versus 8.3% prior.
EURUSD Price technical outlook
EURUSD Price couldn’t even cross the 5-DMA during the previous day’s corrective pullback, even if the oversold RSI (14) triggered the bounce from the 20-year low.
A failure to cross the immediate DMA joins bearish MACD signals to keep the pair sellers hopeful of refreshing the multi-year low, currently around 0.9998.
In doing so, the pair bears keep eyes on the downward sloping support line from early March, near 0.9975 by the press time.
Following that, the 61.8% Fibonacci Expansion (FE) of the EURUSD Price moves between March 31 and May 30, close to 0.9950, could lure sellers ahead of directing them to the December 2002 low of 0.9860.
On the contrary, a clear upside break of the 5-DMA immediate hurdle, around 1.0100 by the press time, could help the EURUSD Price to aim for the last Thursday’s peak surrounding 1.0220.
However, the pair bears remain hopeful until the quote stays below the previous support line from May 13, close to 1.0380 at the latest.
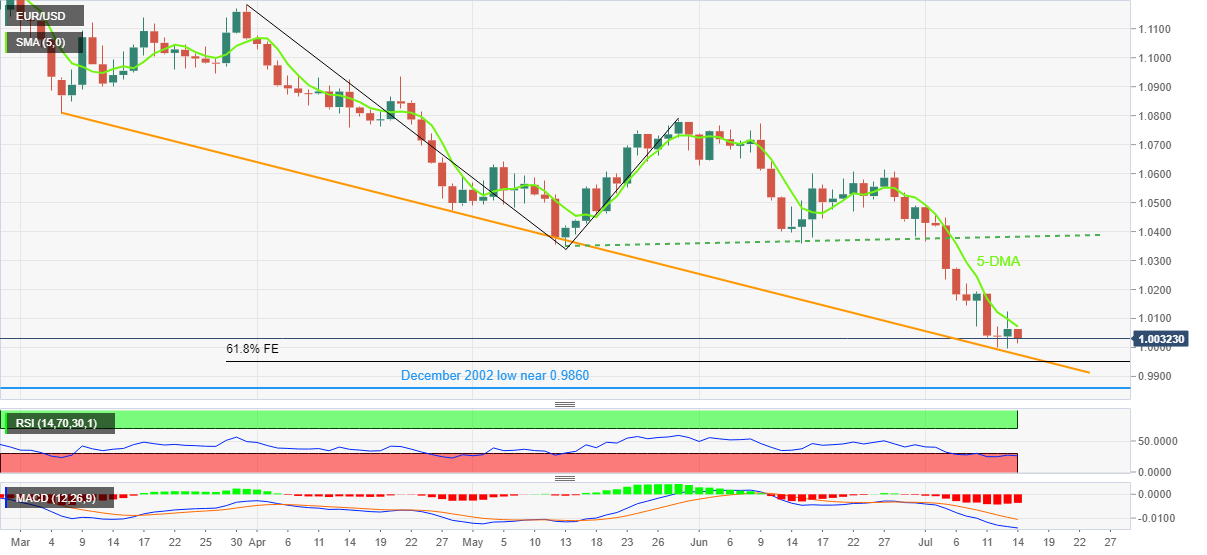
Key trading levels
- Fake breakdown of the descending triangle has strengthened the aussie bulls.
- The asset has captured the 50-period EMA at 0.6764 confidently.
- A decisive move above 60.00 by the RSI (14) will accelerate the odds of a bullish reversal.
The AUD/USD pair is marching towards the round-level resistance of 0.6800 after sensing a responsive buying action. The asset has rebounded firmly after hitting a low of 0.6730 in the Asian session. An escape from the fears of recapturing a two-year low at 0.6711 has strengthened the antipodean against the greenback.
A downside fake-out of the descending triangle formed on an hourly scale is indicating that the aussie bulls are not bearish for now. The downward sloping trendline of the above-mentioned chart pattern is plotted from June 16 high at 0.7070 while the horizontal support is plotted from June 1 low at 0.6763. The aussie bulls have returned to the volatility contraction pattern.
Aussie bulls have captured the 50-period Exponential Moving Average (EMA) at 0.6764, which indicates that the short-term trend is bullish now. However, the 200-EMA at 0.6802 is still higher than the prices.
Meanwhile, the Relative Strength Index (RSI) (14) is attempting to hit 60.00 and a breach of the same will bring a bullish reversal for the counter.
Should the asset violate July 6 high at 0.6827. An occurrence of the same will drive the asset towards July 5 high at 0.6896, followed by June 30 high at 0.6920.
Alternatively, a drop below Monday’s low at 0.6713 will drag the asset towards the 29 May 2020 high at 0.6683. A breach of the latter will drag the asset towards the 30 April 2020 high at 0.6570.
AUD/USD hourly chart
-637933684130990964.png)
- Steel prices are witnessing a sell-off as the Fed is preparing for a 1% rate hike.
- Escalating demand for automobiles in China could be a game changer.
- Monsoon arrival in Asia has postponed the construction activities.
Steel prices are dropping strongly as scorching inflation in the global economy has bolstered the odds of a recession situation. The inflation rate is sky-rocketing in the global economy and in order to tame the same central banks are hiking their interest rates like there is no tomorrow.
On Wednesday, the inflation report by the US Bureau of Labor Statistics spooked the market sentiment. The release of the red-hot inflation soared has strengthened the odds of 100 basis points (bps) by the Federal Reserve (Fed). The annual US Consumer Price Index (CPI) print of 9.1% is going to force the Fed to make a historic move and dictate a rate hike by 1%.
Well, the Bank of Canada (BOC) has accelerated its interest rates by 1%. Therefore, the fed won’t look for mental support further and will announce the unusual.
On the demand front, escalating demand for automobiles in China is expected to spurt the demand for steel going forward. June’s production of automotive vehicles in China has been recorded at 2.499 million units, which is higher by 29.7%, as per China’s Association of Automobile Manufacturers (CAAM). The advancing pattern of automobile production could be a game changer for steel prices.
However, the catalyst which is trimming the demand for steel is the monsoon arrival as construction activities get halted in the same period. The monsoon has hit many provinces of China and other Asian nations, which is resulting in a postponement of housing construction, infrastructure, and other related activities.
- GBPUSD reverses the previous day’s corrective pullback, holds lower ground near intraday bottom of late.
- UK Presidential candidates remain mostly intact on Brexit bias while struggling to offer more than tax cuts.
- British data-dump teased buyers but US inflation, hawkish Fedspeak exert downside pressure.
- US PPI, Jobless Claims can direct intraday moves, risk catalysts are the key.
GBP/USD fades bounce off intraday low while also reversing the previous day’s rebound as sellers dominate around 1.1865 during early Thursday morning in Europe. The Cable pair cheered upbeat UK data the previous day but lost the battle against the 40-year high US inflation and hawkish Fedspeak. Also weighing the pair is the political crisis in the UK after Boris Johnson resigned.
The higher-than-expected monthly prints of the British Gross Domestic Product (GDP), Industrial Production and Manufacturing Production for May favored the GBP/USD buyers the previous day. That said, softness in the trade deficit for the said month also helped the Cable buyers to mark a surprise entry.
However, Fed policymakers recently favored the market’s hawkish bias while tracking the 40-year high US inflation data, which in turn drowned the GBP/USD afterward. Recently, San Francisco Federal Reserve Bank President Mary Daly said that her most likely posture is a 75bp hike in July but a 100bp is possible, as reported by the New York Times. Before that Richmond Federal Reserve President Thomas Barkin conveyed his support for higher rates in the last meeting while Cleveland Federal Reserve President Loretta Mester also said, “The data on CPI does not suggest a rate hike in July any smaller than that in June.”
It’s worth noting that the US Consumer Price Index (CPI) for June jumped to the highest level in 40 years to 9.1% YoY versus 8.8% expected and 8.6% prior. The Core CPI, which excludes volatile food and energy prices, eased to 5.9% from 6% prior but crossed analysts' forecast of 5.8%. It should be noted that the BOC announced a 100 bps rate hike by crossing the market forecasts the previous day.
Following the US data, White House (WH) Economic Adviser Brian Deese told CNBC that the CPI data shows the urgency for Congress to pass legislation to spur semiconductor manufacturing in the US, as reported by Reuters. On the other hand, US President Joe Biden mentioned that CPI data is ‘out of data’ as gas prices have fallen.
Elsewhere, a successive third month of cooling home demand in the UK joins fears of more Brexit drama, despite the change of British leader, also exerting downside pressure on the GBP/USD prices.
Amid these plays, the US 10-year Treasury yields rose four basis points (bps) to 2.95% at the latest while the S&P 500 Futures drop 0.20% to portray the risk-off mood and favor the US dollar.
Moving on, US Producer Price Index for June and the weekly Jobless Claims will decorate the calendar and entertain GBP/USD traders. However, major attention will be given to the Fedspeak and risk catalysts like chatters surrounding recession.
Technical analysis
Wednesday’s Doji candlestick joins oversold RSI to tease GBP/USD buyers but a clear upside break of the 13-day-old resistance line, near 1.1950, appears necessary for the bulls to take entry. On the contrary, the monthly support line restricts immediate declines of the Cable pair around 1.1850.
- NZD/USD snaps two-day rebound from yearly low, holds lower ground near intraday bottom of late.
- Sustained trading below 10-DMA, downbeat RSI keeps sellers hopeful.
- Recovery remains elusive until the quote stays below 50-DMA.
NZD/USD remains pressured during the first loss-making day in three as sellers flirt with the 0.6100 threshold amid Thursday’s mid-Asian session. In doing so, the Kiwi pair remains inside a one-month-old falling wedge bullish chart pattern.
Given the quote’s repeated failures to cross the 50-DMA, NZD/USD is likely to remain pressured. The bearish bias also takes clues from the downbeat but not oversold RSI (14).
That said, the Kiwi pair presently drops towards the support line of the stated wedge, around 0.6085.
It should be noted that the RSI (14) is near the oversold territory and may test the extreme region suggesting a bounce in the NZD/USD prices if the pair remains weak below 0.6085.
In a case where the pair fails to rebound from 0.6085, by ignoring the RSI, the bears may not hesitate to refresh the multi-month low of 0.6080 while targeting a downward sloping support line from 0.6025.
Alternatively, a clear upside break of the 10-DMA level of 0.6153 will need validation from the aforementioned wedge’s resistance line, at 0.6180 now, to convince the NZD/USD bulls.
Following that, a run-up towards a three-month-old resistance line, near 0.6270, can’t be ruled out. However, the NZD/USD buyers remain cautious until witnessing a successful break of the 50-DMA level surrounding 0.6325.
NZD/USD: Daily chart
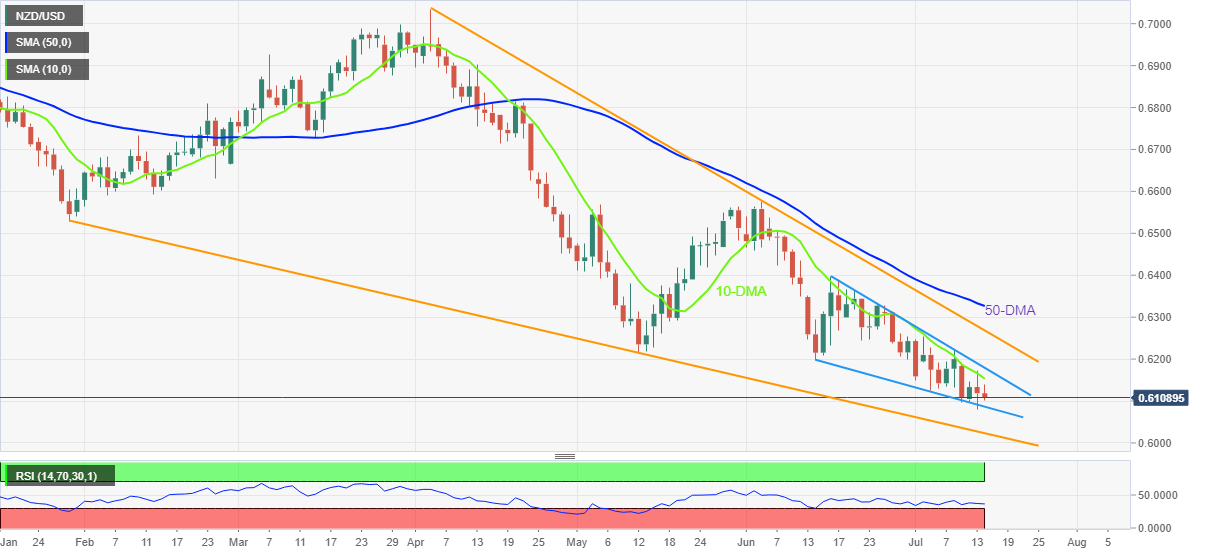
Trend: Limited downside expected
No sooner than the USD/JPY pair popped 138.00, Japanese Chief Cabinet Secretary Hirokazu Matsuno came out on the wires, via Reuters, attempting some verbal intervention.
Key quotes
Concerned by recent rapid yen weakening.
Watching FX market even more closely while working with BOJ.
Will closely monitor how US inflation trends, monetary policy changes affect Japan, global economy.
Market reaction
USD/JPY eased back below 138.00 on the above comments, currently trading at 137.93, still up 0.37% on the day.
| Raw materials | Closed | Change, % |
|---|---|---|
| Silver | 19.203 | 1.56 |
| Gold | 1735.49 | 0.55 |
| Palladium | 1978.93 | -2.37 |
- Gold Price refreshes intraday low while reversing the corrective pullback from yearly bottom.
- Sour sentiment underpins US dollar demand as yields signal economic slowdown after CPI rallied to 40-year high.
- US PPI, risk catalysts may entertain XAUUSD traders but bears keep reins amid inflation, recession woes.
Gold Price (XAUUSD) remains pressured below $1,730, reversing the previous day’s bounce off an 11-month low, as it refreshes an intraday low around $1,727 during Thursday’s Asian session. The metal’s weakness could be linked to the market’s fears of recession and higher interest rates, not to forget the US dollar's strength.
The precious metal recovered the previous day from the yearly low as markets struggled to digest the US inflation data amid mixed comments afterward. However, the hawkish Fedspeak and the Bank of Canada’s (BOC) 100 basis points (bps) rate hike cleared the way for the XAUUSD bears on Thursday.
Also read: Gold Price Forecast: Post-CPI recovery stalls below critical resistance

Golden bull bites the gold dust
Gold Price drown on yield curve inversion
The key US Treasury yield curve, mainly between the 2-year and 10-year Treasury coupons, remains inverted and portrays fears of recession, which in turn weigh on Gold Price. That said, the US 10-year Treasury yields rose four basis points (bps) to 2.95% at the latest while its 2-year counterpart rose to 3.18% by the press time. With this, the yield curve marks around 23 bps of inversion among the aforementioned key bond coupons and signals the market’s fears of economic slowdown.
Biden tried to tame US inflation fears but failed
US President Joe Biden cited energy prices to probe bears after the inflation data, per the US Consumer Price Index (CPI) for June, jumped to the highest level in 40 years to 9.1% YoY versus 8.8% expected and 8.6% prior. That said, the Core CPI, which excludes volatile food and energy prices, eased to 5.9% from 6% prior but crossed analysts' forecast of 5.8%. Following the US data, White House (WH) Economic Adviser Brian Deese told CNBC that the CPI data shows the urgency for Congress to pass legislation to spur semiconductor manufacturing in the US, as reported by Reuters. On the other hand, US President Biden mentioned that CPI data is ‘out of data’ as gas prices have fallen.
Bank of Canada also favors XAUUSD bears
The Bank of Canada (BOC) hiked its policy rate by 100 basis points (bps) to 2.5% in June, compared to the market expectation for a rate increase of 75 bps. “With the economy clearly in excess demand, inflation high and broadening, and more businesses and consumers expecting high inflation to persist for longer, the Governing Council decided to front-load the path to higher interest rates”, said BOC Statement.
US Dollar Index drowns metal prices
US Dollar Index (DXY) justifies the four-decade high inflation figures while snapping a two-day downtrend, up 0.32% intraday near 108.40 by the press time, to weigh on the Gold Price. The greenback gauge’s latest run-up could also be linked to the fears of global economic slowdown and more pessimism surrounding Europe.
Hawkish Fedspeak favors bears
Fed policymakers recently favored the market’s hawkish bias while tracking the 40-year high US inflation data. Recently, San Francisco Federal Reserve Bank President Mary Daly said that her most likely posture is a 75bp hike in July but a 100bp is possible, as reported by the New York Times. Before that Richmond Federal Reserve President Thomas Barkin conveyed his support for higher rates in the last meeting while Cleveland Federal Reserve President Loretta Mester also said, “The data on CPI does not suggest a rate hike in July any smaller than that in June.”
Gold Price technical outlook
Gold Price pokes a late 2021 trough as it fails to extend corrective pullback from an upward sloping support line from March 2021. It’s worth noting, however, that the oversold RSI conditions challenge the XAUUSD bears.
That said, the $1,700 threshold can act as an additional downside filter, other than the aforementioned support line close to $1,709, to restrict short-term declines of the precious metal.
In a case where the XAUUSD bears keep reins past $1,700, the odds of witnessing a south-run towards the previous yearly low of $1,676 can’t be ruled out.
On the contrary, recovery moves need validation from the 78.6% Fibonacci retracement level of March 2021 to March 2022 upside, close to $1,760. Before that, the December 2021 low near $1,753 could restrict an immediate rebound.
Even if the quote rises past $1,760, gold buyers will seek validation from May’s low of $1,786 before retaking control.
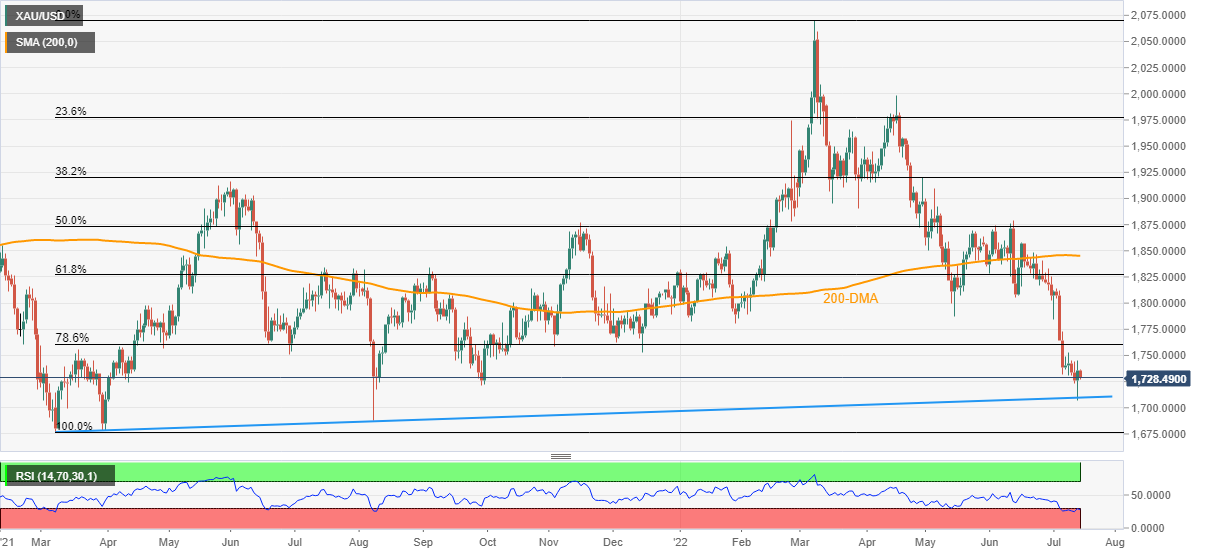
Gold analysis forecast 11th to 15th July 2022
- AUD/NZD bulls have moved in on the back of strong employment data.
- The cross is vulnerable to a correction prior to the next surge to the upside.
AUD/NZD has rallied following the Aussie jobs market data beat that has surprised across a spectrum of measures. This is fuelling a bid in AUD and leaves AUD/NZD vulnerable to a move high following the correction that is unfolding of the bullish rally.
The following illustrates the prospects of a move beyond the recent highs from an hourly and 15-minute time frame perspective:
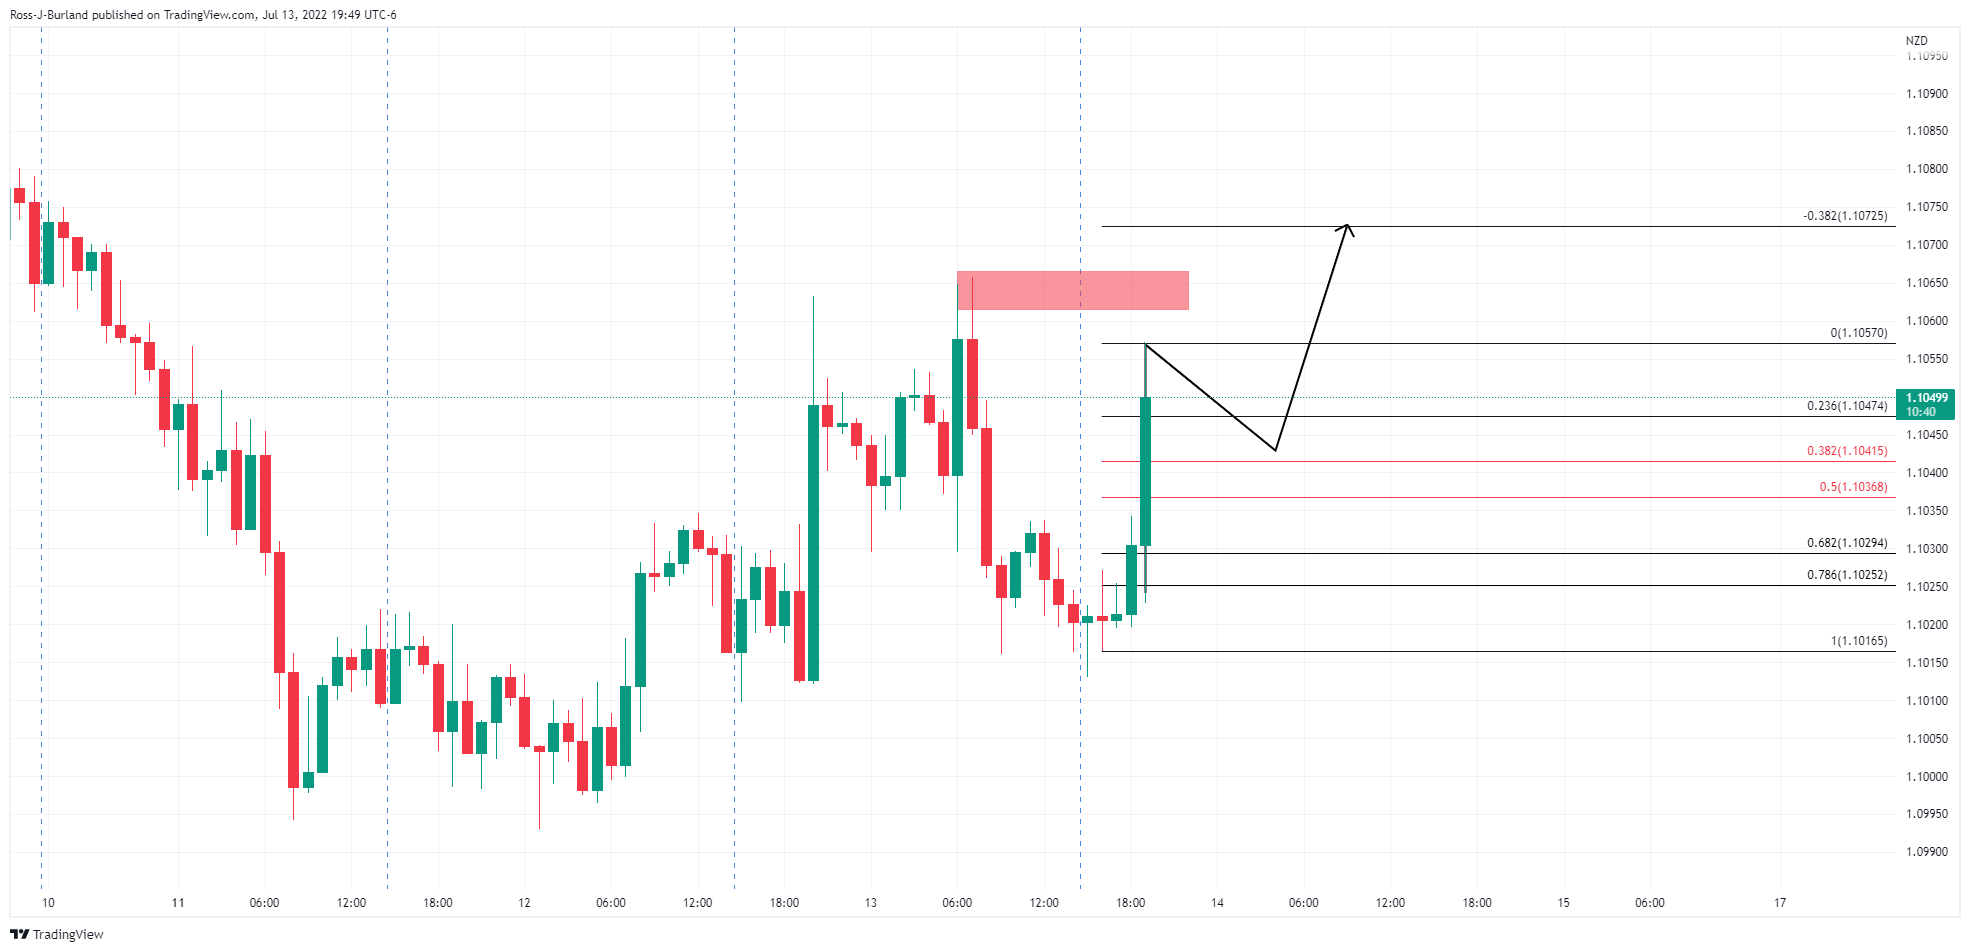
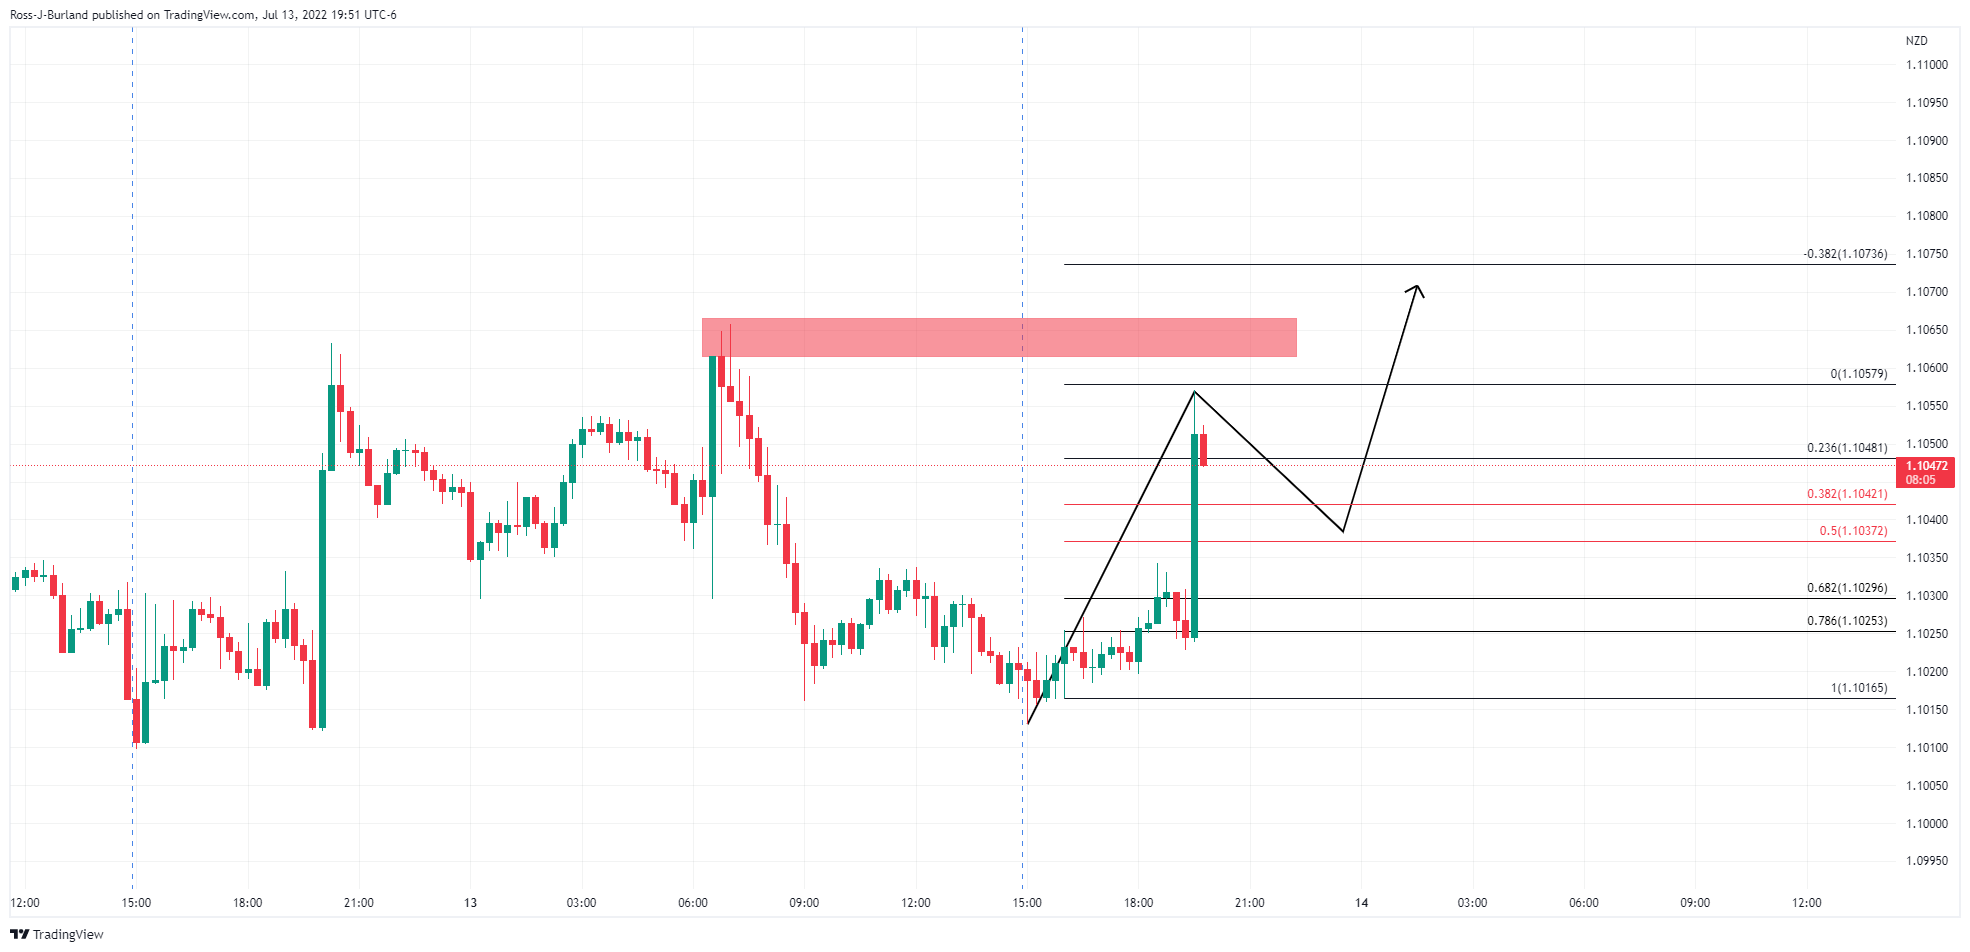
The rally has been sharp following the data but a correction is underway at the time of writing. The bulls will potentially be looking for a discount prior to committing further. A move beyond 1.1065 could spark a flurry of bids from both exits of shorts and new longs entering the market in support of the pair.
- AUD/USD is fetching strength to cross 0.6760 as aussie jobless rate has trimmed to 3.5%.
- The Australian economy generated 88.4k employment opportunities in June.
- The DXY is aiming to recapture a 19-year high at 108.56 on the soaring inflation rate.
The AUD/USD pair is putting efforts to overstep 0.6760 after the release of the upbeat aussie employment data. The Australian Bureau of Statistics has reported the Employment Change at 88.4k while the Unemployment Rate has trimmed to 3.5%.
As per the market consensus, the Australian economy was expected to report an addition of 25k jobs in its labor market. Also, the jobless rate was seen at 3.8%.
This is going to delight the Reserve Bank of Australia (RBA) in dictating more policy tightening measures later. It is worth noting that the RBA elevated its Official Cash Rate (OCR) by 50 basis points (bps) last week. Officially, the OCR stands at 1.35% but still needs more elevation to cater to soaring price pressures. The Australian inflation rate has been recorded at 5.1% for the first quarter of CY2022.
Meanwhile, the US dollar index (DXY) is advancing sharply to recapture a 19-year high at 108.58 as the higher inflation rate has infused fresh blood into the same. The US Consumer Price Index (CPI) has climbed to 9.1% on an annual basis, however, the core CPI that excludes oil and food prices has trimmed minutely to 5.9% vs. 6% in the former release. It would be worth watching whether the Federal Reserve (Fed) will follow the footprints of the Bank of Canada (BOC) and will elevate its interest rates by 100 bps to 2.50-2.75%.
- AUD/JPY takes the bids to refresh intraday high after firmer Aussie data.
- Australia Employment Change rose more than expected in June, Inflation Expectations also increased for July.
- Firmer yields add to the upside momentum but fail to tame recession woes amid inverted curves.
- Japanese firms shows readiness to hike prices amid weaker yen, higher inflation, suggesting more pair for yen.
AUD/JPY takes the bids to refresh intraday high near 93.20 on upbeat Australia employment and inflation data, publishing during Thursday’s Asian session. The pair also takes clues from the firmer US Treasury yields that propel the Japanese yen.
Australia’s Employment Change rose to 88.4K versus 25K expected and 60.6K prior. Further, the Unemployment Rate dropped to 3.5% from 3.9% previous readouts and 3.8% market consensus. Earlier in the day, Australia’s Consumer Inflation Expectations for July came out as 6.3% versus 5.9% expected and 6.7% prior.
Elsewhere, the US 10-year Treasury yields rose four basis points (bps) to 2.95% at the latest while its 2-year counterpart rose 3.5% the previous day, at 3.18% by the press time. It’s worth noting that the yield curve marked heavy inversion with the 10-year mark, which in turn magnified recession woes after the US inflation data rallied to a 40-year high and the Bank of Canada (BOC) announced a 100 bps rate hike.
Amid these plays, S&P 500 Futures drops 0.35% intraday at the latest and probe the AUD/JPY bulls.
Previously, a Reuters survey showed that four out of five large Japanese firms are passing on higher commodity costs to customers or intend to do so.
Moving on, risk catalysts will be crucial for the AUD/JPY traders to watch for fresh directions, especially headlines concerning inflation and recession.
Technical analysis
A clear upside break of a five-week-old descending resistance line, now support around 92.85, directs AUD/JPY prices towards the 21-DMA hurdle surrounding 93.30.
Australia's labour market report is out as follows:
- Australia Employment Change June: 88.4K (est 30K, prev 60.6K).
- Unemployment Rate June: 3.5% (est 3.8%, prev 3.9%).
- Participation Rate June: 66.8% (est 66.7%, prev 66.7%.
- Full-time Employment +52.9k.
AUD/USD update
AUD/USD had been bumping along 0.6730 lows for the day and a touch above the low of Tuesday around 0.6725. A break of the Tokyo highs, 0.6761, will potentially lead to a strong correction of the sell-off with 0.6800 in focus as the prior day's highs.
About the Unemployment Rate
The Unemployment Rate released by the Australian Bureau of Statistics is the number of unemployed workers divided by the total civilian labour force. If the rate hikes indicate a lack of expansion within the Australian labour market. As a result, a rise leads to a weakening of the Australian economy. A decrease in the figure is seen as positive (or bullish) for the AUD, while an increase is seen as negative (or bearish).
In recent trade today, the People’s Bank of China (PBOC) set the yuan (CNY) at 6.7265 vs. the last close of 6.7199.
About the fix
China maintains strict control of the yuan’s rate on the mainland.
The onshore yuan (CNY) differs from the offshore one (CNH) in trading restrictions, this last one is not as tightly controlled.
Each morning, the People’s Bank of China (PBOC) sets a so-called daily midpoint fix, based on the yuan’s previous day's closing level and quotations taken from the inter-bank dealer.
- USD/JPY rockets towards 138.00 on the strength of the US dollar.
- US CPI is feeding through into flows and supporting a firmer US dollar.
USD/JPY has run up towards 138.00 printing a high of 137.96 so far, trading 0.44% higher for the day following a move from 137.28 the low. Central bank divergence is in play and supporting the greenback.
The US dollar surged to a 20-year high against as per the DXY index which measures the greenback vs a basket of currencies. The euro also broke below parity after data on Wednesday showed US Consumer Price Inflation surged to a 40-1/2-year high in June. CPI reached 3% last month as gasoline and food costs remained elevated, more than the 1.1% expected by economists polled by Reuters.
Meanwhile, in other data, the Fed's Beige Book of regional economic conditions reiterated that the economy expanded at a moderate pace, but “several Districts reported growing signs of a slowdown in demand, and contacts in five Districts noted concerns over an increased risk of a recession." As for Federal Reserve speakers, the Atlanta Fed president Bostic said "everything is in play" at the July policy decision following the "concerning" CPI report, which could infer a 100bp hike. He is worried about the broadening in inflation.
In the bond market, the US yields were mixed following the stronger-than-expected inflation report. The short end sold off while long end rallied. The US 2-10yr curve is now 22bps inverse ''given the expectation of aggressive tightening to come from the Fed as well as the risks to long term growth outlook'', analysts at Westpac explained. ''2-year government bond yields rose from 3.05% to 3.21% before settling at 3.13%, and 10yr government bond yields fell from 2.95% to 2.90%.''
Meanwhile, JPY net short positions increased moderately last week. ''The hawkish positions of other central banks had underpinned speculation that the BoJ may have been pressured into adjusting its YCC policy as soon as last month’s meeting,'' analysts at Rabobank explained. ''The BoJ held its dovish position, but speculation of a move is set to persist in the coming months and this, and some safe-haven flow, has lent some support to the JPY.''
- GBP/JPY is expected to witness more downside after violating 163.00 amid an active risk-off impulse.
- Political instability and Brexit issues have weakened the pound bulls against Tokyo.
- The market consensus for Japan's Industrial Production is in line with the former figures.
The GBP/JPY pair is displaying topsy-turvy moves in the Asian session. The cross has traded in a narrow range of 163.08-163.37, however, the downside remains favored amid a risk-off market mood. The release of the higher inflation rate by the US and the 100 basis points (bps) rate hike by the Bank of Canada (BOC) have not only tuned their respective currencies volatile. The outcomes have also accelerated recession fears in the global economy.
No doubt, the UK economy is going to face the heat significantly as the inflation rate has already sky-rocketed and dim growth prospects are not supporting the Bank of England (BOE) to dictate policy tightening with much freedom. The ongoing political instability in England after the resignation of UK Prime Minister Boris Johnson is challenging their growth prospects. Apart from that, the ongoing issues of the Northern Ireland Protocol (NIP) with the Eurozone are haunting the pound bulls.
Also, the upbeat UK economic data has failed to strengthen the sterling. The Gross Domestic Product (GDP) scaled higher to 0.5% vs. -0.3% reported previously on monthly basis. The Manufacturing production climbed to 2.3%, much higher than the prior release of 1.3%.
On the Tokyo front, investors are awaiting the release of the Japan Industrial Production data. The economic data is seen as stable at -2.8% and -7.2% on an annual and monthly basis respectively. Next week, the interest rate decision by the Bank of Japan (BOJ) will be of utmost importance. The odds are in favor of dovish commentary by BOJ Governor Haruhiko Kuroda.
Having witnessed a 40-year high US inflation, Goldman Sachs (GS) came out with its research suggesting no relief for traders.
The US bank said that 42% of the CPI basket now has a 6-month annualized inflation of above 6%.
It’s worth noting that US Consumer Price Index (CPI) for June jumped to the highest level in 40 years to 9.1% YoY versus 8.8% expected and 8.6% prior. The Core CPI, which excludes volatile food and energy prices, eased to 5.9% from 6% prior but crossed analysts' forecast of 5.8%.
Following the US data, White House (WH) Economic Adviser Brian Deese told CNBC that the CPI data shows the urgency for Congress to pass legislation to spur semiconductor manufacturing in the US, as reported by Reuters. On the other hand, US President Joe Biden mentioned that CPI data is ‘out of data’ as gas prices have fallen.
Also read: US Dollar Index stays firmer above 108.00 as US inflation underpins hawkish Fedspeak
- AUD/USD sellers attack three-day-old support line, extends pullback from 200-HMA.
- Bearish MACD signals, downbeat RSI also keep sellers hopeful.
- Buyers could wait for successful break of 0.6800 for conviction.
AUD/USD holds lower ground near the daily low as bears attack the immediate support line near 0.6730 ahead of Australia employment data on Thursday.
In doing so, the Aussie pair extends the previous day’s U-turn from the 200-HMA amid bearish MACD signals and downbeat RSI (14) not oversold.
With this, AUD/USD bears are all set to refresh the yearly low, currently around 0.6710.
That said, the 61.8% Fibonacci Expansion (FE) of July 10-13 moves, near 0.6700, could lure the pair sellers before the late 2019 low around 0.6670.
Meanwhile, recovery moves could aim for the 0.6800 round figure, also comprising the 200-HMA.
Following that, the 50% Fibonacci retracement level of July 10-12 moves, near 0.6810, could test the AUD/USD buyers before directing them to the July 10 peak of 0.6900.
Overall, AUD/USD prices are likely to witness further downside. However, today’s Aussie jobs report appears important for the pair traders to watch for clear directions.
Also read: Australian Employment Preview: Could it save the aussie?
AUD/USD: Hourly chart
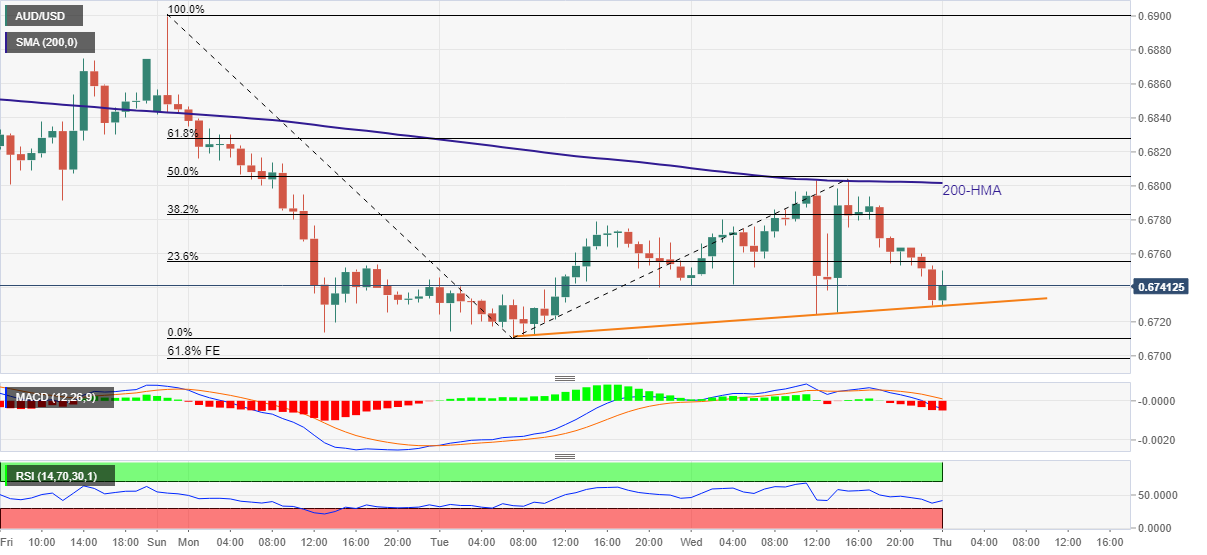
Trend: Further weakness expected
June month employment statistics from the Australian Bureau of Statistics, up for publishing at 01:30 GMT on Thursday, will be the immediate catalyst for the AUD/USD pair traders.
Market consensus suggests that the headline Unemployment Rate may ease to 3.8% from 3.9% on a seasonally adjusted basis whereas Employment Change could rise to 25K from 60.6K. Further, the Participation Rate may remain intact at 66.7%.
Considering the Reserve Bank of Australia’s (RBA) recently hawkish bias, coupled with the trouble in China and mixed data at home, today’s Aussie jobs report become crucial as the AUD/USD trades near the two-year low.
Ahead of the event, analysts at Westpac said,
Given the robust demand for labor as evinced by high levels of job vacancies, Westpac anticipates employment to lift at an around trend pace of 35k in June (market consensus 30k). With participation holding steady at record highs, the unemployment rate should tick downwards to 3.8%.
How could the data affect AUD/USD?
AUD/USD remains pressured around 0.6740, reversing the two-day rebound from the yearly low, as market sentiment sours amid fears of higher Fed rates and recession. The pair’s latest weakness could also be linked to the downbeat prices of iron ore and fears surrounding China’s economic growth, considering its covid conditions.
That said, hopes of upbeat Aussie jobs report to propel the AUD/USD are fewer amid the broad pessimism surrounding economic slowdown and 100 bps Fed rate. However, strong prints of the Employment Change and softer Unemployment Rate won’t go unnoticed.
Considering this, FXStreet’s Valeria Bednarik says
A better-than-anticipated report could push the Aussie higher, but sellers will likely return after the dust settles. The immediate resistance level is 0.6802, Wednesday’s daily high, followed by the 0.6870 price zone.
Technically, AUD/USD needs to cross the monthly resistance line, around 0.6870 by the press time to regain the buyer’s attention. a downward sloping trend line from late January, at 0.6738 by the press time, followed by the latest low near 0.6710, could limit the short-term downside of the pair. It’s worth noting that RSI holds lower grounds while MACD teases bull cross.
Key Notes
Australian Employment Preview: Could it save the aussie?
AUD/USD retreats towards 0.6700 ahead of Australia Employment data
About the Employment Change
The Employment Change released by the Australian Bureau of Statistics is a measure of the change in the number of employed people in Australia. Generally speaking, a rise in this indicator has positive implications for consumer spending which stimulates economic growth. Therefore, a high reading is seen as positive (or bullish) for the AUD, while a low reading is seen as negative (or bearish).
About the Unemployment Rate
The Unemployment Rate released by the Australian Bureau of Statistics is the number of unemployed workers divided by the total civilian labor force. If the rate hikes, indicates a lack of expansion within the Australian labor market. As a result, a rise leads to weaken the Australian economy. A decrease of the figure is seen as positive (or bullish) for the AUD, while an increase is seen as negative (or bearish).
| Index | Change, points | Closed | Change, % |
|---|---|---|---|
| NIKKEI 225 | 142.11 | 26478.77 | 0.54 |
| Hang Seng | -46.79 | 20797.95 | -0.22 |
| KOSPI | 10.85 | 2328.61 | 0.47 |
| ASX 200 | 18.2 | 6621 | 0.28 |
| FTSE 100 | -53.53 | 7156.37 | -0.74 |
| DAX | -149.16 | 12756.32 | -1.16 |
| CAC 40 | -43.96 | 6000.24 | -0.73 |
| Dow Jones | -208.54 | 30772.79 | -0.67 |
| S&P 500 | -17.02 | 3801.78 | -0.45 |
| NASDAQ Composite | -17.15 | 11247.58 | -0.15 |
- EURUSD is dropping towards 1.0000 as higher US CPI may compel Fed to announce a 100 bps rate hike.
- Fed-ECB policy divergence will widen further as ECB may test the waters before going all in.
- Next trigger for the EURUSD price will be the US Retail Sales, which are expected to remain upbeat.
The EURUSD pair has given a downside break of the minor consolidation formed in the initial hour of the Tokyo session. The asset remained lackluster in a 7-pip range and is expected to tumble firmly on an improved inflation report by the US Bureau of Labor Statistics, released on Wednesday. On a broader note, the major is gyrating in a 1.0000-1.0122 range after a downside move from 1.0183.
The US dollar index (DXY) is holding itself around the critical support of 108.00. On Wednesday, the DXY witnessed a steep fall after failing to surpass the 19-year high of 108.56, recorded on Tuesday. The availability of significant offers near the crucial resistance indicates that the DXY bulls need more strength to overstep the 19-year high figure and print a fresh high.
Also Read EUR/USD Forecast: Corrective advance could gather pace once above 1.0120
US CPI has climbed to 9.1%
US Inflation surpasses 9%
On Wednesday, US Consumer Price Index (CPI) climbed to 9.1% as reported by the US agency amid soaring energy bills and food prices. The plain-vanilla annual inflation figure remained higher than the consensus of 8.8% and the prior release of 8.6%. However, the core CPI that excludes food and oil prices trimmed marginally to 5.9% from the former figure of 6% but remained higher than the estimates of 5.7%. One could deduce the fact that goods other than food and oil have shown a minor impact of monetary policy tightening by the Federal Reserve (Fed), although the impact is really minute.
-637933546277547511.png)
Red-hot US CPI favors 100 bps rate hike
There is no denying the fact that the odds of a rate hike by 100 basis points (bps) have picked significant bets. The Fed needs to tighten its policy more strictly to fix the inflation mess. The inflation rate in the US economy has leveled to the UK's and the investing community is aware of soaring large real income shock fears in the pound zone. Therefore, the Fed could follow the footprints of the Bank of Canada (BOC) and may elevate its interest rates by 100 bps to 2.50-2.75% in July monetary policy meeting.
Recession fears have accelerated further
Signs of recession are escalating firmly as bumper rate hikes by the central banks are a new normal now. Most of the Western central banks have pushed their interest rates above 2% in no time, which has triggered recession fears. The central banks are coming upfront with lower growth forecasts. Currently, the growth story of the US economy and its labor market data is solid which will keep the DXY in the dominant position. Going forward, the release of the US Retail Sales will also provide a glimpse of demand in the US, which is due on Friday. The economic data is seen meaningfully higher at 0.8% than the prior print of -0.3%.
Stable HICP figures in Europe
Dominant nations of Europe reported their Harmonized Index of Consumer Prices (HICP) figures on Wednesday, which were in line with the estimates and their prior releases. The European Central Bank (ECB) has not elevated its interest rates yet and the inflation rates in Germany, Italy, and France are still steady. Unlike the other western countries where inflation rates are accelerating at a decent pace. However, this doesn’t warrant that the ECB could bear a delay in interest rate elevation. The central bank needs to turn hawkish sooner.
-637933546611031039.png)
Expectations of wider divergence in Fed-ECB policy
As the US economy has revealed a higher inflation rate and has bolstered the odds of a 100 bps rate hike in July. The fact is going to widen the divergence in Fed-ECB interest rate policy. As the ECB has not elevated its interest rate yet, therefore it will test the waters first and won’t hike its interest rates vigorously. The ECB would go maximum to 50 bps rate hike initially and a simultaneous 100 bps rate hike by the Fed will extend their policy divergence significantly.
EURUSD technical analysis
EURUSD price is auctioning in a descending triangle pattern that signals a volatility contraction followed by an expansion in the same. The downward-sloping trendline of the above-mentioned chart pattern is plotted from Monday’s high at 1.0186 while horizontal support is placed at the magical figure of 1.0000.
The asset has surrendered the cushions of the 20- and 50-period Exponential Moving Averages (EMAs) at 1.0054 and 1.0060, which adds to the downside filters.
Adding to that, the Relative Strength Index (RSI) (14) is on the verge of slipping below the range of 40.00-60.00, which will activate a fresh downside impulsive wave.
A decisive move below the magical figure of 1.0000 will drag the asset towards November 2020 low at 0.9880, followed by June 2000 high at 0.9701.
While a confident move above July 8 high at 1.0191 will drive the asset towards June 6 high at 1.0277. A breach of the latter will expose the asset to hitting June 1 low at 1.0366.
EURUSD hourly chart
-637933538236808612.png)
Elliott Wave trading strategies: DAX 40, FTSE 100, STOXX 50, Dollar Index, EUR/USD [Video]
- DXY snaps two-day downtrend as buyers brace for fresh multi-year high.
- US CPI jumped to 40-year top and propelled calls for 100 bps Fed rate hike.
- Yield curves marked more inversion and magnified recession fears.
- US PPI, Jobless Claims could entertain traders, risk catalysts are the key.
US Dollar Index (DXY) justifies the four-day high inflation figures while snapping a two-day downtrend, up 0.15% near 108.20 during Thursday’s Asian session. The greenback gauge’s latest run-up could also be linked to the fears of global economic slowdown and more pessimism surrounding Europe.
Fed policymakers recently favored the market’s hawkish bias while tracking the 40-year high US inflation data. Recently, San Francisco Federal Reserve Bank President Mary Daly said that her most likely posture is a 75bp hike in July but a 100bp is possible, as reported by the New York Times. Before that Richmond Federal Reserve President Thomas Barkin conveyed his support for higher rates in the last meeting while Cleveland Federal Reserve President Loretta Mester also said, “The data on CPI does not suggest a rate hike in July any smaller than that in June.”
That said, US Consumer Price Index (CPI) for June jumped to the highest level in 40 years to 9.1% YoY versus 8.8% expected and 8.6% prior. The Core CPI, which excludes volatile food and energy prices, eased to 5.9% from 6% prior but crossed analysts' forecast of 5.8%. It should be noted that the BOC announced a 100 bps rate hike by crossing the market forecasts the previous day.
Following the US data, White House (WH) Economic Adviser Brian Deese told CNBC that the CPI data shows the urgency for Congress to pass legislation to spur semiconductor manufacturing in the US, as reported by Reuters. On the other hand, US President Joe Biden mentioned that CPI data is ‘out of data’ as gas prices have fallen.
It should be noted that the Wall Street benchmarks closed negative despite paring most losses while the US 10-year Treasury yields fell four basis points (bps) to 2.93% by the end of Wednesday’s North American session. Further, the US 2-year Treasury yields rose 3.5% on a day to reach the 3.15% level and widened the inversion with the 10-year mark, which in turn magnified recession woes. With this in mind, S&P 500 Futures drops 0.60% by the press time.
Moving on, US Producer Price Index for June and the weekly Jobless Claims will decorate the calendar and entertain DXY traders. However, major attention will be given to the Fedspeak and risk catalysts like chatters surrounding recession.
Technical analysis
A clear rebound from a one-week-old ascending support line, around 107.70 by the press time, directs US Dollar Index towards the fresh multi-year. That said, the higher high around 108.55-60 also keeps DXY bulls hopeful.
| Pare | Closed | Change, % |
|---|---|---|
| AUDUSD | 0.67579 | 0.01 |
| EURJPY | 138.224 | 0.68 |
| EURUSD | 1.00589 | 0.25 |
| GBPJPY | 163.347 | 0.45 |
| GBPUSD | 1.18895 | 0.02 |
| NZDUSD | 0.6128 | 0.01 |
| USDCAD | 1.29788 | -0.32 |
| USDCHF | 0.9781 | -0.35 |
| USDJPY | 137.414 | 0.45 |
- WTI holds lower ground at intraday low, nearly the lowest levels since late February.
- Bearish MACD, downbeat RSI favor joins clear break of 50% Fibonacci retracement level to favor sellers.
- Monthly resistance line holds the key to buyer’s entry.
WTI crude oil prices fade the previous day’s rebound from the 200-DMA as sellers attack $93.50 during Thursday’s Asian session.
In doing so, the black gold portrays sustained trading below the 50% Fibonacci retracement of December 2021 to March 2022 upside while poking the key moving average support.
It’s worth noting that the bearish MACD and an absence of the oversold RSI also keep sellers hopeful to break the $93.13 DMA support.
Following that, the $90.00 psychological magnet will precede the 61.8% Fibonacci retracement level of $86.85 to lure the WTI bears.
Alternatively, recovery moves need to cross the 50% Fibonacci retracement level of $94.42 to tease buyers.
Even so, the $100.00 threshold and last Friday’s peak near $102.80 could test the energy bulls before directing them to the monthly resistance line surrounding $104.20.
Overall, WTI remains on the bear's radar even if the 200-DMA challenges the immediate downside of the commodity prices.
WTI: Daily chart
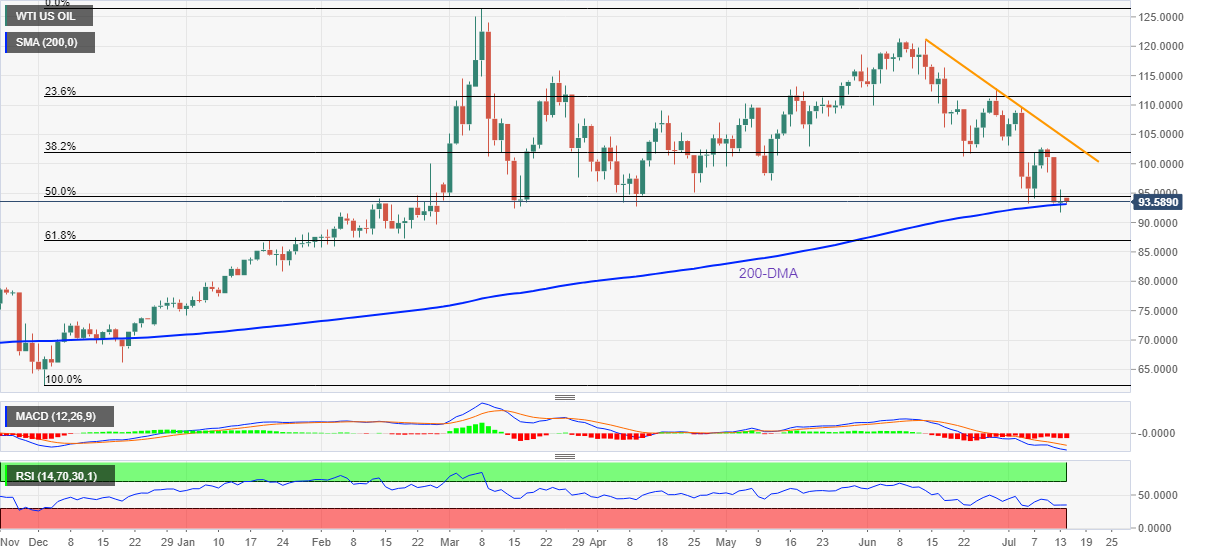
Trend: Further weakness expected


© 2000-2026. All rights reserved.
This site is managed by Teletrade D.J. LLC 2351 LLC 2022 (Euro House, Richmond Hill Road, Kingstown, VC0100, St. Vincent and the Grenadines).
The information on this website is for informational purposes only and does not constitute any investment advice.
The company does not serve or provide services to customers who are residents of the US, Canada, Iran, The Democratic People's Republic of Korea, Yemen and FATF blacklisted countries.
Making transactions on financial markets with marginal financial instruments opens up wide possibilities and allows investors who are willing to take risks to earn high profits, carrying a potentially high risk of losses at the same time. Therefore you should responsibly approach the issue of choosing the appropriate investment strategy, taking the available resources into account, before starting trading.
Use of the information: full or partial use of materials from this website must always be referenced to TeleTrade as the source of information. Use of the materials on the Internet must be accompanied by a hyperlink to teletrade.org. Automatic import of materials and information from this website is prohibited.
Please contact our PR department if you have any questions or need assistance at pr@teletrade.global.
transfers