- Analytics
- News and Tools
- Market News
CFD Markets News and Forecasts — 13-07-2022
San Francisco Federal Reserve Bank President Mary Daly on Wednesday that her most likely posture is a 75bp hike in July but a 100bp is possible she said as reported by the New York Times.
On Tuesday Daly said she believes the US economy will slow to below 2% annual growth as the Fed raises interest rates, but there's enough momentum that it won't stop growing.
"I do expect the unemployment rate to rise slightly, but nothing (like).... what people would think of as a recession," Daly said in an interview on LinkedIn.
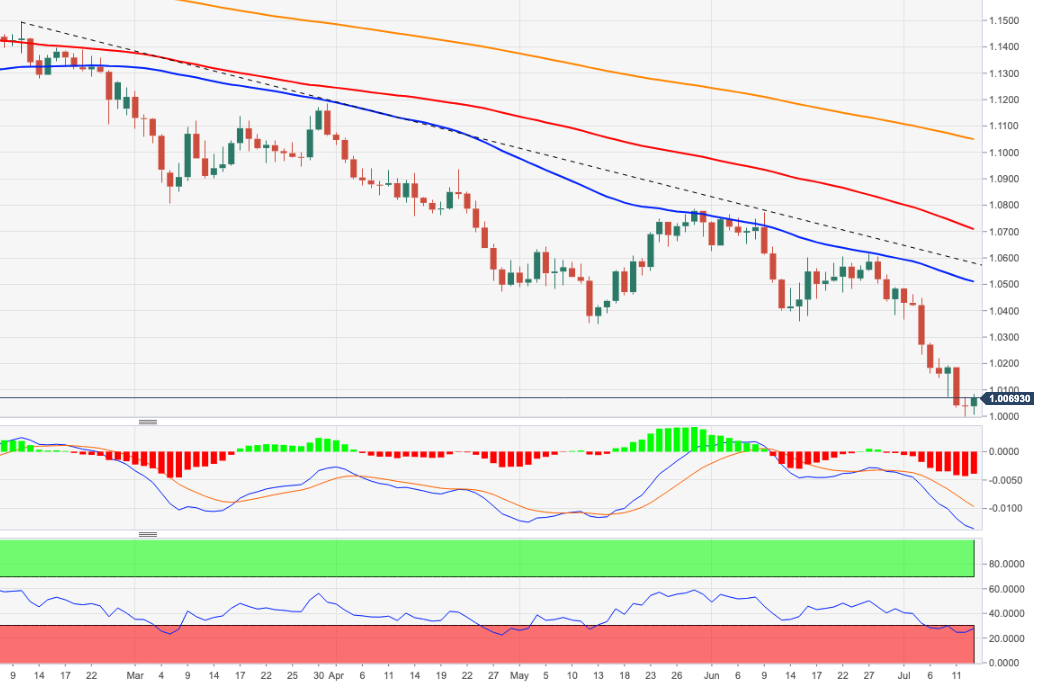
USD/CHF takes the bids to refresh intraday high around 0.9810 to post the first daily gains in three during Thursday’s Asian session.
In doing so, the Swiss currency (CHF) pair justifies the hawkish bias portrayed by the USD/CHF options traders.
That said, the one-month risk reversal (RR) for the USD/CHF, a spread between the call options and the put options, brace for the second weekly run-up with the latest print of 0.140.
The options market’s optimism for the USD/CHF pair could be linked to the broad US dollar rally amid fears of higher Fed rates and recession. The market’s risk-aversion amplified the previous day after the US Consumer Price Index (CPI) for June jumped to the highest level in 40 years to 9.1% YoY versus 8.8% expected and 8.6% prior.
- Silver fades corrective pullback from yearly low, takes offers to renew daily bottom of late.
- 200-HMA, weekly descending trend line restricts short-term upside.
- Nearby ascending trend line holds the key to mid-$18.00s.
Silver (XAG/USD) remains pressured at around $19.15, reversing the previous day’s rebound during Thursday’s Asian session.
In doing so, the bright metal extends pullback from the 200-HMA and a one-week-old resistance line while refreshing the intraday low.
Given the impending bear cross of the MACD, the XAG/USD prices are likely to extend the latest weakness towards a three-day-old support line, near $18.90 by the press time.
Should the quote fails to rebound from $18.90, the recent multi-month low of $18.74 could offer an intermediate halt before directing the commodity bears towards the 61.8% Fibonacci Expansion (FE) of July 05-13 moves, near $18.50.
Alternatively, a clear upside break of the $19.35 resistance confluence could propel the silver prices towards the 50% Fibonacci retracement (Fibo.) of July 05-12 moves, at $19.47.
Following that, a run-up towards the July 05 peak of $20.20 can’t be ruled out.
That said, silver prices are likely to decline further to the lowest levels since the mid-2020s.
Silver: Hourly chart
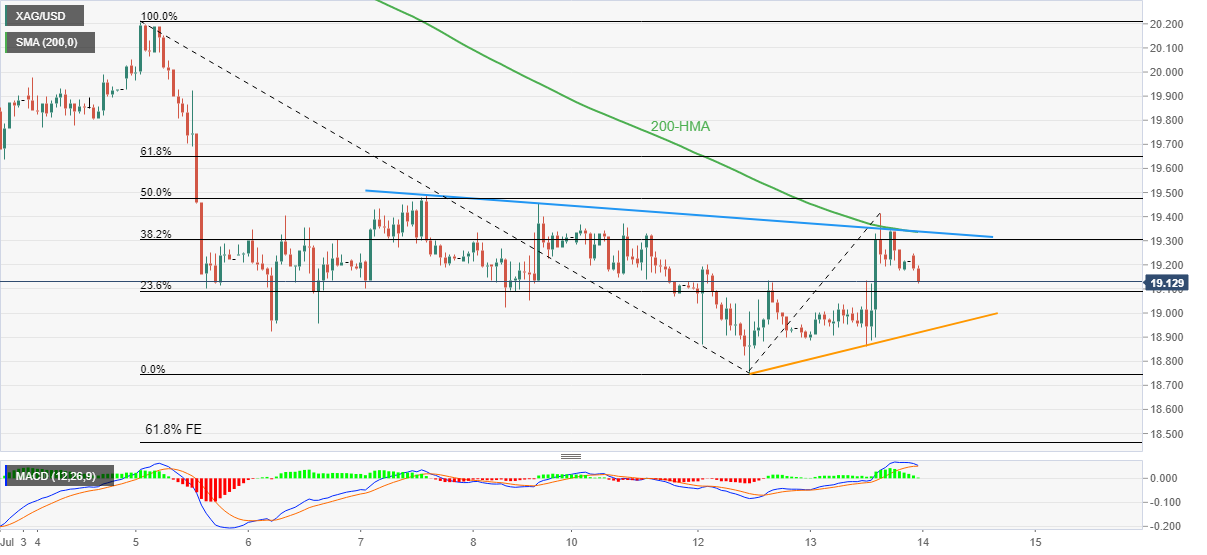
Trend: Further weakness expected
- NZDUSD takes offers to reverse the previous day’s gains.
- US CPI propelled odds of the higher Fed rate, recession.
- RBNZ’s repeated commentary, economic fears disappointed bulls.
- Second-tier US data may entertain traders, risk catalysts will be crucial for fresh impulses.
NZD/USD remains pressured around 0.6120, snapping the two-day rebound from the yearly low, as risk-aversion weighs on the Antipodeans during Thursday’s Asian session. The Kiwi pair’s latest weakness could also be linked to the Reserve Bank of New Zealand’s (RBNZ) failure to impress bulls even with the 50 basis points (bps) rate hike.
A 40-year high in the US inflation joined a larger-than-life rate hike from the Bank of Canada (BOC) propelled market fears of inflation and recession of late. That said, US Consumer Price Index (CPI) for June jumped to the highest level in 40 years to 9.1% YoY versus 8.8% expected and 8.6% prior. The Core CPI, which excludes volatile food and energy prices, eased to 5.9% from 6% prior but crossed analysts' forecast of 5.8%. It should be noted that the BOC announced a 100 bps rate hike by crossing the market forecasts the previous day.
Following the US data, White House (WH) Economic Adviser Brian Deese told CNBC that the CPI data shows the urgency for Congress to pass legislation to spur semiconductor manufacturing in the US, as reported by Reuters. On the other hand, US President Joe Biden mentioned that CPI data is ‘out of data’ as gas prices have fallen.
Recently, Richmond Federal Reserve President Thomas Barkin conveyed his support for higher rates in the last meeting. On the same line, Cleveland Federal Reserve President Loretta Mester also said, “The data on CPI does not suggest a rate hike in July any smaller than that in June.”
It should be noted that RBNZ matched market expectations of lifting the benchmark rates to 2.5% from 2.0% the previous day. However, the reason for the Kiwi pair’s pullback could be linked to the RBNZ Rate Statement as it said, “Committee noted that while there are near-term upside risks to consumer price inflation, there are also medium-term downside risks to economic activity,” per Reuters. It’s worth noting that the New Zealand central bank’s repeat of May’s Official Cash Rate (OCR) track of peaking just below 4.00% in 2023 also weighed on the NZD/USD prices after the release.
Amid these plays, the Wall Street benchmarks closed negative despite paring most losses while the US 10-year Treasury yields fell four basis points (bps) to 2.93%. It’s worth noting that the US 2-year Treasury yields rose 3.5% on a day to reach the 3.15% level and widened the inversion with the 10-year mark, which in turn hints at recession.
Moving on, NZD/USD traders should pay attention to the inflation and recession updates, as well as the second-tier US data for fresh impulse. Though, major attention will be given to the risk catalysts for clear directions.
Technical analysis
Any recovery remains elusive until NZD/USD trades successfully beyond the 0.6175 resistance confluence including the previous support line from early May and a monthly descending trend line.
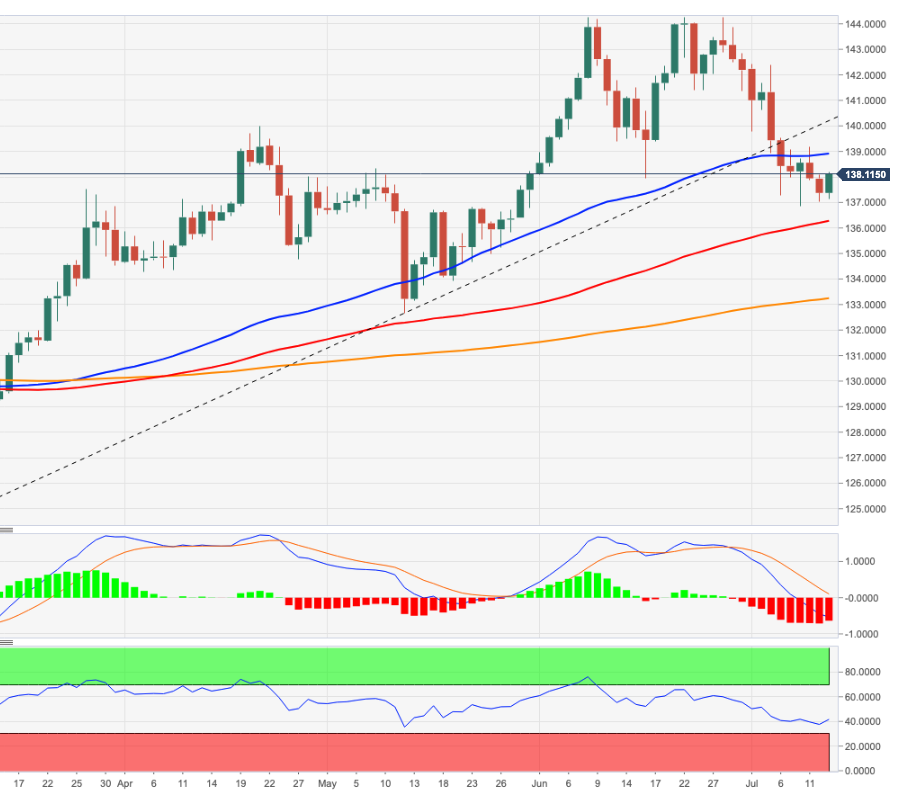
- The EUR/JPY remains heavy in the week, down 0.25%.
- Sentiment remains negative, meaning that the EUR/JPY might be under selling pressure.
- EUR/JPY is neutral-bearish, and a break below 138.00 might send the pair towards 136.00.
The EUR/JPY is almost flat as the Asian Pacific session begins, though on Wednesday finished on a higher note, gaining 0.57% despite a dampened market sentiment spurred by hot US inflation at 41-year highs, Fed stakes of hiking 100 bps elevated, and consequently, a possible recession due to restrictive monetary policy worldwide. At the time of writing, the EUR/JPY is trading at 138.13, slightly up 0.09%.
EUR/JPY’s Wednesday price action illustrates the cross-currency beginning trading around 137.30s, consolidating around the 137.30s-75 area before European traders got to their offices. At that time, the pair seesawed between 137.22-137.96 on mixed EU economic data but rallied in tandem with the EUR/USD. Once the latter tumbled below parity and quickly recovered, it rallied towards daily highs above 1.0100. So, the EUR/JPY followed suit and reached a Wednesday’s high at 138.79, and once the dust settled down, the cross dived towards the 138.10s area.
EUR/JPY Daily chart
From a technical analysis perspective, the EUR/JPY is neutral. On the upside, it has the 20 and 50-day EMAs, but on the downside, the 100 and 200-day EMAs. Oscillators, led by the Relative Strength Index (RSI), are in bearish territory, tilting the pair slightly to the downside and further cementing that, is EUR/JPY buyers’ failure to conquer the 50-day EMA at 139.07, exposing the pair to selling pressure.
Therefore, the EUR/JPY first support would be the 138.00 figure. Once cleared, the next support would be the confluence of the July 6 and July 12 swing lows around the 136.85-137.01 area, followed by a challenge to the 100-day EMA at 136.33.

EUR/JPY Key Technical Levels
- AUD/USD fades the previous day’s recovery moves after a volatile day.
- US dollar gained on multi-year high inflation data before Wall Street gains saved Aussie.
- Yield curve inverted sharply and propeled recession fears, keeping bears hopeful.
- Aussie data for June hints at softer Employment Change, Unemployment Rate.
AUD/USD fails to extend the corrective bounce off the two-year low as it takes offers to renew the intraday low around 0.6745 during Thursday’s initial Asian session. In doing so, the Aussie pair portrays the market’s fears of recession, as well as the Fed’s aggression, ahead of the key Australia employment data for June.
Having seen a four-decade high US inflation, markets were bombarded with calls for higher rates and the yield curve spread recession fears by widening further. However, mixed reactions from the US politicians appeared to have helped the AUD/USD recover some of the losses before recalling the bears.
That said, US Consumer Price Index (CPI) for June jumped to the highest level in 40 years to 9.1% YoY versus 8.8% expected and 8.6% prior. The Core CPI, which excludes volatile food and energy prices, eased to 5.9% from 6% prior but crossed analysts' forecast of 5.8%.
Following the data, White House (WH) Economic Adviser Brian Deese told CNBC that the CPI data shows the urgency for Congress to pass legislation to spur semiconductor manufacturing in the US, as reported by Reuters. On the other hand, US President Joe Biden mentioned that CPI data is ‘out of data’ as gas prices have fallen.
Recently, Richmond Federal Reserve President Thomas Barkin conveyed his support for higher rates in the last meeting. On the same line, Cleveland Federal Reserve President Loretta Mester also said, “The data on CPI does not suggest a rate hike in July any smaller than that in June.”
That said, the Wall Street benchmarks closed negative despite paring most losses while the US 10-year Treasury yields fell four basis points (bps) to 2.93%. It’s worth noting that the US 2-year Treasury yields rose 3.5% on a day to reach the 3.15% level and widened the inversion with the 10-year mark, which in turn hints at recession.
Moving on, Australia’s Consumer Inflation Expectations for July will precede the June month employment report to direct short-term AUD/USD moves. Forecasts suggest an easing in the headline Employment Change figure to 25L versus 60.6K prior whereas Unemployment Rate is expected to ease to 3.8% versus 3.9% previous readings.
Also read: Australian Employment Preview: Could it save the aussie?
Technical analysis
Unless crossing the monthly resistance line, around 0.6870, AUD/USD stays on the bear’s radar. However, a downward sloping trend line from late January, at 0.6738 by the press time, followed by the latest low near 0.6710, could limit the short-term downside of the pair. It’s worth noting that RSI holds lower grounds while MACD teases bull cross.
“I haven't seen any solid proof that inflation has reached its peak,” said Cleveland Federal Reserve President Loretta Mester said while speaking at the Bloomberg interview.
Key comments
The CPI report was uniformly negative.
We don't need to decide on rates today.
Says she is not seeing any convincing evidence that inflation has peaked.
At the July meeting, we'll talk about the policy path.
Tightening must be done carefully, purposefully.
Fed will need to extend well beyond the neutral rate.
The data on CPI does not suggest a rate hike in July any smaller than that in June.
FX implications
The news exerts downside pressure on the EUR/USD as it fades the previous day’s corrective pullback while retreating to 1.0050 during the early Asian session on Thursday.
“When looking at Germany and Italy, the immediate economic repercussions of Russia's plan to restrict supply in mid-June are likely to be limited,” said global rating agency Moody’s on late Wednesday.
Additional comments
Russian gas cuts will prevent reserves from amassing quickly before the winter season.
If Russian supplies don't begin when maintenance on Nord Stream I is finished at the end of July there will be an increase in energy prices.
If Russian supplies stop flowing when the maintenance on Nord Stream I is complete, governments will be compelled to implement some type of rationing.
When Russian gas supplies are cut off, negative economic impacts that will increase both countries' debt burdens.
Italy's financial situation, which is currently difficult, will probably get worse if it is completely cut off from Russian supplies.
Italy could surpass its goal of becoming free of Russian gas by 2025.
Germany's target of reducing its dependency on Russian gas to 10% by 2024 seems ambitious.
Market reaction
The analytics from the global rating giant adds strength to the bearish bias over the EUR/USD. That said, the pair was last seen pressured around 1.0050.
Also read: EU cuts Euro-Area GDP forecast, sees 7.6% inflation, draft shows – Bloomberg
- The confluence of trendline and 100-MA has acted as a hurdle for the pound bulls.
- A (40.00-60.00) range by the RSI (14) hints at a consolidation ahead.
- An establishment below the psychological support of 1.2000 has activated a longer-term downside bias.
The GBP/USD pair is displaying a lackluster performance in the early Tokyo session as the traded range is peanuts against usual. After a volatile Wednesday, the cable looks to turn sideways to ease-off standard deviation first and then will look for a decisive move. On a broader note, after surrendering the psychological support of 1.2000, odds are favoring for a downside bias. Therefore, investors should take more precautions on taking longs.
The greenback bulls have comfortably defended the confluence of the downward sloping trendline plotted from June 27 high at 1.2324 and the 100-period Simple Moving Average (SMA) near 1.1950. Also, the cable has slipped below the 20-period Exponential Moving Average (EMA) at 1.1900, which signals that the short-term trend has also turned southwards.
Meanwhile, the Relative Strength Index (RSI) (14) has shifted into the 40.00-60.00 range, which signals a consolidation ahead.
The cable is expected to display more losses if the asset drops below Monday’s low at 1.1866. An occurrence of the same will drag the asset to the round-level support of 1.1800, followed by a 26 March 2020 low at 1.1777.
Alternatively, a decisive move above Friday’s high of 1.2056 will send the asset towards July 4 high at 1.2161. A breach of the latter will drive the cable towards June 28 high at 1.2292.
GBP/USD hourly chart
-637933485043504023.png)
“The euro area’s rebound from the pandemic will be weaker than anticipated while inflation will be faster because of Russia’s war in Ukraine, according to draft projections by the European Commission,” per Bloomberg.
More details
With surging prices crimping demand and the danger of winter energy shortages draining confidence, gross domestic product is likely to advance 2.6% this year and 1.4% in 2023 -- down from May predictions for gains of 2.7% and 2.3%, according to new forecasts from the European Union executive arm seen by Bloomberg.
Inflation, already at a record that’s more than four times the European Central Bank’s 2% target, is now seen at 7.6% in 2022 and 4% next year, up from 6.1% and 2.7%.
The predictions may still change before they are officially published Thursday.
Some economists see a recession in Europe as inevitable, even without the Kremlin halting energy supplies, with inflation also likely to remain elevated. That’s complicating the task of the ECB, which is only just embarking on a first interest-rate increase in more than a decade.
FX implications
EUR/USD remains pressured around the lowest levels since December 2002 by the press time. The major currency pair was last seen around 1.0057.
- USD/CAD is facing barricades around 1.2980 amid a rangebound DXY.
- The BOC has paddled its interest rates by 1% to tame the soaring inflation.
- An inflation rate above 9% in the US economy has opened doors for a 100 bps rate hike by the Fed.
The USD/CAD pair attempted a rebound from 1.2940 in the New York session and is now facing barricades around 1.2980 as the US dollar index (DXY) has stabilized around 108.00. Earlier, the asset displayed wild swings after the Bank of Canada (BOC) elevated its interest rate by 100 basis points (bps). Adding to that, the strong Consumer Price Index (CPI) report by the US also added fuel to the fire.
BOC Governor Tiff Macklem announced a rate hike by a whopping figure of 1% to 2.5%. The consensus for the extent of the rate hike was 75 basis points (bps). It takes a cold heart to announce a mega rate hike. To tame the inflation, the BOC was forced to create difficulties for the borrowers.
The extent of a rate hike is itself dictating that the inflation monster is no more a joke now. Costly fossil fuels and food products are accelerating the price pressures swiftly and the central bank was left with no other option than to announce the unusual.
Meanwhile, the DXY rebounded firmly after hitting a low of 107.48 on Wednesday. The inflation rate in the US economy has climbed to 9.1%, much higher than the estimates and the prior release of 8.8% and 8.6% respectively. Apart from that, the core CPI has been trimmed to 5.9% from the former print of 6%.
The higher inflation rate has bolstered the odds of one more 75 bps rate hike by the Federal Reserve (Fed). No doubt, the Fed could also follow the footprints of the BOC and may announce a rate hike by 100 bps as the plain-vanilla CPI has surpassed 9% and prior rate hikes have managed to bring a minute trim in the core CPI.
- Gold price has been a volatile asset on a mixed day of sentiment in markets.
- US CPI data has been a catalyst for volatility in the financial and commodities pace.
- The US dollar is sucking up the flow in forex and weighing gold.
Gold Price (XAU/USD) is higher by 0.4% in the late New York trade on Wednesday. The yellow metal has rallied from a low of $1,707.16 to reach a high of $1,745.42 so far on the day. The outlook is mixed for the yellow metal following a technical move lower that has corrected sharply in North American trade while the fundamentals open up further downside for precious metals and the Federal Reserve will need to remain aggressive at a time when global growth concerns are elevated.
Gold driver of the day, US inflation, CPI
It has all been about the US inflation report on Wednesday. The US June Consumer Price Index climbed 1.3% MoM, leaving the annual rate at 9.1% YoY. This is much stronger than May’s 8.6% print. The consensus was expectations for an 8.8% lift in prices. However, there was a big jump in last month’s gasoline prices that surged and added 0.5% to the CPI. Analysts at ANZ bank argued that the more worrying aspect of the report was the intensification in core inflation pressures. ''Services, less energy services which account for 57% of the CPI, rose 5.5% YoY. Outside of volatility in energy prices, inflation pressures are broadening. All items less food, shelter and energy rose 0.8% vs 0.6% MoM in May.'' The data least to the yield curve to invert sharply as the risk of the Federal reserve hiking by 75bps blitz financial and commodities markets.

US yields invert, Fed expectations are elevated
The US yield curve inverted sharply as CPI inflation in the US exceeded expectations, with the yield on the US 2-year yield now 3.13%, versus 2.91% for the 10-year. The markets now anticipate that the Fed will raise by another 75bps in not only July's meeting, but as far out as September as well. In fact, analysts at TD Securities note that the market is now pricing in 85bp of hikes in July and 68bp in September.'' We think the Fed will hike 75bp in July and 50bp in September, but see the risk of a 75bp in September. We took off our short 2y Treasury position but remain long 2y TIPS BE and long 30y real rates.'' For gold, which yields nothing for investors, has come under pressure in the face of higher global rates. ''There is no way around it, the Fed has an inflation problem on its hands and the USD will continue to remain king of FX,'' the analysts at TDS argued.
US dollar sucking up the flows
With US inflation surging to a 40-1/2-year high in June, the US dollar has surged to a 20-year high against a basket of currencies and the euro broke below parity against the greenback for the first time since November 2002. The US dollar smile theory has been in play for many months and the DXY topped at 108.583 on Wednesday for a fresh bull cycle high. The USD tends to strengthen both when the US economy outperforms its peers but also when the US economy is extremely weak, so while there are concerns that the Fed is between a rock and hard place, the greenback would be expected to suck up the flow either way which is a headwind for gold as the Fed will need to remain extremely aggressive at a time when growth concerns are becoming more prominent. ''There is no way around it, the Fed has an inflation problem on its hands and the USD will continue to remain king of FX,'' analysts at TD Securities argued.
Also read: Gold Price Forecast: Post-CPI recovery stalls below critical resistance
Gold outflows steepest since Covid-19 crisis
The analysts at TD Securities explained that while the steepest outflows from broad commodity funds since the Covid-19 crisis sparked a cascade of selling, including from CTA funds, the strong inflation print could still fuel additional downside. ''Indeed, the still extremely bloated length remaining in gold markets from proprietary traders that was accumulated during the pandemic appears complacent in the face of a steadfastly hawkish Fed. In a liquidation vacuum, these positions are now vulnerable, which suggests the yellow metal remains prone to further downside still.''
Gold Price technical outlook
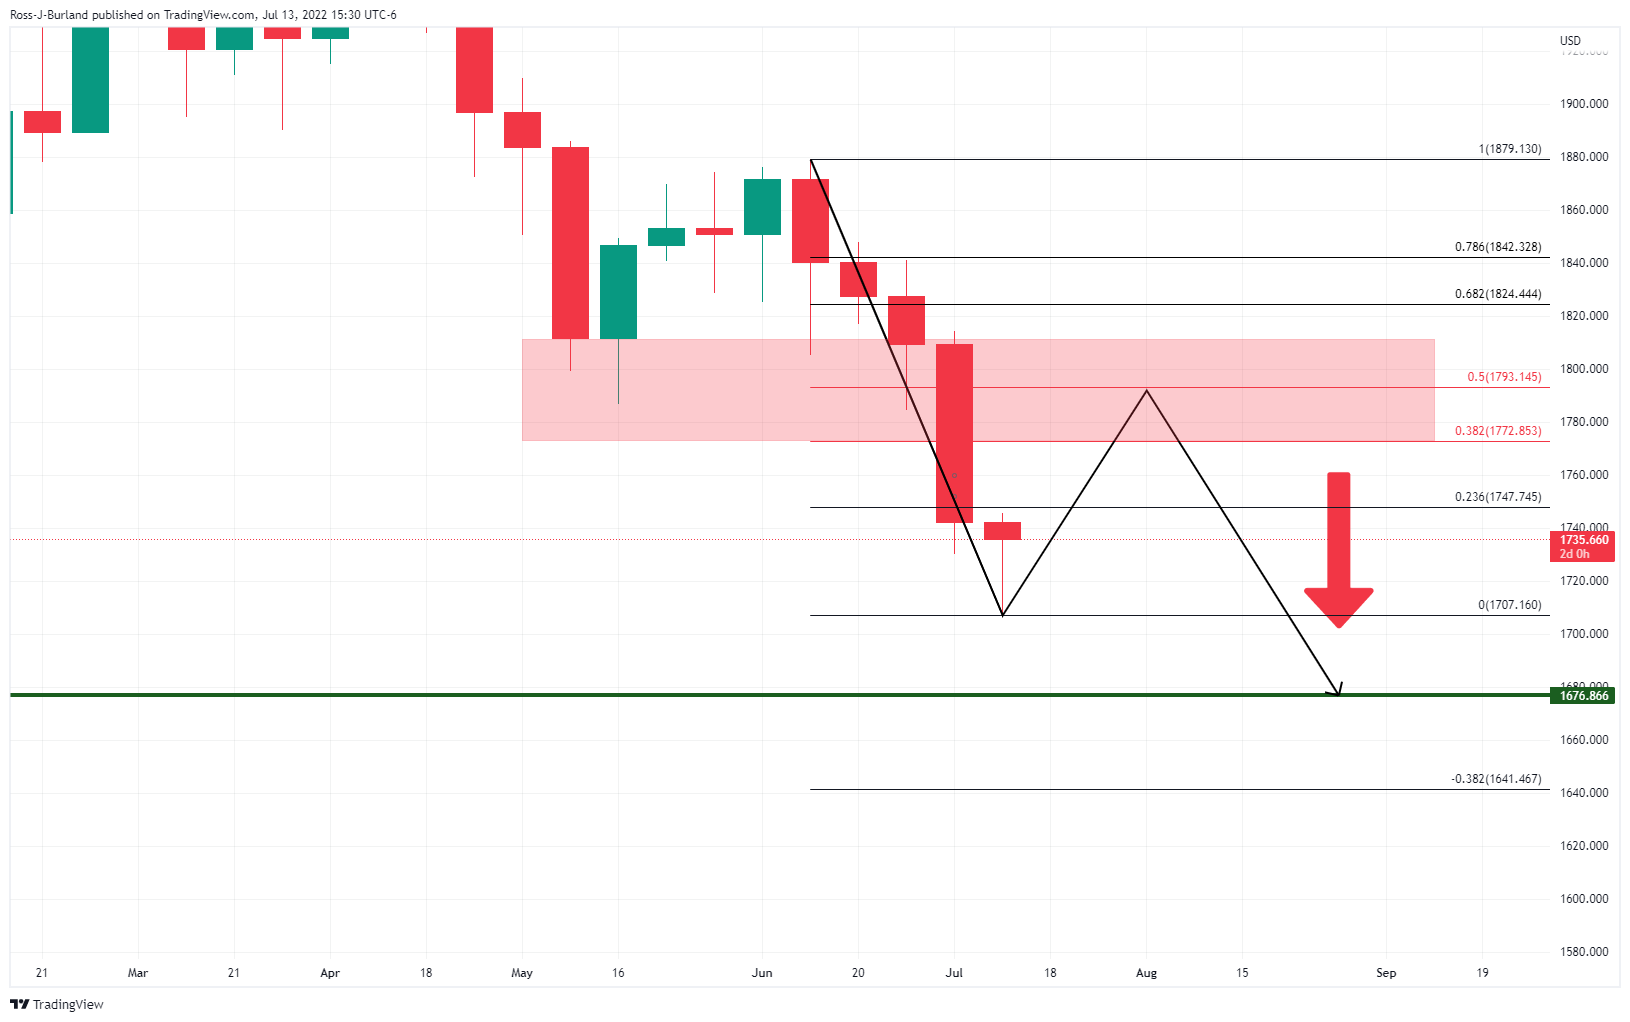
From a weekly perspective, the price could be regarded as extended and a correction is arguably feasible at this juncture. There is a price imbalance from the current week's highs to the week commencing June 27 low. This area meets a 50% mean reversion and a 38.2% Fibonacci retracement before then. However, the focus in the main is on the downside towards monthly lows as illustrated on the chart above.
Can gold prices hold above $1700 as focus shifts to inflation data?
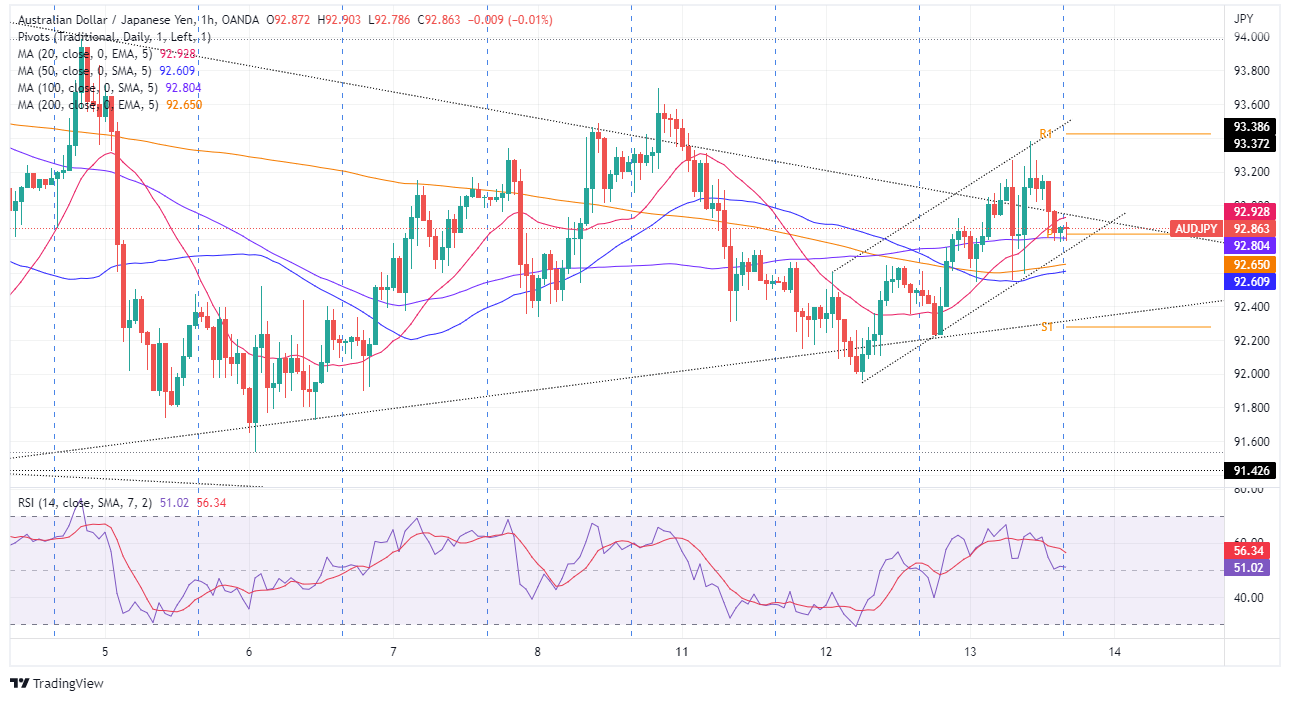
- The inversion of the US yield curve for the 7th straight day exacerbated recession fears, capping AUD/JPY’s upward move.
- AUD/JPY is upward biased, but failures to break above 93.00 opened the door for sellers to send the pair lower.
- The AUD/JPY might tumble towards the 92.20 area in the short term.
The AUD/JPY curtails two days of consecutive losses and rises modestly on Wednesday, close to 0.39%, amidst a dismal market mood. Higher global inflation, US recession fears, and the EU’s energy crisis could begin triggering a flight to safety in the financial markets and helped to put a lid on the AUD/JPY advance, which reached a daily high of around 93.38 before settling around the current price levels. At the time of writing, the AUD/JPY is trading at 92.86.
US equities finished Wednesday’s session with minimal losses but weighed by the further inversion in the US 2s-10s yield curve and money market futures swaps showing the likelihood of a 100 bps rate hike in July, sparked safe-haven flows. So in the last couple of hours, the AUD/JPY slid from around 93.15 to 92.78.
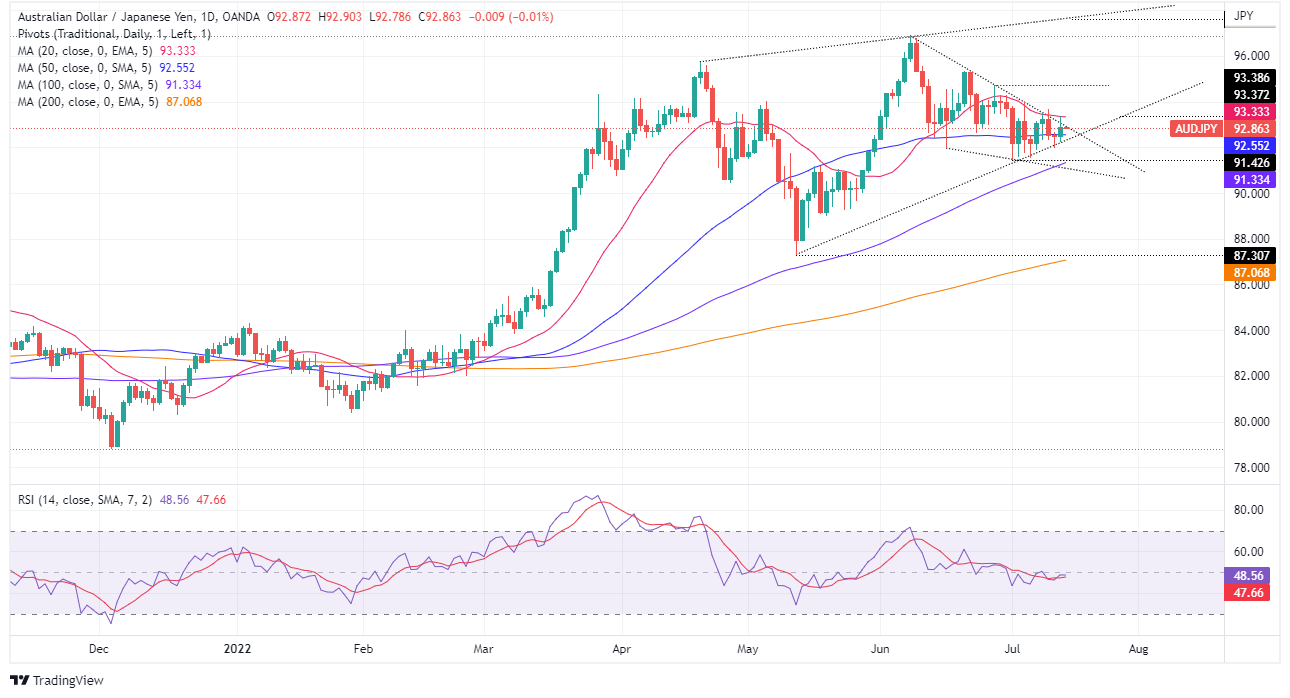
AUD/JPY Daily chart
The AUD/JPY depicts an upward bias, though AUD buyers’ failure to break above the falling wedge illustrated inside a larger rising wedge might open the door for sellers to step in and drag prices lower. Traders should notice that oscillators like the Relative Strength Index (RSI) in negative territory begin to aim lower, further cementing the case for a downward break of both wedges.
Therefore, the AUD/JPY first support would be the 50-day EMA at 92.55. A breach of the latter would expose the July 12 daily low at 91.96, followed by the 100-day EMA at 91.33 and then the 200-day EMA at 87.06.
AUD/JPY 1-hour chart
From a short-term perspective, the AUD/JPY is upwards-to-neutral biased, though the formation of an ascending channel about to be broken to the downside, alongside the breach of the daily pivot point, around the 92.70-80 area, might trip the AUD/JPY pair towards lower prices. Hence, the AUD/JPY path of least resistance is tilted to the downside. The first support would be the 200-hour EMA at 92.65. Break below ill expose the 40-hour EMA at 92.60, followed by the confluence of July’s 12 low and the S1 daily pivot around 92.20-30.
AUD/JPY Key Technical Levels
What you need to take care of on Thursday, July 14:
The American dollar settled marginally lower on Wednesday after the release of the US Consumer Price Index, which soared by 9.1% YoY in June, much worse than the 8.8% expected. The core reading printed at 5.9%, below the previous 6%, but above the 5.8% expected, signaling price pressures are far from over.
The numbers initially spurred risk aversion, with equities diving and government bond yields soaring amid speculation the US Federal Reserve may put larger rate hikes on the table, and hence, increase the risk of a recession.
Germany also published its CPI figure, which was confirmed at 7.6% YoY, as previously estimated.
The EUR/USD pair peaked at 1.0121 but currently trades at around 1.0055, hurt by central banks’ imbalances. The US Federal Reserve has hiked rates multiple times and will likely add another 75 bps this month. The European Central Bank, on the other hand, will start with its modest tightening in July by hiking 25 bps.
Upbeat UK data supported the Pound during European trading hours, as the monthly Gross Domestic Product surged to 0.5% in May, much better than the previous -0.3%. Additionally, Industrial Production in the same month rose by 1.4% YoY, while Manufacturing Production increased by 2.3% YoY, beating expectations. The pair lost ground as the day went by, ending the day at around 1.1890.
The Bank of Canada hiked its policy rate by 100 bps to 2.5% in July, compared to the market expectation for a rate increase of 75 bps. In its policy statement, the BOC acknowledged that it had underestimated inflation since the spring of last year mainly because of global factors. USD/CAD fell to 1.2933, now trading around 1.2980 amid the weak tone of US equities.
The AUD/USD pair holds on to modest gains near 0.6760 ahead of the release of Australian employment data. The country will report June employment data in the upcoming Asian session and is expected to have added a modest 25K new jobs after gaining 60.6K in the previous month, while the Unemployment Rate is foreseen down to 3.8% from 3.9% in May. Ahead of the figures, Australia will also unveil July Consumer Inflation Expectations, with analysts expecting it at 5.9%, down from 6.7% previously.
Gold Price settled at $1,733 a troy ounce, while crude oil prices saw little action, and WTI currently trades at $95.80 a barrel.
Bitcoin Price Prediction: A falling knife or Michael Saylor’s sword in stone pt.2
Like this article? Help us with some feedback by answering this survey:
- WTI bulls are pressured on bearish features in fundamentals.
- However, both OPEC and the IEA have issued warnings that the global energy supply crunch is here to stay.
West Texas Intermediate (WTI) spot crude oil is on the bid on the day but is running into some supply during midday New York. The price is up 0.5% at $96.05 during the time of writing but has fallen from a high of $97.94 and ranged from $93.69 the day's low made in Asia on recession worries.
The price was heavy to start the day despite an unexpectedly strong rise in US inventories. However, the US reported inflation continued to accelerate last month. The Consumer Price Index increased 1.3% last month as gasoline and food costs remained elevated, more than the 1.1% expected by economists polled by Reuters. This morning's number is very high and the dollar index reached 108.59, the best since Oct. 2002, from around 107.9 before the data was released.
Meanwhile, in futures, WTI crude oil for August delivery ended up US$0.46 to settle at US$96.30 per barrel, while September Brent crude, the global benchmark, was last seen up US$0.11 to US$99.60. This outcome follows the plunge to the lowest since April that was made the prior day despite tight supplies on worries rising interest rates will lead to a demand-destroying recession.
Additionally, China's fresh lockdowns due to the tests for the Covid-19 omicron variant in the city, with CNN reporting most of the city of 25 million will be subjected to a new round of testing, is adding to the concerns and is a weight on oil prices. This comes following a two-month lockdown of Shanghai in early June, which cut oil demand by more than one million barrels per day,
Elsewhere, bearish data came from the International Energy Agency that said oil production rose by 690,000 barrels per day last month on higher output from the United States and Russia as it cut its forecast for 2022 oil demand to a rise of 1.7-million barrels per day from its June forecast that expected a 1.8-million barrel increase.
The agency stated that "a worsening macroeconomic outlook and fears of a recession are weighing on market sentiment, while there are ongoing risks on the supply side. For now, weaker-than-expected oil demand growth in advanced economies and resilient Russian supply has loosened headline balances."
In other data, in the agency's weekly inventory survey, showed a rise in stocks last week of 3.3-million barrels, while the consensus analyst estimate predicted a drop of 1.93-million barrels. Also, product inventories rose, with gasoline up 5.8-million barrels and distillates rising by 2.7-million barrels.
Furthermore, both OPEC and the IEA have issued warnings that the global energy supply crunch is here to stay and could still get worse. ''These latest warnings are in line with our view that energy supply risks will continue to rise, and remain the most prominent factor driving energy markets,'' analysts at TD Securities said. They also noted that considering that little progress has been made towards solving structural supply challenges, US President Biden's meetings with Saudi Arabia will garner plenty of attention.
- Silver Price shows signs of bottoming as the US 2s-10s yield curve inversion deepens further towards negative territory.
- Gold and Silver prices stage a recovery after reaching YTD lows in the last couple of days.
- Richmond’s Fed Thomas Barkin commented that the high CPI print makes the case to fight inflation even harder.
Silver (XAGUSD) advances sharply, approaching weekly highs near $19.36 on Wednesday, after tumbling below $19.00 in the early New York session in the release of higher than estimated US inflation data sparked an upward reaction in US Treasury yields, a headwind for XAGUSD prices. However, as the New York session progressed, the white metal recovered some ground and is trading around $19.17.
Recession fears increase, and traders begin to seek safety in precious metals
Risk-aversion is the game’s name, but precious metals appear to have found a bottom. Worries about recession had increased substantially amongst investors, as shown by the US 2s-10s yield curve inversion for the last seventh days, at -0.236%, levels last seen since 2001s. In the meantime, the greenback remains weak, but stages a comeback, as shown by the US Dollar Index losing 0.16%, at 107.995, a tailwind for the silver price.
Also read: AUD/USD climbs above 0.6750s after hot US CPI on a weak US dollar
Before Wall Street opened, the US Bureau of Labor Statistics reported that prices paid by consumers rose the most since 1981, by 9.1% YoY, higher than the 8.8% expected and topping the 8.6% May reading. Meanwhile, inflation excluding volatile items like food and energy, the so-called core CPI, expanded at a rate of 5.9% YoY, less than the previous number, but above estimations of 5.7%, further cementing the case for the Fed 75 bps rate hike.
With US inflation data in the rearview mirror, STIRs money market futures have begun to price in an 84% chance that the Federal Reserve would hike 100 bps while fully pricing a 75 bps increase.
Of late in the New York session, Richmond’s Fed President Thomas Barkin, in an interview with the Wall Street Journal (WSJ), said the high CPI print “makes the case even stronger to continue to be resolute to fight inflation” when asked if he would favor a 100 bps rate hike. Barkin added that the size of the hike “is not nearly as important to me as the destination, which is, where do you want to take forward-looking real rates?”
What to watch
Data-wise, on Thursday, the US economic calendar will feature Initial Jobless Claims, inflation on the producer side, and Fed speakers will update the status of the US economy.
Silver (XAGUSD) Key Technical levels
Richmond Federal Reserve president Thomas Barkin said on Tuesday that headline and core inflation is too high.
Key quotes
- Want to have positive real rates at two-year horizon.
- Supported 0.75-point June rate increase.
- Elevated inflation readings make that harder to achieve.
The US economy is slowing as consumers are buffeted by inflation and pandemic-driven demand for goods returns to more normal levels, he said earlier.
“I definitely see signs of softening,” Barkin said, with the evidence “most pronounced in lower income households” and in parts of the economy that saw demand surge during the pandemic.
Barkin also said he was still trying to determine if that is driven by underlying economic strength, or employers scarred by earlier hiring difficulties and determined to stockpile workers.
- A risk-off impulse was no excuse for the AUD/USD to rise but remains negative in the week.
- US inflation above 9%, for the first time since 1981; Fed odds of a 100 bps hike lie at 84%.
- US 2s-10s yield curve inverted the most since 2001; is recession around the corner?
- The Australia business and consumer confidence surveys show pessimism is increasing amongst Australians.
The Australian dollar found bids during the North American session and is edging up 0.33% on Wednesday after a US Department of Labor report showed US inflation refreshing new 40-year highs amidst a mixed market sentiment, as shown by US equities fluctuating but at a brink of turning negative.
Investors’ sentiment is mixed; the US 2s-10s yield curve signals recession
The AUD/USD is trading at 0.6776 after seesawing on a volatile trading session that witnessed the major dipping towards the 0.6725 daily low, followed by a short-lived rally above the 0.6800 figure, until settling down at around the current price level.
During the New York session, the US Bureau of Labor Statistics (BLS) reported that June’s inflation in the US hit 9.1% YoY, the highest reading since 1981, topping the previous reading at 8.6%. At the same time, inflation that strips volatile items like food and energy, the so-called core CPI, rose by 5.9% YoY, less than May’s 6%, but above expectations of 5.7%, further cementing the case for the Fed 75 bps rate hike.
In the meantime, STIRs money market futures have begun to price in an 84% chance that the Federal Reserve would hike 100 bps whilst fully pricing a 75 bps increase.
US 2s-10s yield curve inverted the most since 2001

Of late during the session, its worth noticing that the US 2s-10s yield curve touched levels last seen in the late 2001s, currently at -0.225%, while the US 3months-10-year curve plunges more than 30 bps, to 0.528%, both signaling that investors recession fears are increasing.
Regarding the Australian economy, last Monday’s Business confidence showed that businesses are becoming more pessimistic, dropping to their lowest level in six months. Despite a bad reading, the report disclosed some positives regarding capacity utilization and forward orders. Concerning Australia’s consumer confidence slipped by 2.5% last week.
What to watch
The Australian economic docket will feature employment reports and consumer inflation expectations. Australia’s Employment Change for June is expected at 30K, less than May’s 60.6K, while Consumer Inflation Expectations are foreseen at 6.8%, more than the previous reading. Across the pond, the US economic calendar will feature Initial Jobless Claims, inflation on the producer side, and Fed speakers will update the status of a battered US economy, with inflation above 9%.
AUD/USD Key Technical Levels
- GBP/USD has been pressured despite hawkish UK data.
- US CPI has been the showdown event for the day, propelling the greenback higher within its bullish cycle.
At the time of writing, GBP/USD is trading at 1.1907 and now higher by some 0.20%, rising from a low of 1.1905 to a high of 1.1966 on what has been a volatile day for financial markets with a lot of important economic data.
Firstly, UK Gross Domestic Product (GDP) was climbing 0.5% in May (estimates were 0.0%) and Industrial Production in June climbed 1.4% (estimates - 0.3%). This is a hawkish set of data with both numbers coming out faster than expected with the latest GDP data showing upward revisions across many sectors.
However, the pound has been hamstrung as the markets were in anticipation of the showdown event from the US in June's Consumer Price Index. The greenback has rallied to a 20-year high against a basket of currencies after data on Wednesday showed US CPI surged to a 40-1/2-year high in June.
The consumer price index increased 1.3% last month as gasoline and food costs remained elevated, more than the 1.1% expected by economists polled by Reuters. This morning's number is staggeringly high and the dollar index reached 108.59, the highest since Oct. 2002, from around 107.9 before the data was released. It is now back down to 107.90 which is lending a hand to the British pound.
However, political pressures could reach a climax Tuesday next week as the new 1922 executive meets, risking further pressures on the pound. Nevertheless, the BoE will likely tighten its monetary policy more than we had previously forecast. On the other hand, in view of high inflation, it could be viewed as staying too cautious, which will not help the bulls. The central bank currently assumes that the additional fiscal aid from the government will have a positive economic effect, while the inflationary effect should be low. Nevertheless, traders are taking note that the economy is likely to weaken significantly in the coming quarters and past data, such as June's, is a mere drop in the ocean.
The BoE's dilemma
Analysts at Commerzbank explained that the example of the BoE is a good illustration of the dilemma that many central banks are facing:
''Uncertainty has been very high for quite some time. The war in Ukraine is adding to this uncertainty. And the problem is that the war, with all its consequences, has an inflationary effect on the one hand, but could also weaken the economy on the other hand.''
''Hawkish comments on the part of BoE members increased, which is probably due to the persistently high inflation,'' the analysts explained.
''In the short term, inflation concerns are likely to be decisive in the BoE's monetary policy decisions. A tighter stance is quite possible in the coming months. After all, the BoE held out the prospect of a 50 bp rate hike for the August meeting at its last meeting.'' However, the analysts argued that ''this is not necessarily positive for the pound, because rising interest rates exacerbate the risk of a stronger economic downturn.''
GBP/USD technical analysis
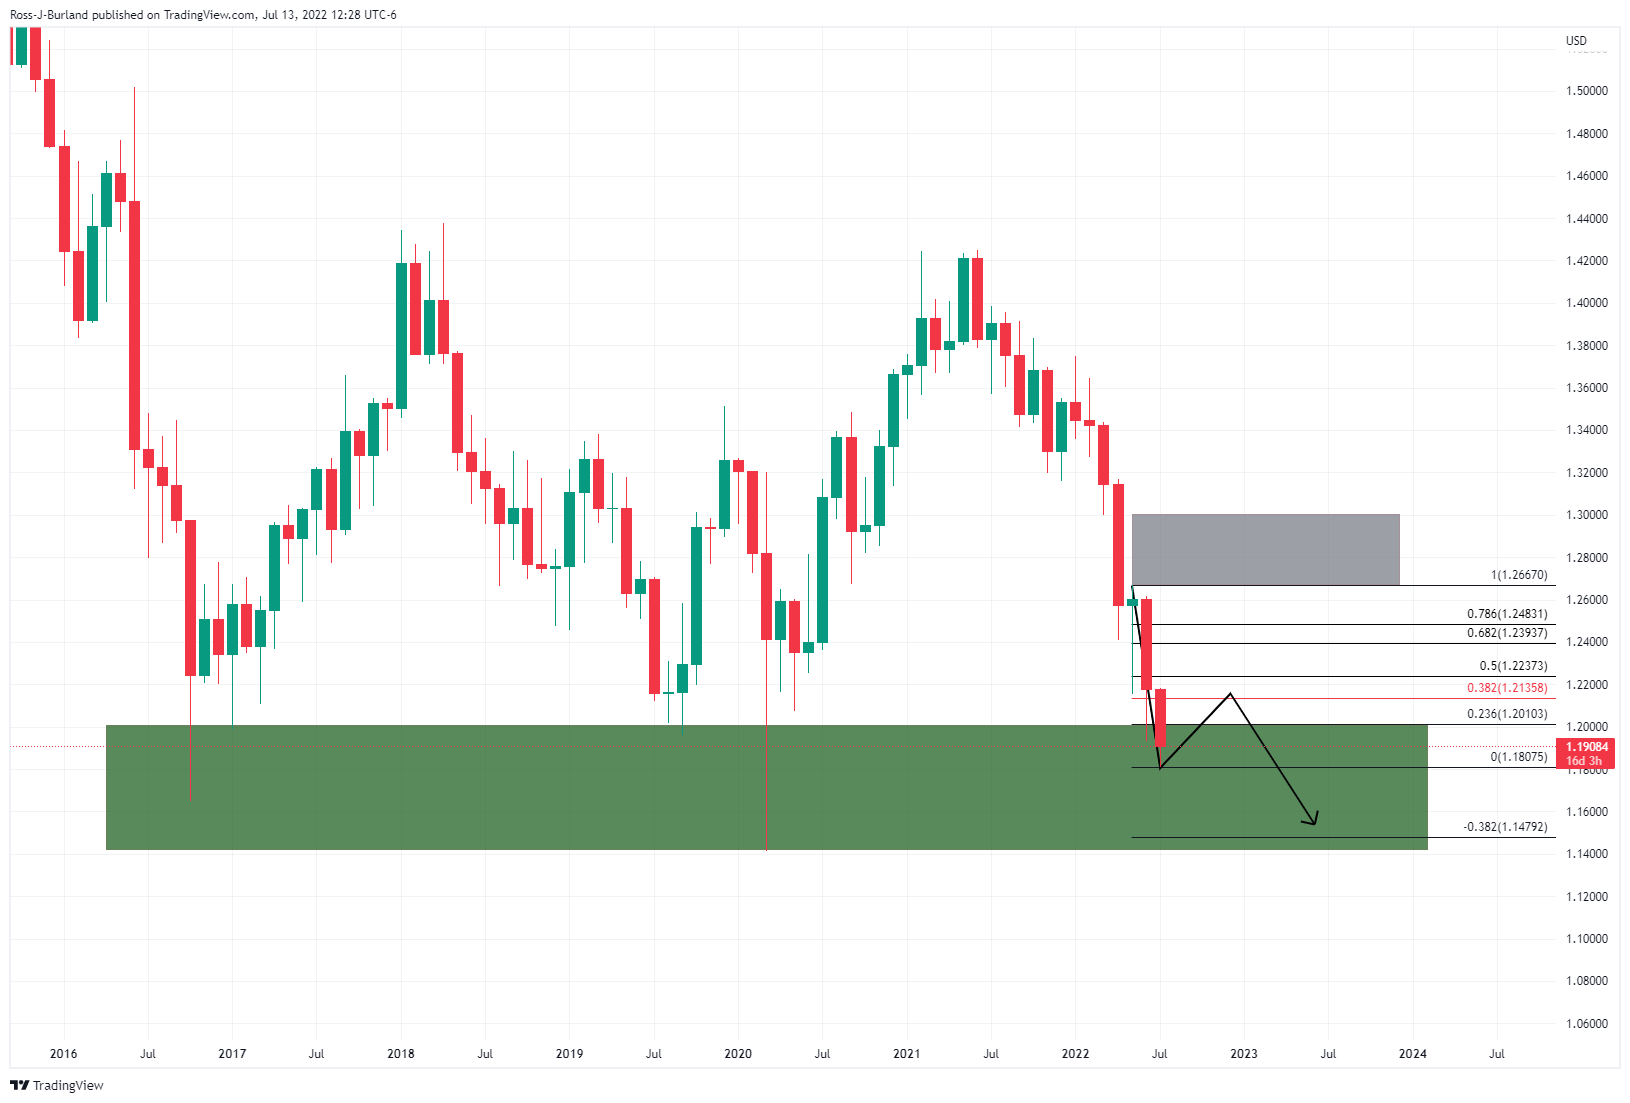
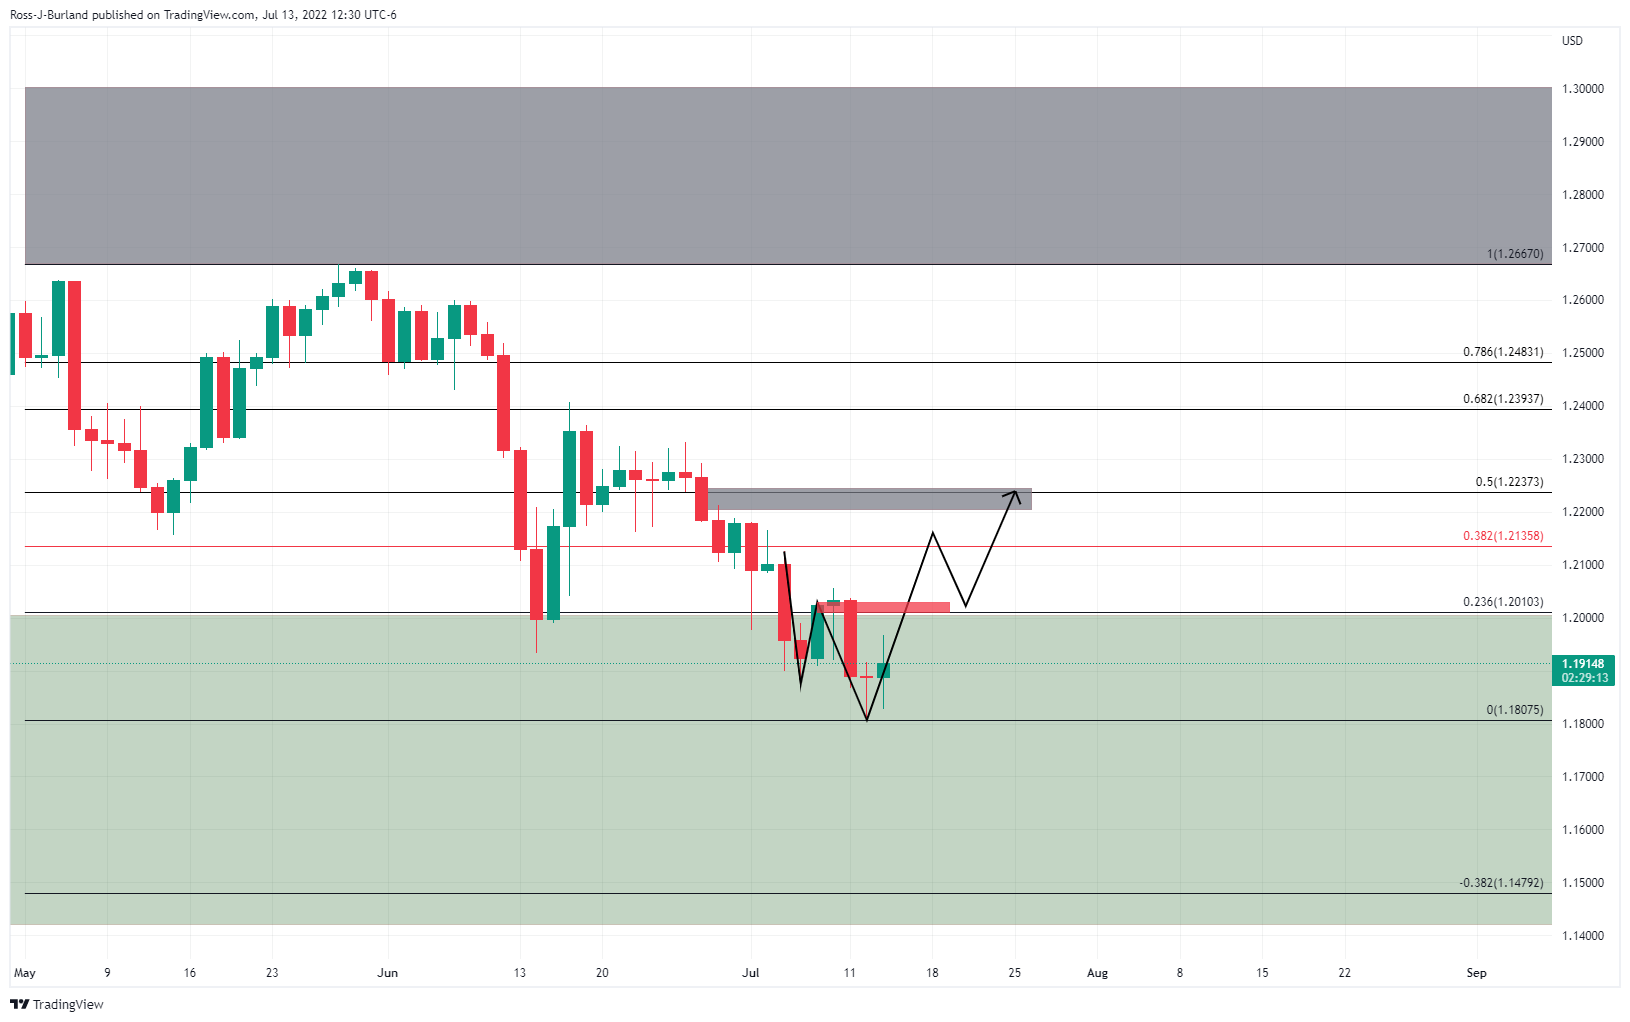
The monthly chart is heavily bearish but a meanwhile correction could be on the cards from the monthly demand area.
As for the daily chart, below, the price could be on the verge of a higher move in this bullish correction. The bulls will need to break the prior highs and in doing so, expose the 38.2% Fibo on the monthly chart and price imbalances, grey zones, above there.
- Gold Price following wild moves in the Treasury market.
- US CPI rises above expectations in June, PPI data on Thurday.
- Stocks decline but trim losses, caution tone prevails among market participants.
Gold Price (XAUUSD) bounced sharply during the last hours and turned positive for the day. The metal bottomed at $1,706 following US inflation data and then redounded rising $40 in a few minutes. It peaked at $1,745, the highest level in three days. Volatility in prices is set to remain elevated on the back of market concerns and wild moves in the Treasury market.
Gold Price not out of the woods yet
Stocks in Wall Street are falling, but are off lows. In money markets, prices reflect inflation as the main concern for Federal Reserve officials in the short-term and a growth crisis later as the main issue. While in the short-term bets for more aggressive rate hikes are rising, prices reflect odds of rate cuts for 2023.
Also read: Gold Price Forecast: Post-CPI recovery stalls below critical resistance
Inflation data triggers volatility
Unwelcome data
The US Labor Department reported Wednesday that the Consumer Price Index (CPI) rose 1.3% in June and 9.1% compared to the previous years, the fastest pace since late 1981. The Core CPI (excludes food and energy) increased 5.9% (y/y), below the 6% of the previous month. The figures were above expectations. The US dollar jumped after the report and then turned negative.
Gold Price initially reacted to a stronger US dollar and higher US yields, falling toward $1,700. When the price looked ready for a slide below to approach the 2021 bottom near $1,675, everything changed. The US 10-year yield fell from 3.07% to 2.90% and the 30-year from 3.22% to 3.08%. The US Dollar Index (DXY) hit a multi-year high at 108.58 and dropped to 107.50. The yellow metal bounced sharply, alleviating the bearish pressure.
Data to hold the key
Later on Wednesday, the Federal Reserve will release the Beige Book about the state of the economy. On Thursday, the Bureau of Labor Statistics will release the Producer Price Index for June. Another strong reading would contribute to raise expectations of a 100 basis point rate hike in July, currently above 60%. Such scenario could be negative for Gold Price. The Labor Department will also release the Weekly Jobless Claims report. Positive news regarding the labor market or growth could be not positive for the yellow metal.
Gold Price shows some not so negative signs
Gold Price rose back above $1,730 and also above the 20-Simple Moving Average in the four-hour chart, currently at $1,735. While above, XAUUSD could holds a positive momentum in the very short-term. The key resistance ahead is $1,750. Above, gold could extend the recovery.
The spike to $1,706 followed by the rebound is a potential reversal that could anticipate further gains, particularly if it breaks above $1,750. A failure, could keep XAUUSD between $1,750 and $1,730.
Despite signs of some consolidation in the short-term, the main trend in Gold Price is bearish. A slide below $1,720 should expose again $1,700. Below the round number there is not much support until the area of the 2021 lows of $1,650.
-637933316139337474.png)
Gold Price Can it hold above $1700?
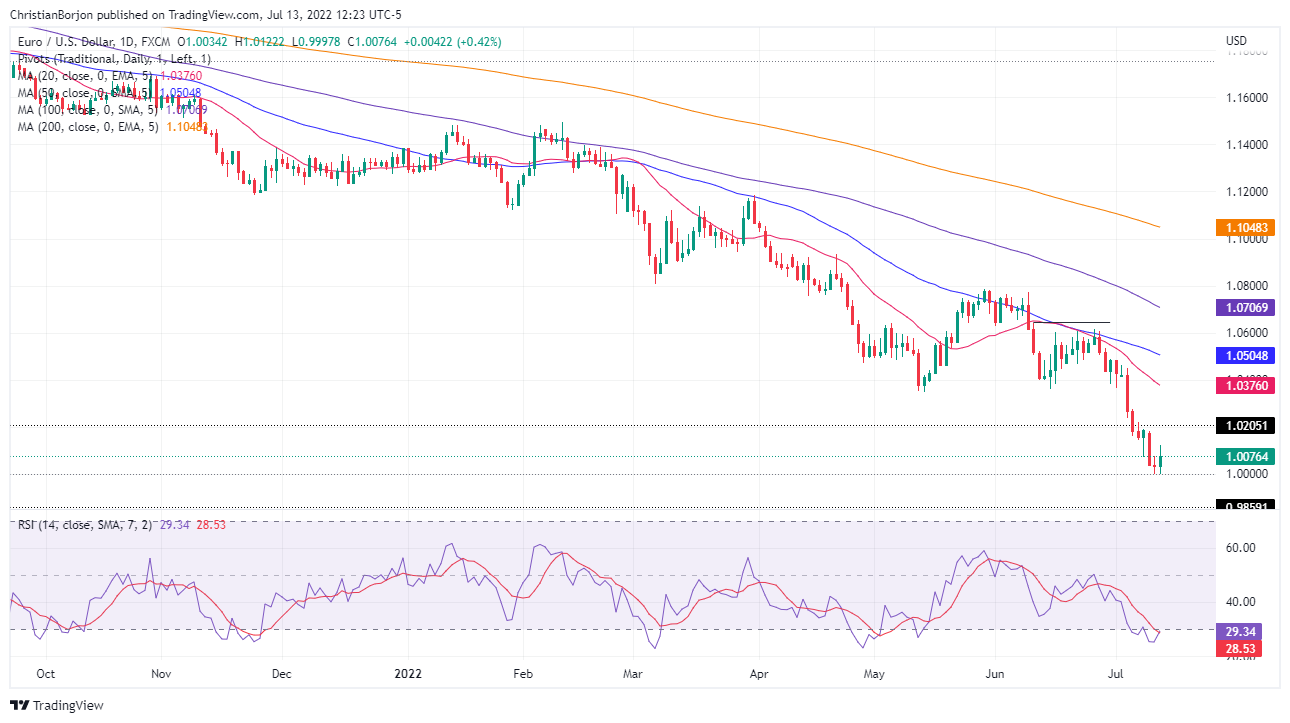
- EURUSD snaps two days of losses, regaining some ground on a weak US dollar.
- The US Consumer Price Index expanded at 1.3% in May, the highest since 2005.
- Interest rate differentials between the Fed and the ECB will give the upper hand to the greenback.
EURUSD rebounds after an intraday dive below parity at around 0.9997, for the first time in 20 years, and is staging a recovery during Wednesday’s North American session, sparked by a hot US inflation report revealed by the US Department of Labour, which lifted the major towards the daily high at around 1.0122, before sliding back below the 1.0100 mark. At the time of writing, the EURUSD is trading at around the 1.0080 area, up 0.50%.
EUR/USD bounces off parity on soft US dollar
Sentiment-wise, investors remain pessimistic, as shown by global equities tumbling across the board. in the meantime, the US Dollar Index, a measurement of the greenback’s value against a basket of six currencies, slumps by 0.30%, underpinned by falling US Treasury yields, and is sitting at 107.827. Also, recession fears loom as the US 2s-10s yield curve remains inverted for the seventh consecutive day, at -0161%.
Also read: EUR/USD: Panic takes over post-US CPI data
Inflation in the US rises
US Inflation breaks above 9%
On Wednesday, the US Bureau of Labor Statistics reported that June’s Consumer Price Index (CPI) topped estimations of 8.8% YoY and rose by 9.1% YoY in May. Regarding the so-called core CPI, which excludes volatile items like food and energy at 5.9%, lower than in May but higher than estimated. The main contributors to the jump in inflation were gasoline, shelter, and food, as shown by the US CPI report.
Inflation split by components
Federal Reserve to hike 100 bps?
In the meantime, the US inflation report has fueled the possibility of a jumbo rate hike by the Federal Reserve. The short-term interest rates (STIRs) money market futures show that traders have fully priced a 75 bps rate hike by the July 26-27 meeting. However, the odds of a 100 bps rate hike lie at 82%, leaving the door open for a jumbo move due to the stickiness and persistently high inflation.
Germany’s inflation report wound not deter the ECB
Earlier during the European session, Germany’s inflation, as measured by the Harmonised Index of Consumer Prices (HICP) rose 8.2% YoY, aligned with the estimated and prior release. Albeit easing fears of higher readings, odds of the European Central Bank (ECB) hiking rates remain fully priced a 25 bps, but chances of a 50 bps have been increasing of late to 58% odds, as shown by STIRs.
ECB vs. Fed interest rate differentials, a headwind for the EURUSD
In July, both banks, the ECB and the Federal Reserve will host their monetary policy meetings. Currently, the ECB’s deposit rate lies at minus 0.50%, while the US Federal Reserve’s Federal funds rate (FFR) is at 1.75%, bolstering the appetite for the greenback. With expectations of the ECB hiking 25 bps and the Fed to move at least by 75 bps, differentials would widen further, to -0.25% (ECB) vs. 2.50% (Fed), meaning that the greenback would keep the upper hand, opening the door for further selling pressure on the EURUSD.
EURUSD Price Technical outlook
EURUSD remains heavy, as shown by the daily chart, with the daily moving averages (DMAs) residing well above the exchange rate. Nevertheless, due to the pair’s price action overextending to the downside and the Relative Strength Index (RSI) in oversold conditions indicates that the EURUSD might print a leg-up before launching another assault below the parity.
Therefore, the EURUSD first resistance would be the 1.0100 figure. Brak above will expose the July 11 high at 1.0183, followed by a test of the 1.0200 figure. On the flip side, the EURUSD’s first support would be parity. A breach of the latter would expose December 2002 lows around 0.9859.
Elliott Wave trading strategies: DAX 40, FTSE 100, STOXX 50, Dollar Index, EUR/USD [Video]
The US Consumer Price Index rose in June by 9.1% compared to the previous year, the highest rate since 1981. The number was above the 8.6% reading of market consensus. The drivers behind the upside miss were broad-based and mostly in the "core" components, explained analysts at Wells Fargo. According to them, it will take at least several consecutive monthly inflation readings of slowing price growth for the Federal Reserve to believe that it has inflation in check.
Key Quotes:
“The June CPI was expected to be hot, but today's report downright burns. Consumer price inflation came in ahead of what were already lofty expectations, increasing 1.3%. Year-over-year, prices are up a scorching 9.1% which marks yet another new cycle-high. Disturbingly for the Fed, the beat can largely be tied to greater strength in core inflation.”
“The resilient upward pressure on core goods prices over the past two months is an unwelcome development for the Federal Reserve. Easing core goods inflation was supposed to be the lone port in the storm in the second quarter amid surging food and energy prices and core services inflation that keeps marching higher.”
“The Fed was already worried about inflation becoming entrenched, hence the super-sized 75 bps rate hike in June. Today's report is likely to further fan those fears. If the choice set for the Fed's next move remains between a 50 or 75 bps rate hike, 75 bps is the clear pick. However, with inflation getting even further offsides, the Fed may be looking at third option at its upcoming meeting: a 100 bps hike. To be clear, a 100 bps rate hike is not our base case at present, but yet another surprisingly strong CPI report cracks the door to such a move should the FOMC decide to bang that door wide open.”
- Japanese yen drops across the board despite the slide in stocks.
- US inflation number above expectations boosts US yields
- USD/JPY peaks at 137.86, then slides back under 137.50.
The USD/JPY jumped after the release of the US June CPI to 137.86, reaching a fresh 24-year high. After the beginning of the American session pulled back to 137.10. As of writing, it is moving back to the 137.50 area.
Inflation keeps rising, so does the dollar
Inflation in June rose in the US to 9.1% (y/y), the highest since 1981. The number was above the 8.8% of market consensus. Immediately after the report the dollar surged to fresh highs across the board and then pulled back.
The reading keeps the Fed on its way of aggressive interest rate hikes. “It will take at least several consecutive monthly inflation readings of slowing price growth for the Federal Reserve to believe that it has inflation in check”, said analysts at Well Fargo.
US yields hit weekly highs after the numbers and then pulled back, even below the level they had before inflation figures. While in the short-term, market participants see the Fed raising rates, the odds of rate cuts in 2023 are growing.
In Wall Street, the Dow Jones is falling 0.75%, and the Nasdaq drops by 0.45%. Despite risk aversion, the Japanese yen is among the worst performers.
The USD/JPY initial support is located at 137.00/10 followed by 136.45 (July 12 low). On the upside, 137.60 is becoming a critical resistance and a consolidation above should open the doors to a new record and 138.00.
Technical levels
Following the Bank of Canada's (BOC) decision to hike the policy rate by 100 basis points to 2.5% in July, Governor Tiff Macklem is delivering his remarks on the policy outlook and responding to questions from the press.
Key takeaways
"Front-loading interest rate response will help cool domestic inflationary pressures."
"100-bp hike reflects concern that the risk that high inflation could become entrenched has gone up."
"Our aim is to get rates to the top-end or slightly above neutral range quickly."
"Economic slowdown is needed, there's lots of room to reduce job vacancies without materially reducing employment."
Market reaction
USD/CAD trades deep in negative territory following these comments and was last seen losing 0.5% on the day at 1.2955.
Following the Bank of Canada's (BOC) decision to hike the policy rate by 100 basis points to 2.5% in July, Governor Tiff Macklem is delivering his remarks on the policy outlook and responding to questions from the press.
Key takeaways
"There are good reasons a soft landing is achievable."
"High commodity prices not affecting Canada as much as many other countries."
Meanwhile, Senior Deputy Governor Carolyn Rogers argued that part of restoring the balance of supply and demand in the economy depends on restoring the balance in the housing market.
Market reaction
USD/CAD continues to push lower on these comments and was last seen losing 0.6% on the day at 1.2944.
Following the Bank of Canada's (BOC) decision to hike the policy rate by 100 basis points to 2.5% in July, Governor Tiff Macklem is delivering his remarks on the policy outlook and responding to questions from the press.
Key takeaways
"Front-loading rate increases now helps avoid the need for even higher interest rates down the road."
"Front-loaded tightening cycles tend to be followed by softer landings."
"100-basis-point rate increase is very unusual and reflects unusual economic circumstances of inflation at nearly 8%."
"Strain of higher interest rates in short term will get us to the other side of this difficult period and back to normal."
"Goal is to get inflation back to 2% with a soft landing for the economy; quick rate hikes prevent inflation from becoming entrenched."
"Over half of components in the Consumer Price Index are rising above 5%."
"We are projecting a soft landing, but the path to that has narrowed because of elevated and persistent inflation."
"Credibility of the bank's inflation target is being tested but remains credible overall."
Market reaction
USD/CAD continues to push lower on these comments and was last seen losing 0.6% on the day at 1.2944.
- The USD/CAD trades within a 120 pip range, courtesy of tier 1 data from both countries.
- The Bank of Canada (BoC) hiked rates by 100 bps and will keep tightening further.
- June's US Consumer Price Index (CPI) rose by 9.1% YoY, the highest in 40 years.
- STIRs money market futures odds of the Federal Reserve hiking 100 bps increased to 82%.
The USD/CAD slumps after the Bank of Canada (BoC) delivered an unexpected rate hike of 100 bps in the ira July meeting, lifting rates to 2.50% vs. 2.25% estimated by market participants, and following a hot US inflation reading topping the 9%.
The USD/CAD is trading at 1.2958 at the time of writing on Wednesday, with the pair seesawing in a volatile trading session, reaching a daily low/high around 1.2945-1.3060 range, an area where the major would keep trading unless a fresh catalysts break the range.
The USD/CAD is trading volatile due to a surprise 1% rate hike by the BoC and US inflation above 9%
In its monetary policy statement, the Bank of Canada said that the Governing Council (GC) decided to front-load interest rates and emphasized that rates will need to rise further. The BoC stated that inflation is expected to persist at around 8% in the few months and has further broadened, with more than half of the components of CPI, rising more than 5%. Although the war in Ukraine and supply chain disruptions are to blame, domestic price pressures from excess demand are becoming more prominent. The BoC also acknowledged that the labor market is tight and increasing wage pressures would keep inflation high.
Regarding economic growth, the Bank expects the economy to grow by 3.5% in 2022, while for Q2, it estimates a 4% growth and a downtick in Q3 to 2%.
In the meantime, earlier in the day, US inflation topped the charts rising by 9.1% YoY, at a fresh 4-decade high, as shown by the US Labor Department, which also revealed the so-called core CPI, which excludes volatile items like food and energy at 5.9%, lower than in May, but higher than estimated. Concerning the higher inflation reading, STIRs money market futures have fully priced a 75 bps rate hike by the Fed. However, the odds of a 100 bps rate raise are 82%, leaving the door open for a jumbo move due to the stickiness and persistently high inflation.
in the meantime, the US Dollar Index retreated from daily highs, down 0.51%, at 107.628, while US Treasury yields, led by the US 10-year yield down 4 bps, sitting below the 3% threshold.
What to watch
On Thursday, the Canadian docket will feature Manufacturing Sales MoM for May. On the US front, Initial Jobless Claims, inflation on the producer side, and Fed speakers would update the status of a battered US economy, with inflation above 9%.
USD/CAD Key Technical Levels
Following the Bank of Canada's (BOC) decision to hike the policy rate by 100 basis points to 2.5% in July, Governor Tiff Macklem will deliver his remarks on the policy outlook and respond to questions from the press. Macklem's presser will start at 1500 GMT.
"Interest rates will need to rise further and the pace will be guided by the bank's assessment of the economy and inflation," the BOC noted in its policy statement.
Breaking: BOC hikes policy rate by 100 bps to 2.5%.
In view of high inflation, the Bank of England (BoE) remains too cautious. This should weigh on the pound. Economists at Commerzbank expect the GBP to weaken against the EUR in the coming quarters.
EUR should benefit from the ECB's monetary policy turnaround
“Since inflation will probably rise further and the labor market is very tight, further monetary tightening is necessary in the short term. We now also expect more rate hikes. However, the BoE is still likely to act too cautiously when it comes to fighting inflation. This, coupled with the risk of significant economic slowdown, will weigh on the pound.”
“We assume that the ECB will also initiate its monetary policy turnaround in July. This should support EUR/GBP.”
“We now also expect GBP to weaken further against EUR next year. The BoE is likely to pause, while the ECB will tighten for a bit longer. At the same time, inflation in the UK is unlikely to fall as quickly, while at the same time the economy should weaken significantly.”
The Bank of Canada (BOC) hiked its policy rate by 100 basis points (bps) to 2.5% in July, compared to the market expectation for a rate increase of 75 bps.
In its policy statement, the BOC acknowledged that it has underestimated inflation since the spring of last year mainly because of global factors.
Market reaction
The USD/CAD pair fell sharply with the initial reaction and was last seen losing 0.4% on a daily basis at 1.2970.
Key takeaways as summarized by Reuters
"Higher commodity prices, increased supply shortages and rising shipping costs explain about two-thirds of missed inflation."
"About a quarter of the inflation forecast miss came from underestimating domestic factors, mostly housing costs."
"In past, the strong correlation between higher oil prices and an appreciation of the dollar helped offset energy impact on inflation, but recently correlation is not holding."
"Wanted to 'front-load' path to higher interest rates amid excess demand and high, broadening and persistent inflation."
"Inflation is higher and more persistent than had been expected in April forecasts and will likely remain around 8% in the next few months."
"Interest rates will need to rise further and the pace will be guided by the bank's assessment of the economy and inflation."
"Quantitative tightening continues and is complementing interest rate increases."
"Governing council is resolute in commitment to price stability and will continue to take action to achieve the 2% inflation target."
- AUD/USD surrendered its intraday gains in reaction to the hotter-than-expected US CPI.
- The formation of descending trend-channel points to a well-established bearish trend.
- Attempted recovery could attract fresh sellers and remain capped near the mid-0.6800s.
The AUD/USD pair witnessed a dramatic turnaround on Wednesday and witnessed aggressive selling near the 0.6200 mark during the early North American session. The pair has now surrendered its intraday gains and was last seen trading around the mid-0.6700s region, nearly unchanged for the day.
The US dollar regained positive traction and shot to a fresh 20-year high in reaction to red-hot US consumer inflation figures, which reaffirmed hawkish Fed expectations. Apart from this, a fresh bout of selling in the equity markets further underpinned the safe-haven buck and drove flows away from the risk-sensitive aussie.
From a technical perspective, the AUD/USD pair has been trending lower over the past four weeks or so along a downward-sloping channel. This points to a well-established bearish trend and supports prospects for additional near-term losses. The emergence of fresh selling at higher levels further validates the negative outlook.
Hence, a subsequent slide back towards the 0.6710 area, or over a two-year low touched on Tuesday, remains a distinct possibility. Some follow-through selling below the 0.6700 mark would be seen as a fresh trigger for bearish traders and make the AUD/USD pair vulnerable to testing the descending channel support, around the 0.6660 area.
The latter should act as a strong base for spot prices, which if broken decisively should pave the way for an extension of the near-term downward trajectory. The AUD/USD pair might then accelerate the fall towards and challenge the 0.6600 round-figure mark before eventually dropping to the 0.6570 horizontal support zone.
On the flip side, the daily peak, around the 0.6200 mark, now seems to act as immediate resistance. Any subsequent move up could still be seen as a selling opportunity and remain capped near the 0.6850-0.6860 confluence hurdle, comprising 100-period SMA on the 4-hour chart and the top end of the aforementioned descending channel.
AUD/USD 4-hour chart
-637933168239989029.png)
Key levels to watch
White House (WH) Economic Adviser Brian Deesetold CNBC on Wednesday that the Consumer Price Index (CPI) data shows the urgency for Congress to pass legislation to spur semiconductor manufacturing in the US, as reported by Reuters.
"Another area of focus is boosting refinery capacity," Deese added.
Earlier in the day, the US Bureau of Labor Statistics reported that the annual CPI in June jumped to its highest level in four decades at 9.1%.
Market reaction
Safe-haven flows continue to dominate the financial markets following these comments. As of writing, the S&P 500 and the Nasdaq Composite indexes were down 0.9% and 1.1%, respectively.
After the EUR/USD pair dropped to parity for the first time in nearly 20 years on hot US inflation data on Wednesday, a spokesperson for the European Central Bank (ECB) reiterated that the ECB does not target a particular exchange rate.
"However, we are always attentive to the impact of the exchange rate on inflation, in line with our mandate for price stability," the spokesperson added in an emailed statement, as reported by Reuters.
Market reaction
EUR/USD stays on the back foot after this statement and was last seen losing 0.2% on the day at 1.0016.
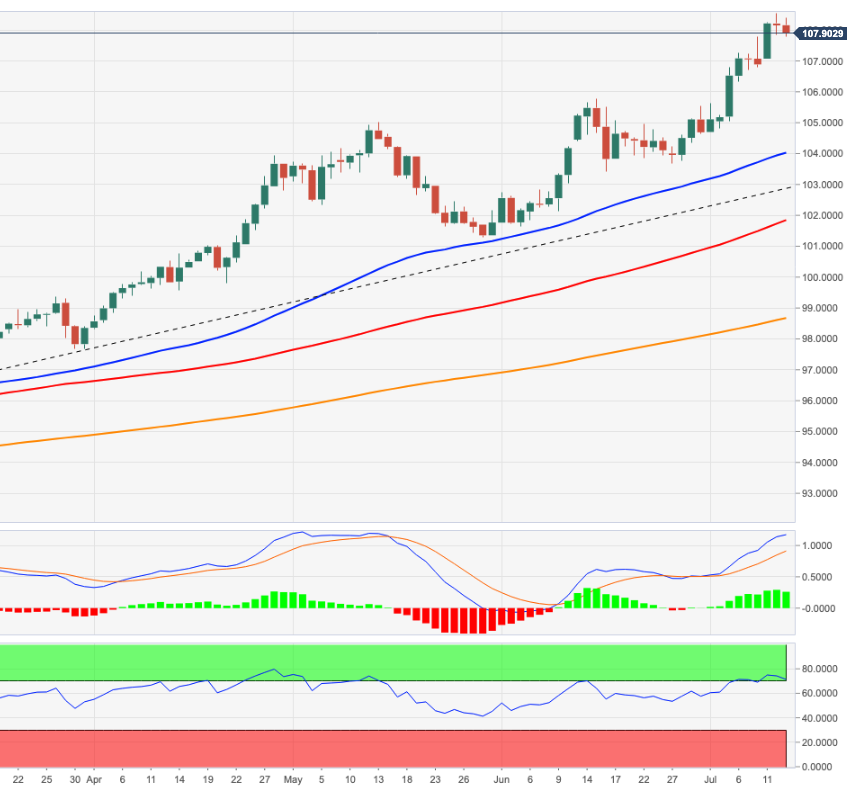
- The index fully fades the earlier pullback and regains the upside.
- The dollar prints new nearly 20-year tops around 108.60.
- US inflation tracked by the CPI rose more than expected in June.
The greenback, in terms of the US Dollar Index (DXY), manages to leave behind the initial pessimism and leaps to new cycle tops near 108.60 on Wednesday.
US Dollar Index remains bid post-US CPI
The index advances to the 108.60 region, an area las seen back in October 2002, after US inflation figures showed consumer prices rose at an annualized 9.1% in June, surpassing initial estimates. The Core CPI, which excludes food and energy costs, also rose above expectations at 5.9% from a year earlier.
The higher-than-expected CPI prints continue to reinforce the case for a more aggressive tightening path from the Federal Reserve in the next months. Indeed, and tracked by CME Group’s FedWatch Tool, the probability of a 75 bps rate hike receded to around 57%, while the possibility of a full-point increase is nearly 43%.
What to look for around USD
The index pushed higher and clinched new cycle highs well north of 108.00 on Wednesday. The recent sharp move in the dollar, however, could be seen largely in response to the accelerated decline in the European currency.
Further support for the dollar is expected to come from the Fed’s divergence vs. most of its G10 peers (especially the ECB) in combination with bouts of geopolitical effervescence and the re-emergence of the risk aversion among investors. On the flip side, market chatter of a potential US recession could temporarily undermine the uptrend trajectory of the dollar somewhat.
Key events in the US this week: MBA Mortgage Applications, Inflation Rate, Fed Beige Book (Wednesday) – Producer Prices, Initial Claims (Thursday) – Retail Sales, Industrial Production, Flash Consumer Sentiment, Business Inventories (Friday).
Eminent issues on the back boiler: Hard/soft/softish? landing of the US economy. Escalating geopolitical effervescence vs. Russia and China. Fed’s more aggressive rate path this year and 2023. US-China trade conflict. Future of Biden’s Build Back Better plan.
US Dollar Index relevant levels
Now, the index is up 0.22% at 108.40 and a break above 108.58 (2022 high July 13) would expose 108.74 (monthly high October 2002) and then 109.00 (round level). On the flip side, the next support aligns at 103.67 (weekly low June 27) seconded by 103.41 (weekly low June 16) and finally 101.29 (monthly low May 30).
BoC Monetary Policy Decision – Overview
The Bank of Canada (BoC) is scheduled to announce its monetary policy decision this Wednesday at 14:00 GMT. The Canadian central bank is anticipated to deliver a jumbo, 75 bps rate hike in an effort to keep inflation expectations anchored. Investors will further take cues from the BoC’s quarterly Monetary Policy Report and Governor Tiff Macklem's comments at the post-meeting press conference.
According to analysts at Citibank: “A 75 bps rate hike in July is the most likely scenario, taking policy rates to 2.25% this week. Beyond this week, we expect 50 bps hikes from both the BoC and the Fed at their September meetings and for policy rates in Canada to reach 3.5% by year-end. Given the recent market focus on recession risks, this is likely to be a key topic of questions at Governor Macklem’s press conference.”
How Could it Affect USD/CAD?
Ahead of the key event risk, a goodish rebound in oil prices from a nearly five-month low offered some support to the commodity-linked loonie. This, along with modest US dollar profit-taking, kept the USD/CAD pair depressed near the 1.3000 psychological mark. A more hawkish BoC stance is already priced in the markets, increasing the risk of disappointment. On the other hand, a neutral stance, or a dovish message, would be enough to inspire the CAD bears. This, along with the US CPI-led USD volatility and oil price dynamics, should help determine the next leg of a directional move for the major.
From current levels, any subsequent decline could attract some buying near the 1.2940-1.2935 support zone. The next relevant support is pegged near the 1.2900 round-figure mark, which if broken would negate any near-term positive bias and make the USD/CAD pair vulnerable. The downward trajectory could then drag spot prices towards the monthly low, around the 1.2835 area, en-route the 1.2820-1.2815 support.
On the flip side, the 1.3050 region might continue to act as an immediate strong hurdle ahead of the 1.3080-1.3085 supply zone. Some follow-through buying beyond the 1.3100 mark would be seen as a fresh trigger for bulls and set the stage for a move towards the 1.3155-1.3160 intermediate resistance. The USD/CAD pair could appreciate further to the 1.3200 mark before climbing to the 1.3270 area.
Key Notes
• BOC Preview: USD/CAD set to surge on a dovish message after a 75 bps hike
• BoC Preview: Forecasts from nine major banks, hiking interest rates aggressively
• USD/CAD: Spikes to the 1.31-1.33 area in the near term are possible – ING
About the BoC Interest Rate Decision
BoC Interest Rate Decision is announced by the Bank of Canada. If the BoC is hawkish about the inflationary outlook of the economy and raises the interest rates it is positive, or bullish, for the CAD. Likewise, if the BoC has a dovish view on the Canadian economy and keeps the ongoing interest rate, or cuts the interest rate it is seen as negative, or bearish.
- Gold price turned lower for the third straight day and dropped to a fresh YTD low.
- A stronger US CPI print reaffirmed hawkish Fed expectations and exerted pressure.
- A sharp spike in the US bond yields, a bullish USD contributed to the selling bias.
Gold price attracted fresh selling near the $1,732 region during the early North American session and turned lower for the third successive day on Wednesday. The latest leg down followed the release of hotter-than-expected US consumer inflation figures and dragged the XAUUSD to its lowest level since August 2021, around the $1,710-$1,705 zone.
Gold price shrug off persistently high inflation
Gold, which is typically considered a hedge against rising inflation, failed to impress bulls after data released from the US showed that the headline CPI accelerated to a new four-decade high in June. In fact, the gauge accelerated to 9.1% on yearly basis from 8.6% in May and rose 1.3% MoM, surpassing expectations. Meanwhile, core inflation, which excludes food and energy prices, came in at 0.7% MoM in June and tick down to the 5.9% YoY rate, again beating consensus estimates.
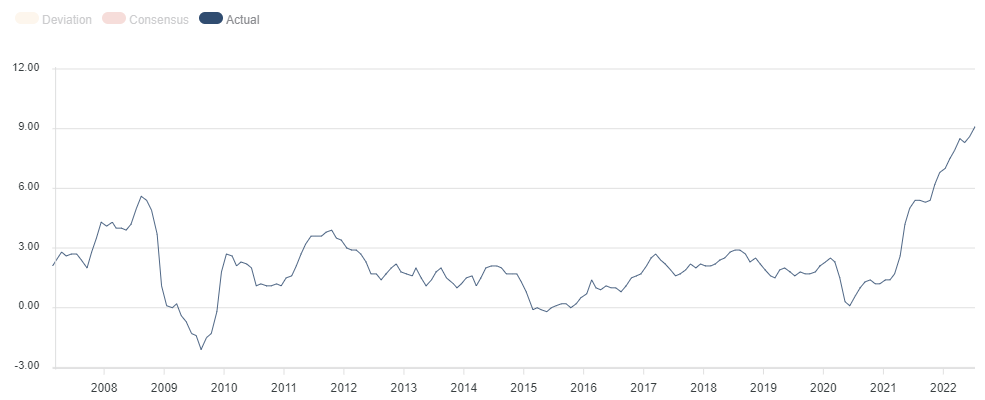
US CPI historical chart
Fed rate hikes bets continue to weigh
Against the backdrop of unsurprisingly hawkish FOMC minutes released last week, the stronger-than-expected US CPI report reaffirmed bets for more aggressive rate hikes by the Federal Reserve. The markets are pricing in nearly 80% chances of a 75 bps rate increase on July 27 and the implied odds of 100 bps are up to 35% now. This, in turn, pushed the US Treasury bond yields sharply higher and was seen as a key factor that exerted heavy downward pressure on the non-yielding gold.
Stronger USD exerts additional pressure
The prospects for a faster policy tightening by the Fed assisted the US dollar to reverse its modest intraday losses and hitting a fresh two-decade high. This further contributed to driving flows away from the dollar-denominated gold. That said, a fresh wave of the global risk-aversion trade could offer some support to the safe-haven XAUUSD amid growing recession fears.
Also Read: Gold Futures: Scope for further decline
Recession fears could limit losses
Investors remain concerned that worried that a more aggressive move by major central banks to curb inflation, the ongoing Russia-Ukraine war and the latest COVID-19 outbreak would pose challenges to global economic growth. This had led to an extended selloff across the global equity markets and tends to benefit traditional safe-haven assets, including gold.
Gold price technical outlook
Gold price now looks to the $1,700 round-figure mark to lend some support. A convincing break below the said handle would be seen as a fresh trigger for bearish traders and drag the XAUUSD to September 2021 low, around the $1,787-$1,786 region. The downward trajectory could further get extended towards challenging the 2021 yearly low, near the $1,677-$1,676 area.
On the flip side, any meaningful recovery attempt now seems to confront stiff resistance near the daily peak, around the $1,732 region. Sustained strength beyond could trigger a short-covering move towards the $1,744 area en-route the $1,752 region and the $1,767-$1,770 strong horizontal support breakpoint.
-637933142939524694.png)
Gold Price: Can gold prices hold above $1,700?
EUR/CHF has reached Credit Suisse’s long-held objective at 0.9839/30. However, the analyst's team sees scope for the downside to extend to 0.9609/00.
Potential to reach 0.9609/00 in due course
“With the 200-day and 55-day moving averages continuing to fall, and daily and weekly MACD momentum indicators staying outright bearish, we continue to look for further direct downside.”
“Next formidable support is seen at 0.9787/75, which we nonetheless look to break to support a move to the ‘measured triangle objective’ of the confirmed bearish ‘triangle’ formation from mid-June at 0.9609/00.”
“Resistance is now seen at 0.9864 initially and then at 0.9898. Should we see a sharp recovery above here, we would look for resistance at 0.9971/72 and then at 1.0032/46 to hold any further upside to avoid a potential sideways movement around parity.”
EUR/USD at parity – where now? Economists at Credit Suisse look for a floor here and for a consolidation/recovery phase to emerge.
Do not look to chase weakness for now below 0.99
“Our base case remains that parity/0.99 will essentially remain a floor for now and a consolidation/recovery phase can emerge, with the market also at the lower end of its 5-month channel and also oversold (right-hand chart below).
“Resistance for recovery is seen at 1.0185/92 initially, with tougher resistance seen starting at 1.0350 and stretching up to the 55-day average, currently at 1.0520.”
“We continue to identify the broader trend as lower and we thus look to fade a consolidation/recovery (if indeed seen) and our bias is for an eventual sustained break of 0.99 to be eventually achieved. This would then clear the way for further weakness, with support seen next at 0.9750 and with the next meaningful support seen at 0.9609/0.9592 – September 2002 low and high of 2001.”
“Whilst we would look for a fresh consolidation phase at 0.9609/0.9592, a direct break can see support next at 0.9331.”
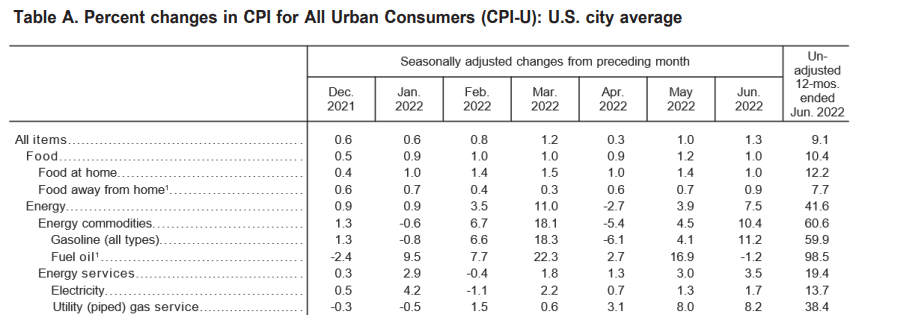
Inflation in the US, as measured by the Consumer Price Index (CPI), jumped to its highest level in four decades at 9.1% on a yearly basis in June from 8.6% in May, the data published by the US Bureau of Labor Statistics showed on Wednesday. This print came in higher than the market expectation of 8.8%.
The Core CPI, which excludes volatile food and energy prices, edged lower to 5.9% in the same period from 6% but still surpassed analysts' forecast of 5.8%.
Follow our live coverage of market reaction to US inflation data.
Market reaction
The US Dollar Index regained its traction after hot inflation data and was last seen posting small daily gains at 108.35.
Senior Economist at UOB Group Alvin Liew assesses the release of US Nonfarm Payrolls for the month of June.
Key Takeaways
“The US economy beat expectations, adding 372,000 jobs in Jun while the unemployment rate stayed at 3.6%, unchanged since Mar 2022. Wage growth continued but the pace slowed for the third straight month to 0.3% m/m, 5.1% y/y.”
“The US employment gains were broad-based while wage growth was good but manageable in 2022 to date, both will anchor the Fed’s confidence in the labor market and keep them on the hiking path. The question of 50 or 75bps will depend on Jun CPI this Wed (13 Jul).”
- EUR/USD keeps the trade just above the parity zone.
- Below parity comes the December 2002 low at 0.9859.
EUR/USD gathers some upside traction and puts some distance from recent lopws in the parity area.
The pair’s bearish stance stays everything but abated for the time being. Against that, there are no support levels of note until the critical parity zone. Further south comes the December 2002 low at 0.9859.
As long as the pair navigates below the 5-month support line near 1.0560, further losses remain in store.
In the longer run, the pair’s bearish view is expected to prevail as long as it trades below the 200-day SMA at 1.1048.
EUR/USD daily chart
- DXY comes under further pressure below the 108.00 mark.
- Extra advances could meet the next target at 108.74.
DXY deflates further following Tuesday’s cycle highs near 108.60 on Wednesday.
Further upside in the dollar remains in store in the short-term horizon. That said, once the 2022 high is cleared, the index could attempt a move to the October 2002 peak at 108.74.
As long as the index trades above the 5-month line near 103.06, the near-term outlook for DXY should remain constructive.
In addition, the broader bullish view remains in place while above the 200-day SMA at 98.66.
Of note, however, is that the index still trades in the overbought territory and it therefore could extend the corrective decline to, initially, the 105.80 region (high June 15).
DXY daily chart
- EUR/JPY fades two consecutive daily drops on Wednesday.
- The resistance line around 140.00 caps the upside so far.
EUR/JPY manages to gather some upside traction around 138.00 on Wednesday.
In the meantime, the cross remains under pressure amidst the ongoing rebound from July lows in the 136.80 region (July 8). As long as the cross keeps trading below the 4-month resistance line around 140.00, extra losses should remain in the pipelie.
That said, further downtrend could revisit the 100-day SMA at 136.24 ahead of the minor support at 133.92 (low May 19).
In the longer run, the constructive stance in the cross remains well propped up by the 200-day SMA at 133.21.
EUR/JPY daily chart
EUR/USD has come within a whisker of parity. How low the pair goes is likely to depend on whether or not Russia wants to worsen the economic war with Europe, economists at Rabobank report.
USD strength may not relent until next year
“From a fundamental perspective, it is not difficult to paint a scenario in which EUR/USD could break below 1.00 and hold at lower levels into the winter months. That has been the case for a while.”
“If the Nord Stream 1 natural gas pipeline is switched back on, in time next week after its scheduled maintenance, the EUR is likely to be granted a reprieve. That said, even if the EUR is boosted, we expect USD strength to dominate into next year suggesting upside for EUR/USD could be limited even on good news regarding Nord Stream.”
“For now, we retain our one-month forecast of EUR/USD 1.03. Evidence that Russian gas supplies into Europe will be further disrupted into the winter would cause us to downgrade our forecasts for the EUR further.”
Economist at UOB Group Ho Woei Chen, CFA, comments on the latest inflation figures in the Chinese economy.
Key Quotes
“Headline CPI came in slightly above expectation at 2.5% y/y in Jun (Bloomberg est: 2.4% y/y, May: 2.1%), its highest since Aug 2020. This was mainly due to gains in food and energy prices as core inflation (excluding food & energy) remained modest at just 1.0% y/y in Jun after rising 0.9% y/y in the two preceding months.”
“China’s Producer Price Index (PPI) remains on a moderating trend, as it eased to 6.1% y/y in Jun (Bloomberg est: 6.0% y/y, May: 6.4%). On a sequential comparison, the PPI was flat in Jun vs. a 0.1% m/m gain in May. In our view, the easing cost pressure could be attributed to both weaker global demand and easing supply-side constraints.”
“As inflation has remained muted, the People’s Bank of China (PBoC) is expected to keep its accommodative monetary policy to boost growth but there is less likelihood of more aggressive interest rate cuts as the economy stabilizes and global central banks continue to hike interest rates aggressively. We maintain our forecast for the 1Y LPR to move lower to 3.55% by end-3Q22 from current 3.70% with a modest 5 bps decline per month from Jul.”
“With the upcoming release of China’s 2Q22 GDP and other key macroeconomic data for Jun on Fri (15 Jul), investors will be watching for announcements of further stimulus measures to ramp up growth in 2H22, as the prospect of achieving a full-year growth close to the official target of 5.5% gets more distant.”
US CPI Overview
Wednesday's US economic docket highlights the release of the critical US consumer inflation figures for June, scheduled later during the early North American session at 12:30 GMT. The headline CPI is anticipated to rise by 1.1% during the reported month, up from the 1.0% in May. The yearly rate is also expected to rise to 8.8% in June from the 8.6% previous. Meanwhile, core inflation, which excludes food and energy prices, is projected to hold steady at 0.6% in June and tick down to 5.8% on yearly basis from 6% in May.
Analysts at Deutsche Bank offered a brief preview of the upcoming data and explained: “We note that while gas prices fell in the second half of June, the first half strength will still be enough to help the headline CPI print (+1.33% forecast vs. +0.97% previously) be strong on the month but with core (+0.64% vs. +0.63%) also strong. We have the headline YoY rate at 9.0% (from 8.6%) while core should tick down from 6.0% to 5.8%.”
How Could it Affect EURUSD?
Ahead of the key release, the US dollar was seen consolidating just below a two-decade high touched on Tuesday. A stronger-than-expected US CPI print would reaffirm market bets for a more aggressive policy tightening by the Fed and provide a fresh lift to the buck. Conversely, a softer reading is more likely to be overshadowed by the darkening global growth outlook, which should continue to benefit the greenback's relative safe-haven status. This, along with concerns that the energy crisis in Europe could drag the region's economy faster and deeper into recession, suggests that the path of least resistance for the EURUSD pair is to the downside.
Eren Sengezer, Editor at FXStreet, offered a brief technical outlook for the EURUSD pair: “Following Tuesday's recovery, the Relative Strength Index (RSI) indicator on the four-hour chart climbed above 30. Additionally, the pair edged higher toward the upper limit of the descending regression channel coming from late June. Both of these developments point to a technical correction rather than a reversal.”
Eren also outlined important technical levels to trade the EURUSD pair: “In order to continue to push higher toward 1.0100 (psychological level, 20-pierodSMA) and 1.0150 (static level), the pair needs to clear 1.0050 (static level) and start using that level as support.”
“On the other hand, EURUSD could face increasing bearish pressure and fall toward 0.9950 (static level from November 2002) and 0.9900 (psychological level) if buyers fail to defend 1.0000 (psychological level, multi-year lows set on July 12),” Eren added further.
Key Notes
• US CPI June Preview: Can the Fed evade a recession?
• US June CPI Preview: Dollar rally could lose steam on soft inflation data
• EURUSD Price Forecast: Parity holds the downside… for now
About the US CPI
The Consumer Price Index released by the US Bureau of Labor Statistics is a measure of price movements by the comparison between the retail prices of a representative shopping basket of goods and services. The purchasing power of the USD is dragged down by inflation. The CPI is a key indicator to measure inflation and changes in purchasing trends. Generally speaking, a high reading is seen as positive (or bullish) for the USD, while a low reading is seen as negative (or Bearish).
UOB Group’s Senior Economist Julia Goh and Economist Loke Siew Ting review the latest portfolio results in Malaysia.
Key Takeaways
“Malaysia faced large foreign portfolio outflows of MYR5.4bn in Jun, reversing the inflows of MYR0.7bn in May. It was the biggest non-resident portfolio outflows since Mar 2020, triggered by outflows in both Malaysian debt securities (at MYR4.1bn) and equities (at MYR1.3bn) last month. This was in line with emerging markets’ (EMs) capital outflows that were weighed by lingering geopolitical risks, tighter global monetary conditions and surging inflation.”
“Bank Negara Malaysia (BNM)’s foreign reserves dropped the most in nearly seven years by USD3.8bn m/m to USD109.0bn as at end-Jun (end-May: +0.4bn m/m to USD112.8bn), marking the lowest level since Mar 2021. The latest reserves level has taken into account the quarterly foreign exchange revaluation changes. The reserves position is sufficient to finance 5.8 months of imports of goods & services and is 1.1 times total short-term external debt.”
“Recession and stagflation risks are now top concerns for investors, spurring risk aversion globally. This is brought by the ongoing geopolitical tensions, tighter monetary conditions, high inflation, China’s COVID control strategy, and ongoing supply chain disruptions which will continue to influence flows dynamics in EMs including Malaysia in the coming months. Growing fears of rising US interest rates and a global recession may also send investors scurrying to the safety of the dollar and in turn further putting depreciation pressure on Asian currencies including MYR in the near term.”
- GBP/USD failed to preserve its modest intraday gains and dropped back closer to the daily low.
- Brexit woes overshadowed upbeat UK macro data and acted as a headwind for the British pound.
- Recession fears, aggressive Fed rate hike bets underpinned the USD and capped gains for the pair.
- Investors now await the release of the US consumer inflation figures for a fresh directional impetus.
The GBP/USD pair struggled to capitalize on its intraday positive move and attracted fresh sellers near the 1.1935 region on Wednesday. The pair surrendered its early gains and retreated to the lower end of the daily range, around the 1.1885-1.1880 zone during the first half of the European session.
The British pound drew support from upbeat UK macro data, which validated market bets for a 50 bps rate hike by the Bank of England in August. In fact, the UK Office for National Statistics that the economy recorded a growth of 0.5% in May as against a flat reading expected. This was accompanied by stronger data from the UK industrial sector, though the initial market reaction turned out to be short-lived.
Investors remain worried that the UK government's controversial Northern Ireland Protocol Bill could trigger a trade war with the European Union. This, in turn, was seen as a key factor that acted as a headwind for sterling. Apart from this, the underlying strong bullish sentiment surrounding the US dollar, bolstered by hawkish expectations, kept a lid on any meaningful gains for the GBP/USD pair.
In fact, the FOMC minutes released last week indicated that another 50 or 75 bps rate hike is likely at the upcoming meeting in July. Policymakers also emphasized the need to fight inflation even if it results in an economic slowdown. Hence, the focus remains on the US consumer inflation figures for June, which will drive Fed rate hike expectations and influence the near-term USD price dynamics.
A stronger-than-expected US CPI print would be enough to boost the greenback. Conversely, a softer reading is more likely to be overshadowed by growing fears about a possible global recession, which should continue to lend some support to the safe-haven buck. This suggests that the path of least resistance for the GBP/USD pair is down and any recovery could be seen as a selling opportunity.
Technical levels to watch
- AUD/USD gained some traction for the second successive day amid subdued USD demand.
- Signs of stability in the markets undermined the USD and benefitted the risk-sensitive aussie.
- Recession fears, Fed rate hike bets to limit the USD fall and cap the pair ahead of the US CPI.
The AUD/USD pair built on the overnight bounce from the 0.6700 neighbourhood, or over a two-year low and edged higher for the second straight day on Wednesday. The uptick extended through the European session and lifted spot prices to a two-day high, around the 0.6785 region in the last hour.
The US dollar oscillated in a narrow trading band below a two-decade high touched on Tuesday amid signs of stability in the financial markets, which, in turn, offered support to the risk-sensitive aussie. The uptick, however, lacked follow-through buying and runs the risk of fizzling out rather quickly.
Growing worries about a possible global recession should keep a lid on any optimistic move. Apart from this, expectations that the Fed would hike interest rates at a faster pace to curb soaring inflation should continue to act as a tailwind for the safe-haven USD and cap the upside for the AUD/USD pair.
It is worth recalling that the FOMC minutes released last week indicated that another 50 or 75 bps rate hike is likely at the July meeting. Policymakers also emphasized the need to fight inflation even if it results in an economic slowdown. Hence, the focus remains on the US consumer inflation figures.
The headline US CPI, due later during the early North American session, is expected to rise from the 8.6% YoY rate in May to 8.8% YoY in June. A stronger-than-expected print will reaffirm hawkish Fed expectations and boost the greenback, which, in turn, should exert pressure on the AUD/USD pair.
Even from a technical perspective, spot prices have been trending lower over the past four weeks or so along a downward-sloping channel. This points to a well-established short-term bearish trend for the AUD/USD pair, suggesting that any subsequent move up could still be seen as a selling opportunity.
Technical levels to watch
- EURUSD remains under pressure near parity.
- The dollar looks cautious ahead of key releases.
- Markets attention will be on US inflation figures.
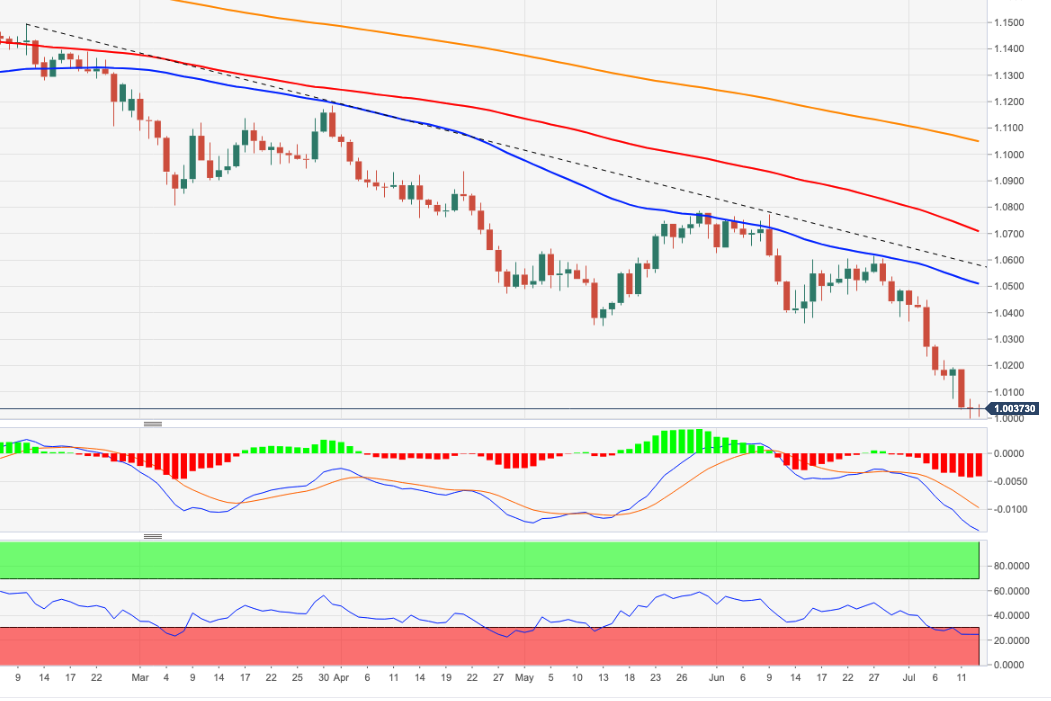
EURUSD price keeps navigating the lower end of the recent range near the crucial parity zone, always amidst the broad-based weakness in place since late June. The pair has therefore entered the third consecutive week with losses, including a drop to 0.9999 (July 12) for the first time since October 2002.
Persistent recession talks in both the US and the Euroland have been weighing on the investors’ sentiment in past weeks and prompted the re-emergence of the risk-off mood, which in turn morphed into extra inflows into the greenback. The stronger demand for the buck pushed the US Dollar Index (DXY) to the area north of 108.00 the figure, levels last traded back in December 2002.
Hand in hand with market chatter surrounding a slowdown in the global economy comes the prospects of further tightening by the Federal Reserve, which is expected to hike the Fed Funds Target Range (FFTR) by 75 bps at the July 27 gathering. On this, and according to CME Group’s FedWatch Tool, the probability of such a raise now surpasses 90% from just above 9% a month ago. It is worth recalling that the June
It will be key for the above the release of the US Inflation Rate later on Wednesday, where consensus expects consumer prices to have risen at an annualized 8.8% in June and 5.7% when it comes to the Core CPI, from May’s 8.6% and 6.0%, respectively.

A key role in the sharp depreciation of the single currency in past weeks has been the inaction of the ECB when it comes to unveil plans to design an anti-fragmentation tool, especially as markets get closer to the July event, where the central bank is forecast to start the hiking cycle by 25 bps. ECB’s rate-setters have also been very vocal in advocating for a larger hike in September (75 bps?), although the impact on the FX space, and particularly the euro, has been non-existent.
EURUSD Price Short-Term Technical Outlook
The pair remains well under pressure and a breach of the parity level should not be ruled out just yet. However, a sustained drop below the latter seems difficult to envisage.
The break below 1.0000 should expose a probable test of the December 2002 low at 0.9859 prior to the October 2002 low at 0.9685. Not much it can be said on the upside for the time being, where bulls should meet the initial hurdle at the temporary 55-day SMA, today at 1.0506. Beyond this level emerges the 5-month resistance line at around 1.0560, which, if cleared, it should mitigate the downside pressure somewhat and help spot to challenge the weekly high at 1.0617 (June 27).
Furthermore, current oversold conditions, as per the daily RSI around 27, could spark a corrective upside, although this is expected to be short-lived and could also be deemed as selling opportunities.
Eurozone’s Industrial Production increased more than expected in May, the official data published by Eurostat showed on Wednesday, suggesting a gradual upturn in the bloc’s manufacturing sector activity.
The industrial output in the old continent arrived at 0.8% MoM vs. a 0.3% rise expected and 0.5% last.
On an annualized basis, the industrial output rose by 1.6% in May versus a 0.3% growth expected and April’s -2.5%.
FX implications
The shared currency finds support from the upbeat Eurozone industrial figures.
At the time of writing, EUR/USD is trading flat on the day at 1.0035.
About Eurozone Industrial Production
Industrial Production is released by Eurostat. It shows the volume of production of Industries such as factories and manufacturing. Uptrend is regarded as inflationary which may anticipate interest rates to rise. Usually, if high industrial production growth comes out, this may generate a positive sentiment (or bullish) for the EUR, while low industrial production is seen as a negative sentiment (or bearish).
The People's Bank of China (PBOC) will guide commercial banks to further increase credit support and lower borrowing costs of the real economy amid dwindling recovery, MNI reports on Wednesday, citing the central bank’s officials.
Additional takeaways
The PBOC will facilitate lenders to reduce the real loan rates via lowering their deposit costs by liberalizing the deposit interest rate system.
Meanwhile, it will help expand credit by using structural monetary tools and pushing policy banks to support big and key infrastructure projects, said Zou
The central bank will keep liquidity at a reasonable and ample level.
Credit conditions will further improve in the second half as the central bank remains accommodative at a flexible pace, pointing out that China's leverage ratio is expected to rise temperately due to counter-cyclical measures which would push up debt while the economic recovery is comparatively slow.
Related reads
- PBOC: China’s inflation is under control
- USD/CNH: There is room for a move to 6.7700 – UOB
- NZD/USD reversed the post-RBNZ dip to the 0.6100 neighbourhood amid subdued USD demand.
- Signs of stability in the markets undermined the USD and offered support to the risk-sensitive kiwi.
- Fed rate hike bets acted as a tailwind for the buck and capped the pair ahead of the US CPI report.
The NZD/USD pair attracted some dip-buying in the vicinity of the 0.6100 mark on Wednesday and inched back closer to the daily swing high. The pair was last seen trading around the 0.6130-0.6135 region and might now be looking to build on the overnight bounce from over a two-year low.
The US dollar was seen consolidating in a narrow band below a two-decade high touched on Tuesday amid signs of stability in the financial markets. This, in turn, offered some support to the risk-sensitive kiwi, which, earlier, had shrugged off the Reserve Bank of New Zealand's anticipated decision to hike interest rates by 50 bps.
That said, growing fears about a possible global recession should keep a lid on any optimistic move in the markets. Apart from this, expectations that the Fed would retain its aggressive policy tightening path to tame persistently high inflation should act as a tailwind for the greenback and cap gains for the NZD/USD pair.
It is worth recalling that the FOMC minutes released last week indicated that another 50 or 75 bps rate hike is likely at the July meeting. Policymakers also emphasized the need to fight inflation even if it results in an economic slowdown. Hence, the focus will remain glued to the release of the latest US consumer inflation figures.
The headline US CPI, due later during the early North American session, is seen rising to the 8.8% YoY rate in June from the 8.6% in the previous month. A stronger-than-expected print will reaffirm bets for faster rate hikes by the Fed, which, in turn, would be enough to provide a fresh lift to the USD and drag the NZD/USD lower.
Technical levels to watch
In its latest oil market report, the International Energy Agency (IEA) warned that “global oil inventories remain critically low, with recent builds concentrated in China.”
Additional takeaways
Strong policy intervention needed on energy use or else world economic recovery at risk.
Saudi and UAE combined spare capacity could fall to just 2.2 mln bpd in august with full phase-out of OPEC+ cuts.
Calls Russian profits "untenable", says talks ongoing to identify solid market mechanism for price cap on Russia’s oil.
Russia’s surprisingly strong performance has pushed up IEA oil supply forecast.
Russia continues to earn more by exporting less oil, funding its military operations.
High fuel prices dent oil consumption in OECD but demand has rebounded in developing economies.
Trimmed oil demand outlook for 2022 by 200,000 barrels per day (bpd) while predicting a rise of 1.7 mln bpd to 99.2 mln bpd.
Demand in 2023 to rise by 2.1 mln bpd to 101.3 mln bpd, led by strong growth in non-OECD countries.
Lower oil demand growth in advanced economies, resilient Russian supply has reduced market tightness.
Higher prices and deteriorating economic environment have started to take toll on oil demand.
Market reaction
WTI is defending the upside above 200-Daily Moving Average (DMA) after the IEA’s warning on low global inventories. The US oil is adding 1.25% on the day to trade at $94.50, as of writing.
The People’s Bank of China (PBOC) said in a statement on Wednesday that China’s inflation is under control.
Additional quotes
Will keep liquidity reasonably ample.
Will push financial institutions to lower financing costs.
These comments come ahead of the much-awaited US inflation data, which is expected to show the core figures softening on an annualized basis to 5.8% in June.
Market reaction
AUD/USD is marching towards 0.6800, despite a mixed market mood and a broadly firmer US dollar. Meanwhile, USD/CNY is down 0.05% on the day, currently trading at 6.7203.
EUR/USD has lots its traction following Tuesday's recovery attempt. AS FXStreet’s Eren Sengezer notes, parity comes back in play following correction.
Investors await June inflation data from the US
“Later in the session, the US Bureau of Labor Statistics will release the Consumer Price Index (CPI) data for June. Markets expect annual CPI to climb to a new multi-decade high of 8.8% from 8.6% in May. A ‘buy the rumor sell the fact’ action could be witnessed unless CPI figures surpass analysts' estimates. Weaker-than-forecast CPI prints, however, could trigger a risk rally in the near term and open the door for a rebound in EUR/USD.”
“In order to continue to push higher toward 1.0100 (psychological level, 20-pierodSMA) and 1.0150 (static level), the pair needs to clear 1.0050 (static level) and start using that level as support.”
“EUR/USD could face increasing bearish pressure and fall toward 0.9950 (static level from November 2002) and 0.9900 (psychological level) if buyers fail to defend 1.0000 (psychological level, multi-year lows set on July 12).”
See: US CPI Preview: Forecasts from 11 major banks, new peak but at headline
The US Dollar Index (DXY) stays relatively quiet above as focus shifts to Consumer Price Index (CPI) data. Economists at ING expect the dollar to stabilize around current levels.
Another acceleration in headline inflation
“June’s headline inflation is widely expected to have accelerated again. Our economics team expects an 8.7% year-on-year reading, as prices of gasoline, food, shelter and airline fares have all continued to rise. The core rate may instead decelerate to 5.8% from 6.0% YoY. Barring a sizeable contraction in inflation measures, it appears likely that today’s numbers will do very little to dent the market expectations of a 75 bps Fed hike in July.”
“We think the dollar could remain mostly a function of global dynamics today. With China’s covid numbers rising again, we suspect markets will stay mostly on the defensive side, and the dollar may consolidate around current levels.”
“But if we see a break below parity in EUR/USD (a very big CPI figure could be the trigger), then we should see a ripple effect (dollar positive) across many USD crosses.”
See – US CPI Preview: Forecasts from 11 major banks, new peak but at headline
- USD/CHF edged lower on Wednesday and snapped a nine-day winning streak to a multi-week high.
- The downtick could be solely attributed to some profit-taking and is more likely to remain limited.
- Fed rate hike bets acted as a tailwind for the USD and should limit the slide ahead of the US CPI.
The USD/CHF pair extended the previous day's late pullback from the 0.9860 area, or nearly a four-week high and witnessed some selling on Wednesday. The downtick picked up pace during the early European session and dragged spot prices back below the 0.9800 round-figure mark in the last hour.
Following the recent rally of over 350 pips from sub-0.9500 levels touched on June 29, traders opted to lighten their bullish bets around the USD/CHF pair ahead of the crucial US consumer inflation figures. Apart from this, the pullback lacked any obvious catalyst and is more likely to remain limited amid the underlying strong bullish tone surrounding the US dollar.
Growing acceptance that the Fed would retain its aggressive policy tightening path to tame persistently high inflation assisted the USD to stand tall near a two-decade high touched on Tuesday. It is worth recalling that the FOMC meeting minutes released last week indicated that another 50 or 75 bps rate hike is likely at the upcoming FOMC meeting in July.
Policymakers also emphasized the need to fight inflation even if it results in an economic slowdown. Hence, the market focus will remain glued to the US CPI print, which is expected to rise from the 8.6% YoY rate in May to 8.8% YoY in June. A stronger-than-expected reading would be enough to provide a fresh boost to the greenback and the USD/CHF pair.
In the meantime, signs of stability in the financial markets could undermine the safe-haven Swiss franc and help limit the corrective pullback. This, in turn, warrants some caution for bearish traders and positioning for any meaningful intraday depreciating move. Nevertheless, spot prices, for now, seem to have snapped nine successive days of the winning streak.
Technical levels to watch
EUR/USD heavily tested the parity level on Tuesday. In the view of analysts at ING, risks of a break below parity are still high.
Uncertainty around reduction in gas supply from Russia to prevent a recovery
“The dollar should remain largely supported today around the US CPI release, and a big jump in inflation (not our base case, but possible) may actually be the trigger for another round of USD appreciation and potentially for a break below parity in EUR/USD.”
“On the European front, the lingering uncertainty around a potential reduction in gas supply from Russia may continue to prevent a recovery in the euro for now.”
“We continue to think that the chances of a break below parity are higher than a material rebound in EUR/USD. If we do see a break lower, we suspect that a further technical drop to the 0.9800-0.9900 area is possible.”
See – US CPI Preview: Forecasts from 11 major banks, new peak but at headline
The kiwi dollar was very little impacted by the Reserve Bank of New Zealand (RBNZ) 50 bps rate hike. Economists at ING expect the NZD/USD pair to challenge the 0.60 level.
Rising risks of a recalibration in the hawkish tone at the August meeting
“Despite the RBNZk reiterating its hawkish message about more aggressive rate hikes, we see rising risks of a recalibration in the hawkish tone at the August meeting (or anyway before the end of the year) due to a falling housing market and worsening economic outlook.”
“In any event, NZD/USD should remain driven by external factors for now, and 0.60 might be tested in the coming weeks.”
Also read: RBNZ to hike the OCR by 50bps again at next month's meeting – TDS
USD/CNH faces a potential near-term consolidation ahead of a probable advance to 6.7700, commented FX Strategists at UOB Group Lee Sue Ann and Quek Ser Leang.
Key Quotes
24-hour view: “We noted yesterday ‘upward momentum has improved rapidly’. We expected USD to strengthen but we were of the view that ‘the major resistance at 6.7500 is likely out of reach’. The subsequent advance exceeded our expectations as USD soared to a high of 6.7530 before pulling back. The pullback amidst overbought conditions suggest USD is unlikely to advance further. For today, USD is more likely to trade between 6.7260 and 6.7500.”
Next 1-3 weeks: “We turned positive USD yesterday (12 Jul, spot at 6.7255) and we were of the view that it could strengthen to 6.7500. We did not expect the rapid rise as USD soared to 6.7530. While overbought shorter-term conditions could lead to 1 to 2 days of consolidation first, USD could advance further to 6.7700 later on. Only a break of 6.7050 (‘strong support’ level was at 6.6950 yesterday) would indicate that USD is not ready to head higher.”
The Bank of Canada (BoC) will announce its Monetary Policy Decision today. Economists at ING expect a limited impact on the Canadian dollar, with a possible spike in the USD/CAD pair to the 1.31-1.33 area.
75 bps hike by the BoC
“We expect a 75 bps rate hike, in line with what is now widely expected to be the next Fed move.”
“Given the still good economic backdrop – a correction in employment figures last week did not dent the notion of a tight labour market – and the fastest inflation rate in three decades, we see no reason for the BoC to scale down the hawkishness of its policy message today.”
“We believe that two more 50 bps rate hikes in September and October, followed by 25 bps in December are warranted. As today’s policy message by the BoC may not dent such rate expectations, we believe the overall impact on CAD should be rather limited or – if anything – slightly positive.”
“Spikes to the 1.31-1.33 area in the near term are possible in USD/CAD, but we still expect sub-1.25 levels by year-end.”
See: BoC Preview: Forecasts from nine major banks, hiking interest rates aggressively
- DXY adds to the ongoing rally around 108.30.
- US yields remains on the defensive for another session.
- The US CPI will be the salient event later in the NA session.
The greenback, when gauged by the US Dollar Index (DXY), posts decent gains beyond 108.30 vs. its main rivals on Wednesday.
US Dollar Index looks to CPI results
Following Tuesday’s inconclusive session, the index now resumes the uptrend and refocuses on Tuesday’s cycle highs in the upper-108.00s amidst alternating risk appetite trends and ahead of the key release of US inflation figures measured by the CPI.
In the meantime, the US money markets show a small downtick in US yields, reflecting the increasing cautiousness among market participants ahead of the US CPI.
In the meantime, recession fears vs. the Fed’s tightening plans remain in the centre of the debate along with inflation concerns, all expected to keep dictating the price action in the global markets for the time being.
Other than the CPI release, MBA Mortgage Applications are due along with the Fed’s Beige Book and the Monthly Budget Statement.
What to look for around USD
The index pushed higher and clinched new cycle highs north of 108.00 on Tuesday. It is worth noting, however, that the recent sharp move in the dollar comes largely in response to the accelerated decline in the European currency.
Further support for the dollar is expected to come from the Fed’s divergence vs. most of its G10 peers (especially the ECB) in combination with bouts of geopolitical effervescence and the re-emergence of the risk aversion among investors. On the flip side, market chatter of a potential US recession could temporarily undermine the uptrend trajectory of the dollar somewhat.
Key events in the US this week: MBA Mortgage Applications, Inflation Rate, Fed Beige Book (Wednesday) – Producer Prices, Initial Claims (Thursday) – Retail Sales, Industrial Production, Flash Consumer Sentiment, Business Inventories (Friday).
Eminent issues on the back boiler: Hard/soft/softish? landing of the US economy. Escalating geopolitical effervescence vs. Russia and China. Fed’s more aggressive rate path this year and 2023. US-China trade conflict. Future of Biden’s Build Back Better plan.
US Dollar Index relevant levels
Now, the index is up 0.15% at 108.32 and a break above 108.56 (2022 high July 12) would expose 108.74 (monthly high October 2002) and then 109.00 (round level). On the flip side, the next support aligns at 103.67 (weekly low June 27) seconded by 103.41 (weekly low June 16) and finally 101.29 (monthly low May 30).
- EUR/GBP broke below the 200-DMA and dropped to a two-month low on Wednesday.
- Recession fears weighed on the shared currency and acted as a headwind for the cross.
- Jumbo BoE rate hike bets, the upbeat UK data contributed to sterling’s outperformance.
The EUR/GBP cross witnessed some selling during the first half of trading on Wednesday and broke below the very important 200-day SMA support. The subsequent downtick dragged spot prices to a nearly two-month low, around the 0.8410-0.8405 region during the early European session.
Investors remain concerned that the energy crisis in Europe could drag the region's economy faster and deeper into recession. The Eurozone is also facing the risk of broadening fragmentation amid the recent sharp rise in borrowing costs of more indebted countries because of the European Central Bank's tightening plan. This was seen as a key factor behind the shared currency's relative underperformance and exerted some downward pressure on the EUR/GBP cross.
On the other hand, the British pound was underpinned by rising odds for a 50 bps rate hike by the Bank of England in August and drew additional support from Wednesday's upbeat UK macro releases. The UK Office for National Statistics that the economy recorded a growth of 0.5% in May as against a flat reading expected. This also marked a sharp rebound from the 0.3% contraction reported in April and was accompanied by stronger data from the UK industrial sector.
In fact, the UK manufacturing output rose by 1.4% MoM in May as against 0.1% expectations and the 0.6% fall booked in April. Adding to this, the total industrial output also surpassed estimates and jumped 0.9% in May from the 0.1% decline in the previous month. Apart from this, subdued US dollar price action was seen as another factor that benefitted sterling, which, in turn, contributed to the offered tone surrounding the EUR/GBP cross.
With the latest leg down, spot prices now seem to have confirmed a near-term bearish breakdown below a technically significant moving average. That said, the downside seems limited amid worries that the UK government's controversial Northern Ireland Protocol Bill could trigger a trade war with the European Union. This makes it prudent to wait for weakness below the 0.8400 mark before positioning for any further slide for the EUR/GBP cross.
Technical levels to watch
Further upside to the 138.00/500 area looks increasingly likely in USD/JPY in the next weeks, commented FX Strategists at UOB Group Lee Sue Ann and Quek Ser Leang.
Key Quotes
24-hour view: “We highlighted yesterday that USD ‘is unlikely to advance much further’ and we expected USD to ‘trade sideways between 136.60 and 137.80’. USD subsequently traded sideways within a range of 136.60/137.80. The price actions appear to be part of a consolidation and USD is likely to trade between 136.50 and 137.50 for today.”
Next 1-3 weeks: “Yesterday (12 Jul, spot at 137.20), we indicated that the risk for USD has shifted to the upside and USD could advance further to 138.00, as high as 138.50. There is no change in our view for now. However, a break of 136.00 (no change in ‘strong support’ level from yesterday) would invalidate our view for a higher USD.”
Today we will have the policy announcement from the Bank of Canada (BoC). The Canadian dollar remains the standout currency in G10 after the US dollar. Economists at MUFG Bank expect the loonie to remain supported following the decision.
BoC set to go by 75bps
“We suspect the BoC will hike by 75 bps and while a little more than that is priced we would expect the statement along with the guidance in the Monetary Policy Report to be enough to keep CAD supported.”
“As long as the BoC does not question current market pricing (unlikely) then CAD should remain well supported. We say ‘well supported’ because it is difficult to be bullish on any non-US dollar currency at present but we equally do not see reason for today’s BoC outcome to be a reason for fuelling accelerated CAD selling.”
See: BoC Preview: Forecasts from nine major banks, hiking interest rates aggressively
The Reserve Bank of New Zealand (RBNZ) increased its Official Cash Rate (OCR) by 50 bps for a third straight meeting to 2.5%. Moves across rates and FX were muted to the expected outcome. Economists at TD Securities expect the RBNZ to hike the OCR by 50bps again at next month's meeting
RBNZ sticks to the script
“The RBNZ did not surprise the market and delivered a third consecutive 50 bps hike, which brought the OCR to 2.5%. The OIS strip was priced for this outcome and all market analysts anticipated this hike.”
“The RBNZ retains its May MPS OCR guidance for the OCR to be ~3.5% by November and a 4% terminal rate in 2023.”
“The Bank acknowledges the medium-term downside risks to economic activity but near-term upside risks to inflation dominate current RBNZ's thinking.”
“We expect the RBNZ to hike the OCR by 50 bps again at next month's meeting. However, the absence of a mention of the 'least regret' approach may suggest the Bank is subtly preparing the market for a 'step down' in the pace of rate hikes.”
China's Trade Balance for June, in Yuan terms, came in at CNY650.11 billion versus CNY455.04 expected and CNY502.89 billion last.
The exports jumped by 22% last month vs. 11.7% expected and 15.3% previous.
Imports rose by 4.8% vs. 2.8% prior.
In USD terms,
China reported a bigger-than-expected growth in the trade surplus, as exports beat expectations.
Trade Balance came in at +97.94 versus +75.7B expected and +78.76B previous.
Exports (YoY): 17.9% vs. +12% exp. and +16.9% prior.
Imports (YoY): 1% vs. +2.0% exp. And 4.1% last.
FX implications
AUD/USD remains uninspired by the upbeat Chinese trade figures, keeping its recovery mode intact at around 0.6770.
- Gold Price struggles around 10-month low, stays inside a bullish chart pattern.
- Risk-on mood fades as traders approach key US inflation data for June.
- Mixed concerns over China, recession also confuse XAUUSD traders.
Gold Price (XAUUSD) retreats to $1,725 heading into Wednesday’s European session. In doing so, the precious metal fades the early-day rebound from the yearly low while staying inside a weekly falling wedge bullish chart pattern. That said, XAUUSD's weakness could be linked to the downbeat performance of Eurostoxx 50 Futures, as well as a rebound in the US Dollar Index (DXY). However, mixed concerns surrounding China’s covid conditions and economic growth, as well as fears of inflation, test the gold traders ahead of the US Consumer Price Index (CPI) for June.
Gold Price awaits US inflation
Gold remains directionless as traders remain cautious ahead of the key US inflation, especially after the record high of the one-year US inflation expectation and hawkish Fed bets. Also highlighting the importance of the US CPI is the IMF’s recent downward revision of economic forecasts and mostly priced in a 75 bps rate hike from the Fed.
Also read: Gold fell to support but is unlikely to turn higher soon
Inflation
Risk-on mood fades
Risk-on mood fails to stay on the table for long as traders consider hidden fears for the world’s largest economies, namely the US and China, not to forget Europe. Recently, the International Monetary Fund (IMF) released fresh forecasts for the US economy, which in turn raised concerns about the previous Memo from the White House. That said, That said, the IMF cuts US 2022 GDP growth projection to 2.3% from 2.9% in late June, due to revised US data. On the other hand, “The US economic data, including the June jobs report, are not consistent with a recession in the first or second quarters,” the White House said in a memo released on Tuesday, as reported by Reuters. While portraying the mood, stock futures in the US and Europe remain pressured after witnessing an upbeat start to the day.
Yield curves favor XAUUSD bears
With the inverted yield curve between the 10-year and the 2-year US Treasury bonds, fears of the recession weigh on Gold Price. That said, the 10-year Treasury yields snap a two-day downtrend to print mild gains around 2.97% whereas its 2-year counterpart loses 0.08% to 3.05% at the latest. It’s worth observing that the yields have been sluggish so far today and challenge XAUUSD traders.
China troubles traders
China’s covid updates are mixed and challenge the market sentiment, as well as the gold traders. It’s worth noting that a jump in Shanghai’s covid numbers is well within the quarantine area and the latest lockdown in Wugang city of Henan Province also appears short-term, which in turn probes coronavirus woes surrounding China. Alternatively, comments from the Chinese Customs Official weigh on the Gold Price. “China's foreign trade still faces instabilities and uncertain factors even as trade growth in May and June reversed the declining trend in April, said Li Kuiwen, a spokesman for the General Administration of Customs, during a news conference in Beijing on Wednesday,” per Reuters.
Risk reversals hint at a cautiously bearish bias
One-month risk reversal (RR) on the XAUUSD printed the biggest daily fall in four days the previous day, to -0.085. With this, the spread between the call options and put options braces for the fifth consecutive weekly fall. However, the magnitude of the RR appears to have been slowing of late, especially on the weekly basis. Hence, gold traders appear to keep the bearish bias but turn cautious off late, which in turn could have restricted the commodity’s latest moves.
Gold Price technical outlook
Gold Price bounces off yearly low while staying inside a one-week-old falling wedge bearish chart pattern. In doing so, the yellow metal remains near the support line of the stated chart formation and hence portrays limited action.
It’s worth noting that the downbeat RSI (14) conditions and lower-high, as well as lower-low, formations challenge the gold buyers until the quote stays below the $1,740 hurdle.
Before that, the 100-HMA level surrounding $1,737 could guard the immediate recovery moves of the XAUUSD.
In a case where the Gold Price rises beyond $1,740, a downward sloping trend line from June 29, near $1,775 by the press time, will be in focus.
On the contrary, the lower line of the stated wedge, close to $1,719, joins multiple levels marked since April 2021 to highlight the $1,719-25 area as the short-term key support, a break of which could direct Gold Price to an ascending support line from March 2021, at $1,708 at the latest. In a case where XAUUSD remains bearish past $1,708, the $1,700 threshold could lure the bears.
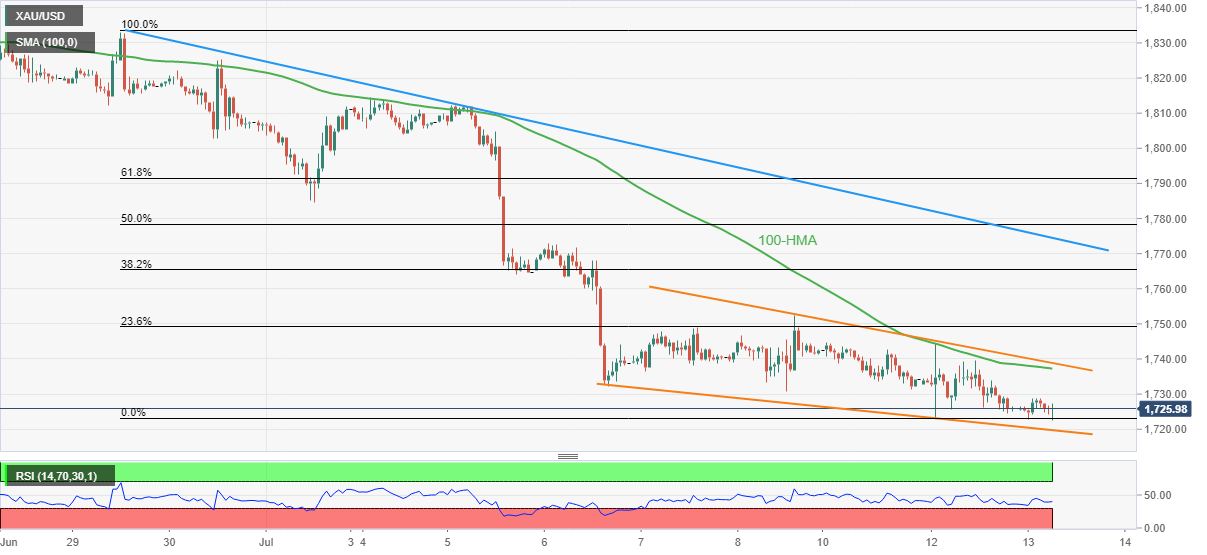
Gold Price: Are gold gains likely to be limited?
USD/CAD remains near the 1.30 level. Economists at the Bank of America Global Research discuss their expectations for today’s Bank of Canada (BoC) meeting and USD/CAD outlook into year-end. They expect the pair to tumble toward 1.25 by end-2022.
BoC to hike the policy rate by 75 bps to 2.25%
“We expect the BoC to hike the policy rate by 75 bps to 2.25% and to signal that large hikes may continue. Increasing inflation and inflation expectations, a tight job market and Fed hikes continue to push BoC. Risks are for 100 bps.”
“We continue to expect that as risk aversion normalizes, and the positive terms-of-trade shock is ultimately likely to persist, that USD/CAD will decline and recouple back to fundamentals.”
“The BoC's rate hiking pace should help to provide CAD support, especially as the BoC is among the most aggressive central banks in G10 in terms of matching the Fed for rate hikes. Our forecast for USD/CAD for the end of the year is 1.25.”
Also read – BoC Preview: Forecasts from nine major banks, hiking interest rates aggressively
Here is what you need to know on Wednesday, July 13:
Following a downward correction in the first half of the day on Tuesday, the dollar regathered its strength amid souring market mood during the American trading hours with the US Dollar Index (DXY) closing the day flat. The DXY stays relatively quiet above 108.00 early Wednesday as focus shifts to Consumer Price Index (CPI) data. The Bank of Canada (BOC) will announce its interest rate decision and release the policy statement later in the day. Finally, the Federal Reserve's Beige Book will be looked upon for fresh impetus as well.
US CPI June Preview: Can the Fed evade a recession?
Wall Street's main indexes moved into positive territory after a memo released by the White House showed that the US economy was expected to transition into lower inflation and steady growth on the back of the strong labor market. The positive impact of these remarks on market mood, however, remained short-live and the S&P 500 Index fell nearly 1% on Tuesday. Early Wednesday, US stock index futures trade flat.
Meanwhile, the Reserve Bank of New Zealand (RBNZ) hiked its policy rate by 50 basis points (bps) 2.5% as expected. In the policy statement, the bank noted that the weaker NZD was having an impact on import prices. NZD/USD showed little to no reaction to the policy announcement and it was last seen posting small losses on the day near 0.6130.
USD/CAD closed the previous two days in negative territory and seems to have gone into consolidation phase above 1.3000 on Wednesday. The Bank of Canada is forecast to raise its policy rate by 75 basis points to 2.25% and 1.5%.
BOC Preview: USD/CAD set to surge on a dovish message after a 75 bps hike.
EUR/USD failed to gather recovery momentum and closed the day virtually unchanged near 1.0050 on Tuesday. The pair stays relatively calm near that level in the European morning. Eurostat will release May Industrial Production data later in the session. In the meantime, the data from Germany showed that annual CPI stood at 7.6% in June, matching the previous estimate.
GBP/USD gained traction in the early European morning and climbed above 1.1900. The UK's Office for National Statistics reported that Gross Domestic Product grew by 0.5% on a monthly basis in May, surpassing the market expectation of 0%. Other data showed that Industrial Production and Manufacturing Production expanded by 1.4% and 0.9% on a monthly basis.
USD/JPY closed in negative territory on Tuesday but started to edge higher early Wednesday. The pair trades above 137.00 in the European morning.
Gold touched its weakest level since September near $1,720 earlier in the day before recovering modestly. Following Tuesday's decline, the benchmark 10-year US Treasury bond yield moves sideways below 3%, limiting XAU/USD's action for the time being.
Bitcoin fell for the third straight day on Tuesday and closed below $20,000. BTC/USD moves sideways near $19,500 so far on Wednesday. Ethereum lost more than 5% on Tuesday and trades within a touching distance of the critical $1,000 handle.
European Central Bank (ECB) policymaker Francois Villeroy de Galhau said on Wednesday that inflation will remain high until next year then it should decline in 2023.
Nothing further is reported on the same.
Market reaction
EUR/USD is largely unfazed by the above comments, currently trading at 1.0038, modestly flat on the day.
EUR/SEK is trading slightly above the 10.60 level. Economists at Commerzbank expect the Swedish krona to remain under pressure for the time being.
Risk aversion continues to be in the driver's seat on the market
“If, in the event of a recession, the Riksbank attaches greater importance to the economic consequences than to the price risks, this could give the krona a blow. However, if the market ultimately concludes that the ECB is more responsive to economic risks in its monetary policy than the Riksbank, the SEK could appreciate more strongly against the euro again.”
“For the time being, risk aversion continues to be in the driver's seat on the market as long as it is not clear what will happen with gas flows to Europe, which is why it should basically be difficult for the krona to gain significant ground in the short-term.”
- A combination of factors assisted USD/JPY to regain positive traction on Wednesday.
- The Fed-BoJ policy divergence, a positive risk tone undermined the safe-haven JPY.
- Traders now look forward to the crucial US CPI report for a fresh directional impetus.
The USD/JPY pair attracted fresh buying on Wednesday and recovered a part of the overnight corrective losses. The pair held on to its modest intraday gains through the early European session and was last seen trading just a few pips above the 137.00 round-figure mark.
A slight improvement in the risk sentiment - as depicted by a modest bounce in the equity markets - undermined demand for traditional safe-haven assets. This, along with the divergence monetary policy stance adopted by the Bank of Japan and the Federal Reserve, assisted the USD/JPY pair to regain some positive traction.
It is worth mentioning that BoJ Governor Haruhiko Kuroda reiterated on Monday that the central bank remains ready to take additional monetary easing steps as necessary. In contrast, the unsurprisingly hawkish FOMC meeting minutes released last week indicated that another 50 or 75 bps rate hike is likely at the July meeting.
Policymakers also emphasized the need to fight inflation even if it results in an economic slowdown. Hence, the market focus will remain glued to the release of the latest US consumer inflation figures, due later during the early North American session. The headline CPI is expected to rise from the 8.6% YoY rate in May to 8.8% YoY in June.
A stronger-than-expected US CPI print will reaffirm market bets that the Fed would stick to its faster policy tightening path. This would be enough to trigger a fresh leg up in the US Treasury bond yields and boost the USD, supporting prospects for an extension of the USD/JPY pair's recent strong bullish trajectory.
Technical levels to watch
Economists at Credit Suisse hold a 1.30 USD/CAD target ahead of today’s Bank of Canada (BoC) rate decision. They do not expect the BoC to alter its assessment of housing risks, but markets will be on the lookout for dovish hints.
BoC unexpected to alter its assessment of housing risks
“In the more likely event of a firm BoC stance, we still would be inclined to maintain a neutral stance on CAD, in line with our 1.30 USD/CAD target.”
“The area that could offer more surprises is how the Governing Council addresses the topic of housing prices. Markets might see changes in the language on this front as potentially dovish. We do not anticipate a shift from the BoC on this topic, but we are alert to the fact that if it were to happen, it would be seen in markets as an idiosyncratic CAD-negative factor consistent with a partial unwind in BoC tightening expectations. Under these circumstances, a break in USD/CAD above the 1.3084 highs from last week would become a much more likely and imminent proposition.”
Also read: BoC Preview: Forecasts from nine major banks, hiking interest rates aggressively
FX option expiries for July 13 NY cut at 10:00 Eastern Time, via DTCC, can be found below.
- EUR/USD: EUR amounts
- 1.0200 1b
- GBP/USD: GBP amounts
- 1.2035 1.2b
- USD/JPY: USD amounts
- 135.00 607m
- 136.00 780m
- 137.35 400m
- 138.00 600m
- 139.00 330m
- AUD/USD: AUD amounts
- 0.6800 329m
- USD/CAD: USD amounts
- 1.2850 415m
- 1.3000 1.6b
- NZD/USD: NZD amounts
- 0.6180 794m
- EUR/GBP: EUR amounts
- 0.8470 220m
- 0.8570 294m
Economists at Credit Suisse turn more bearish on the Australian dollar and set their aims for 0.6550, also lowering the target range for AUD/USD from 0.6670-0.7100 to 0.6480-0.6950.
Fears of RBA gradualism and renewed Chinese growth concerns
“In order for AUD to become an enticing buying proposition for FX investors, hope of a more aggressive RBA policy stance will need to materialize. And the risk we see, given the data release schedule, is that investors might question the RBA’s willingness to surprise more hawkish on 2 Aug, with a key piece of data (wage growth) on the calendar just a couple of weeks later.”
“The recent period of AUD weakness coincided with a lengthy stretch of investor optimism around Chinese reopening prospects. While the outcome of this latest lockdown is still unclear, this poor AUD performance amid a decently supportive local backdrop leaves us less than convinced in AUD’s prospects under current more uncertain circumstances.”
“We opt to revise our AUD/USD target range lower from 0.6670-0.7100 to 0.6480-0.6950 and lower our Q3 target from 0.6760 to 0.6550.”
British finance minister Nadhim Zahawi applauded the stronger-than-expected UK GDP data for May. The economy expanded 0.5% in the reported month when compared to zero growth anticipated.
Key quotes
"It’s always great to see the economy growing but I’m not complacent.”
"We’re working alongside the Bank of England to bear down on inflation and I am confident we can create a stronger economy for everyone across the UK."
Also read: GBP/USD jumps after UK GDP beats estimates with 0.5% in May
Market reaction
At the press time, GBP/USD clings to the renewed upside near 1.1925, higher by 0.34% on the day.
EUR/USD at 1.0037 – old currency traders will still remember that we had already seen significantly lower levels. Economists at Commerzbank expect the pair to take another run towards parity.
US CPI data for June will not hurt the dollar this time
“I imagine that the US CPI data for June will not hurt the dollar this time. Although inflation is expected to have risen to a 40-year high of 8.8%, as our experts expect.”
“After the market tested the parity yesterday, I can imagine that we will take another run towards parity as long as the uncertainty about gas supplies to Europe dominates. After all, it serves as an argument for a weaker euro.”
“And maybe a dip below parity won't hurt that much. However, if the market fears to dive into the cold water, it can always take the US CPI data as a reason to rather push EUR/USD towards 1.01 again.”
See – US CPI Preview: Forecasts from 11 major banks, new peak but at headline
- EURUSD has faced selling pressure around 1.0500 on stable Germany Inflation data
- Eurozone is advancing towards a large real income shock amid a delay in policy tightening.
- A situation of higher inflation and lower Average Hourly Earnings will reduce consumption and savings.
The EURUSD pair has resumed its downside journey as Germany's Harmonized Index of Consumer Prices (HICP) has landed stable at 8.2%. Earlier, the asset was displaying back-and-forth moves in a narrow range of 1.0023-1.0047 in the Asian session after a mild correction from 1.0074. The asset has turned sideways after dropping below the magical figure of 1.0000 on Tuesday after almost two decades of time. The sideways movement is not warranting any bullish reversal as the ongoing inventory distribution is hinting at more losses ahead.
The US dollar index (DXY) has displayed some exhaustion signals after printing a fresh 19-year high of 108.56 on Tuesday. The loss of momentum after a significant high indicates that the intermittent high is available for reference. In today’s session, the DXY has delivered a lackluster performance and the downside move will be witnessed by the market participants if it loses the opening price level at 108.15.
Also Read: EUR/USD Forecast: Tepid bounce hints at a bearish breakout

Inflation fears catch headlines
Stable print for Germany HICP
The European session will be filled with gigantic volatility as the Federal Statistics Office has reported Germany's HICP at 8.2%, in line with the estimates and the prior release. This has accelerated the odds of a rate hike by the European Central Bank (ECB). Apart from that, more European countries will also report their HICP. France's Consumer Price Index (CPI) is seen at 6.5% while Spain’s HICP may land at 8.5%.
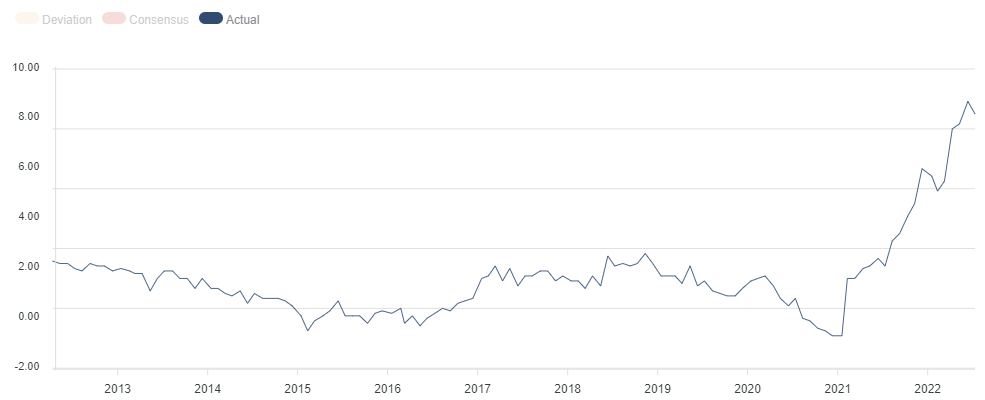
Large income shocks seem real for Eurozone
Price pressures are hot red in eurozone and the European Central Bank (ECB) has not elevated its interest rates yet. Unlike, the other Western leaders, the ECB’s interest rates are grounded at zero. However, the Asset Purchase Program (APP) has been concluded but soaring price pressures demand more rate hike measures. There is no denying the fact that higher energy bills and food prices have depreciated the real income of the households and any delay in policy tightening may result in large income shocks.
Consequences of higher consensus for US Inflation
A preliminary estimate for the US CPI is 8.8%, higher than the prior release of 8.6%. While the core CPI may decline to 5.7% vs. 6% recorded earlier.
Taking into account the last week’s US employment data, the Average Hourly Earnings remained lower than their prior print. A situation of a higher inflation rate and lower Average Hourly Earnings will reduce the consumption and savings by the households significantly, which may have adverse effects on the growth prospects.
-637932901205197685.png)
Negative Divergence in plain-vanilla CPI and core CPI
Considering the prior release of 8.6%, the mathematics indicates an increment in the annual inflation rate by 20 basis points (bps). However, the impact of energy bills and food products is more than that.
The core Consumer Price Index (CPI) that doesn’t inculcate oil and food prices may slip to 5.7% from the prior release of 6%. A simultaneous increase in plain-vanilla CPI and a fall in core CPI indicate that the impact of oil food prices is more than expected.
EURUSD technical analysis
The EURUSD pair is overlapping the 20-period Exponential Moving Average at 1.0040 and is hinting at a volatility squeeze ahead of the mega-events. Also, the descending 50-period EMA at 10061 indicates that the short-term trend is bearish.
A range shift by the Relative Strength Index (RSI) (14) to 40.00-60.00 indicates that the shared currency bulls are not bearish for a while. However, a downside break of 40.00 will activate a fresh downside impulsive wave.
On an hourly scale, the asset has witnessed hurdles around July 8 low at 1.0072, which acted as a major cushion. A phase of inventory distribution is ongoing in a range of 1.0000-1.0074, which may turn into an initiative selling structure if the asset drops below the magical figure of 1.0000 decisively. This will drag the asset towards November 2020 low at 0.9880, followed by June 2000 high at 0.9701.
While a confident move above July 8 high at 1.0191 will drive the asset towards June 6 high at 1.0277. A breach of the latter will expose the asset to hitting June 1 low at 1.0366.
Summing up the whole context, the magical figure of 1.0000 is very much crucial for the eurozone bulls. The violation of the same could collapse the shared currency.
EURUSD: Hourly Chart
-637932885446875938.png)
Elliott Wave trading strategies: DAX 40, FTSE 100, STOXX 50, Dollar Index, EUR/USD [Video]
CME Group’s flash data for natural gas futures markets noted traders scaled back their open interest positions by around7.5K contracts on Tuesday, while volume rose for the second session in a row, now by around 31.6K contracts.
Natural Gas: Upside now targets the 55-day SMA around $7.50
Prices of natural gas retreated moderately on Tuesday, although the move was against the backdrop of declining open interest. That said, a deeper correction appears not favoured for the time being, leaving the door open to the resumption of the uptrend in the short-term horizon. Next on the upside emerges the interim hurdle at the 55-day SMA at $7.52 per MMBtu.
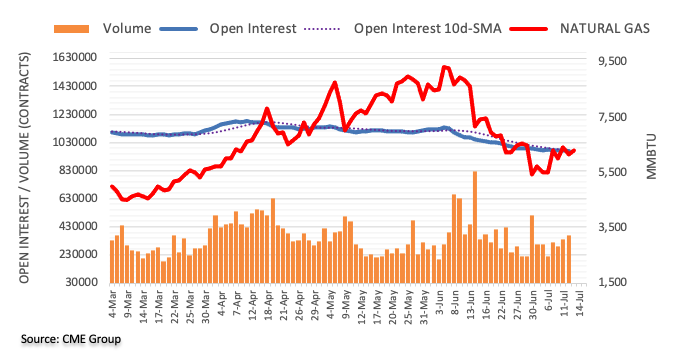
The UK’s industrial sector recovery gathered steam in May, the latest UK industrial and manufacturing production data published by Office for National Statistics (ONS) showed on Wednesday.
Manufacturing output arrived at 1.4% MoM in May versus 0.1% expectations and -0.6% booked in April while total industrial output came in at 0.9% vs. 0% expected and -0.1% last.
On an annualized basis, the UK manufacturing production figures came in at 2.3% in May, beating expectations of 0.3%. Total industrial output rose by 1.4% in the fifth month of this year against a -0.5% reading expected and the previous 1.6% print.
Separately, the UK goods trade balance numbers were published, which arrived at GBP-21.445 billion in May versus GBP-20.401 billion expectations and GBP-21.552 billion last. The total trade balance (non-EU) came in at GBP-10.367 billion in May versus GBP-11.408 billion previous.
Related reads
- GBP/USD jumps after UK GDP beats estimates with 0.5% in May
- US inflation in focus, as COVID-19 cases rise, again
Further downside carries the potential to force AUD/USD to breach the 0.6700 level in the near term, according to FX Strategists at UOB Group Lee Sue Ann and Quek Ser Leang.
Key Quotes
24-hour view: “We expected AUD to weaken yesterday but we noted, ‘in view of the oversold conditions, AUD may not be able to maintain a foothold below 0.6700’. However, AUD did not break 0.6700 as it rebounded from a low of 0.6712. Downward momentum has waned and this coupled with still oversold conditions suggests that AUD is likely to trade sideways for today, expected to be within a range of 0.6725/0.6790.”
Next 1-3 weeks: “Our view from yesterday (12 Jul, spot at 0.6740) still stands. As highlighted, AUD could drop below 0.6700. At this stage, the chance for a break of the next support at 0.6650 is not high. All in, AUD is expected to trade under pressure unless it can move above the ‘strong resistance’ level at 0.6835 (no change in ‘strong resistance’ level from yesterday).”
Considering advanced prints from CME Group for crude oil futures markets, open interest shrank for the second session in a row on Tuesday, now by just 781 contracts. Volume, instead, went up for the second straight session, this time by around 240.3K contracts.
WTI looks supported around the 200-day SMA
Tuesday’s sharp retracement in prices of the WTI was amidst a small downtick in open interest, which could be indicative that a deeper pullback could not be favoured in the very near term. In the meantime, the 200-day SMA at $93.98 continues to hold the downside for the time being.
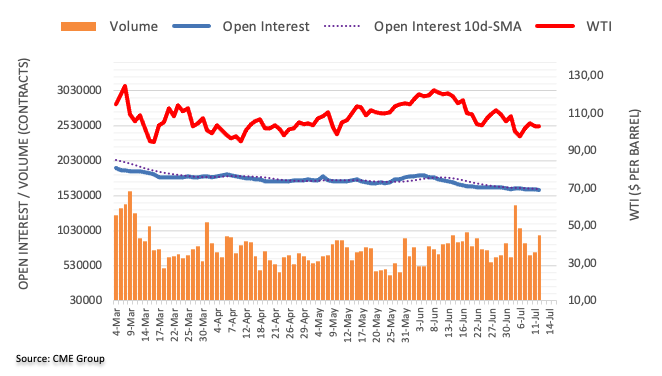
- UK GDP arrived at 0.5% MoM in May vs. 0% expected.
- GBP/USD rebounds firmly above 1.1900 on UK GDP big beat.
The UK GDP monthly release showed that the economy rebounded firmly in May, arriving at 0.5% vs. 0% expectations and -0.3% previous.
Meanwhile, the Index of services (May) came in at 0.1% 3M/3M vs. -0.6% estimate and 0.2% prior.
Economists had predicted zero growth in May from April.
Key takeaways via ONS
Health services were a major driver of growth, citing "a large rise in GP appointments".
“Road hauliers also had a busy month, while travel agencies fared well with pent-up demand for holidays.”
Market reaction
The Cable catches a fresh bid and jumps back towards 1.1950 on stronger-than-expected UK growth numbers. The spot is adding 0.29% on the day.
About UK GDP
The Gross Domestic Product released by the National Statistics is a measure of the total value of all goods and services produced by the UK. The GDP is considered as a broad measure of the UK economic activity. Generally speaking, a rising trend has a positive effect on the GBP, while a falling trend is seen as negative (or bearish).
Attention turns to the US June Consumer Price Index (CPI) print. Economists at TD Securities think it remains premature to fade the USD if either scenario pans out.
EUR/USD rallies are a fade
“We will need to see a string of softer inflation prints before we get more comfortable on USD resilience fading. We note, however, that the market setup into this CPI report is notably different than the last.”
“The forecast distribution is pretty evenly split between a 0.5% and a 0.6% MoM reading. Last time, the market was largely huddled around 0.5% and 0.4%. So, with the market expecting a strong print, the shock value may be a bit less this time around (unless core CPI prints above that distribution).”
“The USD is already trading on a much firmer footing than the last report. That may limit the shock value on FX, though much of the recent strength has come off the back of EUR's decline to parity so we are reluctant to read too much into this. So, it may just come down to the underlying details of the report, which by our account should remain pretty robust.”
“And despite a long build in the USD, it still tracks modestly cheap on a cross-asset FV basis, leaving us to fade EUR/USD upside.”
Also read: US CPI Preview: Forecasts from 11 major banks, new peak but at headline
- USD/CAD extends pullback from intraday low during the first loss-making day in three.
- Oil prices recover from the lowest levels since late February.
- Cautious optimism, battles anxiety ahead of the key data/events to test pair traders.
- BOC is up for 75 bps rate hike, US CPI could increase in June.
USD/CAD picks up bids to consolidate the first daily loss in three around 1.3015 heading into Wednesday’s European session. The Loonie pair’s latest gains could be linked to the market’s cautious mood ahead of the key Bank of Canada (BOC) monetary policy meeting and the US Consumer Price Index (CPI) for June.
It’s worth noting that a rebound in the crude oil prices, Canada’s main export item, fails to underpin the Canadian dollar’s (CAD) strength. That said, WTI crude oil recovered from the lowest levels since late February while snapping a two-day downtrend, up 0.38% intraday near $93.80.
That said, the US Dollar Index (DXY) also remains pressured after easing from the 20-year high, down 0.05% intraday around 108.10 by the press time. The greenback’s gauge versus the major six currencies retreated the previous day amid hopes of no major setback from the US economy, backed by the White House (WH) memo. Also weighing on the quote was softer US data, which in turn eased pressure from the Fed policymakers.
As per Reuters, “The US economic data, including the June jobs report, are not consistent with a recession in the first or second quarters,” the White House said in a memo released on Tuesday. The news contributed to the market’s profit booking moves ahead of the key data/events. Further, the US NFIB Business Optimism Index for June slumped to the lowest since early 2013 while flashing 89.5 figures versus 93.1 prior.
Against this backdrop, S&P 500 Futures and the US 10-year Treasury yields both snap a two-day downtrend. Further, stocks in the Asia-Pacific region also appear to fade the previous bearish bias.
Moving on, the Bank of Canada’s (BOC) Rate Statement and the US CPI, expected to rise to 8.8% YoY from 8.6%, will be crucial for the pair traders to watch for clear directions. While the BOC is widely expected to announce a 0.75% rate hike and drown the USD/CAD prices on positive statements from the central bank. On the other hand, higher expectations from the US inflation benchmark could weigh on the USD in case of any disappointment in the outcome.
Technical analysis
Unless crossing the weekly resistance line, at 1.3045 by the press time, USD/CAD remains vulnerable to witnessing a pullback towards revisiting Friday’s swing low, near 1.2935 at the latest.
The Bank of Canada (BoC) is set to announce its interest rate decision on Wednesday, July 13 at 14:00 GMT and as we get closer to the release time, here are the expectations as forecast by the economists and researchers of nine major banks, regarding the upcoming announcement.
The BoC is set to hike rates by 75 basis points (bps) – an extraordinary pace in normal times – to cool a heating economy.
TDS
“We look for the BoC to lift rates by 75 bps, bringing the overnight rate to 2.25%. Markets have almost fully priced the move, and a dovish surprise would raise questions about the Bank's commitment to its inflation target. The tone of the communiqué should be stridently hawkish given recent data on inflation and inflation expectations, despite expected downward revisions to the growth outlook.”
ING
“We expect the BoC to implement a 75 bps move. The economy is growing strongly, is at record employment levels and its inflation rate is running at 7.7%, the fastest rate since January 1983. The housing market is also red hot while Canada’s strong commodity-producing sectors mean it is far more resilient than most major economies to the spike in prices.”
RBC Economics
“We expect a 75 bps increase. That would be the largest single rise since the 1990s. May CPI growth at 7.7% (year-over-year) is running well above the bank’s April forecast of 5.8% in the second quarter. And 60% of the prices tracked by the measure are growing above the BoC’s 1% to 3% target range by our count. Worryingly, those higher price readings are beginning to seep into longer-run inflation expectations. An unhinging of longer-run inflation expectations from the BoC’s targets would disrupt decades of effective inflation-targeting monetary policy. It would also require much larger and more damaging interest rate hikes to reverse. Against that backdrop, we expect the economic growth risks from hiking rates too aggressively in the near-term will be overshadowed by the medium-term cost of not doing enough. The overnight rate remains too low at 1.5%. We expect the central bank to continue on a more aggressive hiking path with another 75 bps increase in September. We continue to believe inflation is close to its peak, but won’t shift to more sustainable levels until demand slows more significantly. Once that happens, expect the BoC and other central banks to again push rates lower – though this likely won’t play out until the economy undergoes a modest contraction next year.”
NBF
“We expect the BoC to increase its overnight target by 75 bps, noting that they will continue to ‘act forcefully’ to bring down inflation. That should mean an above-25 bps hike in September but expect the BoC to keep the ‘50 vs. 75’ debate up in the air and data dependent. Meanwhile, an updated MPR will show a much higher near-term inflation projection, though the growth outlook could be marked down. The decision will be followed by a Tiff Macklem and Carolyn Rogers press conference where the focus will surely be on how high the BoC believes it will have to hike.”
CIBC
“Rising inflation expectations seem likely to cement a 75 bps rate hike from the BoC, but that’s also because the resulting 2.25% overnight rate is unlikely to be too much for the economy to handle. Subsequent rate hikes will likely be smaller, as the risk of overdoing it becomes more material the higher rates climb. The Bank will reiterate its view that rates might have to exceed 3% (the top of the neutral range) to do the job, although we’ll retain our call for a 3% peak. Look for the Bank to downgrade its growth forecasts, effectively conceding that with higher price pressures than it expected, getting inflation back to target will require more of a sacrifice in the pace of output. But we also expect the report to dig into the inflation data to explain that much of this year’s inflation shock isn’t coming from excess demand in Canada, and therefore, how inflation might dissipate in the coming years without the need to drive the country into the deep recession that would be necessary if all of the spike was due to an economic overheating.”
BMO
“We fully expect a 75 bps rate hike, with the Fed’s like-sized move last month paving the way for others to become more aggressive. In fact, there is a reasonable case to be made for a 100 bps step – such a hike would take the overnight rate to 2.50%, immediately moving to the middle of the Bank’s range for neutral rates. It could also be justified by the wild inflation overshoot. However, we still lean 75 bps, as Bank officials have clearly stated that they want to be a source of stability and predictability.”
Wells Fargo
“With the BoC saying last month it is prepared to act more forcefully if needed, we believe that will result in a 75 bps policy rate increase to 2.25% at the July meeting. Market participants will also closely scrutinize the accompanying statement, and the central bank's updated economic projections, for hints on whether the BoC could continue hiking in 75 bps increments, or revert to a slower pace of tightening moving forward.”
Citibank
“A 75 bps rate hike in July is the most likely scenario, taking policy rates to 2.25% this week. Beyond this week, we expect 50 bps hikes from both the BoC and the Fed at their September meetings and for policy rates in Canada to reach 3.5% by year-end. Inflation forecasts in the BoC’s quarterly Monetary Policy Reports have been consistently revised up over the last year and are likely to be substantially higher again in July, closer to around 7-8% for the next few quarters and likely near 7% for the year. Growth forecasts will likely be revised lower, but with medium-term forecasts consistent with a ‘soft-landing’ scenario. Still, given recent market focus on recession risks, this is likely to be a key topic of questions at Governor Macklem’s press conference.”
Goldman Sachs
“We expect the BoC to act ‘more forcefully’ and hike the policy rate by 75 bps to 2.25%. Beyond this week, we expect another 75 bps hike in September, 50 bps hikes in October and December, and a 4.25% terminal rate reached in Q1 2023. The main drivers of our hawkish BoC call are that we expect headline CPI inflation to remain above 7% this year and for the BoC to respond aggressively to any signs of entrenched inflation. Risks to our hawkish terminal rate forecast are to the downside. A more significant US growth slowdown or a crash in the housing market would likely mean that the BoC hikes less in December and January than we expect.”
In the opinion of FX Strategists at UOB Group Lee Sue Ann and Quek Ser Leang, a drop below 1.1800 in GBP/USD remains likely in the short term.
Key Quotes
24-hour view: “We expected GBP to decline yesterday but we were of the view that ‘any weakness could be limited to a test of 1.1850’. We indicated, ‘the major support at 1.1800 is unlikely to come under threat’. The anticipated weakness exceeded our expectations as GBP plummeted to a low of 1.1808 before rebounding to end the day little changed at 1.1885 (-0.08%). The rebound amidst oversold conditions suggests that GBP is unlikely to weaken further. For today, GBP is more likely to trade between 1.1825 and 1.1925.”
Next 1-3 weeks: “We turned negative GBP yesterday (12 Jul, spot at 1.1910) and indicated that GBP could trade with a downward bias towards 1.1800. Our view for a weaker GBP was not wrong but we did not expect GBP to approach 1.1800 so quickly (GBP dropped to 1.1808 during London hours). While downward momentum has not improved by much, the chance for GBP to break 1.1800 has increased. A break of 1.1800 would shift the focus to 1.1750. The downside risk is intact as long as GBP does not move above 1.1980 (‘strong resistance’ level was at 1.2010 yesterday).”
- NZD/USD picks up bids to pare intraday losses, stays mildly offers around two-year low.
- RSI conditions favor corrective pullback, short-term channel, falling wedge challenge buyers.
- The 0.6030-25 appears a tough nut to crack for bears.
NZD/USD struggles to defend the post-RBNZ losses, picking up bids to 0.6130 during early Wednesday morning in Europe. The Kiwi pair’s latest rebound could be linked to the nearly oversold RSI conditions.
However, the 10-DMA level surrounding 0.6170 could restrict the pair’s immediate upside, a break of which will highlight the monthly bearish channel’s resistance line, around 0.6190, as the consequent challenge for the NZD/USD bulls.
It’s worth noting that the quote’s run-up beyond 0.6190 needs validation from the multi-day-old falling wedge bullish chart pattern. Hence, a clear upside break of 0.6275 appears necessary to lure buyers.
Alternatively, the recent multi-month low around 0.6100 could test the NZD/USD before directing them to the convergence of downward sloping support lines from June 22 and January 27, around 0.6025.
In a case where NZD/USD buyers keep reins past 0.6025, the 0.6000 psychological magnet and lows marked during May 2020, around 0.5920, will be crucial to watch.
Overall, NZD/USD rebound remains elusive until staying below 0.6275. Though, the pair’s downside has limited room to the south.
NZD/USD: Daily chart
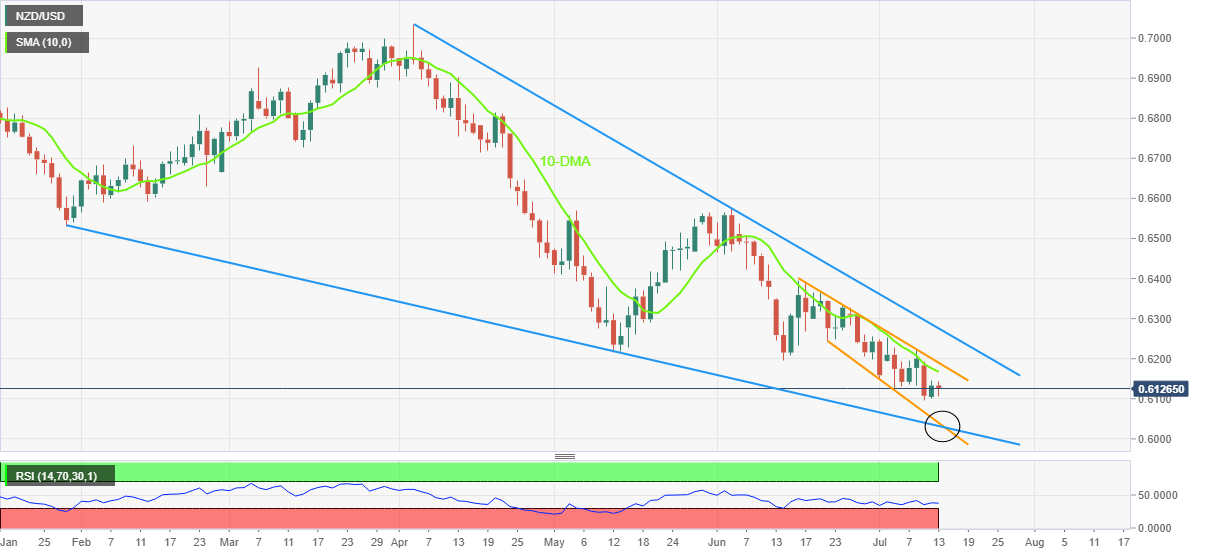
Trend: Further recovery expected
Open interest in gold futures markets went up for the third session in a row on Tuesday, this time by around 26.6K contracts, the largest single day build since February 17. Volume followed suit and rose by around 143.4K contracts
Gold: Next level wo watch at $1,700
Tuesday’s drop in prices of gold was against the backdrop of further increase in open interest while volume also ticked higher. That said, extra weakness remains on the cards and the yellow metal could slip back to the $1,700 region per ounce troy in the very near term.
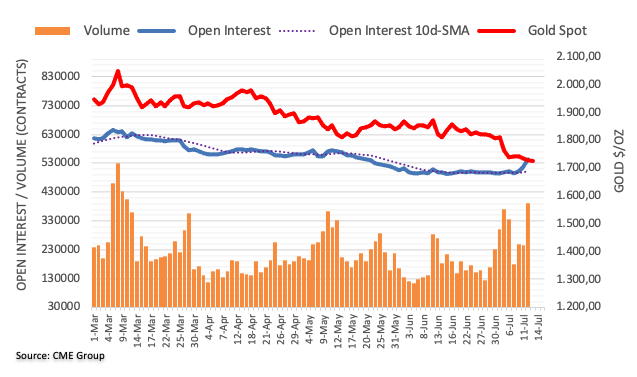
FX Strategists at UOB Group Lee Sue Ann and Quek Ser Leang noted EUR/USD could drop to 0.9960 and 0.9920 in the next few weeks.
Key Quotes
24-hour view: “We highlighted yesterday that EUR ‘could break the critical support at 1.0000 but may not be able to maintain a foothold below this level’. EUR subsequently dipped to 0.9998 before rebounding to close little changed at 1.0036 (-0.03%). Downward pressure appears to have eased and EUR is likely to trade sideways for today, expected to be within a range of 1.0000/1.0070.”
Next 1-3 weeks: “We highlighted yesterday (12 Jul, spot at 1.0045) that solid downward momentum suggests a break of 1.0000 would not be surprising. We indicated that the next levels to focus on are at 0.9960 and 0.9920. EUR subsequently dipped to 0.9998 before rebounding. Despite the rebound, EUR is still weak and the next levels to monitor are at 0.9960 and 0.9920. Overall, only a break of 1.0150 (‘strong resistance’ level was at 1.0180 yesterday) would indicate that the weakness in EUR that started about two weeks ago has stabilized.”
- GBP/USD struggles to cheer softer USD on UK fundamentals, retreats from intraday high.
- Shortcomings in British strategies to cope-up with economic challenges, political jitters to weigh on the cable.
- UK’s prints of trade and production numbers could offer immediate directions.
- US CPI for June will be crucial amid fears of recession, hawkish Fed bets.
GBP/USD retreats to 1.1900 amid the market’s anxiety ahead of the key UK/US data. Even so, the cable pair snaps a two-day downtrend while staying above a two-year low, marked the previous day, heading into Wednesday’s London open.
Mildly positive market sentiment underpinned the US dollar’s pullback and favored the GBP/USD to consolidate losses around a multi-month low earlier in Asia. The reason for the mildly positive sentiment could be linked to the upbeat White House (WH) statement and softer US data.
As per Reuters, “The US economic data, including the June jobs report, are not consistent with a recession in the first or second quarters,” the White House said in a memo released on Tuesday. The news contributed to the market’s profit booking moves ahead of the key data/events. Further, the US NFIB Business Optimism Index for June slumped to the lowest since early 2013 while flashing 89.5 figures versus 93.1 prior.
At home, the Financial Times (FT) marks a lack of strategies to hint at pessimism surrounding the UK. “The UK needs a coherent long-term economic strategy that underpins robust growth in national output, following years of inconsistency from ministers, according to three reports published on Wednesday,” said the news. The update mentioned Resolution Foundation, Treasury select committee and National Audit Office as the key reports for favoring the conclusion.
Elsewhere, ex-Chancellor of the UK Rishi Sunak appears to follow the renowned leader Margret Thatcher to aim for economic recovery, if he is elected as the Prime Minister (PM). “Tax cuts will follow in time but the Tory leadership contender tells The Telegraph that tackling the ‘enemy’ that is inflation is key,” per the news conveyed by Reuters.
Amid these plays, the US Dollar Index (DXY) struggles around a 20-year high while S&P 500 Futures and the US 10-year Treasury yields both snap a two-day downtrend. Further, stocks in the Asia-Pacific region also appear to fade the previous bearish bias.
Looking forward, an anticipated recovery in the UK’s monthly Gross Domestic Product (GDP) for May, expected 0.0% versus -0.3% prior, could join the likely improvement in the MoM readings of the Manufacturing Production and Industrial to favor GBP/USD bulls. However, any disappointment from the data won’t hesitate to recall sellers.
Following that, the US Consumer Price Index (CPI) for June, expected to rise to 8.8% YoY from 8.6%, will be crucial for the pair traders to watch.
Technical analysis
GBP/USD stays inside a three-week-old bearish channel formation amid downbeat RSI conditions. That said, the quote’s latest weakness eyes the recently flashed multi-month low near 1.1810. Following that, the 1.1800 threshold and the lower line of the stated channel, around 1.1740 by the press time, could lure the pair bears.
On the flip side, recovery remains elusive until the quote remains inside the stated channel. That said, the 50-SMA level of 1.1990 acts as an extra filter to the north, other than the stated channel’s resistance line near 1.1960.
- Steel Price remains pressured for the second consecutive day.
- Fears of economic slowdown in the US, China’s coronavirus-led activity restrictions weigh on prices.
- Updates on India’s readiness for price revision, US inflation will be important for fresh impulse.
Steel Price stays on the bear’s radar as they renew 2022 bottom at around 3,885 offshore yuan during Wednesday’s Asian session. That said, the metal takes offers around CNH 3,885, $577, amid fears of contraction in global demand, mainly from the US and China.
The latest economic projections from the International Monetary Fund (IMF) appear to have renewed the market fears. The same could exert downside pressure on the Steel Price as softer GDP in the world’s largest economy questions the metal’s demand.
It should be noted that multiple cities in China are on a halt due to the covid-led restrictions. While the same weighs on the Steel Price, it should also improve the quote amid a halt in the steel output from China. However, broad fears of the economic slowdown and China’s inability to please steel buyers with hopes of major stimulus appear to have played their role in luring steel sellers.
Furthermore, comments from the Chinese Customs Official also weigh on the Steel Price. “China's foreign trade still faces instabilities and uncertain factors even as trade growth in May and June reversed the declining trend in April, said Li Kuiwen, a spokesman for the General Administration of Customs, during a news conference in Beijing on Wednesday,” per Reuters.
Elsewhere, the White House (WH) statement joined downbeat US data to trigger the market’s cautious optimism and test the steel bears. “The US economic data, including the June jobs report, are not consistent with a recession in the first or second quarters,” the White House said in a memo released on Tuesday, as reported by Reuters. The news contributed to the market’s profit booking moves ahead of the key data/events. Further, the US NFIB Business Optimism Index for June slumped to the lowest since early 2013 while flashing 89.5 figures versus 93.1 prior.
Moving on, Steel traders should pay attention to the US inflation data as strong inflation could increase the odds of a faster Fed rate hike and weigh on the quote. However, any negative surprise could help the metal to consolidate the recent losses around a multi-month low.
- Asian indices are trading positive amid a recovery in the S&P500 futures.
- Investors have started discounting the higher consensus for US inflation.
- Oil prices have hit a fresh three-month low on escalating recession fears.
Markets in the Asian domain are trading modestly positive as the S&P futures have rebounded in the Asian session. The US indices futures have displayed some recovery as investors have discounted the higher consensus for the US Consumer Price Index (CPI). Also, the US dollar index (DXY) has started correcting after a mild recovery.
At the press time, Japan’s Nikkei225 added 0.51%, China A50 gained 0.46%, Hang Seng jumped 0.74% and Nifty50 rose 0.44%.
The market participants are entirely focusing on the release of the inflation rate and a sideways movement is expected today. The inflation rate is seen higher at 8.8% on an annual basis. This may compel the Federal Reserve (Fed) to paddle up the interest rates further. No doubt, the extent of the rate hike would be akin to the prior interest rate decision as price pressures are scaling higher despite the former rate hikes and balance sheet reduction announcement.
In Asia, renewed lockdown worries in China are trimming the growth forecasts. The economy carries good trade relations with various Asian countries and a slump in demand forecasts in China will have multiplier effects on other nations.
On the oil front, accelerating recession fears have dragged the oil prices to near $92.00. The black gold has dropped below its three-month low and more downside looks warrant as Western central banks have not done with rate hike campaign.
- USD/INR fails to extend the previous day’s pullback from record top.
- Oil prices cheer US dollar pullback from 20-year, cautious optimism.
- US CPI for June appears the key for near-term market directions.
USD/INR picks up bids to 79.54, reversing the pullback from an all-time high, as buyers cheer firmer oil prices during Wednesday’s Asian session. The Indian rupee (INR) pair’s weakness could also be linked to the nation’s official consumer inflation data, published late Tuesday.
“India's annual consumer inflation remained painfully above the 7% mark and beyond the central bank's tolerance band for the sixth month in a row, official data showed on Tuesday, raising prospects of more rate hikes by the central bank next month,” per Reuters.
On the other hand, the market sentiment improves ahead of the key US Consumer Price Index (CPI) for June, expected to rise to 8.8% YoY from 8.6%, which in turn underpins the rebound in oil prices.
That said, the prices of WTI crude oil recover from the lowest levels since late February while snapping a two-day downtrend, up 0.32% intraday near $93.75.
It’s worth noting that the latest recovery in risk profile could be linked to the upbeat White House (WH) statement and softer US data.
As per Reuters, “The US economic data, including the June jobs report, are not consistent with a recession in the first or second quarters,” the White House said in a memo released on Tuesday. The news contributed to the market’s profit booking moves ahead of the key data/events. Further, the US NFIB Business Optimism Index for June slumped to the lowest since early 2013 while flashing 89.5 figures versus 93.1 prior.
While portraying the mood, S&P 500 Futures and the US 10-year Treasury yields both snap a two-day downtrend. Further, stocks in the Asia-Pacific region also appear to fade the previous bearish bias.
Moving on, USD/INR traders may witness inaction as markets brace for the US inflation numbers.
Technical analysis
USD/INR seller may consider the Gravestone Doji candlestick at the all-time to take the risk of entry should the quote drops below a two-week-old support line, around 79.28 by the press time. Meanwhile, an upside break of 79.80 defies the bearish candlestick and can propel the prices towards the 80.00 psychological magnet.
Analysts at Goldman Sachs offer a sneak peek at what to expect from Wednesday’s Bank of Canada’s (BOC) interest rate decision due at 1400 GMT.
Key quotes
"We expect the BoC to act "more forcefully" and hike the policy rate by 75bp this week to 2.25%. Beyond this week, we expect another 75bp hike in September, 50bp hikes in October and December, and a 4.25% terminal rate reached in Q1 2023.”
“The main drivers of our hawkish BoC call are that we expect headline CPI inflation to remain above 7% this year and for the BoC to respond aggressively to any signs of entrenched inflation.”
"Risks to our hawkish terminal rate forecast are to the downside. A more significant US growth slowdown or a crash in the housing market would likely mean that the BoC hikes less in December and January than we expect."
- USD/JPY is aiming to reclaim all-time highs at 137.80 as US CPI is expected to accelerate.
- The negative divergence in the core CPI and plain-vanilla CPI dictates the impact of oil and food prices.
- The BOJ is putting efforts to spurt the inflation rate and in maintaining it above 2%.
The USD/JPY pair is scaling higher on a bullish open-rejection reverse trading structure. The asset opened at 136.83 and slipped lower to 136.70, however, a responsive buying action drove the pair above the opening price confidently. The major has comfortably established above 137.00 and is likely to reclaim its all-time highs at 137.80 on expectations of a higher inflation rate by the US Bureau of Labor Statistics.
As per the market consensus, investors should brace for an elevation in the price rise to 8.8%. Taking into account the prior release of 8.6%, the mathematics indicate an increment by 20 basis points (bps). However, the impact of energy bills and food products is more than that.
The core Consumer Price Index (CPI) that doesn’t inculcate oil and food prices may slip to 5.7% from the prior release of 6%. A simultaneous increase in plain-vanilla CPI and a decrease in core CPI indicates that the impact of oil food prices is more than expected.
Apart from the US Inflation, Friday’s US Retail Sales will also remain in focus this week. The economic data is seen meaningfully higher at 0.8% than the prior print of -0.3%.
On the Tokyo front, the continuation of the dovish stance by the Bank of Japan (BOJ) will weaken the yen bulls further. The BOJ has no intention to even move toward a neutral stance as the economy needs more liquidity to accelerate inflation further and also for managing it above 2%. Also, Japan’s core CPI needs much attention.
Ahead of the release of China’s trade balance data, the General Administration of Customs China (GACC) said that “foreign trade faces instabilities, uncertain factors.”
Additional quotes
Trade growth in May and June reversed declining trend in April.
Foreign trade expected to achieve stable growth.
China H1 exports of agricultural products up 21.7% in yuan terms.
- A descending triangle formation is indicating a squeeze in volatility.
- The 200-EMA has acted as a major hurdle for the kiwi bulls.
- The RBNZ has elevated its OCR by 50 bps to 2.50%.
The NZD/JPY pair has surrendered its sharp upside move from 84.20 after the announcement of the interest rate decision by the Reserve Bank of New Zealand (RBNZ). The central bank has announced a rate hike by 50 basis points (bps). Officially, the Official Cash Rate (OCR) has escalated to 2.50%. On a broader note, the cross is declining gradually after surrendering the crucial support of 85.00.
A descending triangle formation on an hourly chart is indicating a squeeze in volatility. The downward sloping trendline of the above-mentioned chart pattern is plotted from June 28 high at 85.29 while the horizontal support is placed from June 16 low at 83.00. The cross is expected to remain sideways further.
The yen bulls have defended the 200-period Exponential Moving Average (EMA) at 84.10. Also, the kiwi bulls have slipped below the 20-period EMA at 83.88.
Meanwhile, the Relative Strength Index (RSI) (14) has faced barricades around 60.00, which signals that the kiwi bulls need more momentum to deliver a fresh leg of the rally.
A downside break of the descending triangle at 83.00 will drag the asset towards May 26 low at 81.88, followed by May 24 low at 81.88.
On the flip side, the kiwi bulls could attain the dominant position if the asset oversteps July 11 high at 84.70, which will send the asset towards the round-level resistance of 85.00. A breach of the latter will drive the cross towards June 28 high at 85.29.
NZD/JPY hourly chart
-637932770446397586.png)
| Raw materials | Closed | Change, % |
|---|---|---|
| Silver | 18.935 | -0.94 |
| Gold | 1726.3 | -0.42 |
| Palladium | 2028.08 | -5.03 |
- AUD/NZD takes the bids to refresh daily top, rises for the first time in three day.
- RBNZ matches market expectations of 0.50% rate hike but Rate Statement appeared to have drowned NZD.
- Risk appetite remains cautiously optimistic ahead of the key data/events.
- China trade numbers, US inflation are crucial catalysts to watch for intraday directions.
AUD/NZD surges to 1.1050 after the Reserve Bank of New Zealand (RBNZ) announcements during Wednesday’s Asian session. In doing so, the cross-currency pair fails to cheer the RBNZ’s 0.50% rate hike as the Rate Statement raised doubts about the Pacific nation’s short-term economic conditions.
RBNZ matches the market’s forecasts of increasing the Official Cash Rate (OCR) by 50 basis points (bps) to 2.5%, announcing the year’s fourth rate hike. However, downbeat comments from the Rate Statement seem to weigh on the New Zealand dollar (NZD) after the RBNZ announcements. “Committee noted that while there are near-term upside risks to consumer price inflation, there are also medium-term downside risks to economic activity,” per the latest RBNZ Rate Statement.
Elsewhere, the market’s cautious optimism appears to have favored AUD/NZD buyers even if optimists are being probed by the cautious mood ahead of the US Consumer Price Index (CPI) for June, expected to rise to 8.8% YoY from 8.6%. The reason for the mildly positive sentiment could be linked to the upbeat White House (WH) statement and softer US data.
As per Reuters, “The US economic data, including the June jobs report, are not consistent with a recession in the first or second quarters,” the White House said in a memo released on Tuesday. The news contributed to the market’s profit booking moves ahead of the key data/events. Further, the US NFIB Business Optimism Index for June slumped to the lowest since early 2013 while flashing 89.5 figures versus 93.1 prior.
Additionally, chatters that the latest jump in Shanghai’s covid numbers was inside the quarantine area and was well expected also likely to have favored the AUD/NZD rebound.
Against this backdrop, S&P 500 Futures and the US 10-year Treasury yields both snap a two-day downtrend by the press time, even if flashing mild gains of late.
Moving on, China trade data for June and US CPI will be crucial for the pair traders to watch. Also important will be the risk catalysts like covid updates and chatters surrounding inflation and recession.
Technical analysis
Although an upside break of the 50-DMA, around 1.1040 by the press time, keeps AUD/NZD bulls hopeful, a downward sloping resistance line from June 28, close to 1.1095 at the latest, could challenge the pair buyers.
In its minutes published alongside the monetary policy statement, the Reserve Bank of New Zealand (RBNZ) noted that the “committee agreed to maintain its approach of briskly lifting the OCR.”
Additional takeaways
Members noted that the New Zealand dollar exchange rate has depreciated
Committee noted that the weaker New Zealand dollar is continuing to have an impact on New Zealand dollar import prices.
Committee remains broadly comfortable with the projected path of the OCR outlined in the recent may monetary policy statement.
Members agreed that the increase in mortgage interest rates will assist to bring house prices more in line with sustainable levels.
Committee viewed this strategy as consistent with achieving their primary inflation and employment objectives.
Noted that while there are near-term upside risks to consumer price inflation, there are also medium-term downside risks to economic activity.
-
NZD/USD drops back towards 0.6100 despite RBNZ rate hike, US inflation eyed
- NZD/USD fades the previous day’s corrective pullback from 26-month low.
- RBNZ matches market expectations of lifting the benchmark rates to 2.5% from 2.0%.
- RBNZ Rate Statement appears to have played its role by marking growth fears.
- US CPI for June will be an important event, risk catalysts are crucial too.
NZD/USD takes offers to renew intraday low around 0.6112 even as the Reserve Bank of New Zealand (RBNZ) announced the 0.50% rate hike on Wednesday.
The reason for the Kiwi pair’s pullback could be linked to the RBNZ Rate Statement. As per Reuters updates, the RBNZ Rate Statement mentioned, “Committee noted that while there are near-term upside risks to consumer price inflation, there are also medium-term downside risks to economic activity.”
Other the RBNZ-led moves, the NZD/USD prices previously cheered the market’s cautious optimism ahead of the key US Consumer Price Index (CPI) for June, expected to rise to 8.8% YoY from 8.6%. The reason for the mildly positive sentiment could be linked to the upbeat White House (WH) statement and softer US data.
“The US economic data, including the June jobs report, are not consistent with a recession in the first or second quarters,” the White House said in a memo released on Tuesday, as reported by Reuters. The news contributed to the market’s profit booking moves ahead of the key data/events. Further, the US NFIB Business Optimism Index for June slumped to the lowest since early 2013 while flashing 89.5 figures versus 93.1 prior.
Additionally, chatters that the latest jump in Shanghai’s covid numbers was inside the quarantine area and was well expected also likely to have favored the NZD/USD rebound during the early Asian session.
Amid these plays, S&P 500 Futures and the US 10-year Treasury yields both snap a two-day downtrend by the press time, even if flashing mild gains of late.
Moving on, NZD/USD traders should pay attention to the US inflation data as strong inflation could increase the odds of a faster Fed rate hike and weigh on the quote. However, any negative surprise could help the pair buyers to extend the latest corrective pullback from the yearly low.
Technical analysis
MACD and RSI (14) appear less favorable to the NZD/USD bears. However, downward sloping support lines from June 22 and January 27 coincide at 0.6025 to make it the key support. Alternatively, the 10-DMA level surrounding 0.6170 precedes a three-week-old resistance line, close to 0.6180 at the latest, to restrict short-term NZD/USD upside.
At its July 13 monetary policy meeting, the Reserve Bank of New Zealand (RBNZ) announced a 50 bps increase to the Official Cash Rate (OCR), raising it from 2% to 2.5%, as widely expected.
RBNZ said: “The Committee agreed it remains appropriate to continue to tighten monetary conditions at pace to maintain price stability and support maximum sustainable employment.”
Additional takeaways
Remains appropriate to continue to tighten policy.
To tighten conditions at pace to maintain price stability and support maximum sustainable employment.
: committee is resolute in its commitment to ensure consumer price inflation returns to within the 1 to 3 percent target range.
Committee agreed to continue to lift the OCR to a level where it is confident consumer price inflation will settle within the target range.
Once aggregate supply and demand are more in balance, the OCR can then return to a lower, more neutral, level.
Spending and investment demand continues to outstrip supply capacity, with a broad range of indicators highlighting pervasive inflation pressures.
Spending and investment demand continues to outstrip supply capacity, with a broad range of indicators highlighting pervasive inflation pressures.
Committee acknowledged there is a near-term upside risk to consumer price inflation and emerging medium-term downside risks to economic activity.
Employment remains above its maximum sustainable level and the reserve bank’s core inflation measures are around 4 percent.
A majority of the economists forecast the RBNZ raising rates by 50 basis points to 2.50% at its July 13 meeting while expecting the OCR to reach 3.50% or higher by the end of this year.
Market reaction
With an initial reaction to the RBNZ announcement, NZD/USD remains unchanged at around 0.6130. At the time of writing, the kiwi drops 0.33% to 0.6115, in a delayed response to the outcome.
Why the RBNZ rate decision matters to traders?
The Reserve Bank of New Zealand (RBNZ) holds monetary policy meetings seven times a year, announcing their decision on interest rates and the economic assessments that influenced their decision. The central bank offers clues on the economic outlook and future policy path, which are of high relevance for the NZD valuation. Positive economic developments and upbeat outlook could lead the RBNZ to tighten the policy by hiking interest rates, which tends to be NZD bullish. The policy announcements are usually followed by Governor Adrian Orr’s press conference.
- Gold Price portrays a corrective pullback from yearly low.
- White House optimism joins softer US data and mixed updates on China covid to favor XAUUSD recovery.
- US CPI for June will be crucial amid fears of Fed’s aggression, recession.
Gold Price (XAUUSD) picks up bids to consolidate recent losses around the lowest levels since September 2021, up 0.08% intraday near $1,727on Wednesday. The metal’s near-term technical outlook suggests a corrective pullback in prices. However, fundamentals are against the gold buyers amid fears of recession and chatters surrounding the Fed’s aggressive rate hikes.
Gold Price portrays market’s indecision
Market sentiment remains mixed, after witnessing a cautious optimism the previous day. While portraying the mood, the US Dollar Index (DXY) regains upside momentum amid fears of recession/inflation. However, the mildly bid S&P 500 Futures and the recovery in the US Treasury yields, up by 2.7 basis points (bps) to 2.985% at the latest, also hints at the improvement in risk appetite. Hence, a lack of clear directions confuses traders and the same could be witnessed in the latest Gold Price moves.
Also read: Gold Price Forecast: XAUUSD hangs by a thread above $1,700.00
White House statement, mixed data favor XAUUSD rebound

Gold bars
The White House (WH) Memo appeared to have challenged the market bears of late. . “The US economic data, including the June jobs report, are not consistent with a recession in the first or second quarters,” the White House said in a memo released on Tuesday, as reported by Reuters.
On the same line was the US NFIB Business Optimism Index for June and Eurozone/German ZEW Survey data for July. The US business sentiment gauge dropped to the lowest since early 2013 while flashing 89.5 figures versus 93.1 prior. Additionally, ZEW Survey data for July showed that German Economic Sentiment slumped to -53.8 while missing estimates of -38.3. Its counterpart for Eurozone also dropped to -51.1 versus the -28.0 previous reading and -32.8 expected. Further, Germany’s ZEW Survey Current Situation sub-index arrived at -45.8 in July compared to -34.5 expectations.
IMF probes optimists
The latest economic projections from the International Monetary Fund (IMF) appear to have renewed fears of a slowdown, even if it fails to probe gold buyers. That said, the IMF cuts US 2022 GDP growth projection to 2.3% from 2.9% in late June, due to revised US data. “The Fund included the new forecasts in the full report of its annual assessment of the U.S. economy, which highlighted the challenges of high inflation and the steep Federal Reserve interest rate hikes needed to control prices,” said Reuters.
Coronavirus conditions in China
Covid updates from China flash mixed signals for the Gold Price. The reason could be linked to the virus variant’s faster spread in Shanghai and the recently announced lockdown in Wugang city of Henan Province. With the latest economic unlock not being too far, fresh activity restrictions could recall the market fears of economic slowdown and favor the pair bears. It should, however, be noted that the latest jump in Shanghai’s covid numbers was inside the quarantine area and challenges the pessimism, which in turn favors XAUUSD buyers.
US CPI is the key
US Consumer Price Index (CPI) numbers for June will be crucial for the Gold Price amid the hawkish bets on the Fed. Forecasts suggest the US CPI rise to 8.8% YoY from 8.6%, which in turn could increase the odds of a faster Fed rate hike and weigh on the Gold Price. However, any negative surprise could help XAUUSD to extend the latest corrective pullback from the yearly low.
Gold Price technical outlook
Gold Price rebounds from a horizontal area established since April 2021 while recently refreshing the intraday high. XAUUSD rebound also takes clues from the oversold RSI conditions.
However, recovery needs to cross the December 2021 low surrounding $1,755 to convince the gold buyers. Even so, the 61.8% Fibonacci retracement of March 2021-22 upside, near $1,828, could challenge the metal’s further upside.
Meanwhile, a downside break of the aforementioned horizontal support area surrounding $1,720-25, could direct Gold Price towards an upward sloping support line from March 2021, at $1,708 by the press time.
In a case where the quote drop below $1,708, the $1,700 threshold may test the bears before directing them to the 2021 bottom surrounding $1,676.
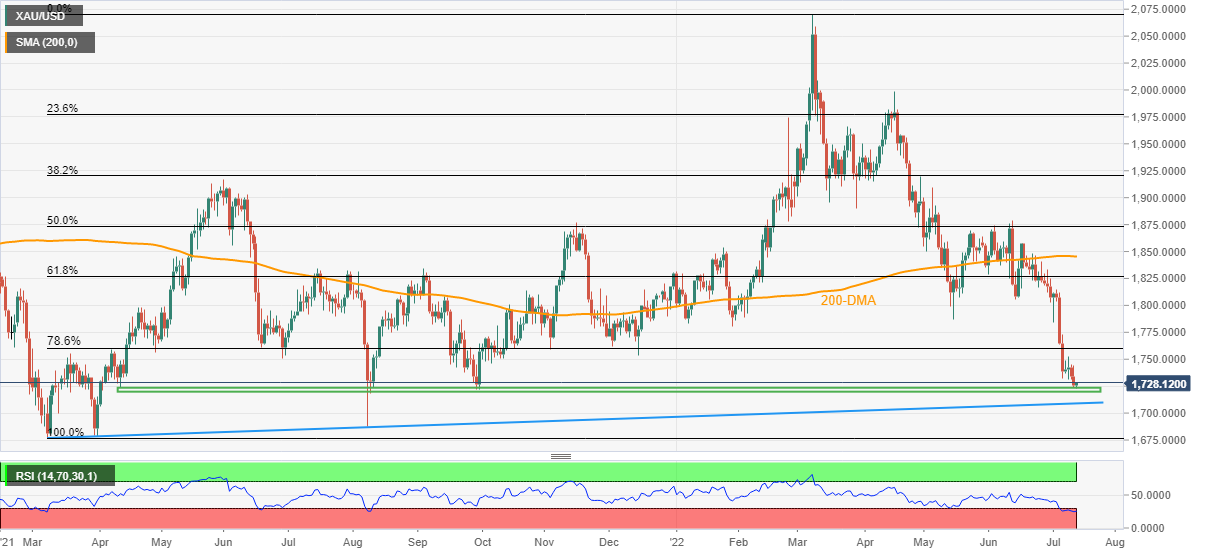
Gold Price remains bearish near term
In recent trade today, the People’s Bank of China (PBOC) set the yuan (CNY) at 6.7282 vs. the last close of 6.7229.
About the fix
China maintains strict control of the yuan’s rate on the mainland.
The onshore yuan (CNY) differs from the offshore one (CNH) in trading restrictions, this last one is not as tightly controlled.
Each morning, the People’s Bank of China (PBOC) sets a so-called daily midpoint fix, based on the yuan’s previous day's closing level and quotations taken from the inter-bank dealer.
South Korea's central bank, BoK, has hiked its key rate to 2.25% from 1.75%. This follows a 25-basis-point increase in the previous meeting in May. It is the first time that the central bank has raised the benchmark rate by 50 basis points, taking a so-called "big step."
In May, the BoK's newly-appointed Governor Rhee Chang-yong, due to chair his first policy meeting on Thursday, said he could consider bigger interest rate increases in coming months. The outcome was expected based on a majority view of 17 of 28 economists prior to the decision.
- Loss of momentum near 0.6100 has strengthened the kiwi bulls for a bullish reversal.
- The asset has surrendered the cushion of 20- and 50-EMAs.
- Going forward, the announcement of the interest rate decision by the RBNZ will be of utmost importance.
The NZD/USD pair is displaying a vulnerable performance right from the first tick printed in early Tokyo. It looks like the correction from Tuesday’s high at 0.6146 has been carry-forwarded on Wednesday ahead of the interest rate decision by the Reserve Bank of New Zealand (RBNZ).
The greenback bulls have remained in a dominant position for the past month. Now, the dominant position is facing troubles as the oscillators are displaying exhaustion signals. The asset continuously formed lower lows while the Relative Strength Index (RSI) (14) formed higher lows, which indicates a loss of downside momentum and is termed a negative bullish divergence.
The correction from Tuesday’s high at 0.6146 has dragged the asset below the 20- and 50-period Exponential Moving Averages (EMAs) at 0.6128 and 0.6134 respectively has turned the short-term bullish bias into negative.
The release of the interest rate decision by the RBNZ will fetch extreme volatility on the counter. However, a decisive break above Tuesday’s high at 0.6146 will drive the asset towards the round-level resistance of 0.6200. A breach of the latter will send the asset to near June 4 high at 0.6253.
Alternatively, the greenback bulls could extend losses if the asset drags below June 11 low at 0.6097. This will bring a serious decline in the asset towards 19 May 2020 low at 0.6033, followed by the psychological support at 0.6000.
NZD/USD hourly chart
-637932713213262898.png)
- AUD/USD reverses the previous day’s corrective pullback from two-year low.
- Impending bear cross on MACD, downbeat RSI hints at the quote’s further weakness.
- Weekly support line lures sellers, bulls need validation from fortnight-old horizontal area.
AUD/USD flirts with an intraday low near 0.6740 as it retreats from the 50-HMA during Wednesday’s Asian session. In doing so, the Aussie pair also reverses from a broad horizontal area established from July’s start.
In addition to the pullback from the short-term key hurdles, a looming bear cross on the MACD and downward sloping RSI (14), not oversold, also keeps AUD/USD sellers hopeful.
That said, the recent multi-month low of 0.6710 appears immediate support for the pair traders to watch ahead of a one-week-old descending trend line, close to the 0.6700 threshold.
Also acting as the downside filter is March 2020 top surrounding 0.6685.
Meanwhile, the 50-HMA guards the quote’s immediate recovery moves around 0.6760 before the previously mentioned resistance area, between 0.6765 and 0.6780, plays its role.
Should the AUD/USD prices rise beyond 0.6780, the pair buyers may brace for the monthly high of 0.6900.
Overall, AUD/USD holds its bearish bias but the downside appears limited.
AUD/USD: Hourly chart
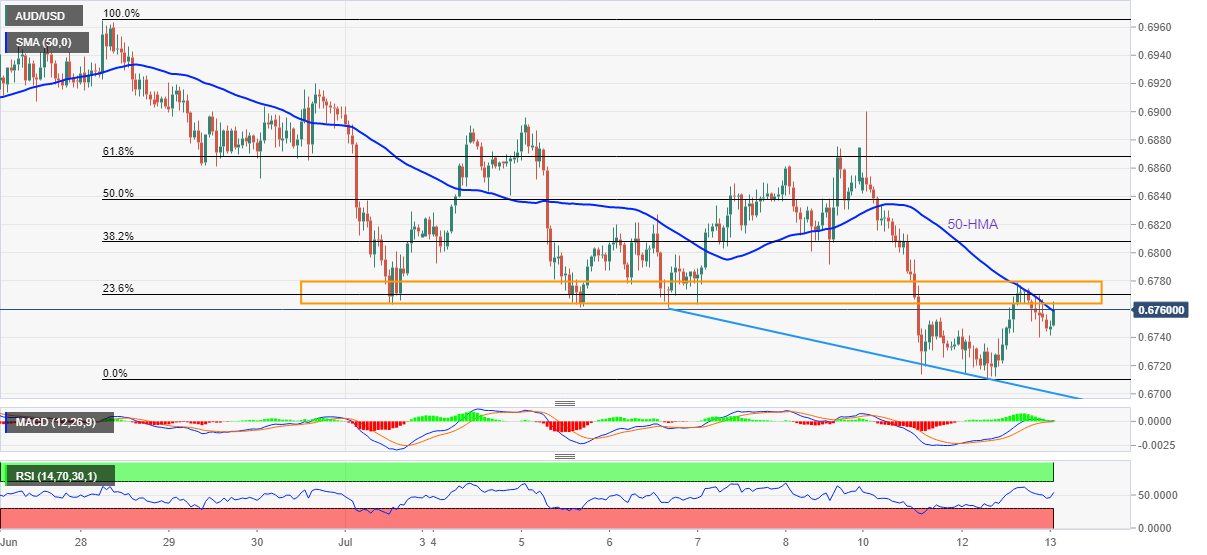
Trend: Further weakness expected
Early Wednesday at 02:00 GMT market sees the key monetary policy decision by the Reserve Bank of New Zealand (RBNZ) amid hopes of another hawkish play by the New Zealand central bank.
Despite the recently mixed data at home, not to forget China’s fresh covid woes and challenges to growth, the RBNZ policymakers are likely bracing for a fourth rate hike in 2022, worth 50 basis points (bps) to 2.50%.
Although such a rate hike is already priced-in, recent geopolitical tensions surrounding Russia join the optimists’ calls for consecutive 50 basis points (bps) of a rate-lifts in the future to make today’s RBNZ Interest Rate Decision interesting for the NZD/USD traders.
Ahead of the event, Australia and New Zealand Banking Group (ANZ) said,
The RBNZ is widely expected to hike the OCR 50bp for a third time today, taking the OCR to 2.5%. We expect a very hawkish tone to be maintained, setting up another 50bp hike in August. There has been no meaningful decline in inflation indicators since the May MPS, though downside growth risks continue to accumulate on the back of the weak housing market and consumer confidence – and now a COVID resurgence.
On the same line, analysts at Westpac said,
We expect the RBNZ will raise the Official Cash Rate by another 50 basis points to 2.50%, in line with consensus forecasts and market pricing. Recent developments have been mixed for the monetary policy outlook. Near–term inflation is still running hot, but the risks of a global slowdown have increased and early signs of a cooling in domestic activity have started to emerge. For now, the RBNZ will need to carry through with the interest rate hikes it has signaled, or risk undoing its good work so far on bringing inflation pressures under control. Looking further ahead, the evidence for a softening in activity is more anecdotal than definitive at this stage. However, at some point in the coming months it will be appropriate to signal that the end of the tightening cycle is near.
Considering the market consensus, FXStreet’s Dhwani Mehta said,
Wednesday’s RBNZ announcement could rescue NZD bulls from over two-year lows, should the bank stick to its hawkish guidance on the interest rates. In such a case, NZD/USD could rebound towards the 0.6200 level. A recovery in risk sentiment combined with a broad US dollar retreat is critical to aiding the pullback in the currency pair.
How could it affect NZD/USD?
NZD/USD reverses the previous day’s corrective pullback from a two-year low as it drops to 0.6120 ahead of the RBNZ announcements. The Kiwi pair’s recent losses could be linked to the market’s cautious mood ahead of the RBNZ and the US Consumer Price Index (CPI) for June. Also exerting downside pressure on the quote could be the recently announced downbeat US economic projections from the International Monetary Fund (IMF). Furthermore, an increase in Shanghai’s covid numbers inside the quarantine area also exerts downside pressure on the quote.
That said, the RBNZ rate hike worth 50 bps is widely discussed as the NZD/USD remains pressured around a two-year low. Hence, an increase in the benchmark rate worth the estimations won’t make any major difference to the Kiwi pair trader until the accompanying rate statement hints at a further increase in the Official Cash Rate (OCR).
Hence, NZD/USD prices may witness a knee-jerk rebound on the RBNZ’s 50 bps rate hike but any disappointment, either via softer rate action or from the Rate Statement, will have larger repercussions.
Technically, the oscillators are less favorable to the NZD/USD bears. However, downward sloping support lines from June 22 and January 27 coincide at 0.6025 to make it the key support. Alternatively, the 10-DMA level surrounding 0.6170 precedes a three-week-old resistance line, close to 0.6180 at the latest, to restrict short-term NZD/USD upside.
Keynotes
NZD/USD retreats towards 0.6100 ahead of RBNZ Interest Rate Decision, US CPI
Reserve Bank of New Zealand Preview: Hitting the repeat button despite hard-landing fears
About the RBNZ interest rate decision and rate statement
The RBNZ interest rate decision is announced by the Reserve Bank of New Zealand. If the RBNZ is hawkish about the inflationary outlook of the economy and raises the interest rates it is positive, or bullish, for the NZD. The RBNZ rate statement contains the explanations of their decision on interest rates and commentary about the economic conditions that influenced their decision.
- Oil prices are expected to slip towards $90.00 on further escalation in recession fears.
- Lockdown worries in China and interest rate hikes by Western central banks have trimmed forecasts.
- A release of higher US inflation print may expose the black gold to more downside.
West Texas Intermediate (WTI), futures on NYMEX, have displayed a sheer downside after surrendering the psychological support of 100.00 last week. The black gold registered a fresh three-month low at $91.70 on Tuesday. More downside is expected by the oil prices towards $90.00 as demand woes are likely to accelerate further on lockdown worries in China.
The nightmare of a decent slump in the demand for oil is haunting the oil bulls. Western central banks are stepping up their interest rates to contain the soaring inflation. The deployment of policy tightening measures is squeezing liquidity from the market and the corporate sector is left with costly money. This has forced them to add more filters to their investment opportunities. Lower investment by the corporate is hurting the oil demand.
Apart from that, the resurgence of Covid-19 in China despite the adaptation of the Zero-Covid policy in the past two months has spooked the market sentiment. The back-to-back pandemic situation has renewed the fears of slippage in economic activities. The deployed restrictions on the movement of men, materials, and machines have dampened the market mood. It is worth noting that China is the largest exporter of oil and growing concerns about the oil demand in its largest consuming territory are sufficient to bring extreme volatility in the oil prices.
Going forward, the release of the US inflation will have a significant impact on oil prices. A higher inflation print in comparison to its estimates may shore up the greenback and hammer oil prices further. As per the market consensus, US inflation is seen at 8.8%.
- GBP/USD remains pressured around the lowest levels since March 2020.
- Three-week-old bearish channel joins downbeat RSI to keep sellers hopeful.
- Key SMAs add to the upside filters, two-month-old support line challenges bears.
GBP/USD retreats towards 1.1850 as it failed to extend the corrective pullback from the 28-month low beyond 1.1916. That said, the cable pair prints mild losses around 1.1880 during Wednesday’s Asian session.
In doing so, the quote stays inside a three-week-old bearish channel formation amid downbeat RSI conditions.
That said, the quote’s latest weakness eyes the recently flashed multi-month low near 1.1810.
Following that, the 1.1800 threshold and the lower line of the stated channel, around 1.1740 by the press time, could lure the GBP/USD bears.
It should be noted, however, that a downward sloping support line from May 12, near 1.1730 could test the pair’s weakness past 1.1740.
On the flip side, recovery remains elusive until the quote remains inside the stated channel. That said, the 50-SMA level of 1.1990 acts as an extra filter to the north, other than the stated channel’s resistance line near 1.1960.
Even so, the GBP/USD buyers could remain worried unless witnessing a clear upside break of the 200-SMA level surrounding 1.2260.
GBP/USD: Four-hour chart
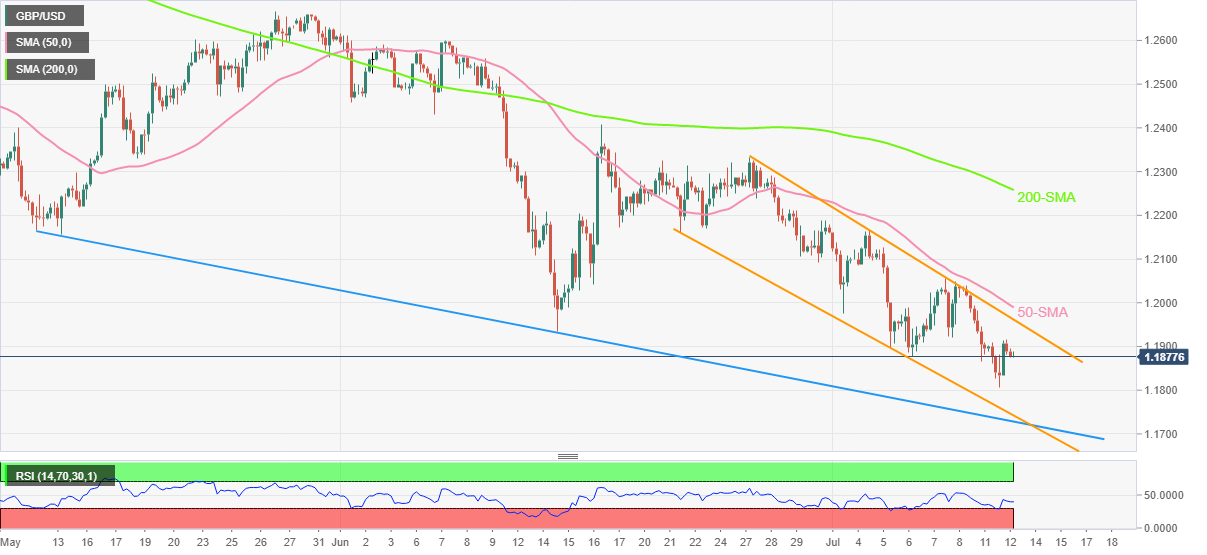
Trend: Further weakness expected
| Index | Change, points | Closed | Change, % |
|---|---|---|---|
| NIKKEI 225 | -475.64 | 26336.66 | -1.77 |
| Hang Seng | -279.46 | 20844.74 | -1.32 |
| KOSPI | -22.51 | 2317.76 | -0.96 |
| ASX 200 | -1.9 | 6602.8 | -0.03 |
| FTSE 100 | 13.26 | 7209.86 | 0.18 |
| DAX | 73.04 | 12905.48 | 0.57 |
| CAC 40 | 47.9 | 6044.2 | 0.8 |
| Dow Jones | -192.51 | 30981.33 | -0.62 |
| S&P 500 | -35.63 | 3818.8 | -0.92 |
| NASDAQ Composite | -107.87 | 11264.73 | -0.95 |
- US Dollar Index bulls take a breather around the highest levels since late 2002.
- Market sentiment dwindles as US data, WH Memo probed pessimism.
- IMF projections renew recession fears ahead of US CPI for June.
US Dollar Index (DXY) portrays the market’s anxiety ahead of the key US inflation data as it seesaws around the highest levels in two decades, marked the previous day. In doing so, the greenback’s gauge versus the six major currencies pares recent losses while defending the 108.00 threshold, around 108.16 during Wednesday’s Asian session.
The White House (WH) statement joined downbeat US data to trigger the DXY’s pullback from a multi-year high the previous day. “The US economic data, including the June jobs report, are not consistent with a recession in the first or second quarters,” the White House said in a memo released on Tuesday, as reported by Reuters. The news contributed to the market’s profit booking moves ahead of the key data/events.
Further, the US NFIB Business Optimism Index for June slumped to the lowest since early 2013 while flashing 89.5 figures versus 93.1 prior.
It should, however, be noted that the latest economic projections from the International Monetary Fund (IMF) appear to have renewed the market fears and underpinned the US dollar’s safe-haven demand. IMF cuts US 2022 GDP growth projection to 2.3% from 2.9% in late June, due to revised US data. “The Fund included the new forecasts in the full report of its annual assessment of the U.S. economy, which highlighted the challenges of high inflation and the steep Federal Reserve interest rate hikes needed to control prices,” said Reuters.
On the same line were covid fears from China as virus variant spreads in Shanghai and announced lockdown in Wugang city of Henan Province.
Above all, the market’s anxiety ahead of the key US CPI for June, expected to rise to 8.8% YoY from 8.6%, is likely acting as the key barrier to the DXY moves. Ahead of the inflation data, Federal Reserve Bank of Richmond President Thomas Barkin said, “A path to cool inflation but a recession is possible.”
Amid these plays, Wall Street benchmarks closed in the red, despite the intermediate recovery, while the US 10-year Treasury yields printed the second day of the downside at around 2.97%. Further, the S&P 500 Futures begin Wednesday with mild gains.
Moving on, US inflation numbers will be crucial for the DXY traders but updates from China and chatters surrounding Russia could also entertain traders. Should US CPI mark a positive surprise, DXY may witness further upside.
Also read: US June CPI Preview: Dollar rally could lose steam on soft inflation data
Technical analysis
Overbought RSI tests US Dollar Index bulls targeting September 2002 high near 109.80. However, pullback remains elusive until the quote declines below the previous resistance line from May 13, close to 106.50 at the latest.
- USD/JPY is on the move to the downside following a bullish correction.
- USD/JPY bears have moved in from a 38.2% Fibonacci level.
In a prior analysis, that outlines the prospects from both a bullish and bearish perspective, the bears have run with it and USD/JPY is now trading into key support around 136.50 and the following illustrates prospects for the next direction in flow.
USD/JPY prior analysis
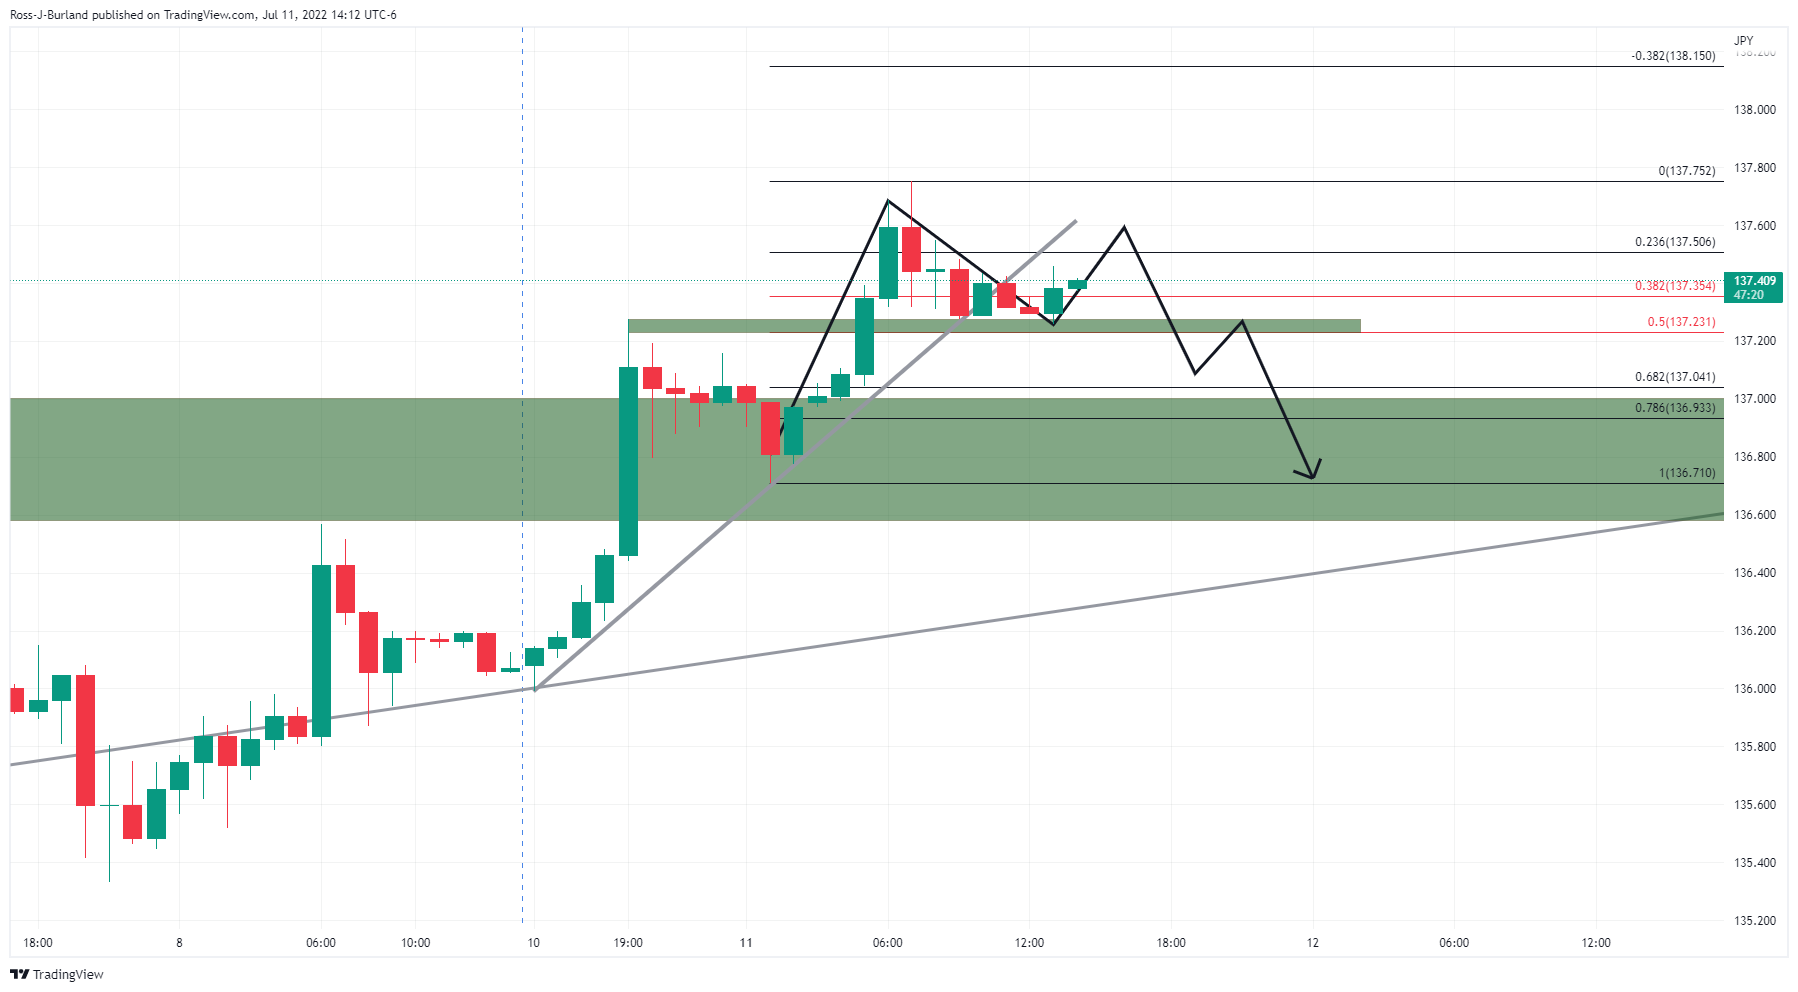
While the above was only an illustration of the probable type of price trajectory from an hourly perspective, it does resemble the following chart and live market as follows:
USD/JPY live chart
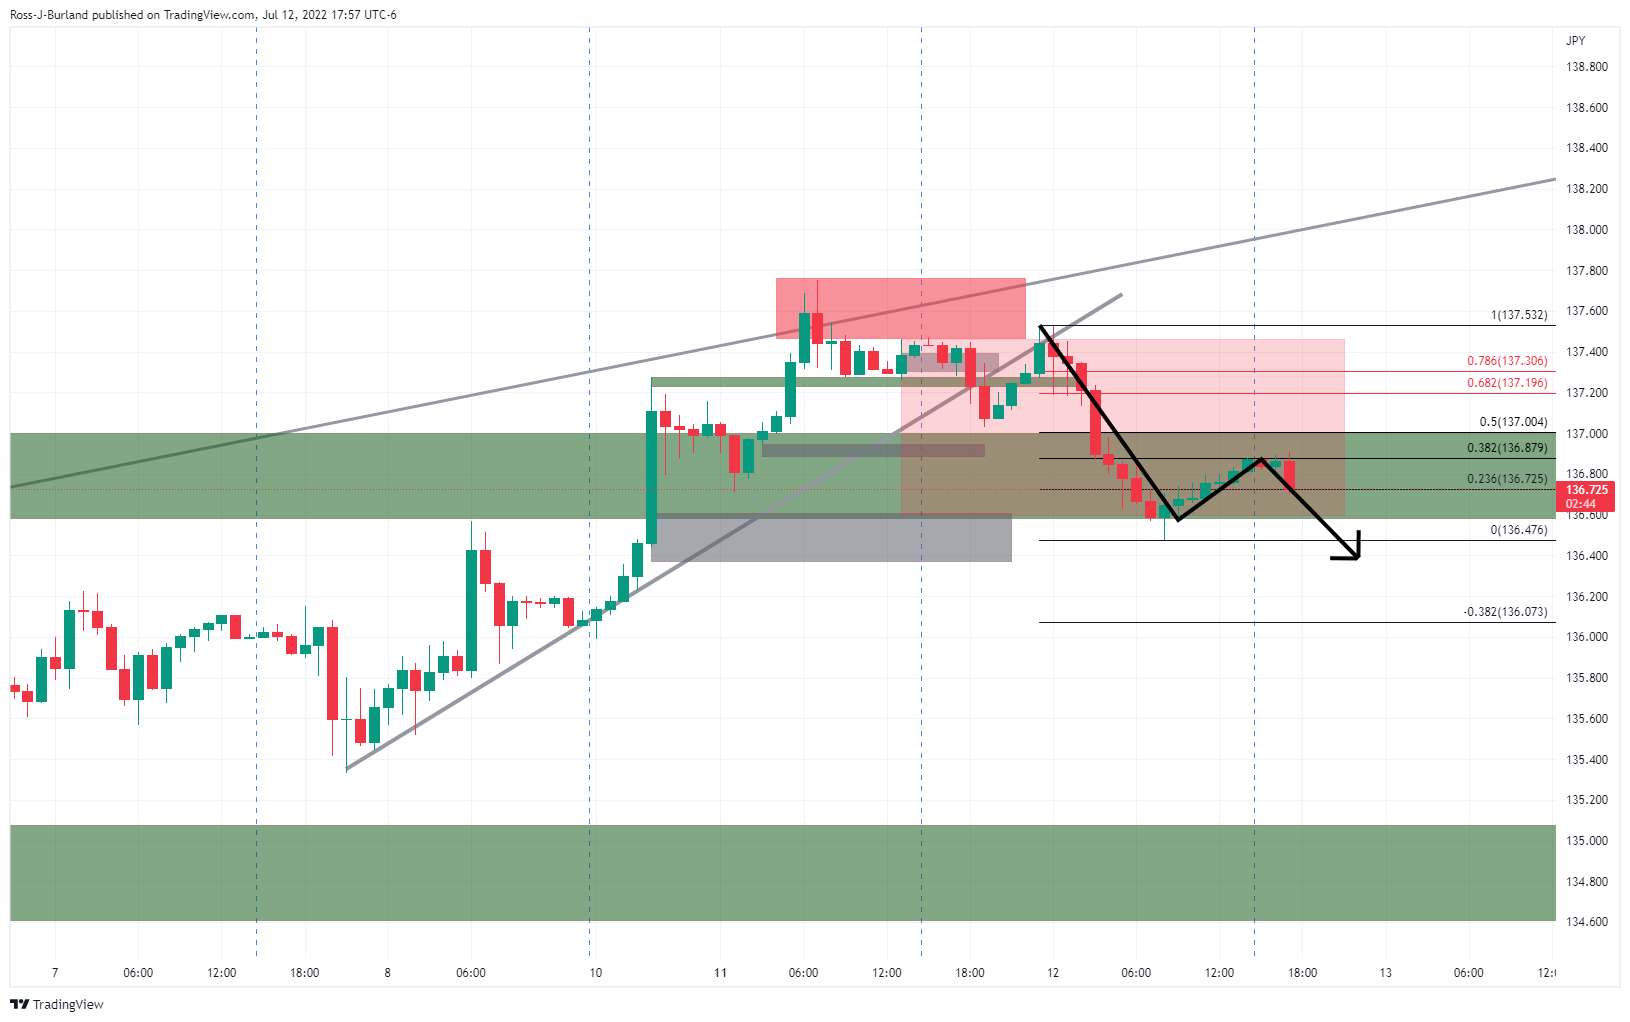
The bears are moving in following the correction of the sell-off with more space to the downside to be mitigated as per the grey area. A downside continuation could be on the cards:
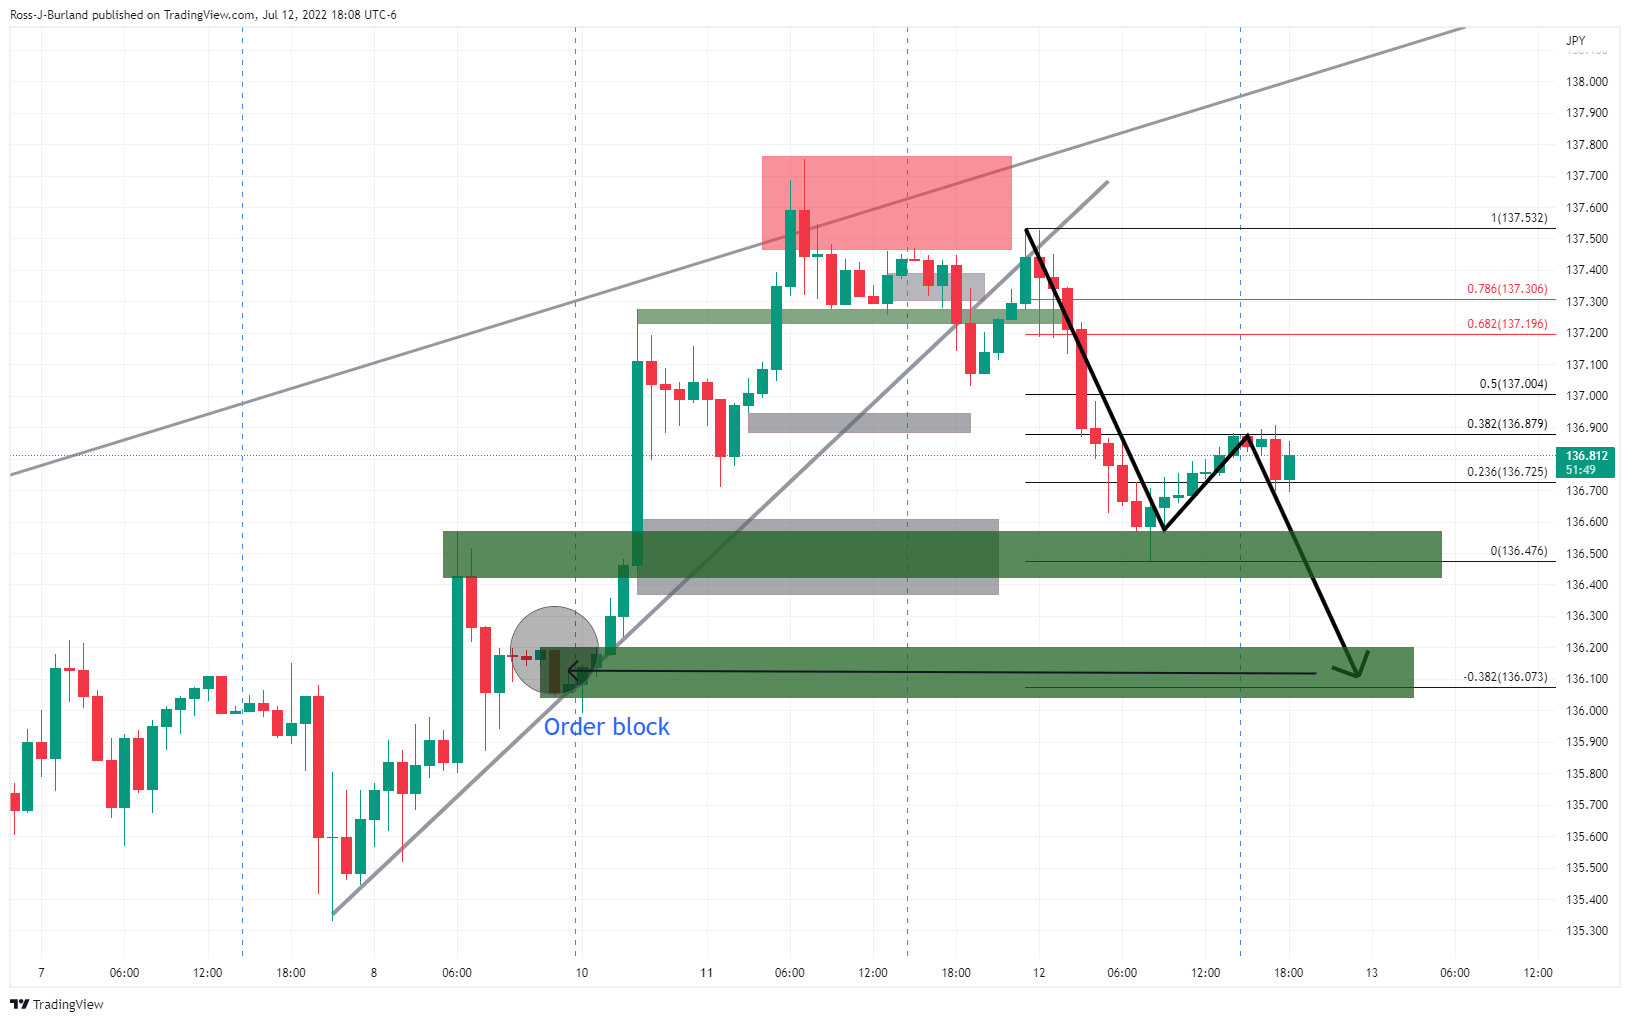
There is an order block from where the price took off which could be a place of interest should the market continue to melt.
| Pare | Closed | Change, % |
|---|---|---|
| AUDUSD | 0.67551 | 0.3 |
| EURJPY | 137.295 | -0.45 |
| EURUSD | 1.00341 | -0.05 |
| GBPJPY | 162.602 | -0.45 |
| GBPUSD | 1.18853 | -0.05 |
| NZDUSD | 0.61244 | 0.23 |
| USDCAD | 1.30197 | 0.11 |
| USDCHF | 0.98151 | -0.18 |
| USDJPY | 136.824 | -0.4 |
- Hurdles around 61.8% Fibo retracement generally call for a bearish reversal but need more filters.
- The RSI (14) is displaying overbought signals therefore an extended correction cannot be ruled out.
- Advancing 20- and 50-EMAs are still favoring the greenback bulls.
The USD/CHF pair has displayed a less confident rebound after a corrective move from Tuesday’s high at 0.9858. On a broader note, the asset has remained in the grip of bulls after hitting a low of 0.9495 on June 29.
The asset has failed to sustain above the 61.8% Fibonacci retracement (which is placed from June high at 1.0050 to June 29 low at 0.9495) at 0.9839. However, a mild correction after hitting a high of 0.9859 on Tuesday doesn’t resemble a bearish reversal.
The 20- and 50-period Exponential Moving Averages (EMAs) at 0.9744 and 0.9733 respectively are advancing firmly, which adds to the upside filters.
Also, the Relative Strength Index (RSI) (14) has not surrendered the bullish range of 60.00-80.00 yet, which indicates that an upside is still intact. However, further correction due to the overbought situation cannot be ruled out.
A decisive violation of Tuesday’s high at 0.9859 will drive the asset towards the round-level resistance at 0.9900, followed by June 16 opening price at 0.9950.
On the flip side, the Swiss franc bulls could gain strength if the asset drops below 38.2% Fibo retracement at 0.9708. An occurrence of the same will drag the asset towards July 1 high at 0.9642. A slippage below July 1 higher will expose the asset to more downside towards July 4 low at 0.9562.
USD/CHF four-hour chart
-637932675202332775.png)


© 2000-2026. All rights reserved.
This site is managed by Teletrade D.J. LLC 2351 LLC 2022 (Euro House, Richmond Hill Road, Kingstown, VC0100, St. Vincent and the Grenadines).
The information on this website is for informational purposes only and does not constitute any investment advice.
The company does not serve or provide services to customers who are residents of the US, Canada, Iran, The Democratic People's Republic of Korea, Yemen and FATF blacklisted countries.
Making transactions on financial markets with marginal financial instruments opens up wide possibilities and allows investors who are willing to take risks to earn high profits, carrying a potentially high risk of losses at the same time. Therefore you should responsibly approach the issue of choosing the appropriate investment strategy, taking the available resources into account, before starting trading.
Use of the information: full or partial use of materials from this website must always be referenced to TeleTrade as the source of information. Use of the materials on the Internet must be accompanied by a hyperlink to teletrade.org. Automatic import of materials and information from this website is prohibited.
Please contact our PR department if you have any questions or need assistance at pr@teletrade.global.
transfers