- Analytics
- News and Tools
- Market News
CFD Markets News and Forecasts — 12-07-2022
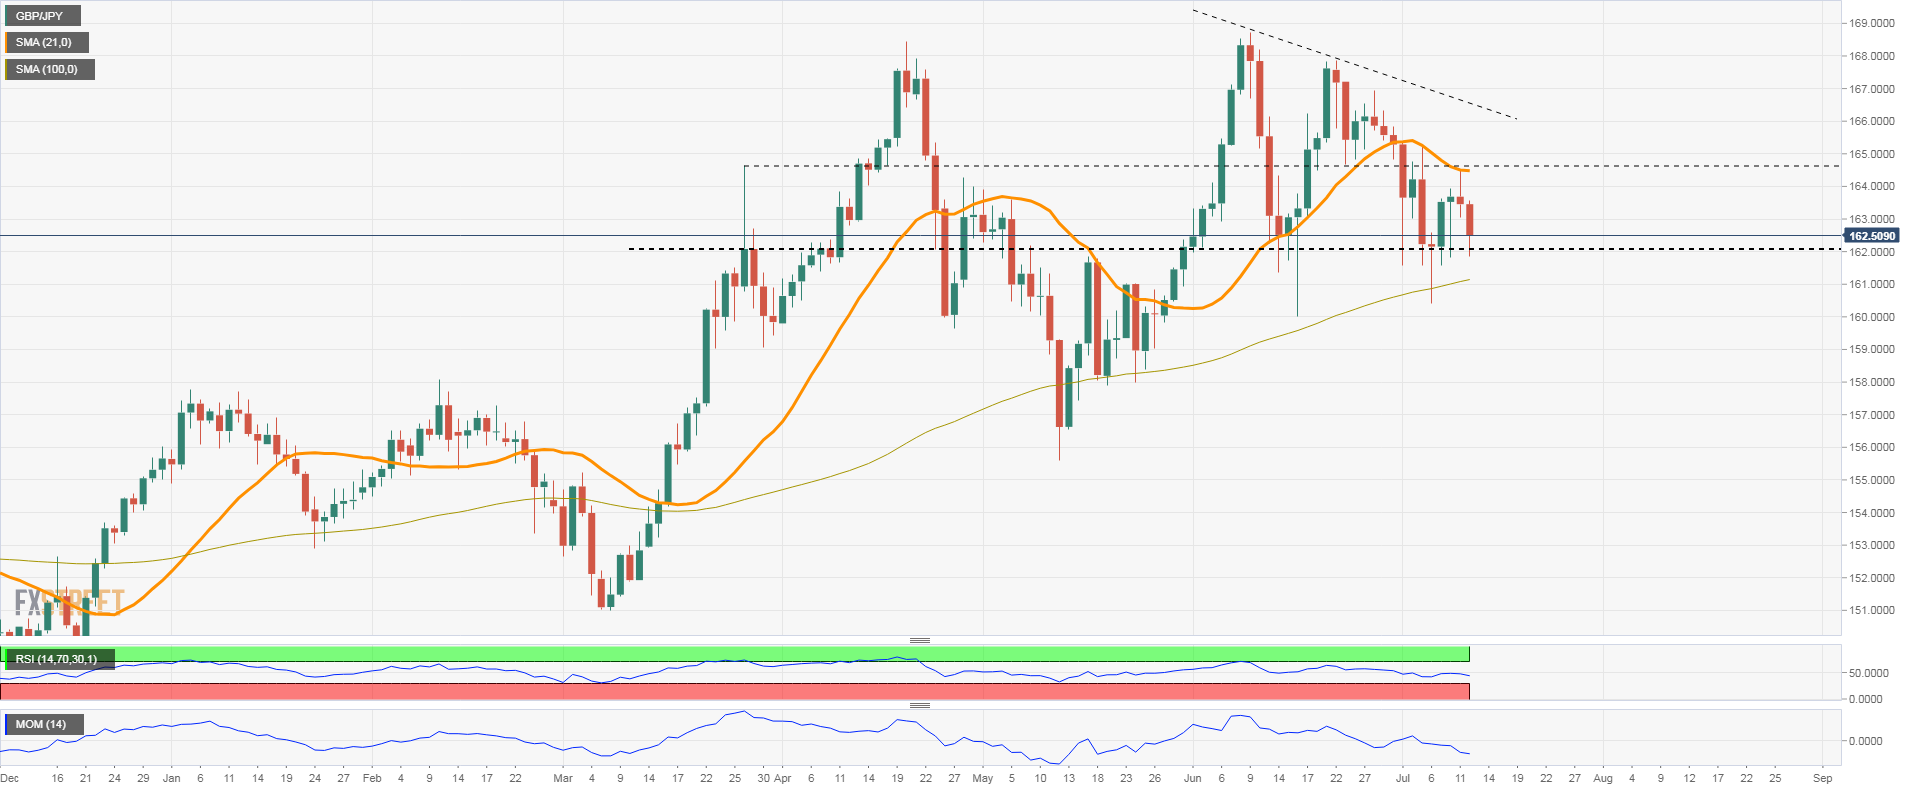
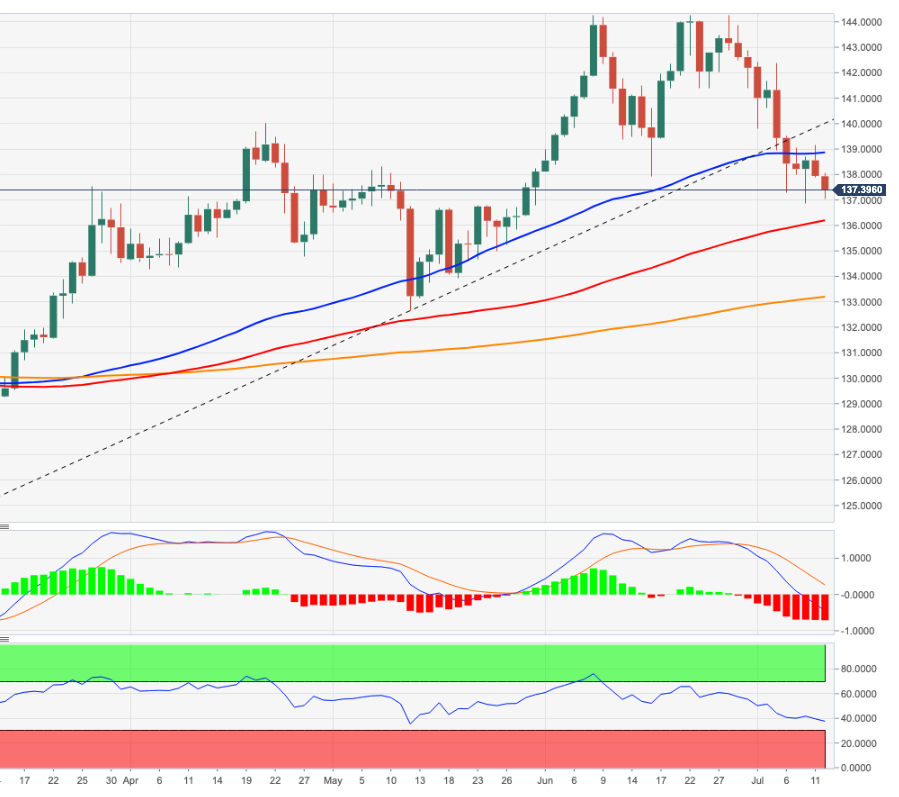
- GBP/JPY prints three-day downtrend, stays pressured of late.
- Clear downside break of 50-DMA, bearish MACD signals favor sellers.
- 21-DMA holds the key to buyer’s return, monthly triangle restricts short-term moves.
GBP/JPY justifies the previous day’s downside break of the 50-DMA inside a monthly symmetrical triangle during Wednesday’s Asian session. That said, the cross-currency pair drops to 162.53 while printing the three-day downtrend by the press time.
Given the quote’s recent break of the key DMA, as well as the bearish MACD signals, GBP/JPY prices are likely to decline further.
In that case, the 100-DMA level surrounding 161.20 could lure the sellers before the stated triangle’s lower line, around 160.50 by the press time, could test further downside.
Also acting as a downside filter is the previous monthly low around the 160.00 threshold.
Alternatively, recovery remains elusive until the quote stays below the immediate triangle’s upper line, close to 163.25 at the latest. It’s worth noting that the 50-DMA level near 162.85 guards the quote’s immediate upside.
Should the GBP/JPY prices rally beyond 163.25 hurdle, the 21-DMA level of 164.47 can act as the last defense of the bears.
Overall, GBP/JPY is likely to witness further weakness in prices inside the nearby triangle.
GBP/JPY: Daily chart
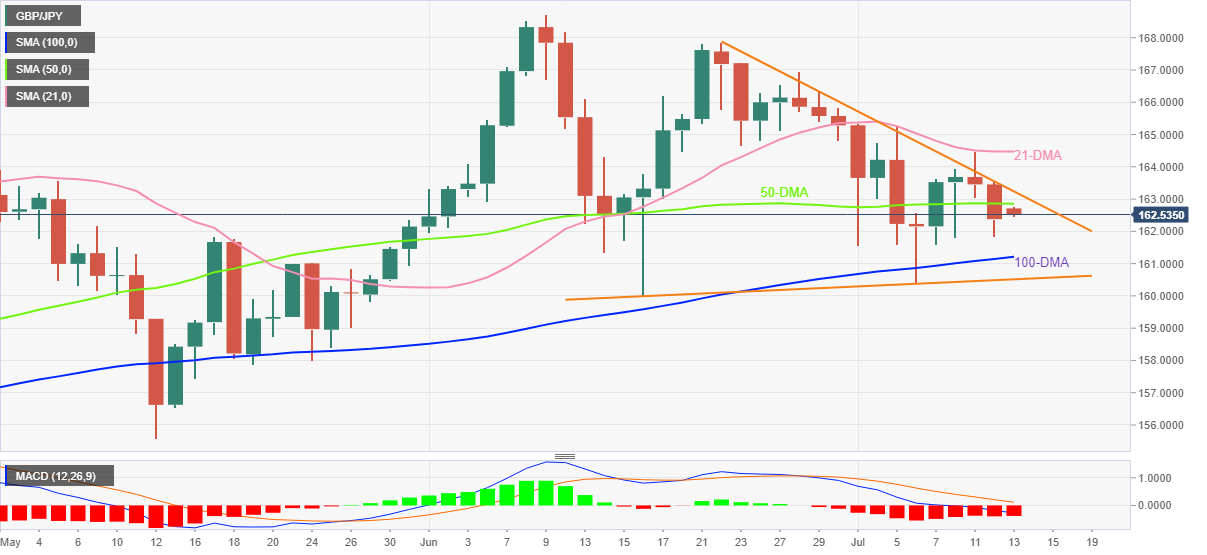
Trend: Further weakness expected
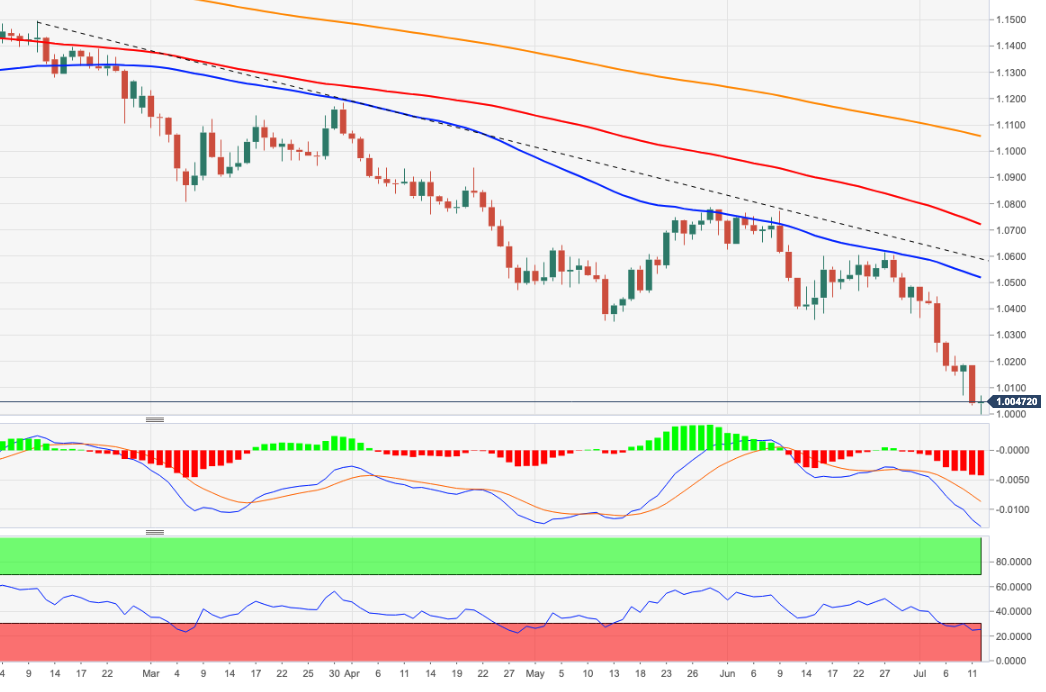
- EUR/USD remains pressured around 20-year low, fade corrective pullback.
- Fears of economic slowdown, central banks’ aggression weigh on sentiment.
- US CPI for June will be crucial considering recently mixed data/events and Fed’s hawkish mood.
EUR/USD fails to extend the previous day’s rebound from the lowest levels in two decades, retreating to 1.0030 during Wednesday’s Asian session. In doing so, the major currency pair struggles for clear directions as the bears appear running out of steam while the bulls fear taking entries ahead of the key US Consumer Price Index (CPI) for June, not to forget Germany’s key inflation number for June, namely Harmonized Index of Consumer Prices (HICP). In addition to the pre-data caution, the market’s fears of recession and aggressive central bank actions also weigh on the EUR/USD prices.
US Dollar Index (DXY) refreshed its 20-year high the previous day before retreating from 108.55. The pullback joined cautious optimism spread by comments from the White House (WH) and softer US data to favor the corrective pullback before the latest weakness.
Also read: EUR/USD Forecast: Tepid bounce hints at a bearish breakout

Businessman calculating tax with coins on desk
Slowdown fears renew
Market’s slowdown fears remain on the table despite the White House (WH) Memo that appeared to have triggered cautious optimism the previous day. “The US economic data, including the June jobs report, are not consistent with a recession in the first or second quarters,” the White House said in a memo released on Tuesday, as reported by Reuters. The news contributed to the market’s profit booking moves ahead of the key data/events.
Downbeat data favor bears via risk-off mood
Softer economics from the US and Europe add strength to the recession fears. That said, a slump in the US NFIB Business Optimism Index for June, to the lowest since early 2013, appears to weigh on the EUR/USD prices amid fears of recession. Additionally, ZEW Survey data for July showed that German Economic Sentiment slumped to -53.8 while missing estimates of -38.3. Its counterpart for Eurozone also dropped to -51.1 versus the -28.0 previous reading and -32.8 expected. Further, Germany’s ZEW Survey Current Situation sub-index arrived at -45.8 in July compared to -34.5 expectations.
China’s covid woes
Covid fears from China exert additional downside pressure on the EUR/USD prices. The reason could be linked to the virus variant’s faster spread in Shanghai and the announced lockdown in Wugang city of Henan Province. With the latest economic unlock not being too far, fresh activity restrictions could recall the market fears of economic slowdown and favor the pair bears.
IMF Forecasts
The latest economic projections from the International Monetary Fund (IMF) appear to have renewed fears of a slowdown and renewed the risk-aversion wave. IMF cuts US 2022 GDP growth projection to 2.3% from 2.9% in late June, due to revised US data. “The Fund included the new forecasts in the full report of its annual assessment of the U.S. economy, which highlighted the challenges of high inflation and the steep Federal Reserve interest rate hikes needed to control prices,” said Reuters.
Pre-inflation anxiety
Be it US CPI or German HICP both the inflation gauges are important for the EUR/USD traders as the European Central Bank (ECB) and the US Federal Reserve (Fed) are both up for faster rate hikes to battle the inflation. That said, the US CPI is expected to rise to 8.8% YoY from 8.6% whereas the final prints of the German HICP may match the initial forecasts of 8.2% YoY.
EUR/USD technical analysis
EUR/USD remains inside a four-month-old bearish megaphone formation, nearing the bearish trend widening the formation’s support line of late.
That said, the oversold RSI conditions could test the EUR/USD pair’s further weakness around the stated formation’s support line, close to 0.9920 at the latest.
Failing to do so could drag the major currency pair towards the December 2020 low near 0.9860.
Meanwhile, recovery moves need validation from two-month-old previous support near 1.0350. Even so, the stated formation’s resistance line and the 100-DMA, respectively near 1.0530 and 1.0710, could challenge the EUR/USD bulls afterward.
To sum up, EUR/USD has limited downside room but the corrective pullback is likely to reverse the bearish trend.
EUR/USD: Daily chart
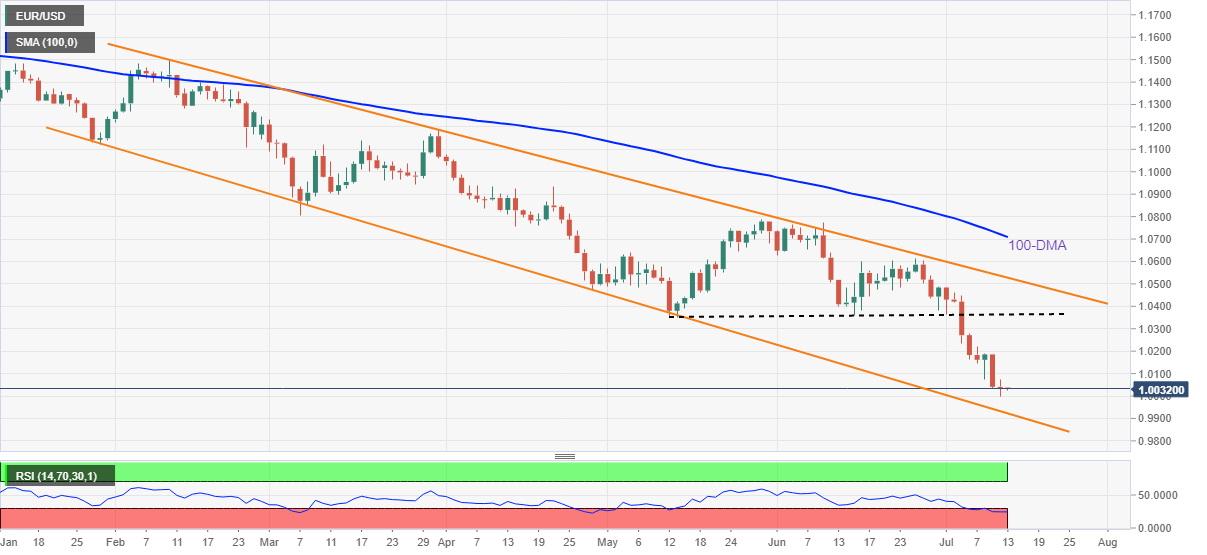
Trend: Corrective pullback expected
EUR/USD rejected by 1.0000 psychological level, bearish bias intact
- USD/CAD is juggling above 1.3020 on higher expectations for BOC interest rate and US Inflation.
- Escalating recession fears in the global economy have pushed oil prices comfortably below $100.00.
- A higher inflation rate in Canada is bolstering the odds of a 75 bps rate hike by the BOC.
The USD/CAD pair has turned sideways around 1.3020 as investors are focusing on the interest rate decision by the Bank of Canada (BOC) and the release of the US Consumer Price Index (CPI). The asset has faced barricades around 1.3050 twice in the past two trading sessions, which could also be termed as exhaustion signals after a firmer rally from July 5 low near 1.2850.
Considering the market consensus, investors should brace for a bumper rate hike announcement by the BOC. The central bank is expected to elevate its interest rates by 75 basis points (bps). Apart from the Federal Reserve (Fed), no Western central bank has announced a three-quarter-to-a-percent rate hike yet.
The rate of increasing inflation in the loonie zone is extremely high. In May, Canada's inflation soared to 7.7% from the prior release of 6.8%. An increment by 90 basis points in the inflation rate is not a cakewalk situation for the economy. This has elevated the expectations for a rate hike of 75 bps by the BOC.
On the oil front, escalating recession fears have established the oil prices below $100.00 comfortably. Western central banks are accelerating their interest rates vigorously, which will squeeze out liquidity from the market, and the corporate will be left with costly money to invest. Also, the lockdown worries in China due to the resurgence of Covid-19 have hammered the oil bulls.
Meanwhile, the US dollar index (DXY) is expected to remain subdued ahead of inflation figures. The DXY is expected to regain strength on pre-anxiety of the US Consumer Price Index (CPI). The inflation rate is expected to climb to 8.8% from the prior release of 8.6%. This will strengthen the odds of a consecutive 75 bps rate hike announcement by the Fed.
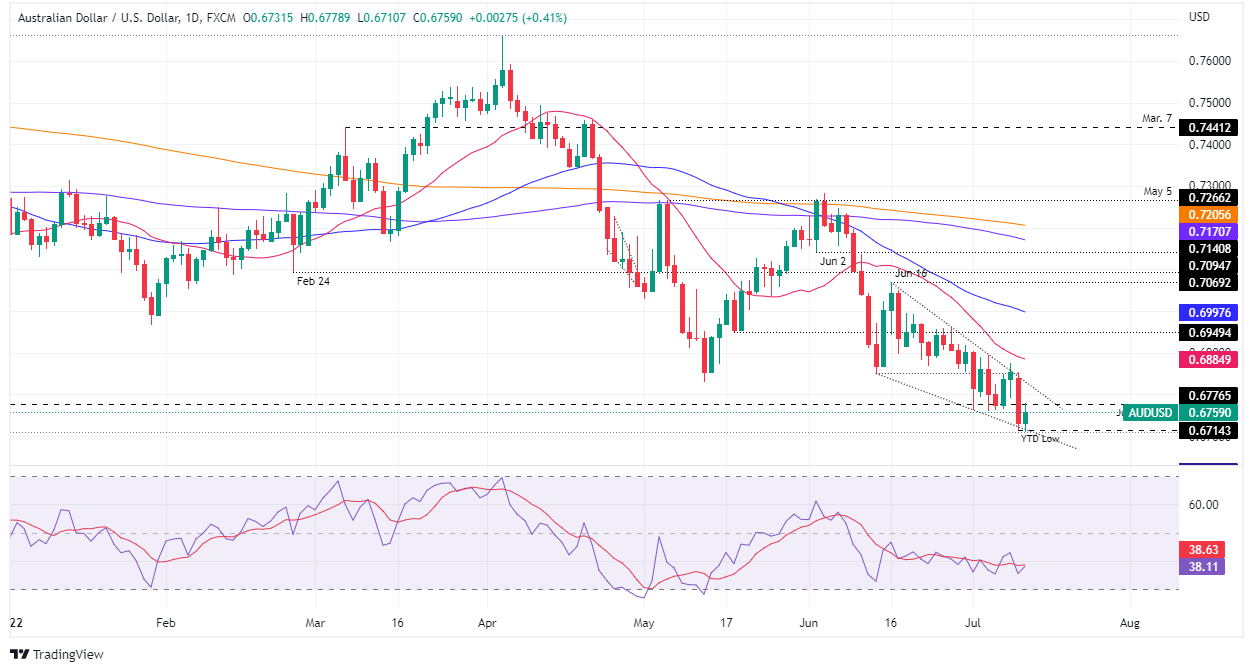
- AUD/USD fades bounce off 26-month low as traders brace for the key data.
- IMF projections, China’s covid woes add strength to the risk-off mood.
- Fears of economic slowdown, central bank aggression stay in the driver’s seat.
- Second-tier data from Australia and China can entertain traders, US CPI for June will be crucial.
AUD/USD portrays the market’s anxiety ahead of the key data/events as it retreats to 0.6750 during Wednesday’s initial Asian session. In doing so, the risk-barometer pair justifies the cautious mood ahead of the US Consumer Price Index (CPI) for June while reversing the previous day’s corrective pullback from a two-year low.
The Aussie pair cheered the upbeat White House (WH) statement to bounce off the multi-day low amid cautious optimism. On the same line were downbeat US second-tier data and the market’s preparations for today’s US inflation figures.
“The US economic data, including the June jobs report, are not consistent with a recession in the first or second quarters,” the White House said in a memo released on Tuesday, as reported by Reuters. The news contributed to the market’s profit booking moves ahead of the key data/events.
Talking about the data, a slump in the US NFIB Business Optimism Index for June, to the lowest since early 2013, should have also helped the AUD/USD buyers. It should be noted that National Australia Bank’s (NAB) Business Conditions and Business Confidence figures for June earlier weighed on the pair. That said, the Business Conditions rose to 13, versus 9 expected and prior 16, whereas the Business Confidence dropped to 1 from 8 expected and 6 previous.
Alternatively, the latest economic projections from the International Monetary Fund (IMF) appear to have renewed fears of a slowdown and renewed the risk-aversion wave. IMF cuts US 2022 GDP growth projection to 2.3% from 2.9% in late June, due to revised US data. “The Fund included the new forecasts in the full report of its annual assessment of the U.S. economy, which highlighted the challenges of high inflation and the steep Federal Reserve interest rate hikes needed to control prices,” said Reuters.
On the same line were covid fears from China as virus variant spreads in Shanghai and announced lockdown in Wugang city of Henan Province.
With this backdrop, Wall Street benchmarks closed in the red, despite the intermediate recovery, while the US 10-year Treasury yields printed the second day of the downside at around 2.97%. Further, the S&P 500 Futures begin Wednesday’s moves under pressure.
Looking forward, Australia’s Westpac Consumer Confidence for June, prior -4.5%, will precede HIA New Home Sales for June, prior -5.5%, to entertain AUD/USD traders. However, major attention will be given to the US CPI, expected to rise to 8.8% YoY from 8.6%. It's worth noting that China trade numbers for June may also offer intermediate entertainment to the pair traders.
Also read: US June CPI Preview: Dollar rally could lose steam on soft inflation data
Technical analysis
AUD/USD pair’s corrective pullback from the monthly support line, around 0.6700 by the press time, needs validation from a downward sloping trend line resistance from June 16, close to 0.6875 at the latest.
- AUD/JPY juggles around 92.50 after a mild correction from near 92.60 ahead of aussie labor market data.
- Aussie Unemployment Rate may slip to 3.8% from the prior release of 3.9%.
- BOJ’s ultra-loose monetary policy will keep the yen bulls on the tenterhooks.
The AUD/JPY pair is displaying back-and-forth moves in a narrow range of 92.35-92.52 in the Asian session after a mild correction from a tad above 92.60. The risk barometer has shown a vulnerable performance this week after failing to sustain above the critical hurdle of 93.50. The asset is expected to display volatile moves as investors are shifting their focus on the aussie employment data, which is due on Thursday.
As per the market consensus, the Australian Bureau of Statistics will report the Employment Change data at 25k, extremely lower than the prior release of 60.6k. The economy has not been able to generate decent employment opportunities, which is necessary to support the upcoming policy tightening measures by the Reserve Bank of Australia (RBA).
It is worth noting that the RBA maintained its status-quo in the first week of July and elevated its Official Cash Rate (OCR) by 50 basis points (bps) to 1.35%. For further elevation in the interest rates, support from the labor market and upbeat growth prospects is highly required. Also, the Unemployment Rate may slip to 3.8% from the prior print of 3.7%.
On the Tokyo front, the continuation of the ultra-loose monetary policy by the Bank of Japan (BOJ) will keep the yen bulls on the tenterhooks. The BOJ is committed to doing more monetary easing as the economy is still finding ways to elevate its inflation on a broader basis. On Thursday, Japan’s Ministry of Economy, Trade, and Industry will release the Industrial production data, which is seen as stable at -2.8% and -7.2% on an annual and a monthly basis respectively.
- The shared currency tripped down vs. the Japanese yen on fears of Japanese authorities’ intervention in the FX markets.
- Risk aversion weighed heavily on the EUR as appetite for safety increased.
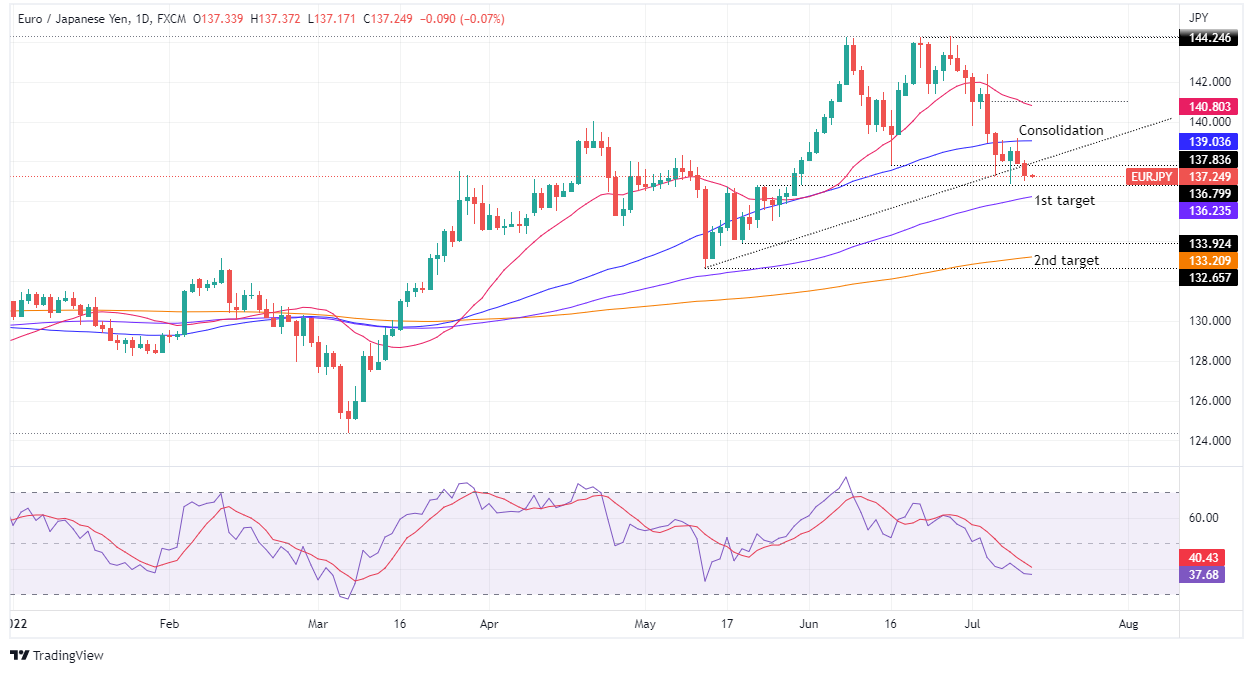
- EUR/JPY Price Analysis: The trendline break opened the door for further downside, as sellers eye the S2 daily pivot point around 136.50.
The EUR/JPY slipped for the second consecutive day on Tuesday, almost 0.48%, sparked by a fragile market mood, as Wall Street recorded losses for the second successive day on recession worries, while Asian equities are set to open mixed, as shown by the futures market.
The EUR/JPY, Tuesday price action, opened near the highs of the day around 138.00 and tumbled on news that the Japanese Finance Minister reunited with US Secretary of Treasure Janet Yellen to discuss the yen’s rapid fall. Hence, EUR/JPY traders sent the pair to the daily low at around 137.00. At the time of writing, the EUR/JPY is trading at 137.24.
EUR/JPY Daily chart
The EUR/JPY remains upward biased, but a break below a two-month-old upslope support trendline on Tuesday near 137.83, and the Relative Strength Index (RSI), sitting in bearish territory, opened the door for further downside. Therefore, the EUR/JPY path of least resistance in the near term is downwards.
That said, the EUR/JPY’s first support will be the July 8 daily low of around 136.85. The break below will expose the 100-day EMA at 136.23, followed by the May 22 cycle low at 133.92.
EUR/JPY 1-hour chart
In the short term, the EUR/JPY is also tilted to the downside, confined to a descending channel, but it is approaching a solid support level at the July 12 daily low of around 137.02, just above Wednesday’s S1 daily pivot at around 136.88. Nevertheless, it EUR/JPY sellers, break below, that would clear the way towards the confluence of the bottom-trendline of the descending channel and the S2 pivot point at around 136.40-50 area, followed by a drop towards 136.00.
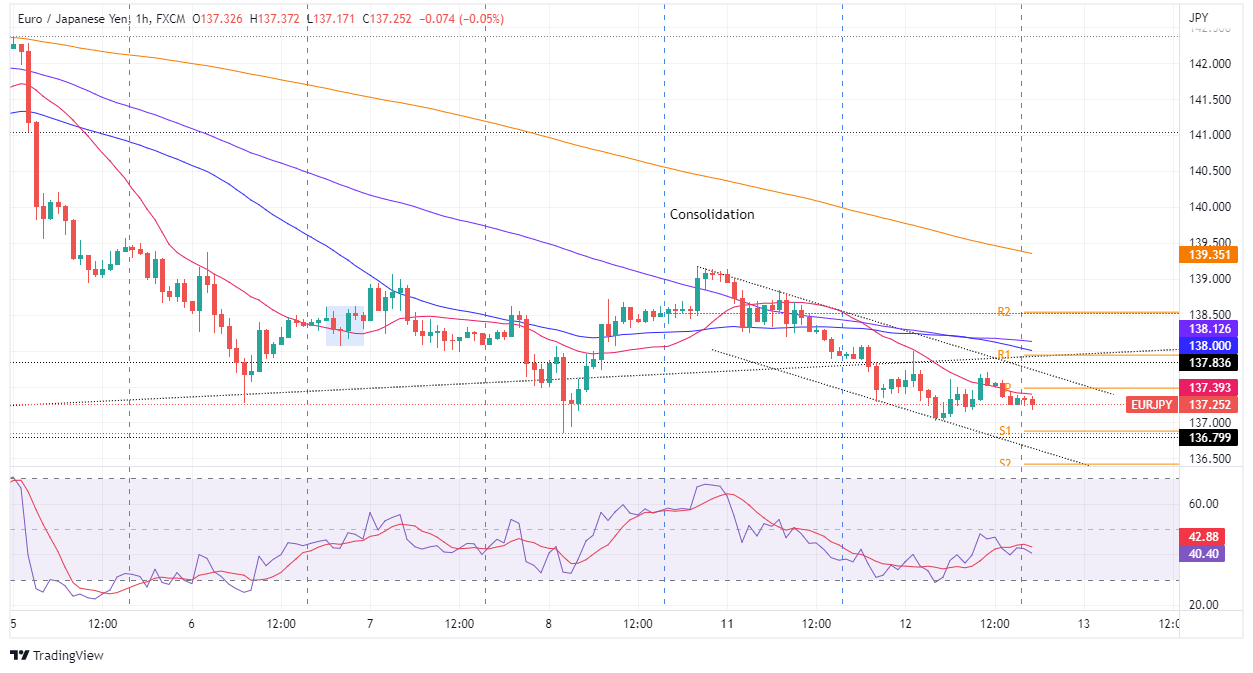
EUR/JPY Key Technical Levels
- NZD/USD fades corrective pullback from two-year low as risk dwindles.
- Inflation, recession fears exert downside pressure but pre-US CPI mood, WH Memo helped consolidate losses.
- RBNZ is likely to announce 50 bps rate hike but eyes will be on the Rate Statement.
- US CPI for June will be important considering the WH optimism.
NZD/USD fails to extend Tuesday’s profit booking from a two-week low, easing back to 0.6125 during Wednesday’s initial Asian session. While the White House (WH) memo could be linked to the quote’s previous rebound, cautious sentiment ahead of the Reserve Bank of New Zealand (RBNZ) Monetary Policy Meeting and the US Consumer Price Index (CPI) appears to weigh on the Kiwi pair of late.
The US economic data, including the June jobs report, are not consistent with a recession in the first or second quarters, the White House said in a memo released on Tuesday, as reported by Reuters. The news contributed to the market’s profit booking moves ahead of the key data/events.
However, the latest economic projections from the International Monetary Fund (IMF) appear to have renewed fears of a slowdown and renewed the risk-aversion wave. IMF cuts US 2022 GDP growth projection to 2.3% from 2.9% in late June, due to revised US data. “The Fund included the new forecasts in the full report of its annual assessment of the U.S. economy, which highlighted the challenges of high inflation and the steep Federal Reserve interest rate hikes needed to control prices,” said Reuters.
On the same line were covid fears from China as virus variant spreads in Shanghai and announced lockdown in Wugang city of Henan Province.
It’s worth noting that a slump in the US NFIB Business Optimism Index for June, to the lowest since early 2013, also adds strength to the economic slowdown fears and exerts downside pressure on the NZD/USD prices.
Amid these plays, Wall Street benchmarks closed in the red, despite the intermediate recovery, while the US 10-year Treasury yields printed the second day of the downside at around 2.97%.
Moving on, NZD/USD traders will have a busy day as the RBNZ and the US CPI for June are on the cards. While the RBNZ is up for a 0.50% rate hike, the Rate Statement will be critical for the Kiwi pair traders to watch as New Zealand’s central bank failed to please bulls despite announcing a rate lift in the last few times.
Also read: Reserve Bank of New Zealand Preview: Hitting the repeat button despite hard-landing fears
Elsewhere, the US CPI is expected to rise to 8.8% YoY from 8.6% and can entertain the pair bears should the details also favor the Fed’s aggression.
Also read: US June CPI Preview: Dollar rally could lose steam on soft inflation data
Technical analysis
The 10-DMA level surrounding 0.6170 precedes a three-week-old resistance line, close to 0.6180 at the latest, to restrict short-term NZD/USD upside.
Alternatively, downward sloping support lines from June 22 and January 27 coincide at 0.6025 to make it the key support.
That said, oscillators are less favorable to the NZD/USD bears.
- GBP/USD has sensed offers around 1.1900 as investors await US Inflation.
- The number of suitable candidates for the leader of the US Conservative Party is increasing.
- Plain-vanilla CPI is seen at 8.8% while the core CPI is expected to slip to 5.7%.
The GBP/USD pair has witnessed selling pressure after attempting to sustain above the crucial level of 1.1900. On a broader note, the asset went through a steep fall after surrendering the weekly support at 1.1876 and printed fresh weekly support at 1.1807. The cable has attempted a pullback, however, the downside remains favored ahead of the US Inflation.
Investors are expecting that the US Consumer Price Index (CPI) will elevate to 8.8% from the prior release of 8.6%. However, the core CPI will slip to 5.7% from the prior print of 6%. A divergence in the two critical catalysts indicates two outcomes. Volatile food products and energy prices are driving the plain-vanilla CPI figure higher. And, products in core CPI such as durable goods, automobiles, and other necessary goods are experiencing a cool-off in their heated price rise.
This indicates that the policy tightening measures, which have been deployed by the Federal Reserve (Fed) in their past three monetary policy meetings, have started reflecting their impact now.
On the UK front, ongoing political turmoil after the announcement of resignation by current PM Boris Johnson has spooked the sentiment of the market participants. The list of participants for being the leader of the Conservative Party is getting wide each passing day. Apart from that, investors will focus on the UK economic data. The Gross Domestic Product (GDP) is seen at 0% vs. -0.3% printed earlier. While the annual Manufacturing Production may slip to 0.3% from the former release of 0.5%.
The International Monetary Fund has cut the US 2022 growth projection to 2.3% from 2.9% in late June, due to revised US data.
Key notes
IMF cuts US 2022 GDP growth projection to 2.3% from 2.9% in late June, due to revised US data.
IMF cuts US 2023 GDP growth projection to 1.0% from 1.7% in late June.
IMF says expects Fed policy actions to slow u.s. consumer spending growth to zero by early 2023, increase unemployment rate to about 5% by end 2023.
IMF directors say passing rest of biden administration reform agenda is crucial to fostering supply side of economy, contributing to lower inflation.
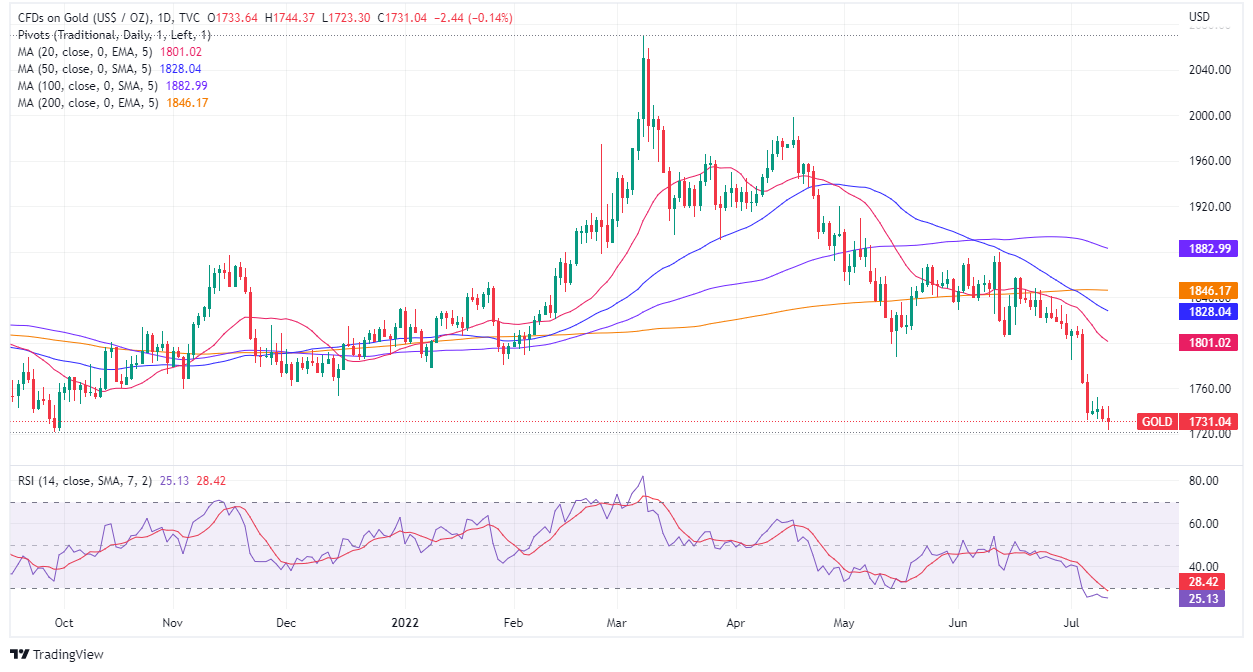
- Gold is under pressure as the greemback contiunues to pick up the bids.
- The US CPI event is stacking up to be critical for markets this week.
Gold is back under pressure and establishing fresh lows for the week within the bearish cycle as markets flip risk-off in the latter part of the New York session with the Dow printing fresh lows and down 1% at the time of writing. In turn, the US dollar is climbing the board in a correction as per the DXY index. At $1,725.00, gold is down 0.5% while DXY is moving back towards a flat position for the day at 108.15.
The US dollar's strength comes ahead of this week's key US inflation data, both of which are headwinds for the US stock market during the earnings season. Should the US dollar continue on its bullish trajectory, this will be a headwind for the company's results and in turn, the recession fears would be expected to continue supporting the greenback and pressuring gold.
The event to watch will be Wednesday's Consumer Price Index report which is expected to show the largest jump since 1981, to 8.8% YoY. The expectations have led to a massive liquidation in the gold market. ''While the steepest outflows from broad commodity funds since the Covid-19 crisis sparked a cascade of selling, including from CTA funds, another strong inflation print could still fuel additional downside,'' analysts at TD Securities said.
''Indeed, the coming data could be particularly concerning for gold prices given the still extremely bloated length remaining in gold markets from proprietary traders. We have previously cautioned that the substantial size accumulated by this cohort during the pandemic appears complacent in the face of a steadfastly hawkish Fed. In a liquidation vacuum, these positions are now vulnerable, which suggests the yellow metal remains prone to further downside still.''
Gold technical analysis
The consolidation is being drawn out but could well be turning into a breakout of redistribution indicating lower prices to come for the foreseeable future. In prior analysis, a potential spring in a phase of possible accumulation was identified on the 4-hour chart which has now been invalidated with lower closes:
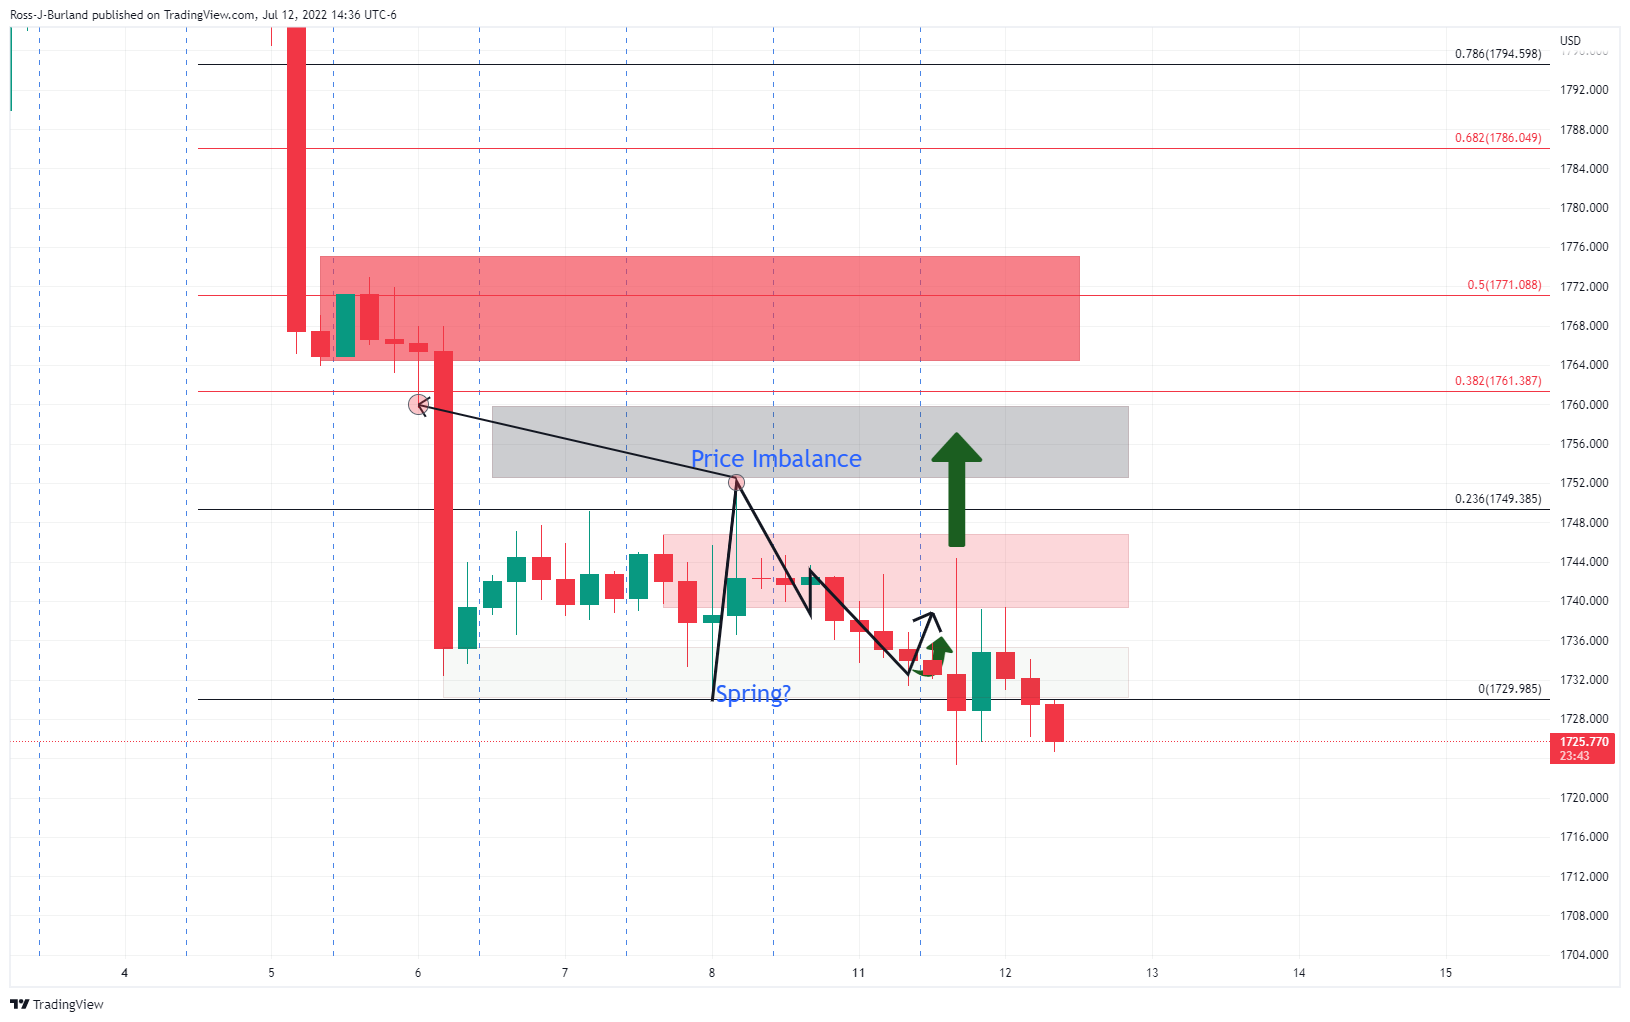
As illustrated, the price has deteriorated into fresh lows which pits the emphasis on the downside, although does not completely invalidate the prospects of continued sideways action.
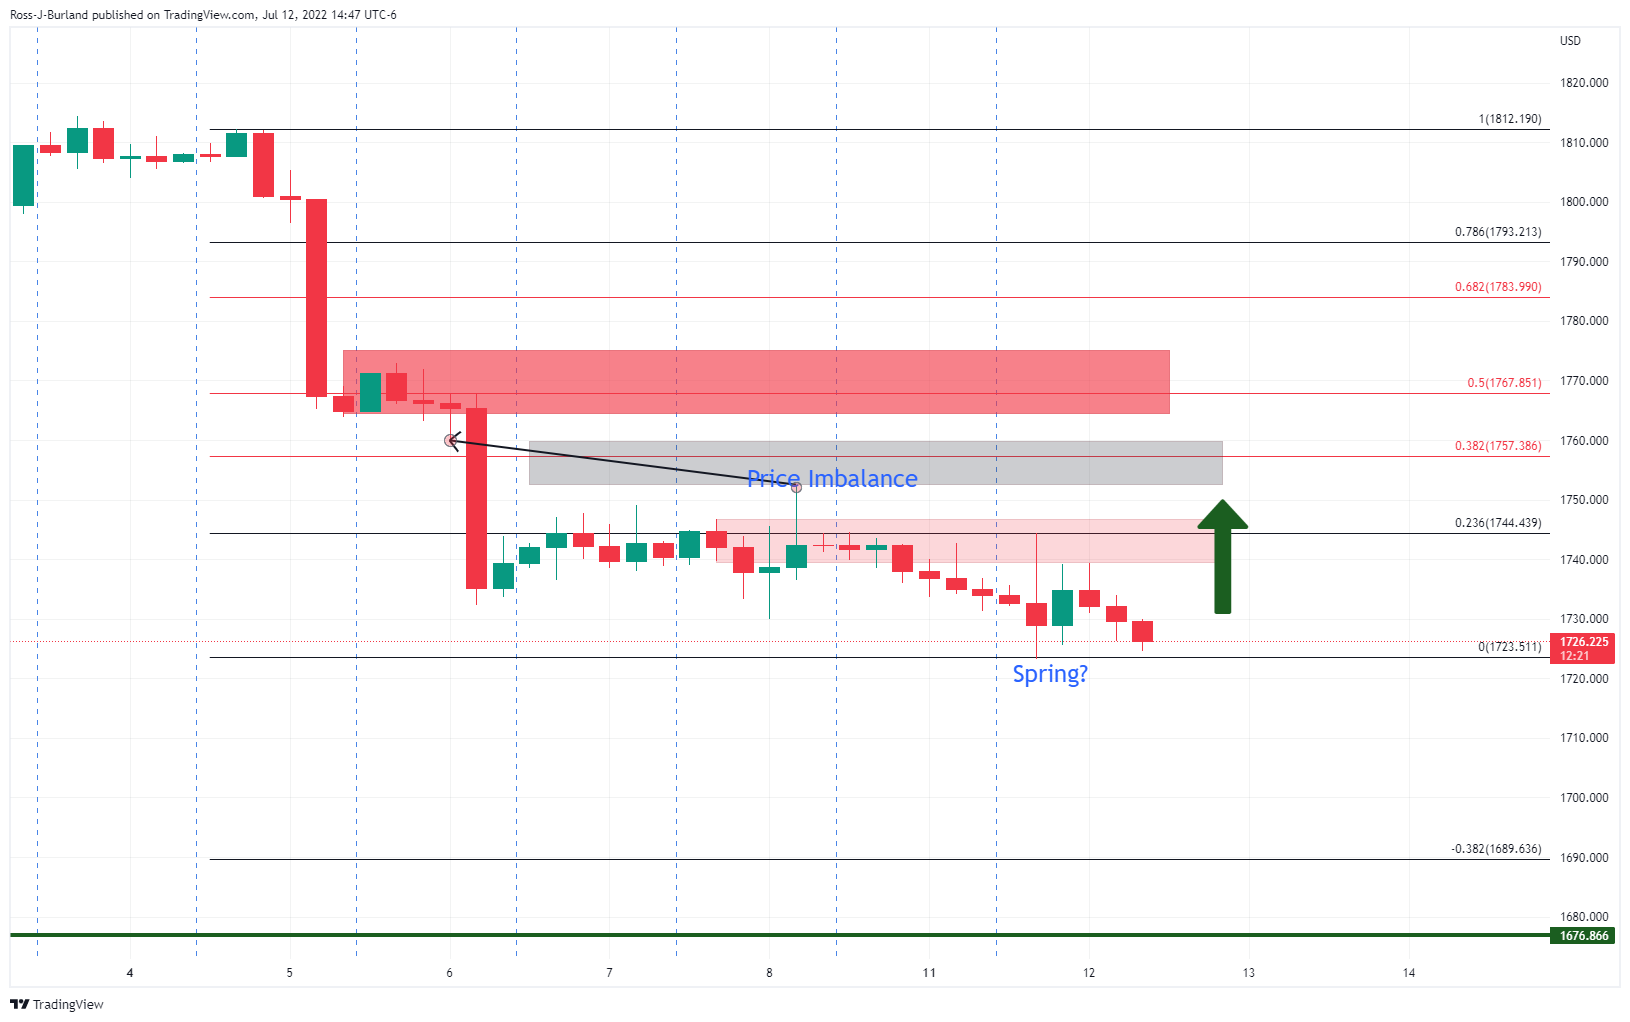
There is still the possibility of a move higher if the bulls commit but the likelyhood is gearing up to be a move lower in an extension of supply following the bullish correction:
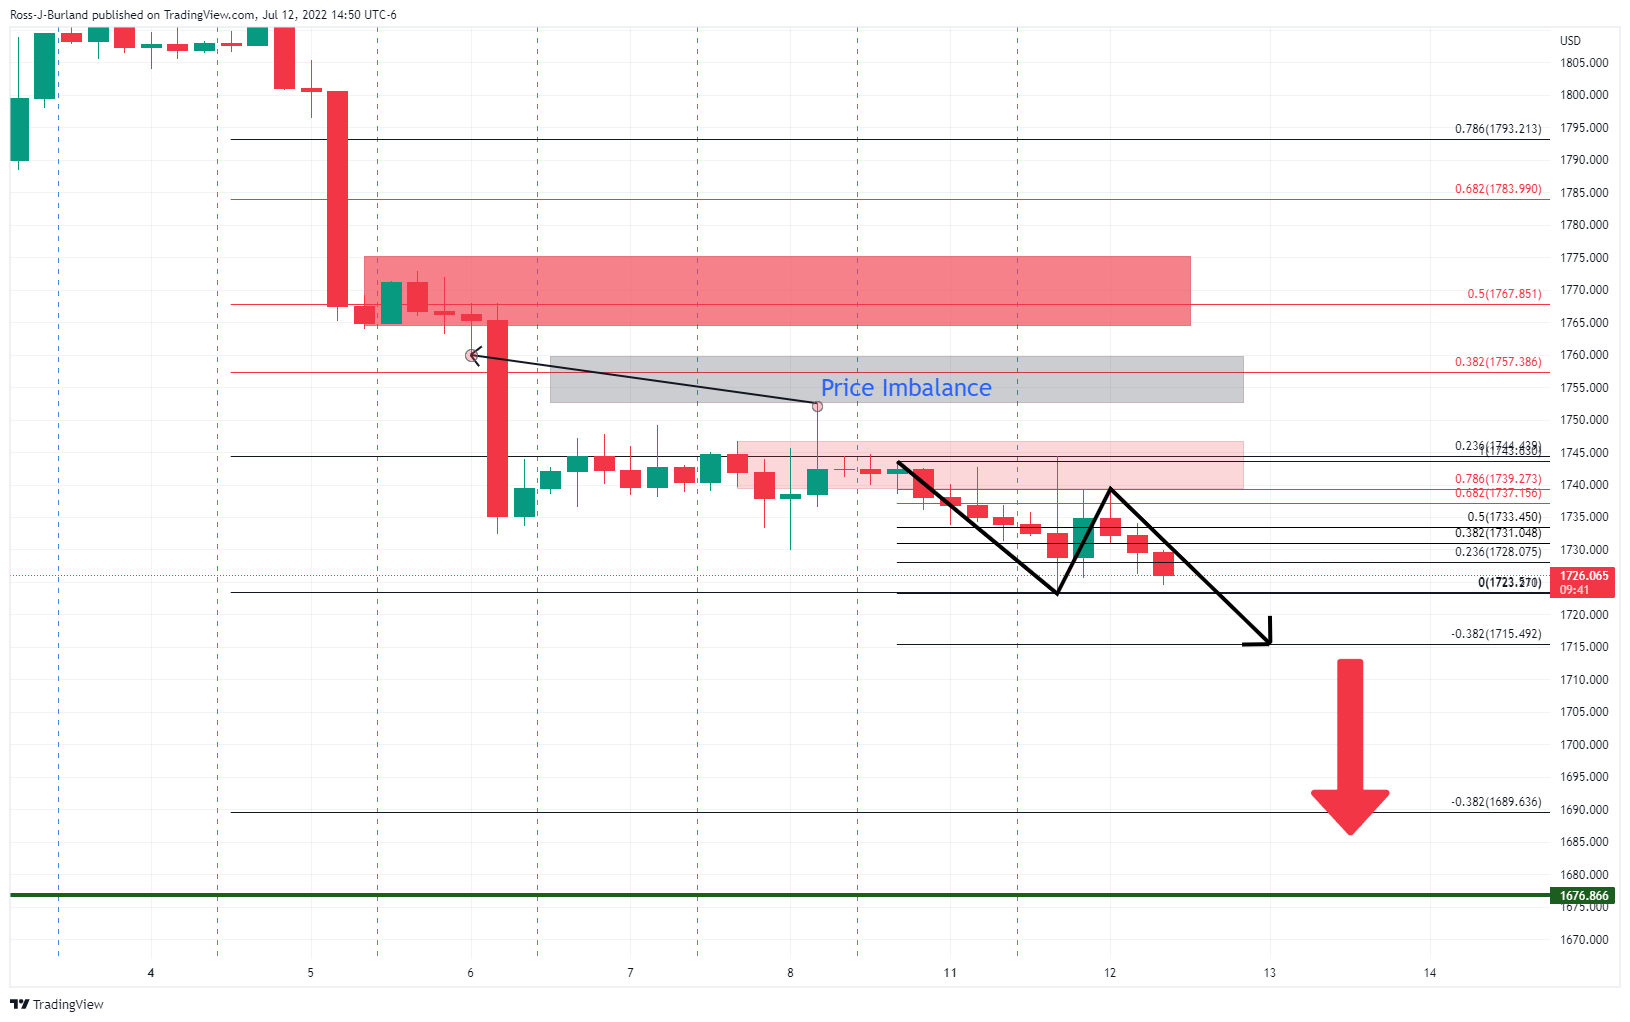
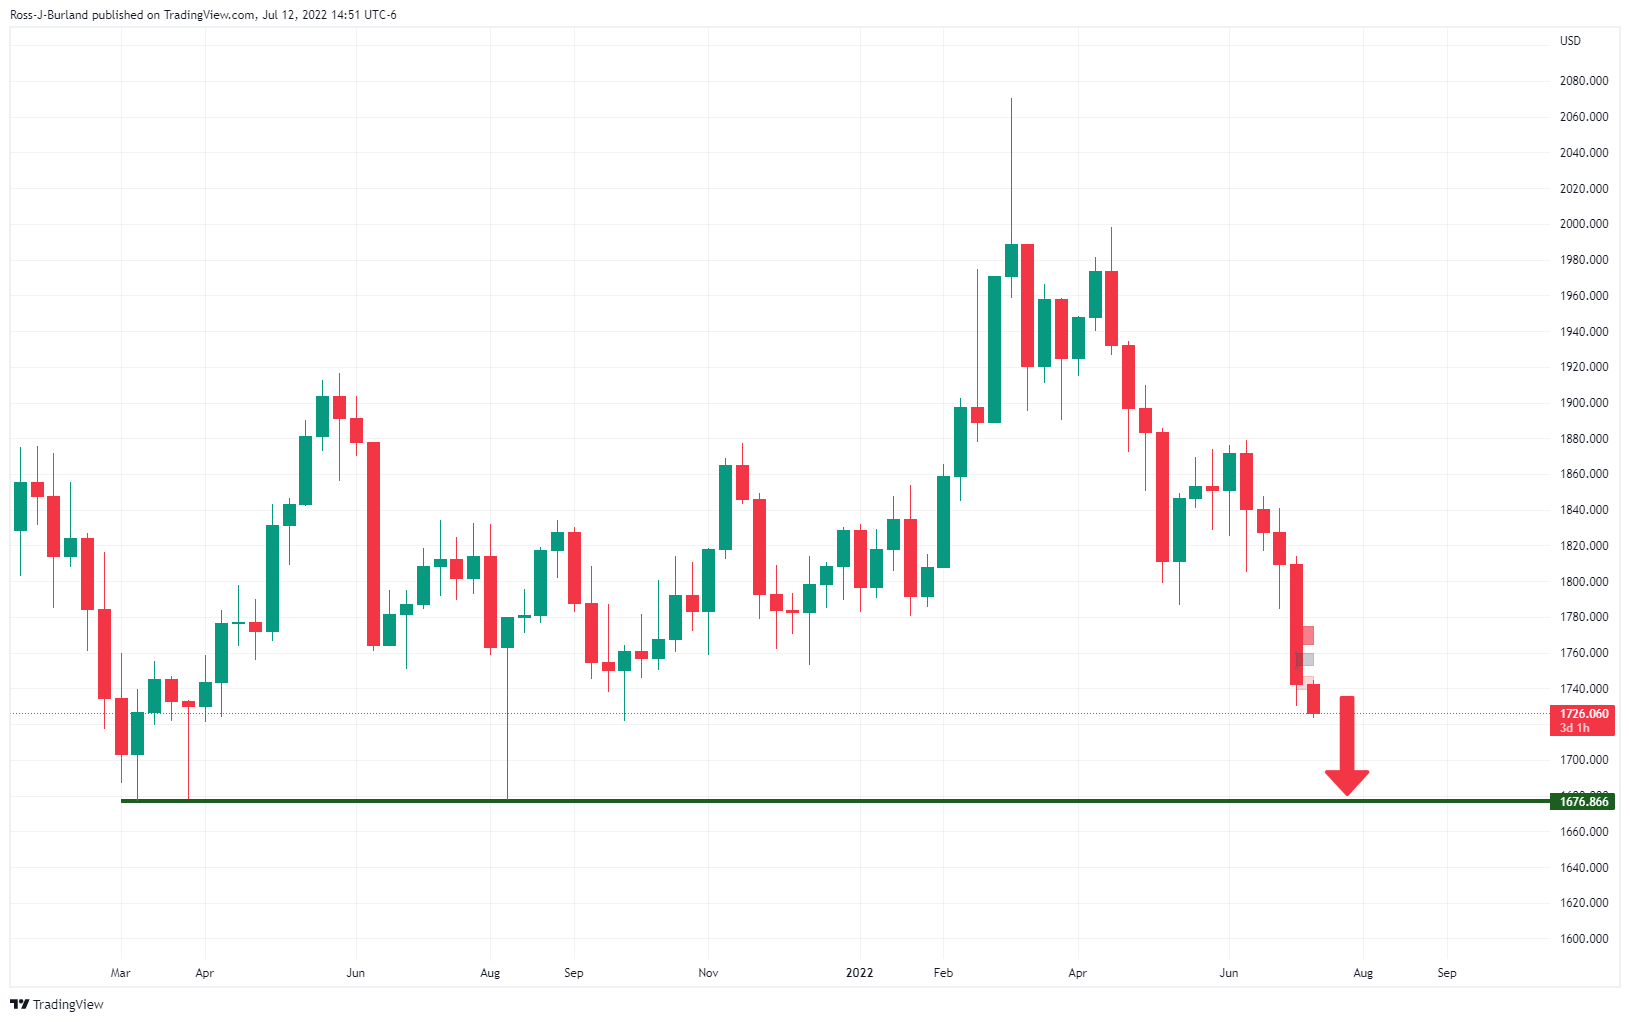
This will put the focus on the weekly lows from a longer term perspective:
- The AUD/USD is bearish biased, but US dollar weakness pushed the major price upwards.
- Investor’s flight toward safe-haven did little to boost the greenback on Tuesday, as it fell.
- AUD/USD Price Analysis: The daily chart illustrates a falling wedge emerging, which targets a rally towards 0.7000.
The AUD/USD rose from YTD lows around 0.6714 on Tuesday, amidst a fragile market mood that shifted sour as the Wall Street close approached, a reflection of US recession worries as traders feared the Federal Reserve tightening cycle might tip the US economy into a recession.
The AUD/USD is trading at 0.6759 at the time of writing after hitting a daily high around 0.6779, bolstered by a weaker US dollar, and despite China’s covid-19 resurgence, particularly in Shanghai, as authorities ordered massive testings across the city.
AUD/USD Daily chart
The AUD/USD stays heavy, albeit recovering some ground during the day. But sellers remain in control due to some factors: the daily moving averages (DMAs) reside above the exchange rate, oscillators are in bearish territory, and AUD buyers’ failure to reclaim the 0.7000 figure opened the door for further selling pressure. Therefore, the AUD/USD path of least resistance is downwards.
The AUD/USD first demand area would be the YTD low, around 0.6714. Break below will expose the figure at 0.6700, followed by a dip toward May 22, 2020, swing low at 0.6505.
Nevertheless, there is a ray of hope for AUD buyers. The AUD/USD formed a falling wedge in a downtrend, meaning a break above the top trendline might open the door for further gains. Hence, the AUD/USD first resistance would be the ti trendline around 0.6830. A breach of the latter will expose the 20-day EMA around 0.6884, followed by the 100-day EMA shy of the 0.7000 area, near 0.6997.
AUD/USD Key Technical Levels
What you need to take care of on Wednesday, July 13:
Risk aversion amid slowing economic growth and soaring inflation remained the main theme across financial markets. The American currency appreciated throughout the first half of the day, reaching fresh 20-year highs against the EUR, as the pair touched 0.9999.
The greenback lost steam ahead of Wall Street’s opening, giving up some of its latest gains to end the day marginally lower against most major rivals. The better market mood came from a White House memo, which noted that US macroeconomic data, including the June jobs report, are not consistent with a recession. The document added that “labor market strength puts the US in a better position than many other countries to transition to lower inflation and steady growth.”
US indexes bounced with the news but turned red ahead of the close, and as investors await US inflation figures scheduled for Wednesday.
GBP/USD bottomed at 1.1806, later settling just below the 1.1900 threshold. The UK Conservative 1922 Committee announced eight candidates for the Tory leadership contest. Meanwhile, Bank of England Governor Andrew Bailey said there are alternatives to 25 bps rate hikes in the table, adding he expects inflation to fall sharply next year.
Commodity-linked currencies managed to recover ground but trimmed part of their gains ahead of the close, following Wall Street’s slump. The AUD/USD pair trades around 0.6750, while USD/CAD hovers in the 1.3020 price zone.
Safe-haven currencies appreciated against the greenback, with USD/CHF trading at 0.9810 and USD/JPY at 136.80.
Gold is near a fresh 2022 low of $1,723.15 a troy ounce and seems poised to extend its slump. Crude oil prices edged firmly lower, with WTI now trading at $95.50 a barrel.
The focus is now on inflation as Germany, and the US will release updates on their respective Consumer Price Indexes. German annual inflation is expected to be confirmed at 7.6% in June, while US one is foreseen to jump to 8.8%, a new multi-decade record.
Top 3 Price Prediction Bitcoin, Ethereum, Ripple: Being Wrong Is Healthy, Staying Wrong Is Deadly!
Like this article? Help us with some feedback by answering this survey:
- EUR/USD trims some of its Monday losses and clings above parity but just above July’s 10 low.
- Recession fears persist as the US 2s-10s yield curve stays inverted for the second consecutive day.
- Fed’s Barkin is undecided about going 50 or 75 bps in July’s Fed monetary policy meeting.
- EU and German ZEW missed expectations, spurring a EUR/USD fall close to parity.
The EUR/USD bounces off fresh 20-year lows around the parity area, trimming some of Monday’s losses, as market sentiment wobbles, reflected by US equities fluctuating between gainers and losers, ahead of the US June Consumer Price Index (CPI) to be released on Wednesday.
At 1.0052, the EUR/USD grinds higher after tripping towards 1.0000, during the European session on worst than expected German data, followed by a jump towards the daily highs around 1.0073, 10 pips shy of the 50-hour EMA around 1.0082, which put a lid on upward EUR/USD prices.
EUR/USD rises despite investors’ fragile mood
The market mood is mixed, as portrayed by US equities fluctuating as recession fears persist. The US 2s-10s yield curve stays inverted for the second time in the week, reaching -0.107%, a level last seen in 2007. Meanwhile, the US Dollar Index, a gauge of the greenback’s value, takes a breather, down 0.20% at 107.986, a tailwind for the EUR/USD, which dropped close to the parity on weaker than expected EU news.
In the meantime, Fed speakers did little to nothing during the New York session to boost the greenback. Richmond’s Fed President Thomas Barkin said that he was reserving judgment on a 50 or 75 bps rate hike in the July meeting and reiterated that he would like real rates positive across the curve. Furthermore added that a negative Q2 GDP would take it “seriously” while adding that he expects another elevated inflation report.
The White House (WH) expects US CPI to remain elevated but downplayed recession worries in a memo reported by Reuters. The White House added that the “Impact of energy and food prices on annual headline CPI in June will likely exceed 40%, based on market expectations.”
Also read:
- Fed’s Barkin: A path to cool inflation but a recession ‘is possible
- White House: Impact of energy and food prices on annual CPI in June to likely exceed 40%
During the European session, the EU and German ZEW Surveys of Economic Sentiment missed expectations, sparked by the bloc’s energy crisis, supply chain disruptions, and the ECB’s intentions to hike interest rates. according to ZEW President Achim Wambach, “Experts assess the current economic situation significantly more negatively than in the previous month and have further lowered their already unfavorable forecast for the next six months.”
What to watch
The Eurozone economic docket will feature the Industrial Production for the Eurozone and Germany’s Inflation Rate. Across the pond, the US economic calendar will report June’s inflation rate, expected at 8.8% YoY, while core CPI is estimated at 5.8% YoY. Later, EUR/USD traders will get some clues in the Fed’s Beige Book, which the Fed uses in its monetary policy meetings.
EUR/USD Key Technical Levels
- GBP/USD bears have moved in as the greenback strengthens.
- Bulls could be lurking near a 50% mean reversion.
GBP/USD has started to give back the gains made in the New York open which ran up to break 1.1900 in a strong impulsive move to take on Tokyo's highs but fell just shy of Friday's low.
This leaves 1.1950 vulnerable for the day's ahead if bulls were to commit and emerge again from within any pullback over the coming sessions.
GBP/USD H1 chart
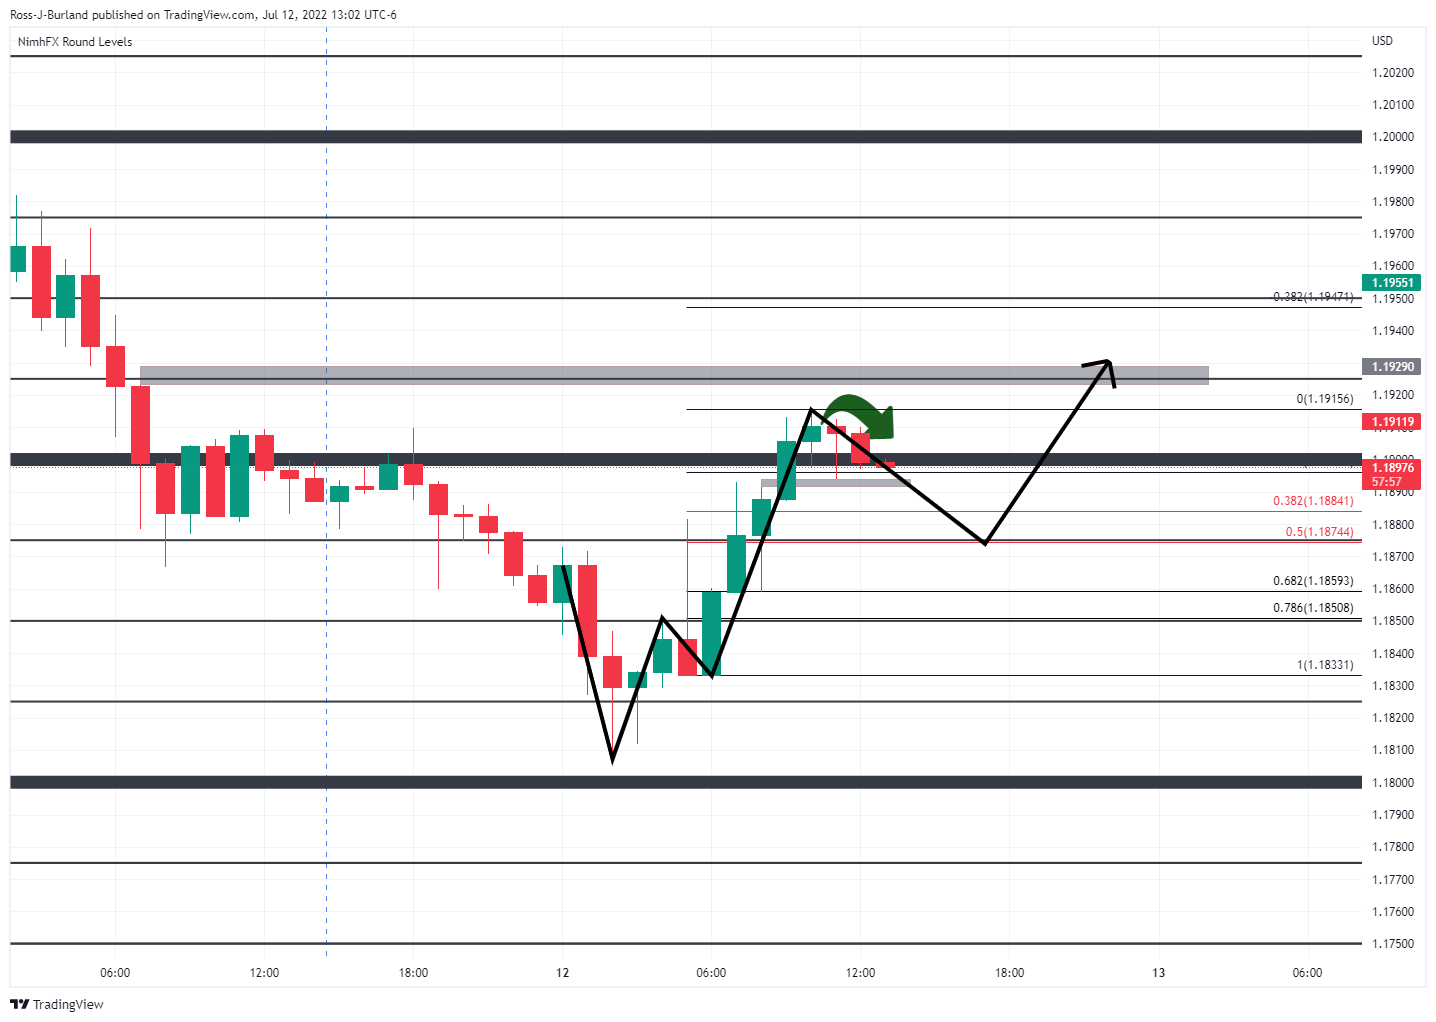
In the hourly chart above, the price is moving in to mitigate the price imbalance below, grey area, and a 50% mean reversion might occur to meet prior high volumes of transactions as per the volume profile of the bullish rally. If this acts as support, then there will be prospects of a bullish continuation for a run on liquidity towards 1.1920/50.
- WTI is falling further in the New York session to fresh lows on Tuesday.
- Investors fret over holding commodity longs into economic uncertainty as China goes back into lockdown.
Oil prices continue to sag in the New York day following a brief bid in mid-day trade. The price of West Texas Intermediate crude is carving out a fresh low for Tuesday of $95.47 so far and it is falling with momentum at the time of writing. The US dollar reached fresh 20-year highs on concerns China could enter another round of Covid-19 lockdowns, even as OPEC issued a bullish forecast for 2023 demand, so the demand side is pressuring oil prices.
However, OPEC on Tuesday said it expects 2023 demand to rise, even as production capacity remains limited. In a Monthly Oil Market Report, the group said it expects demand to rise by 2.7-million barrels per day next year to 103-million bpd, as it expects the global economy to rise by 3.2% "supported by a still solid economic performance in major consuming countries, as well as improved geopolitical developments and containment of COVID-19 in China".
China is set to lock down cities again just weeks after lifting a two-month quarantine on Shanghai that cut the country's oil demand by more than one million barrels per day. Close to 30 million people are already under some form of movement restrictions as the nation seeks to quell resurgent Covid-19 outbreaks. The nation reported 352 new cases for Sunday, with the daily figure hovering over 300 for the past week, the highest level since late May. Mainland China has had more than 300 cases a day for past nine days.
As for positioning in the oil market, Speculators also have turned more bearish. Money managers cut net-long positions in both Brent and WTI to the lowest level since 2020, according to the CFTC data released Friday as investors fret over holding commodity longs into economic uncertainty.
Reuters is reporting that Governor Andrew Bailey spoke on Tuesday and said the Bank of England's Monetary Policy Committee will bring inflation back down to its 2% target from more than 9% now.
"The Committee will be particularly alert to indications of more persistent inflationary pressures, and will if necessary act forcefully in response," Bailey said in a speech hosted by OMFIF, a central banking think tank."Bringing inflation back down to the 2% target sustainably is our job, no ifs or buts about that," he added.
Key comments
Bank of England's bailey: still the case that UK businesses are very focused on difficulty of hiring.
Pick-up in pay still largely being driven by one-off bonuses rather than higher base rate.
Inflation should come down rapidly next year.
If we see evidence of inflation persistence, we will act forcefuly.
Options other than 25 bp rises are on the table.
We will set out our thinking on gilt sales on Aug. 4.
We would not sell gilts into distressed markets.
BoE balance sheet should not remain permanently large.
UK finance ministry's approval of qe is a 'very mechanical' process.
I have never had any dialogue with UK finance ministry on substance of qe decisions.
BoE independence on qe decisions has never been called into question.
We will clearly need an open market tool during qt when we get close to equilibrium.
GBP/USD update
Despite the hawkishness, the pound has started to give back the gains made in the New York open which ran up to break 1.1900 in a strong impulsive move to take on Toyo's highs but falling just shy of Friday's low. This leaves 1.1950 vulnerable for the day's ahead if bulls were to commit and emerge again from within any pullback over the coming sessions.
- Silver slides on safe-haven flows towards US Treasuries as bond yields fall
- The greenback takes a breather after reaching a 24-year high above 108.000, a respite for silver traders.
- The US 2s-10s yield curve screams recession, falling to 2007 levels at around -0.107%.
Silver (XAGUSD) remains on the defensive as Tuesday’s North American session progresses, down by 0.48%, due to increased concerns of the US getting into a recession, as the US 2s-10s yield curve remains inverted at -0.107%, reaching levels last seen in February of 2007.
At the time of writing, XAGUSD is trading at $19.01, after reaching a fresh two-year low around $18.75, bouncing off to the confluence of the 50 and 100-hourly EMAs around the $19.14-19 area, which put a lid on buying pressure.
Silver slides on safe-haven flows towards US Treasuries as bond yields fall
Risk-off dominates the session for a second consecutive day due to some factors. The inversion in the US 2s-10s yield curve deepened, below -0.10%, for the first time since February of 2007, accentuating recession fears that the Fed might tip the US economy into a recession. Also, the reemergence of China’s coronavirus crisis in Shanghai threatens to trigger additional lockdowns.
Silver traders are bracing for the US inflation report. The June Consumer Price Index (CPI) is expected to hit 8.8% YoY, while the core inflation, which excluded volatile items like food and energy, is estimated at 5.7% YoY, lower than May’s reading. In the meantime, the White House (WH) expects CPI to remain elevated, but downplayed recession fears, they said in a memo, as reported by Reuters. They added that the “Impact of energy and food prices on annual headline CPI in June will likely exceed 40%, based on market expectations.” They said the economy “appears” to be transitioning to a slower economic and job growth.
Elsewhere, the US Dollar Index, a gauge of the greenback’s value vs. six counterparts, falls for the first time in four days, down at 107.920, losing 0.27%, while the US 10-year Treasury yield sits at 2.937%, losing six bps.
What to watch
During the week, the US economic docket will feature the US Consumer Price Index and the Beige Book on Wednesday, followed by Thursday’s PPI and Initial Jobless Claims. On Friday, the University of Michigan Consumer Sentiment will portray the American people’s economic expectations.
Silver (XAGUSD) Key Technical Levels
Federal Reserve's Tom Barkin has crossed the wires and said that the pace of policy change may be making markets ‘skittish’.
He adds that there is a path to cool inflation but a recession ‘is possible’.
More to come
On Wednesday, June inflation data is due in the US. The CPI is expected to rise to a new post-COVID high. According to analysts from TD Securities, the annual inflation will show an increase from 8.6% to 8.9% while the core rate a decline to 5.7%.
Key Quotes:
“We look for core prices to have stayed strong on a m/m basis despite our expectation of modest slowing vs May. Indeed, we forecast a still-solid 0.5% m/m gain in the core series for June. In terms of the headline, we expect inflation (+1.2% m/m) to also be boosted by strong food prices and higher energy costs.”
“Our m/m projections imply that headline inflation likely gained speed on a y/y basis in June, despite likely softening in the core segment: We look for annual inflation to rise to 8.9% for the headline, but to decline to 5.7% for core prices.”
“Shock value into FX may be less acute given a much higher but almost evenly split forecast distribution for m/m core. Nonetheless, we think it remains premature to fade the USD if either scenario pans out. EURUSD rallies are a fade.”
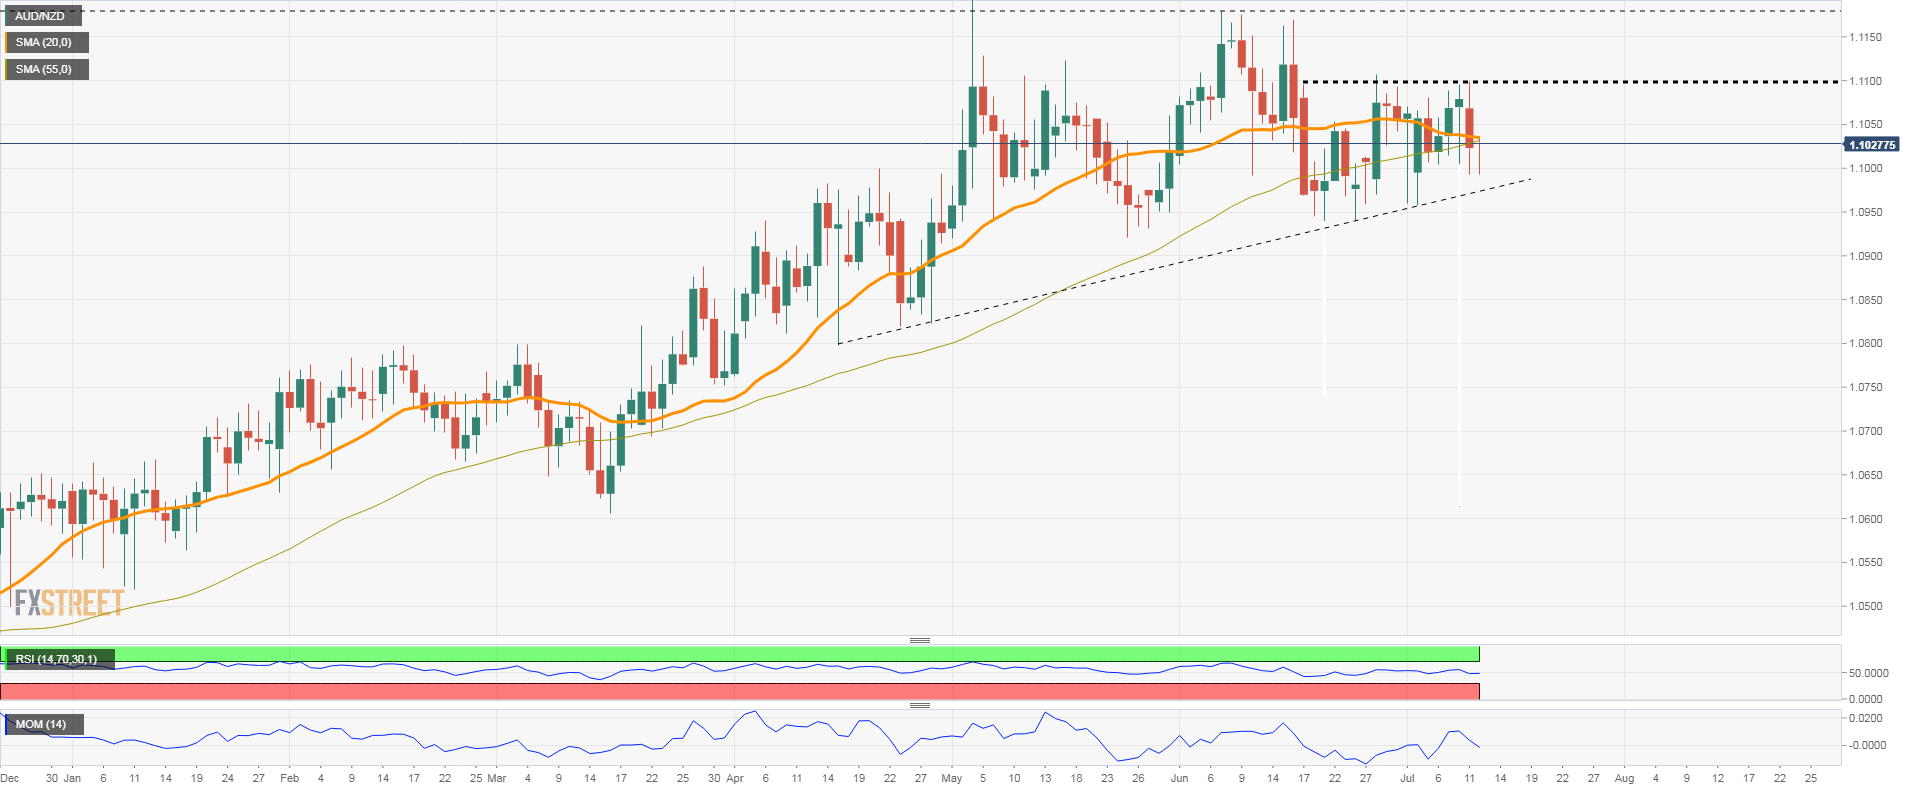
- AUD/NZD continues to move sideways, around 1.1030.
- Risks appear to be tilted to the downside with technical indicators pointing modestly to the downside.
- The correction could extend below the support at 1.0970.
The AUD/NZD cross is moving sideways below 1.1100. The 1.1100 area caps the upside. A break higher should strengthen the aussie, and would target 1.1150 initially and then a test of 1.1180.
The daily chart shows Momentum turning south and the RSI flat at 50 reflecting the lack of directional moves. The chart looks biases to the downside.
On the flip side, a consolidation below 1.1000 should expose an uptrend line at 1.0970. A break lower would open the doors to more losses, initially to 1.0950. The next support is located at 1.0920.
While between the uptrend line and the 1.1100 area, volatility in AUD/NZD will likely remain limited. A break of one of the critical levels could trigger trading opportunities.
AUD/NZD daily chart
The US economic data, including the June jobs report, are not consistent with a recession in the first or second quarters, the White House said in a memo released on Tuesday, as reported by Reuters.
Key takeaways
"US labor market strength puts the US in a better position than many other countries to transition to lower inflation and steady growth."
"Impact of energy and food prices on annual headline CPI in June will likely exceed 40%, based on market expectations."
"Gasoline prices likely to account for more than 100% of the expected increase in annual CPI in June report due on Wednesday."
"US gasoline prices can be expected to decline in weeks ahead."
"US economy appears to be transitioning to a period of slower job and economic growth."
Market reaction
The US Dollar Index showed no immediate reaction to these remarks and was last seen losing 0.25% on the day at 107.95.
The cure oil output of the United States is expected to rise by 720,000 barrels per day (bpd), down from 730,000 in the previous forecast, in 2022 to 11.91 million bpd, the US Energy Information Administration (EIA) said in its monthly report.
Key takeaways via Reuters
- US crude output to rise 860,000 bpd to 12.77 million bpd in 2023 (vs rise of 1.05 million bpd forecast last month).
- US total petroleum consumption to rise 700,000 bpd to 20.48 million bpd in 2022 (vs rise of 750,00 bpd last month).
- US petroleum demand to rise 320,000 bpd to 20.8 million bpd in 2023 (vs rise of 200,000 bpd last month) - eia.
Market reaction
Crude oil prices continue to trade deep in negative territory after this report with the barrel of West Texas Intermediate (WTI) losing 6.7% on the day at $96.50.
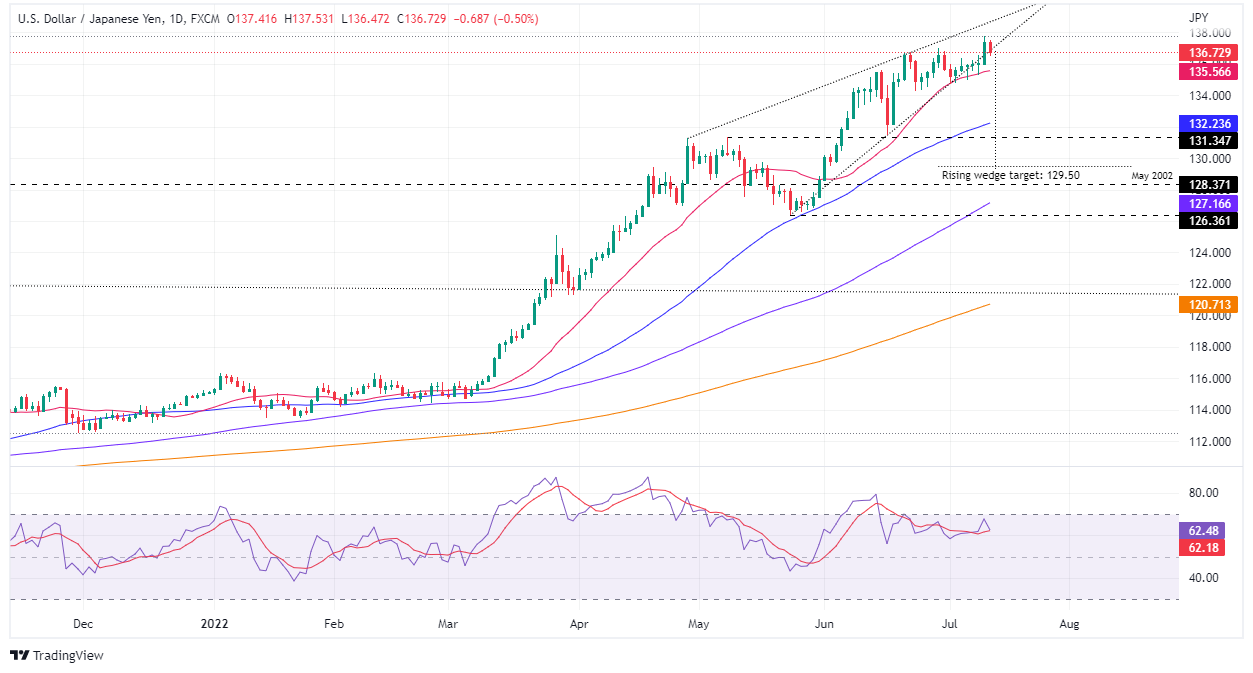
- The Japanese yen strengthened on verbal intervention by the Japanese Finance Minister Suzuki.
- On Tuesday, the USD/JPY tumbled towards a daily low of around 136.50 before settling near the June 21 highs.
- USD/JPY Price Analysis: The major remains upward biased, but a rising wedge has formed, which targets a fall towards 129.50.
The USD/JPY retreats from 24-year highs around 137.75, falling more than 100-pips during the North American session, due to falling US bond yields and talks between the US Treasury Secretary Janet Yellen and Japan’s Finance Minister Suzuki, in which he told her about the weakening of the yen and agreed to continue consulting in foreign exchange.
At the time of writing, the USD/JPY is trading at 136.73, down by more than half percent, after reaching a daily high of around 137.53, to stumble towards fresh daily lows below 136.50 before settling around current price levels.
USD/JPY Daily chart
The USD/JPY daily chart illustrates the pair as upward biased, though forming a rising wedge, meaning selling pressure might be around the corner, to step in on the pair and drag it lower. Also, with the Relative Strength Index (RSI) stepping out of overbought conditions and about to cross under the RSI’s 7-day SMA, that would open the door for further downside.
If the USD/JPY break below the rising wedge, its first support would be the 20-day EMA at 135.56. Once cleared, the next demand zone to test would be the July 1 low at 134.74, followed by the 50-day EMA at 132.23, on its way, towards the measured target, using the top-bottom trendlines that form the rising wedge at around 129.50.
USD/JPY Key Technical Levels
- GBP/JPY is moving sideways in the short-term with a bearish bias.
- Daily close under 162.00 to open the doors to more losses.
- Key resistance is seen at 163.70 and 164.50.
The GBP/JPY is falling on Tuesday, trading around 162.50. It bottomed at 161.85 and quickly rose back above 162.00. The 162.00 area has become a critical level and a daily close below should open the doors for an extension of the decline, initially to 161.20 (100-day Simple Moving Average). Below, there is not much support until 160.00.
Technical indicators in the daily chart are biased to the downside. RSI and Momentum are pointing south, and the price is below the 20-day SMA. A recovery above 164.70 could change the short-term outlook.
While the pound resists above 162.00, the odds of more range trading between that level and 163.80. A daily close above the mentioned level should clear the way for 164.70. Above the next critical target is a downtrend line from June highs currently at 166.55.
GBP/JPY daily chart
- The precious metals complex remains on the defensive, with gold reaching two-month lows and silver at two-year lows.
- Risk aversion dominates Tuesday’s trading session as investors brace for June’s US CPI report.
- Commerzbank analysts commented that a solid US dollar and gold ETF’s outflows keep XAUUSD heavy.
- Gold Price Forecast (XAUUSD): Tilted to the downside and might test $1700; otherwise, a correction towards $1750 is on the cards.
Gold (XAUUSD) spot declined during Tuesday’s North American session due to risk-aversion, courtesy of China’s coronavirus reemergence, the EU’s energy crisis, and recession fears. That usually lifts the yellow metal price, though haven flows are going towards the greenback and US Treasuries, as US bond yields are falling across the board.
Gold declines on a firm US dollar, a dismal sentiment, and on ETF’s outflows
XAUUSD is trading at around $1731 a troy ounce after seesawing between the high/low of the day during the Asian session. The yellow metal recorded its low around $1722, followed by a rally towards the daily high near $1744, and then gold’s price stayed range-bound within the $1728-1740 for the rest of the day.
Sentiment remains dismal as traders brace for the US inflation report on Wednesday. A day later, prices paid by producers would shed some light on raw materials and commodity prices and could be a prelude to what could happen during the Q2 earnings season. According to Press Secretary Jean-Pierre, the White House expressed that the new CPI would be elevated.
- Also read: US CPI Preview: Forecasts from 11 major banks, new peak but at headline
Additionally fueling investors’ worries is China’s Covid-19 resurgence witnessed the lockdown of Wugang for three days due to 1 Covid case, while Shanghai remains doing massive tests across the city.
Elsewhere, analysts at Commerzbank expressed that a firm US dollar is not the only reason weighing on lower gold prices but also the ongoing and solid ETF outflows.
“The gold ETFs tracked by Bloomberg registered outflows of 29 tons last week, their most pronounced in eight weeks and the fourth week in a row (with growing momentum). Speculative financial investors have likewise been withdrawing further from the gold of late. According to the CFTC’s statistics, their net long positions are at their lowest level in over three years,” Commerzbank analysts wrote.
What to watch
In the week ahead, the US economic calendar will feature the US Consumer Price Index and the Beige Book on Wednesday, followed by Thursday’s PPI and Initial Jobless Claims. On Friday, the University of Michigan Consumer Sentiment could be again the spotlight ahead of the Federal Reserve July meeting.
Gold Price Forecast (XAUUSD): Technical outlook
XAUUSD is downward biased, despite remaining in choppy trading conditions, as sellers cannot challenge the $1700 figure. Gold traders should be aware that oscillators are showing oversold readings, indicating that selling pressure eases, though the RSI’s slope keeps aiming downwards, opening the door for a challenge of $1700.
Therefore, XAUUSD’s break below September 29, 2021 low at $1721.71 would expose the $1700 figure. On the upside, XAUUSD’s first resistance would be $1750. A breach of the latter would expose the 20-day EMA at around $1800.
How low can EUR/USD go? Economists at TD Securities note that the world’s most popular currency pair could test the 0.90/0.85 region.
More EUR downside to be had
“With EUR/USD near parity, the more pressing question is whether this will offer solid support. While we expect some defense at this level, EUR/USD may not escape a sub-parity paradigm and 0.85/0.90 could soon become reality.”
“It is too much to ask for capital flows to offset the erosion in trade, leaving EUR's much-heralded current account a drag for the currency.”
“EUR/USD is following a similar profile to the last Fed cycle, suggesting more EUR downside to be had.”
“Relative curve pricing and equity performance keep the prospects of EUR upside remote.”
The US Bureau of Labor Statistics will release the June Consumer Price Index (CPI) data on Wednesday, July 13 at 12:30 GMT and as we get closer to the release time, here are the forecasts by the economists and researchers of 11 major banks regarding the upcoming US inflation print.
Headline inflation at 8.6% is worrying, but it could get even worse. Economists expect an increase to 8.8% as energy prices continued advancing last month.
Core CPI was already high in June 2021, the figure which now falls out of the series. The calendar is pointing to a drop from 6% to 5.8%. Expectations for the monthly price increase stand at 0.6%.
ANZ
“We expect US core CPI to have risen by 0.5% MoM in June and headline by 1.0%. Higher energy prices explain the gap between headline and core. A 1% MoM rise in CPI inflation in May triggered a 75 bps hike from the Fed in June. But with commodity prices easing substantively since then, there may be less pressure on the Fed to repeat with a 75 bps hike in July as inflation expectations are unlikely to be as worrisome.”
Commerzbank
“We expect consumer prices to have risen 1.2% from May, and 0.5% excluding energy and food. Headline inflation would then reach a new 40-year high of 8.8%. In the coming months, inflation is likely to climb even above 9%.
ING
“The market is favouring a 75 bps rate hike from the Federal Reserve on 27 July and we agree given the tight jobs market and inflation running at more than four times the 2% targeted rate. In fact, inflation is likely to move even further above target this coming week as gasoline, food, shelter and airline fares continue to rise apace. Core inflation may slow marginally to 5.8% from 6%, but this too is well above target.”
RBC Economics
“US CPI likely ticked higher to 8.8% in June on the back of surging food and gas prices. Rent prices have been rising faster over the past year and should continue to support growth in core prices, given its high relative weight.”
Deutsche Bank
“We note that while gas prices fell in the second half of June, the first half strength will still be enough to help the headline CPI print (+1.33% forecast vs. +0.97% previously) be strong on the month but with core (+0.64% vs. +0.63%) also strong. We have the headline YoY rate at 9.0% (from 8.6%) while core should tick down from 6.0% to 5.8%.”
TDS
“Core prices likely stayed strong in June, with the series registering a 0.5% MoM gain. Shelter inflation likely maintained momentum, but we look for airfares to retreat following double-digit m/m expansions in March-May. Separately, we expect gasoline prices to remain a notable force, accelerating to an 11% MoM pace. Our MoM forecasts imply 8.9%/5.7% YoY for total/core prices.”
SocGen
“The core inflation rate is expected to rise 0.4% MoM and 5.6% YoY. The pace is slowing but is not slow enough. Travel costs remain high and are likely to subside in the coming months, but the much greater issue is rents and shelter costs that are likely to continue their upward push and keep a floor on inflation near 4.5%. We expect a decline from the peak to be rapid should energy prices stabilize. A retreat from peak is not enough. The Fed goal is 2%. The Fed acknowledges that it may take a couple of years to return to 2%. Rents are the major factor preventing a return to 2%.”
NBF
“The food component likely remained very strong given severe supply constraints globally, and this increase may have been compounded by sharply higher gasoline prices. As a result, headline prices could have increased 1.2% MoM, lifting the YoY rate to a 40-year high of 8.8%. Core prices, meanwhile, should have continued to be supported by rising rent prices and advanced 0.6%. Thanks to a strongly negative base effect, this healthy gain should still translate into a three-tick drop of the 12-month rate to 5.7%.”
CIBC
“Total CPI inflation likely accelerated to 8.8% YoY in the US. Higher prices at the pump would also feed through to core inflation (ex. food and energy) in the transportation services component, helping to drive a likely 0.6% monthly increase in that group, and leaving annual core inflation at 5.8%. Shelter costs likely continued to add to price pressures, as the lagged impact of higher home prices is captured in the index, offsetting any easing in the pace of used car price growth, or relief in goods prices stemming from the end of lockdowns in China. We are in line with consensus forecast and market reaction should therefore be limited.”
Wells Fargo
“We look for a 1.1% monthly gain for the CPI, which will push the year-ago pace of inflation to yet another fresh 40-year high of 8.8%. June could be the peak in the year-ago pace of inflation, but that will depend highly on how commodity prices play out over the next few months. Even if June marks a peak, we are likely to continue to see very high inflation rates for the next few months through September. When excluding food and energy, we expect core prices rose 0.5% MoM. Core goods prices likely moved higher but at a slower rate in June, while core services are set to moderate a bit after the meteoric rise in travel prices the past few months. Primary shelter costs, however, are expected to advance at a similar pace to May. Core prices should increase around 0.5% in the next few months as the eventual step-down in inflation will be gradual.”
Citibank
“US June CPI MoM – Citi: 1.2%, prior: 1.0%; CPI YoY – Citi: 8.9%, prior: 8.6%; CPI ex Food, Energy MoM – Citi: 0.6%, prior: 0.6%; CPI ex Food, Energy YoY – Citi: 5.7%, prior: 6.0%. Ffollowing another upside surprise to core CPI in May, we expect a similar 0.6% MoM increase in the June data (although just barely at 0.56% unrounded). Very strong shelter prices in May data are likely to persist for at least a few months, and we expect a strong 0.61% increase in primary rents and a 0.57% increase in owners’ equivalent rent in June. The clearest downside risks for CPI in June and over the rest of the year comes from goods prices, particularly auto prices which are a substantial weight in CPI inflation. Generally, goods prices should continue to slow in the coming months as demand for goods eases.”
- USD/CAD trimmed a part of its intraday gains amid modest USD pullback from a 20-year high.
- Aggressive Fed rate hike bets, the risk-off mood should limit the USD losses and lend support.
- A slump in crude oil prices weighed on the loonie and further acted as a tailwind for the major.
The USD/CAD pair struggled to make it through an intermediate resistance near mid-1.3000s and has now trimmed a part of its intraday gains. Spot prices retreated to the 1.3020-1.3015 region during the early North American session, though the near-term bias still seems tilted in favour of bullish traders.
A further decline in the US Treasury bond yields prompted some US dollar profit-taking following the early uptick to a fresh two-decade high. That said, aggressive Fed rate hike bets, along with the prevalent risk-off mood, helped limit any deeper USD pullback and should act as a tailwind for the USD/CAD pair.
On the other hand, a sharp fall in crude oil prices undermined the commodity-linked loonie and supports prospects for the emergence of some dip-buying around the USD/CAD pair. The black liquid was weighed down by fresh COVID-19 curbs in China, which, along with recession fears, have raised concerns about the fuel demand outlook.
From a technical perspective, the 1.3050 area might continue to act as an immediate hurdle ahead of the YTD peak, around the 1.3080-1.3085 region. This is closely followed by the 1.3100 mark, which if cleared decisively would be seen as a fresh trigger for bulls and set the stage for a further near-term appreciating move.
The USD/CAD pair would then aim to surpass an intermediate barrier near the 1.3155-1.3160 region and accelerate the momentum towards the 1.3200 mark. Bulls might eventually lift spot prices to the next relevant resistance near the 1.3270 zone.
On the flip side, weakness back below the 1.3000 psychological mark could be seen as a buying opportunity and remain limited near the 1.2940-1.2935 support zone. The said region represents the 100-period SMA on the 4-hour chart and should act as a pivotal point, which if broken might prompt aggressive technical selling.
The next relevant support is pegged near the 1.2900 round-figure mark, which if broken decisively would negate any near-term positive bias and make the USD/CAD pair vulnerable. The subsequent fall has the potential to drag spot prices back towards testing monthly low, around the 1.2835 region, en-route the 1.2820-1.2815 support zone.
USD/CAD 4-hour chart
-637932309439317388.png)
Key levels to watch
While speaking at the Devex Forum on Tuesday, International Monetary Fund (IMF) Managing Director Kristalina Georgieva said that she sees a "debt crisis in the making" with rising interest rates and debt, as reported by Reuters.
"Global central banks are rightly focusing on putting a lid on inflation but this adds pressure to debt-burdened countries," Georgieva added. "I'm cautiously optimistic that G20 countries are starting to grasp the huge problem of debt restructuring for developing countries."
Market reaction
These comments don't seem to be having a significant impact on risk sentiment. As of writing, the S&P 500 Index was virtually unchanged on the day at 3,858.
Additional takeaways
"30% of developing and emerging markets are at or near debt distress; distress rate doubles for low income countries to 60%."
- EUR/USD bounces off lows in the parity level on Tuesday.
- Occasional rebounds follow the current overbought conditions.
EUR/USD drops and bounces off new lows in the parity zone on turnaround Tuesday.
The pair’s bearish stance remains everything but abated for the time being. Against that, intermittent bullish attempts could be deemed as selling opportunities, with the next target at the December 2002 low at 0.9859.
As long as the pair navigates below the 5-month support line near 1.0570, further losses remain in store.
In the longer run, the pair’s bearish view is expected to prevail while below the 200-day SMA at 1.1055.
EUR/USD daily chart
Following the recent price action, USD/IDR could now embark on a consolidative phase, likely between 14,872 and 15,050, suggested FX Strategist Quek Ser Leang at UOB Group’s Global Economics & Markets Research.
Key Quotes
“USD/IDR soared to a high of 15,020 last Wednesday (06 Jul) before easing. The combination of weakening upward momentum and overbought conditions suggest USD/IDR is unlikely to advance much further.”
“For this week, USD/IDR is more likely to trade between 14,872 and 15,050.”
- DXY comes under pressure after hitting new cycle tops.
- Overbought conditions should prompt a technical move.
DXY climbs to new nearly 20-year peaks around 108.60 on Tuesday, although it loses some ground afterwards.
Further upside in the dollar remains in store in the short-term horizon, with the next target at the October 2002 top at 108.74. However, overbought conditions could spark a technical correction to, initially, the June post-FOMC high at 105.78 (June 15).
As long as the index trades above the 5-month line around 103.00, the near-term outlook for DXY should remain constructive.
In addition, the broader bullish view remains in place while above the 200-day SMA at 98.59.
DXY daily chart
- AUD/USD bounced off over a two-year low touched on Tuesday amid a modest USD pullback.
- A further decline in the US bond yields prompted some USD profit-taking near a 20-year peak.
- Aggressive Fed rate hike bets, recession fears should limit the USD losses and cap the major.
The AUD/USD pair staged a modest bounce from over a two-year low touched on Tuesday and steadily climbed to mid-0.6700s during the early European session.
The global flight to safety continued dragging the US Treasury bond yields lower, which forced the US dollar to surrender its intraday gains to a fresh two-decade high. This, in turn, was seen as a key factor that assisted the AUD/USD pair to attract some buying in the vicinity of the 0.6700 round-figure mark. That said, the attempted recovery is more likely to remain short-lived and runs the risk of fizzling out rather quickly.
The prospects for a more aggressive policy tightening by the Fed, along with the prevalent risk-off mood, should limit any meaningful USD corrective pullback and cap the AUD/USD pair. Investors seem convinced that the Fed would stick to a faster rate hike path to curb soaring inflation. The bets were reaffirmed by last week's FOMC minutes, which emphasized the need to fight inflation even if it results in an economic slowdown.
Furthermore, rapidly rising interest rates, along with a prolonged Russia-Ukraine and fresh COVID-19 lockdowns in China, have been fueling recession fears and continued weighing on investors' sentiment. This was evident from an extended selloff in the equity markets, which could further lend support to the safe-haven greenback. Apart from this, the recent slump in commodity prices should act as a headwind for the resources-linked aussie.
Hence, it will be prudent to wait for strong follow-through buying before confirming that the AUD/USD pair has formed a near-term bottom and positioning for any further gains ahead of the key macro data. The latest US consumer inflation figures are due on Wednesday and will influence the USD price dynamics. Traders will further take cues from Thursday's release of Australian employment details before placing fresh directional bets.
In the meantime, the US bond yields might drive the USD demand amid absent relevant market-moving economic releases from the US on Tuesday. Apart from this, the broader market risk sentiment should provide some impetus to the AUD/USD pair and allow traders to grab short-term opportunities.
Technical levels to watch
- EUR/JPY adds to Monday’s losses and challenges 137.00.
- Immediately to the downside emerges the 100-day SMA.
EUR/JPY keeps the bearish note unchanged in the second half of the week so far.
While below the 4-month resistance line around 140.00, extra losses should remain on the table with the initial target at the 100-day SMA, today at 136.16. The loss of this levels exposes a deeper pullback to the minor support at 133.92 (low May 19).
In the longer run, the constructive stance in the cross remains well propped up by the 200-day SMA at 133.16.
EUR/JPY daily chart
- GBP/USD witnessed some follow-through selling for the second successive day on Tuesday.
- Retreating US bond yields led to a modest USD pullback and helped limit any further losses.
- Traders now await Wednesday’s release of the monthly UK GDP print and the US CPI report.
The GBP/USD pair added to the previous day's heavy losses and witnessed some follow-through selling for the second successive day on Tuesday. The downward trajectory dragged spot prices to the lowest level since March 2020, though stalled just ahead of the 1.1800 round-figure mark.
The US dollar trimmed a part of its intraday gains to a fresh two-decade high amid a further decline in the US Treasury bond yields, pressured by the global flight to safety. Modest intraday USD pullback was seen as a key factor that offered some support to the GBP/USD pair, though any meaningful recovery still seems elusive.
Growing acceptance that the Fed would retain its aggressive policy tightening path, despite fears about a possible recession, should continue to act as a tailwind for the buck. In fact, the minutes of the June 14-15 FOMC meeting released last week emphasized the need to fight inflation even if it results in an economic slowdown.
Adding to this, Atlanta Fed President Raphael Bostic said that the US economy can cope with higher interest rates and reiterated his support for another interest rate hike at the July FOMC meeting. Hence, the market focus will remain glued to the release of the latest US consumer inflation figures, due on Wednesday.
In the meantime, the prevalent risk-off environment should underpin the greenback's relative safe-haven status. Apart from this, worries that the UK government's controversial Northern Ireland Protocol Bill could trigger a trade war with the European Union and expectations for a less hawkish Bank of England should cap the GBP/USD pair.
The fundamental backdrop supports prospects for a further near-term depreciating move, through traders might prefer to wait on the sidelines ahead of the key macro data from the UK and the US. The monthly UK GDP report is scheduled to be published on Wednesday and would be followed by the latest US consumer inflation figures.
This week's US economic docket also highlights the release of monthly Retail Sales data and Prelim Michigan Consumer Sentiment on Friday, which will influence the USD price dynamics. Traders will further take cues from the broader market risk sentiment to determine the next leg of a directional move for the GBP/USD pair.
Technical levels to watch
The continuation of the uptrend in USD/MYR is predicted to meet a major hurdle around 4.4500, according to FX Strategist Quek Ser Leang at UOB Group’s Global Economics & Markets Research.
Key Quotes
“USD/MYR opened on a strong note this week and soared above last week’s 4.4260 high. Upward momentum has improved considerably and USD/MYR is likely to advance to the 2020 high at 4.4410.”
“For this week, the next major resistance at 4.4500 is likely out of reach. Support is at 4.4200 but only a break of the solid support at 4.4100 would indicate that the current upward pressure has eased.”
- A combination of factors prompted some profit-taking around USD/JPY on Tuesday.
- Intervention speculations, along with the risk-off mood offered support to the JPY.
- Retreating US bond yields acted as a headwind for the USD and exerted pressure.
- The Fed-BoJ policy divergence to limit losses ahead of the US CPI on Wednesday.
The USD/JPY pair witnessed some profit-taking on Tuesday and eroded a part of the previous day's strong gains to its highest level since September 1998. The retracement slide dragged spot prices closer to mid-136.00s heading into the North American session and was sponsored by a modest US dollar pullback from a two-decade high.
Japanese Finance Minister Shunichi Suzuki expressed concerns about the recent sharp decline in the yen and said to take appropriate measures if necessary. Apart from this, the prevalent risk-off environment - as depicted by an extended selloff in the equity markets amid fears about a possible global recession - drove some haven flows towards the Japanese yen. This, in turn, prompted bulls to take some profits off the table and exerted downward pressure on the USD/JPY pair.
The flight to safety was reinforced by a further decline in the US Treasury bond yields, which resulted in the narrowing of the US-Japan rate differential and offered additional support to the JPY. In fact, the yield on the benchmark 10-year US government bond slipped further below the 3.0% threshold and failed to assist the US dollar to preserve its modest intraday gains to a fresh two-decade high. This further contributed to the USD/JPY pair's intraday corrective pullback.
The downside, however, seems limited, at least for the time being, amid the divergent monetary policy stance adopted by the Bank of Japan and the Federal Reserve. In fact, BoJ Governor Haruhiko Kuroda reiterated on Monday that the central bank remains ready to take additional monetary easing steps as necessary. In contrast, the FOMC minutes released last week reaffirmed market bets that the US central bank would retain its aggressive policy tightening cycle to curb soaring inflation.
Policymakers indicated that another 50 or 75 bps rate hike is likely at the upcoming FOMC meeting in July and emphasized the need to fight inflation even if it results in an economic slowdown. Hence, the market focus would remain on the latest US consumer inflation figures, due on Wednesday. The US CPI report will play a key role in influencing the near-term USD price dynamics and help investors determine the next leg of a directional move for the USD/JPY pair.
In the meantime, the US bond yields will drive the USD demand and provide some impetus to the USD/JPY pair amid absent relevant market-moving economic releases from the US on Tuesday. Apart from this, traders will take cues from the broader market risk sentiment to grab short-term opportunities around the major.
Technical levels to watch
The Reserve Bank of New Zealand (RBNZ) will announce its monetary policy decision on Wednesday, July 13 at 02:00 GMT and as we get closer to the release time, here are the expectations as forecast by the economists and researchers of six major banks.
The RBNZ is seen raising the Official Cash Rate (OCR) by 50 basis points (bps) from 2% to 2.5% in July. As FXStreet’s Dhwani Mehta notes, RBNZ forward guidance holds the key.
ANZ
“We expect the RBNZ will raise the OCR 50 bps to 2.50%. On balance, the data since the May MPS has not suggested any meaningful easing in inflation pressure. Indeed, if the RBNZ did publish forecasts at interim meetings, the OCR track would likely be a little higher, if anything.”
Westpac
“We expect the RBNZ to raise the OCR by another 50 bps to 2.50%. Developments since the May statement have been mixed for the monetary policy outlook. Near-term inflation is still running hot, but the risks of a global slowdown have increased and early signs of a cooling in domestic activity have started to emerge. For now, the RBNZ will need to carry through with the interest rate hikes it has signalled, or risk undoing its good work so far on bringing inflation pressures under control. But at some point in the coming months, it will be appropriate to signal that the end of the tightening cycle is near.”
Standard Chartered
“We expect the central bank to proceed with a 50 bps hike given a hawkish RBNZ, higher inflation and a weaker NZD (which places upward pressure on tradables inflation). We see only one more 25 bps hike in August and project the terminal rate at 2.75% (more dovish than market expectations and the RBNZ’s forecast) as we expect growth concerns to take priority over inflation fears in H2. Markets will be watching for any signs of a change in the hawkish rhetoric given rising concerns about a recession and as the central bank was the first among developed markets to hike rates in this cycle.”
ING
“Another 50 bps hike seems likely. But a trembling housing market and deteriorating economic picture suggest the RBNZ may have to recalibrate its hawkish message soon – probably not at this meeting, but potentially in August. And the rest of the world will likely take note. NZD to remain weak for now.”
TDS
“The surprise contraction in Q1 GDP wouldn't deter the RBNZ's hawkish stance just yet and we expect a third straight 50 bps hike to tame inflation.”
Citibank
“We expect the RBNZ MPC to deliver another 50 bps increase in the OCR to take it to 2.50%, a level broadly associated with a neutral level of monetary policy. But taking policy to neutral is unlikely to satisfy the MPC, it is likely to be only a step towards a policy level that is restrictive. Domestic hard activity data since the last OCR decision on May 25 shows a solid core of domestic demand while house prices declines have been small, with prices arguably still higher than what the RBNZ would prefer. In addition, the NZ labor market remains consistent with the RBNZ’s assessment that it is stronger than what would be consistent with full employment. Citi analysts do not however, expect the MPC to respond with a 75 bps increase in the OCR as the RBNZ remains ahead of other central banks in terms of the policy cycle.”
The firm US dollar has caused gold to drop temporarily to $1,720 today. Ongoing and robust ETF outflows are weighing on the yellow metal as well, economists at Commerzbank report.
Speculative financial investors have been withdrawing further from gold
“Any significant or lasting rise in the gold price is being precluded not only by the firm US dollar but also by the ongoing and robust ETF outflows.”
“The gold ETFs tracked by Bloomberg registered outflows of 29 tons last week, their most pronounced in eight weeks and the fourth week in a row (with growing momentum).”
“Speculative financial investors have been withdrawing further from gold of late. According to the CFTC’s statistics, their net long positions are at their lowest level in over three years.”
In its monthly report published on Tuesday, the Organization of the Petroleum Exporting Countries (OPEC) left the 2022 world oil demand growth forecast unchanged at 3.36 million barrels per day (bpd), as reported by Reuters.
Additional takeaways
"OPEC forecasts world oil demand will grow by 2.7 million bpd in 2023."
"OPEC forecasts 2023 global economic growth of 3.2%, leaves 2022 view unchanged at 3.5% and says uncertainty remains skewed to downside."
"OPEC forecasts non-OPEC oil supply will rise by 1.7 million bpd in 2023, led by the US."
"OPEC oil output rose by 234,000 bpd to 28.72 million bpd in June."
"Global demand for OPEC's crude forecast at 30.1 million bpd in 2023, up 900,000 bpd from 2022."
Market reaction
Crude oil prices continue to fall following this report and the barrel of West Texas Intermediate (WTI) was last seen trading at $99.40, where it was down nearly 4% on a daily basis.
- PepsiCo announced FQ2 earnings that beat on top and bottom lines.
- Revenue grew 5% YoY to $20.2 billion, against forecasts of $19.5 billion.
- Adjusted EPS grew 8% YoY to $1.86, above consensus of $1.74.
PepsiCo (PEP) stock has advanced 0.7% in Tuesday's premarket to $171.77 on the back of a robust earnings release for the fiscal second quarter. PepsiCo offered up adjusted earnings per share of $1.86, which beat the consensus of $1.74. Revenue of $20.2 billion also beat consensus by about $720 million. Revenue grew about 5% YoY, and adjusted EPS rose more than 8%.
“Given our year-to-date performance, we now expect our full-year organic revenue to increase 10 percent (previously 8 percent), and we continue to expect core constant currency earnings per share to increase 8 percent," said Chairman and CEO Ramon Laguarta.
Consistent with previous guidance, PepsiCo still expects the following achievements for the full-year 2022: 8% increase in core constant currency EPS; an effective tax rate of 20%, and total cash returns to shareholders of approximately $7.7 billion. The shareholder return is comprised of $6.2 billion in dividends and $1.5 billion worth of share repurchases.
PepsiCo's earnings beat did not shock the market as it normally beats consensus. The last time it missed consensus on earnings was the fourth quarter of 2022.
PepsiCo Stock Forecast: $177.24 holds price action in place
PepsiCo stock has been in an uptrend since October 2020, judging by the last time the 50-week moving average was above its 20-week counterpart. This year, however, $177.24 has been the resistance level that just will not quit. Several attempts to overtake it have failed – once in mid-January and twice in mid and late April. Stuck in the low $170s now, PEP will likely make another run at the level fairly soon.
If bulls fail once again, then PEP stock will drop to the ascending support line at $157. This support feature has been working since September 2021. A beat of $177.24 would allow PepsiCo stock to make a run at the top of the price channel near $187.
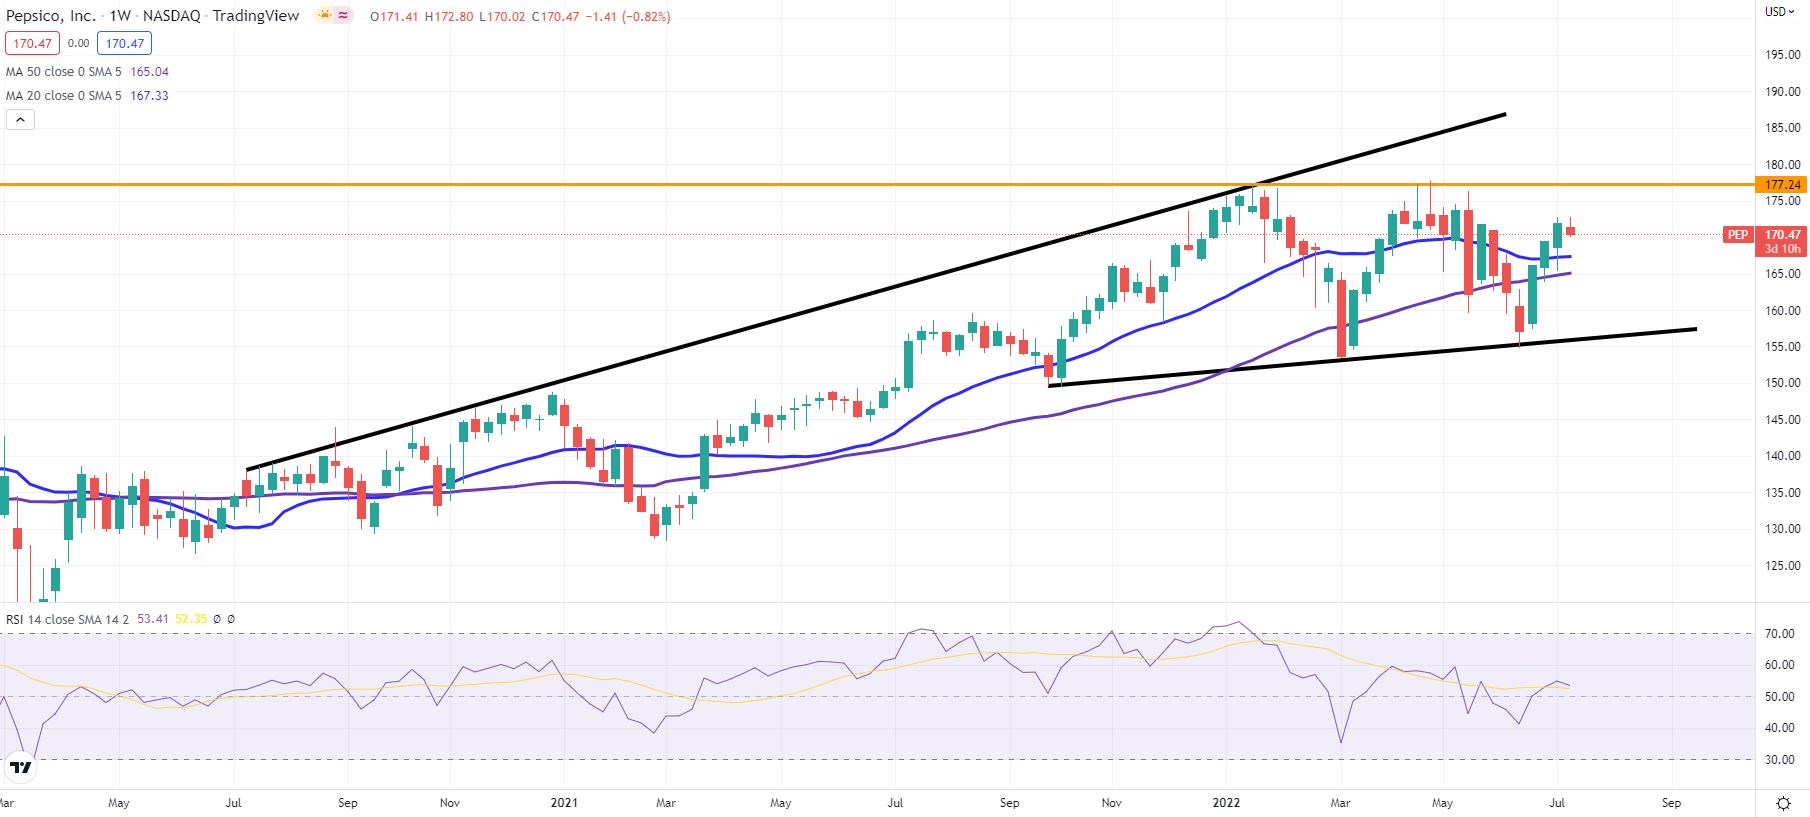
PEP weekly chart
Money markets on Tuesday scaled back European Central Bank (ECB) rate hike bets to 137 basis points (bps) by the end of the year from 145 bps on Monday amid recession fears, Reuters reported.
Market reaction
This headline doesn't seem to be having a noticeable impact on the shared currency's performance against its rivals. As of writing, the EUR/USD pair was trading at 1.0010, where it was down 0.28% on a daily basis.
Meanwhile, markets remain cautious on Tuesday with the Euro Stoxx 600 Index losing 0.3% on the day.
- NZD/USD staged a modest recovery from sub-0.6100 levels, or over a two-year low.
- Sustained USD buying and the risk-off mood capped gains for the risk-sensitive kiwi.
- Investors also seemed reluctant ahead of the RBNZ and the US CPI on Wednesday.
The NZD/USD pair showed resilience below the 0.6100 round-figure mark and gained some positive traction on Tuesday. The uptick assisted spot prices to recover a part of the previous day's sharp decline to the lowest level since May 2020, though lacked any follow-through buying.
The relentless US dollar buying remained unabated amid expectations that the Fed would stick to its aggressive policy tightening path. Apart from this, the prevalent risk-off environment - fueled by growing recession fears - pushed the safe-haven USD to a fresh 20-year high and acted as a headwind for the risk-sensitive kiwi.
Looking at the broader picture, the NZD/USD pair has been declining along a descending channel over the past four weeks or so. This points to a well-established short-term bearish trend and supports prospects for a further depreciating move for the NZD/USD pair. Traders, however, seemed reluctant ahead of this week's key event/data risk.
The Reserve Bank of New Zealand (RBNZ) is scheduled to announce its monetary policy decision during the Asian session on Wednesday. Apart from this, the market focus will remain on the latest US consumer inflation figures, which will influence the near-term USD price dynamics and provide a fresh directional impetus to the NZD/USD pair.
From current levels, any subsequent slide below the 0.6100 mark is likely to find some support near the lower end of the aforementioned channel, currently around the 0.6065-0.6060 region. A convincing break below would be seen as a fresh trigger for bearish traders and make the NZD/USD pair vulnerable to testing the 0.6000 psychological mark.
On the flip side, momentum beyond the 0.6125-0.6130 region, or the daily high, might confront some resistance near the 0.6180 area ahead of the 0.6200 mark. The latter coincides with the descending channel resistance and is closely followed by the 100-period SMA on the 4-hour chart, currently around the 0.6230-0.6235 zone.
A sustained break through the said barriers would suggest that the NZD/USD pair has formed a near-term bottom and trigger a short-covering move. Bulls might then aim back to reclaim the 0.6300 round-figure mark and lift spot prices further towards the next relevant resistance near the 0.6325 supply zone.
NZD/USD 4-hour chart
-637932180609699842.png)
Key levels to watch
FX Strategist Quek Ser Leang at UOB Group’s Global Economics & Markets Research noted further upside in USD/THB is likely to meet a tough barrier around 36.60.
Key Quotes
“USD/THB rose to a high of 36.36 last week before pulling back. Upward momentum has improved, albeit not by much. For this week, there is room for USD/THB to strengthen but in view of the lackluster upward momentum and overbought conditions, any further advance is likely limited to a test of 36.60.”
“The major resistance at 35.00 is not expected to come into the picture. Support is at 35.82 followed by 35.58.”
US Treasury Secretary Janet Yellen said on Tuesday that she did not discuss currency intervention with Japanese officials.
Additional quotes
Countries in G7 should have market-determined exchange rates.
Currency intervention warranted only in 'rare and exceptional circumstances'.
Also read: Japan’s Suzuki: Told Yellen we are concerned about rapid yen weakening recently
Market reaction
The yen seems to have caught a strong bid on the above comments, dragging USD/JPY sharply lower.
At the time of writing, USD/JPY is trading at 136.92, down 0.36% on the day.
- EUR/USD remains offered and challenges parity.
- Germany Economic Sentiment plunges in July.
- German 10y Bund yields drop to 3-day lows near 1.12%.
Sellers remain well in control of the sentiment around the European currency and prompt EUR/USD to struggle around the parity level on Tuesday.
EUR/USD in nearly 2-decade lows
EUR/USD sheds ground for the second session in a row and flirts with the crucial parity level for the first time since December 2002, as the sour mood persists among market participants.
Indeed, market chatter around the likelihood of a recession in the euro area appears reinforced on Tuesday after the Economic Sentiment tracked by the ZEW Institute in both Germany and the broader Euroland deteriorated beyond estimates for the month of July.
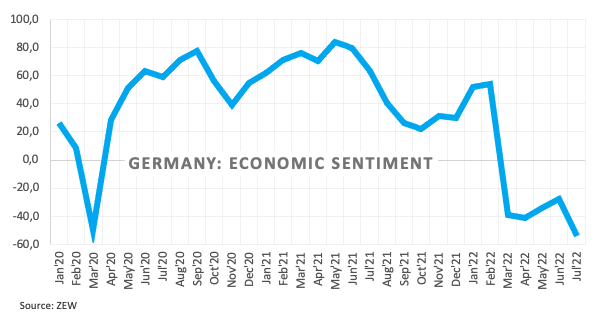
In addition, the risk aversion continues to swell in the global markets, adding an extra layer of weakness to the single currency and the rest of the risk galaxy.
There are no more data releases in the euro area on Tuesday, whereas the IBD/TIPP Economic Optimism index and the NFIB Business Optimism Index along with the speech by Richmond Fed T.Barkin are all due later in the NA session.
What to look for around EUR
Bears maintain the EUR/USD under heavy pressure and the acceleration of the downside opens the door to a probable visit to the parity level any time soon.
In the meantime, the price action around the single currency continues to follow increasing speculation of a probable recession in the euro area, dollar dynamics, geopolitical concerns, fragmentation worries and the Fed-ECB divergence.
Key events in the euro area this week: Germany, EMU ZEW Economic Sentiment (Tuesday) – Germany Final Inflation Rate, EMU Industrial Production (Wednesday) – EMU Balance of Trade (Friday).
Eminent issues on the back boiler: Fragmentation risks. Kickstart of the ECB hiking cycle in July? Asymmetric economic recovery post-pandemic in the euro bloc. Impact of the war in Ukraine on the region’s growth prospects and inflation.
EUR/USD levels to watch
So far, spot is down 0.33% at 1.0005 and faces the next contention at 1.0000 (2022 low July 12) seconded by 0.9859 (low December 2002) and finally 0.9685 (low October 2002). On the upside, a breakout of 1.0515 (55-day SMA) would target 1.0615 (weekly high June 27) en route to 1.0773 (monthly high June 9).
- Gold Price struggled to capitalize on the modest intraday bounce from a fresh YTD low.
- Recession fears and the risk-off mood continued lending some support to the commodity.
- An extension of the recent strong USD bullish run acted as a headwind for the XAUUSD.
Gold Price reversed an intraday dip to its lowest level since August 2021, albeit seemed to struggle to capitalize on the attempted recovery move. The XAUUSD seesawed between tepid gains/minor losses through the early European session and now seems to have stabilized around the $1,735 region.
An extended selloff across the equity markets - amid persistent fears about a possible global recession - turned out to be a key factor that offered some support to the safe-haven precious metal. That said, the relentless US dollar buying, bolstered by hawkish Fed expectations, acted as a headwind and kept a lid on any meaningful upside for the dollar-denominated gold.
In fact, the USD Index soared to a fresh two-decade high and continued drawing support from growing acceptance that the Fed would retain its aggressive policy tightening path to curb soaring inflation. The bets were further reaffirmed by the FOMC meeting minutes released last week, indicating that another 50 or 75 bps rate hike is likely at the upcoming FOMC meeting in July.
Policymakers also emphasized the need to fight inflation even if it results in an economic slowdown. Hence, the market focus will remain glued to the latest US consumer inflation figures, due for release on Wednesday. The US CPI report will play a key role in influencing the Fed's policy outlook and help determine the next leg of a directional move for the non-yielding gold.
In the meantime, the worsening global economic outlook and a further decline in the US Treasury bond yields - led by the flight to safety - might continue to lend some support to the gold price. Apart from this, the USD price dynamics would be looked upon for short-term trading opportunities amid absent relevant market-moving economic releases from the US.
Technical levels to watch
FX Strategists at UOB Group Lee Sue Ann and Quek Ser Leang note there is scope for extra advances in USD/CNH in the next weeks.
Key Quotes
24-hour view: “USD soared to a high of 6.7266 yesterday before closing on a firm note at 6.7266 (+0.61%). Upward momentum has improved rapidly and USD could rise to 6.7400. The next resistance at 6.7500 is likely out of reach for now. Support is at 6.7180 followed by 6.7100.”
Next 1-3 weeks: “Our latest narrative was from last Friday (08 Jul, spot at 6.6970) where the recent build-up in upward momentum has fizzled out and we expected USD to consolidate and trade between 6.6600 and 6.7400. We did not expect the strong surge yesterday that sent USD soaring to a high of 6.7266. Rapidly improving upward momentum suggests USD could strengthen further to 6.7500. The upside is intact as long as USD does not move below 6.6950 (‘strong support’ level) within these few days.”
EUR/USD has extended its slide toward parity early Tuesday. The pair is struggling to shake off the bearish pressure in the risk-averse market atmosphere but the near-term technical outlook points to extreme oversold conditions, FXStreet’s Eren Sengezer reports.
Can buyers continue to defend parity?
“Later in the session, the IBD/TIPP Economic Optimism Index and the NFIB Business Optimism Index will be featured in the US economic docket. Unless the US data point to a surprising improvement in business sentiment, investors are likely to stay away from risk-sensitive assets in the second half of the day.”
“The Relative Strength Index (RSI) indicator on the four-hour chart dropped all the way to 20 and EUR/USD trades near the lower limit of the descending regression channel coming from late June. Both of these technical developments how extremely oversold the pair in the near term. Hence, sellers could move to the sidelines and wait for a technical correction before continuing to short the pair.”
“On the upside, 1.0050 (static level, mid-point of the descending channel) aligns as first hurdle ahead of 1.0075 (upper limit of the descending channel) and 1.0100 (psychological level, 20-period SMA).”
“In case 1.0000 (psychological level) fails, the next bearish targets are located at 0.9950 (static level from November 2002) and 0.9900 (psychological level).”
- German ZEW Economic Sentiment arrived at -53.8 in July vs. –28.0 previous.
- The ZEW Current Situation for Germany came in at -45.8 in July vs. -27.6 prior.
- EUR/USD defends 1.0000 on downbeat German and Eurozone data.
The German ZEW headline numbers for July showed that the Economic Sentiment Index slumped to -53.8 while missing estimates of -38.3.
Meanwhile, the Current Situation sub-index arrived at -45.8 in July vs. -34.5 expectations.
The Eurozone ZEW Economic Sentiment Index stood at -51.1 in the current month as compared to the -28.0 previous reading and -32.8 expected.
Key takeaways
“The current major concerns about the energy supply in Germany, the ECB’s announced interest rate hike and further pandemic-related restrictions in China have led to a considerable deterioration in the economic outlook."
"The experts assess the current economic situation significantly more negatively than in the previous month and have further lowered their already unfavorable forecast for the next six months."
"Expectations for energy-intensive and export-oriented sectors of the economy have fallen particularly sharply, and private consumption is also assessed as significantly weaker.”
FX market reaction
The euro remains vulnerable to ZEW Surveys from Germany and Eurozone. EUR/USD was last seen trading at 1.0002, down 0.36% on the day.
- USD/CHF gained traction for the ninth straight day and shot to a nearly four-week high.
- Aggressive Fed rate hike bets pushed the USD to a 20-year high and remained supportive.
- The risk-off mood did little to benefit the safe-haven CHF or hinder the strong move up.
The USD/CHF pair built on the previous day's bullish breakout momentum through the 0.9800 mark and gained follow-through traction on Tuesday. This marked the ninth straight day of a positive move and pushed spot prices to a nearly four-week high, around mid-0.9800s during the early part of the European session.
With the latest leg up, the USD/CHF pair has rallied over 350 pips from sub-0.9500 levels touched on June 29 and the strong move up was sponsored by relentless US dollar buying. Expectations that the Fed would retain its aggressive policy tightening path continued underpinning the USD and pushed it to a fresh 20-year high.
The FOMC minutes released last week emphasized the need to fight inflation even if it results in an economic slowdown and reaffirmed hawkish Fed expectations. Adding to this, policymakers indicated that another 50 or 75 bps rate hike is likely at the upcoming FOMC meeting in July, which, in turn, favours the USD bulls.
The prospects for a further rise in interest rates, along with the ongoing Russia-Ukraine war and the latest COVID-19 outbreak in China, have been fueling recession fears. This, in turn, weighed on investors' sentiment, though did little to benefit the safe-haven Swiss franc or hinder the USD/CHF pair's positive move.
The price action supports prospects for a further near-term appreciating move, though traders might prefer to wait for the release of the US consumer inflation figures on Wednesday. In the meantime, the USD price dynamics would play a key role in influencing the USD/CHF pair amid absent relevant economic data from the US.
Technical levels to watch
- GBP/USD witnessed heavy selling for the second straight day on Tuesday.
- Sustained USD buying interest was seen as a key factor exerting pressure.
- The set-up supports prospects for a fall to the descending channel support.
The GBP/USD pair added to the overnight heavy losses and witnessed some selling for the second straight day on Tuesday. The bearish pressure remained unabated through the early European session and dragged spot prices to the 1.1800 neighbourhood, or the lowest level since March 2020.
The US dollar prolonged its recent strong bullish run and shot to a fresh two-decade high, bolstered by hawkish Fed expectations and the prevalent risk-off environment. This, in turn, was seen as a key factor that continued exerting downward pressure on the GBP/USD pair.
Given the overnight break below the previous YTD low, around the 1.1875 region, the subsequent weakness favours bearish traders. Hence, some follow-through weakness towards the 1.1800 round-figure, en-route the 1.1750 support zone, now looks like a distinct possibility.
The latter represents the lower boundary of over a two-week-old descending trend channel and should act as a strong base for the GBP/USD pair. That said, a convincing break through the said support would mark a fresh breakdown and pave the way for further losses.
On the flip side, any meaningful recovery attempted might now attract fresh sellers near the previous YTD low, around the 1.1875 region. This, in turn, should cap the GBP/USD pair around the 1.1900 round-figure mark, which is likely to act as a key pivotal point for traders.
Sustained strength beyond could lift the GBP/USD pair to the 1.1935-1.1940 intermediate resistance en-route the 1.2000 psychological mark. The latter represents a confluence hurdle comprising of 50-period SMA on the 4-hour chart and the top end of the descending channel.
GBP/USD 4-hour chart
-637932110214543213.png)
Key levels to watch
- The rally in the dollar looks unabated above 108.00.
- US yields extend the decline to multi-day lows on Tuesday.
- IBD/TIPP Index, NFIB Index, Fed’s Barkin next on tap.
The US Dollar Index (DXY), which tracks the greenback vs. a bundle of its main competitors, keeps the bid bias well and sound and trespasses the 108.0 barrier on turnaround Tuesday.
US Dollar Index in 20-year peaks
The index extends the optimism seen at the beginning of the week and trade beyond the 108.00 mark for the first time since October 2002, always underpinned by the unabated sell-off in the euro.
The move higher in the dollar comes on the back of diminishing US yields, as recession concerns seem to prompt investors to seek shelter in the safe haven universe for the time being.
Friday’s release of the June Payrolls, however, appear to have mitigated part of those worries and now favour the continuation of the current pace of the Fed’s normalization process.
Speaking about recession fears, the Atlanta Fed’s GDPNow sees the economy contracting 1.2% in the April-June period (from a 1.9% contraction recorded previously).
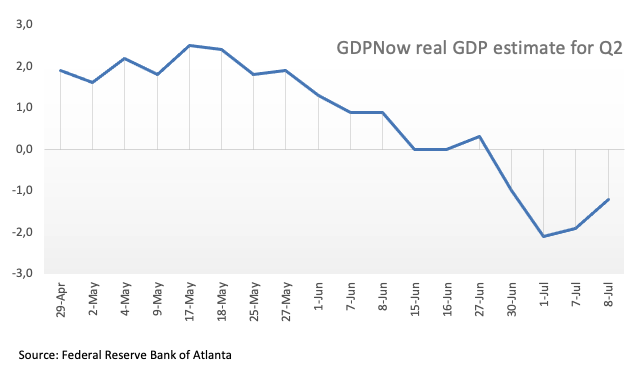
In the US data space, the IBD/TIPP Economic Optimism index and the NFIB Business Optimism Index are due later seconded by the speech by Atlanta fed R.Bostic (2024 voter hawk).
What to look for around USD
The index pushes higher and surpasses the 108.00 hurdle, charting at the same time new cycle highs. It is worth noting, however, that the recent sharp move in the dollar comes largely in response to the accelerated decline in the European currency.
Further support for the dollar is expected to come from the Fed’s divergence vs. most of its G10 peers (especially the ECB) in combination with bouts of geopolitical effervescence and the re-emergence of the risk aversion among investors. On the flip side, market chatter of a potential US recession could temporarily undermine the uptrend trajectory of the dollar somewhat.
Key events in the US this week: MBA Mortgage Applications, Inflation Rate, Fed Beige Book (Wednesday) – Producer Prices, Initial Claims (Thursday) – Retail Sales, Industrial Production, Flash Consumer Sentiment, Business Inventories (Friday).
Eminent issues on the back boiler: Hard/soft/softish? landing of the US economy. Escalating geopolitical effervescence vs. Russia and China. Fed’s more aggressive rate path this year and 2023. US-China trade conflict. Future of Biden’s Build Back Better plan.
US Dollar Index relevant levels
Now, the index is up 0.29% at 108.52 and a break above 108.55 (2022 high July 12) would expose 108.74 (monthly high October 2002) and then 109.00 (round level). On the flip side, the next support aligns at 103.67 (weekly low June 27) seconded by 103.41 (weekly low June 16) and finally 101.29 (monthly low May 30).
The dollar's bullish momentum remained fully intact at the start of the new week. Economists at ING note that the US Dollar Index could extend its race higher towards 110.
Untouched momentum
“Despite the long rally, the probability of the US dollar staying bid in the coming days continues to outweigh the chances of a correction.”
“A move to 110 in DXY over the coming weeks surely cannot be excluded.”
Economists at ING expect a 50 basis points rate hike by the Reserve Bank of New Zealand (RBNZ). In their view, the market reaction will be mostly driven by the RBNZ’s assessment of the economic outlook and forward-looking language. Still, NZD/USD is set to move lower towards 0.60.
RBNZ to hike by 50 bps
“The chances of seeing anything different from another 50 bps rate hike appear quite low. A half-point increase is in line with the latest bank projections as well as consensus and market expectations.”
“A deteriorating economic outlook in New Zealand and signs of a rapidly contracting housing market both argue in favour of some kind of recalibration of the Bank’s hawkishness. It may be too early to deliver a dovish shift this month, but we see rising risks of a revision lower in the rate projections at the August meeting.”
“Expect any impact of monetary policy on NZD/USD to remain very limited, as external factors remain centre stage.”
“The pair may well test 0.60 in the near term.”
GBP/USD has fallen to a fresh year-to-date low of 1.1830. Economists at ING note that cable could slide to 1.15/14.
Sterling will be in a for a tough summer
“As a growth-sensitive currency, sterling will be in for a tough summer and cable looks set to trade down to 1.17 and possibly 1.14/15 again. We tentatively think these could again prove the lows for the year if, as we expect the USD turns by year-end.”
“UK politics mean we won’t have a working government until September, but looser fiscal policy this Autumn can help GBP.”
Here is what you need to know on Tuesday, July 12:
The US Dollar Index (DXY) continues to push higher early Tuesday after having gained more than 1% on Monday. The greenback continues to find demand as a safe haven with investors seeking refuge amid growing recession fears. US stock index futures are down between 0.8% and 1% in the European morning and the DXY trades at its highest level in nearly two decades above 108.00. ZEW Survey from Germany and business sentiment data from the US will be looked upon for fresh impetus. The 10-year US Treasury note auction is scheduled to take place at 1700 GMT later in the day. The 10-year US T-bond yield is down more than 2% on the day at 2.925%, highlighting the risk-averse market environment.
To contain the new Omicron BA4 and BA5 subvariant infections, China has announced the city of Wugang in the Henan Province has gone into lockdown. Market participants remain worried about Shanghai going into a lockdown as well with the number of daily confirmed cases rising in the city.
Meanwhile, Europe is facing heightened risks of going into an energy crisis. Speaking on Monday, German Economy Minister Robert Habeck said that it would be difficult to say whether Nord Stream 1 gas pipeline would come back online after the maintenance.
On Monday, the Federal Reserve Bank of New York's monthly Survey of Consumer Expectations showed that the US Consumers' one-year inflation expectations rose to 6.8% in June from 6.6% in May. Although the three-year inflation expectations declined to 3.6% from 3.9%, the greenback continued to outperform its rivals. Ahead of Wednesday's Consumer Price Index (CPI) data, White House Press Secretary Karine Jean-Pierre told reporters that she was expecting the CPI print to be "highly elevated."
EUR/USD slumped to its weakest level since December 2002 and was last seen trading within a touching distance of all-important parity.
GBP/USD lost more than 1% on Monday and extended its slide early Tuesday. The pair is currently trading at its lowest level in more than two years below 1.1850.
USD/JPY stays relatively quiet above 137.00 on Tuesday following Monday's impressive upsurge. The JPY manages to find demand as a safe haven and stays resilient against its rivals so far.
Gold erased its losses after having dropped to a fresh 2022 low below $1,730. Falling US Treasury bond yields seem to be helping XAU/USD find support.
Bitcoin dropped below $20,000 during the Asian trading hours and touched a daily low of $19,594 before recovering modestly. Ethereum is down more than 2% on a daily basis and closes in on $1,000.
In the opinion of FX Strategists at UOB Group Lee Sue Ann and Quek Ser Leang, USD/JPY looks poised to extend the uptrend beyond 138.00 sooner rather than later.
Key Quotes
24-hour view: “The strong surge in USD to a high of 137.75 yesterday appears to be overdone and USD is unlikely advance much further. For today, USD is more likely to trade sideways between 136.60 and 137.80.”
Next 1-3 weeks: “We turned neutral in USD last Tuesday (05 Jul, spot at 135.95) and we expected USD to trade between 134.75 and 137.00. After trading within the expected range for a few days, USD jumped to a high of 137.75 yesterday (11 Jul). The price actions have shifted the risk to the upside and USD could advance further to 138.00, as high as 138.50. The upside risk is intact as long as USD does not move below 136.00 (‘strong support’ level) within these few days.”
- USD/CAD gained traction for the second straight day and was supported by a combination of factors.
- Weaker crude oil prices undermined the loonie and extended support amid relentless USD buying.
- Aggressive Fed rate hike bets, along with recession fears, pushed the USD to a fresh 20-year high.
The USD/CAD pair attracted fresh buying near the 1.2990 area on Tuesday and turned positive for the second straight day. The pair built on its steady ascent through the early European session and climbed back closer to mid-1.3000s, or a fresh daily high in the last hour.
Fresh COVID-19 curbs in China, along with growing recession fears, raised concerns about the fuel demand outlook and weighed on crude oil prices. This, in turn, undermined the commodity-linked loonie and pushed the USD/CAD pair higher amid sustained US dollar buying.
The FOMC minutes released last week reaffirmed bets for a faster policy tightening by the Fed. In fact, policymakers emphasized the need to fight inflation even if it results in an economic slowdown. This was seen as a key factor that continued boosting the greenback.
The worsening global economic outlook led to an extended selloff in the equity markets, which further benefitted the safe-haven buck. This, to a larger extent, helped offset declining US Treasury bond yields and pushed the USD to a fresh two-decade high on Tuesday.
It would now be interesting to see if the USD/CAD pair is able to capitalize on the move or meet with a fresh supply at higher levels. Traders might refrain from placing aggressive bullish bets and prefer to move on the sidelines ahead of this week's key event/data risk.
The US consumer inflation figures are due for release on Wednesday, which will be followed by the Bank of Canada monetary policy decision. Traders will further take cues from the US Retail Sales data and the Prelim Michigan Consumer Sentiment, scheduled on Friday.
In the meantime, the broader market risk sentiment would continue to drive the USD demand amid absent relevant market moving-economic data. Apart from this oil price dynamics should provide some impetus to the USD/CAD pair and allow traders to grab short-term opportunities.
Technical levels to watch
How low can EUR/USD go? Short-term rate spreads continue to move against EUR/USD as does the risk environment. The pair could fall as low as 0.95, according to economists at ING.
Don’t look for a substantial turn higher in EUR/USD this summer
“A 10% fall in equities and a 25 bps widening in spreads this summer would put EUR/USD somewhere near 0.98.”
“A 50 bps widening in spreads, were the Fed to move more aggressively or ECB hawks to soften, would be worth 0.95.”
“Don’t look for a substantial turn higher in EUR/USD this summer, since it seems far too early for Fed hawks to back down.”
The US dollar has continued to strengthen during the Asian trading session. In the view of economists at MUFG Bank, the case for a stronger USD remains compelling.
The developments continue to favour further USD strength in the near term
“Fears over a sharper slowdown in global growth have been reinforcing the relative safe-haven appeal for the US dollar helping to lift it to multidecade highs alongside the appeal of higher US rates as the Fed sticks to plans to speed up rate hikes to combat upside inflation risks.”
“Even recent evidence of a pick-up in economic activity in China has failed to ease global growth concerns and dampen the allure of a stronger US dollar.”
“The main near-term risk to our bullish US dollar view would be the release of a much weaker than expected US CPI report tomorrow.”
The Canadian dollar has fared better than its peers throughout the year and is again somewhat of an outperformer in recent trading. Economists at Scotiabank expect the CAD to continue outperforming.
Oil prices should continue to buttress the CAD
“We expect the loonie to continue outperforming, thanks to the support of a resilient economy and a hawkish central bank.”
“Crude oil markets remain tight despite weakening demand prospects, so oil prices should continue to buttress the CAD.”
“We note strong USD selling interest above the 1.30 level through the 1.3075/85 zone that has been consistent in capping USD gains in the past few months. We expect that interest to remain a presence in the market. Technically, USD gains through 1.31 open the door for additional USD strength to the 1.33 area, however.”
It seems it is only a matter of time for the EUR to touch the parity mark against the USD. Economists at Scotiabank note that the EUR/USD pair could extend its slump into the mid-0.90s.
High energy prices and dovish ECB should to keep EUR/USD away from 1.05
“If the EU fails to sufficiently replenish gas storage ahead of winter, we could see energy rationing and a reduction in Eurozone industrial output – further to depressed household spending with high energy costs – that tilts the Eurozone into recession.”
“Developments over the next few days around odds of a NS1 shutoff will make or break a parity move that we think is increasingly likely and could continue into the mid-0.90s.”
“A return to pre-maintenance levels of gas shipments could build a buffer away from the parity mark for the EUR, but high energy prices (and remaining supply risks) and a relatively dovish ECB should still keep the EUR trading on the defensive, away from 1.05.”
- USD/RUB remains pressured around intraday low, down for the second consecutive day.
- IEA’s Birol hopes G7 plan to impose restrictions on Russian oil prices gets buy-in from several countries.
- Russia’s oil-for-ruble scheme defends RUB bulls despite the US dollar’s broad strength.
USD/RUB sellers attack 59.00 threshold during the second daily fall amid early Tuesday morning in Europe.
The Russian ruble (RUB) pair part ways from portraying the broad US dollar strength amid Russia’s strategic move on oil prices. However, global concerns surrounding the caps to restrict energy quotes from Moscow and risk-aversion woes appear to challenge the pair sellers of late.
Recently, International Energy Agency (IEA) Chief Fatih Birol said, per Reuters, “Hopes the G7 plan to impose price caps on Russian oil gets "buy-in" from several countries.” The diplomat also added that any price caps on Russian oil should include refined products.
Elsewhere, the record US inflation expectations, per the NY Fed’s survey of one-year-ahead consumer inflation expectations join fears of China’s nationwide covid lockdown, after fresh activity restrictions on Henan Province’s Wugang, appear to weigh on the market sentiment.
The risk-off mood underpins the US dollar’s safe-haven demand. That said, the US Dollar Index (DXY) refreshed its 20-year high earlier in Asia before retreating from 108.50.
It’s worth noting, however, that the cautious mood ahead of Wednesday’s US Consumer Price Index for June, expected 8.8% versus 8.6% prior, also challenge USD/RUB prices.
In addition to the US inflation numbers, the global rush towards more sanctions on Russia should also be watched carefully for short-term USD/RUB directions.
Technical analysis
The 21-DMA surrounding 57.35 holds the key to the USD/RUB downturn. Until then, buyers stay hopeful to consolidate the yearly losses from March’s high of 155.00.
The Japanese yen weakened to the mid-137s per USD. The US Consimer Price Index (CPI) report will be the main highlight tomorrow. Strong figures could propel the USD/JPY pair towards 140, economists at Scotiabank report.
Bank of Japan not expected to act on rates or its yield curve target soon
“With the BoJ not expected to act on rates or its yield curve target soon, the JPY’s performance will depend on moves in US yields and this week’s inflation data will be a key determinant of these ahead of the Fed’s decision in late-Jul. Strong data could motivate the cross toward the next key figure, 140.”
“On the flip side, a print that supports the idea of peak US inflation and vindicates the recent paring of Fed hike expectations would help the JPY strengthen through 135.”
- AUD/USD remained on the defensive near its lowest level since June 2020.
- Relentless USD buying, the risk-off mood weighed on the risk-sensitive aussie.
- Retreating US bond yields could cap the USD and lend support to the major.
The AUD/USD pair oscillated in a range through the early European session on Tuesday and consolidated its recent decline to the lowest level since June 2020.
The US dollar added to the previous day's strong gains and climbed to a fresh two-decade high amid hawkish Fed expectations. This, along with the prevalent risk-off mood, offered additional support to the safe-haven greenback and acted as a headwind for the risk-sensitive aussie.
Investors now seem convinced that the Fed would stick to its aggressive policy tightening path to curb soaring inflation. The bets were reaffirmed by the FOMC meeting minutes released last week, indicating that another 50 or 75 bps rate hike is likely at the upcoming FOMC meeting in July.
Policymakers also emphasized the need to fight inflation even if it results in an economic slowdown. This, along with the ongoing Russia-Ukraine war and a fresh COVID-19 outbreak in China, has been fueling recession fears and tempered investors' appetite for perceived riskier assets.
Furthermore, the worsening global economic outlook led to the recent decline in commodity prices. This was seen as another factor weighing on the resources-linked Australian dollar and supports prospects for an extension of the AUD/USD pair's downfall witnessed over the past month or so.
That said, the global flight to safety continued exerting downward pressure on the US Treasury bond yields and might hold back the USD bulls from placing fresh bets. This, in turn, could help limit any further losses for the AUD/USD pair ahead of this week's important economic releases.
The latest US consumer inflation figures are due to be published on Wednesday, which will be followed by the monthly Australian employment details on Thursday. Traders will further take cues from the US Retail Sales data and the Prelim Michigan Consumer Sentiment, scheduled on Friday.
In the meantime, the broader market risk sentiment, along with the US bond yields, might influence the USD price dynamics. This, in turn, should provide some impetus to the AUD/USD pair and allow traders to grab short-term opportunities amid absent relevant economic data from the US.
Technical levels to watch
Considering preliminary readings from CME Group for natural gas futures markets, open interest rose by around 3.8K contracts at the beginning of the week after two daily pullbacks in a row. In the same line, volume increased by more than 50K contracts.
Natural Gas now targets the $6.83 level
Monday’s marginal gains in prices of natural gas were accompanied by rising open interest and volume, opening the door to some consolidation ahead of extra upside in the very near term. That said, the weekly high at $6.83 per MMBtu (June 29) still emerges as the next target of note in the short-term horizon.
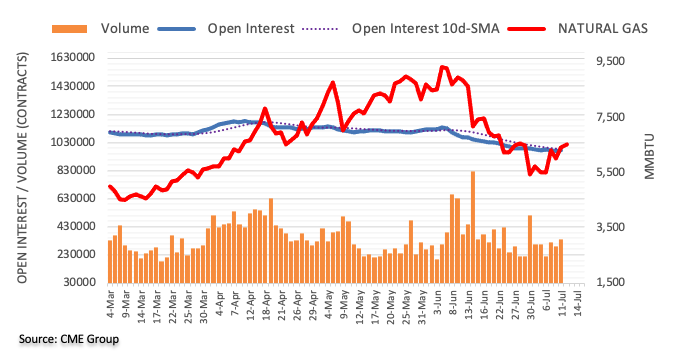
USD/CNY has gained a bit of ground in the past few sessions to around 6.73. Economists at Commerzbank expect a strong greenback and widening interest rate differential between CNY and USD rates to dominate the pair.
USD/CNY to shrug off possible rollback of tariffs
“The FX market is seemingly expecting some sort of easing in tariffs and an eventual announcement, therefore, may not have much impact.”
“The strong USD and widening interest rate differential between CNY and USD rates are likely to remain the key drivers for USD/CNY.”
FX option expiries for July 12 NY cut at 10:00 Eastern Time, via DTCC, can be found below.
- EUR/USD: EUR amounts
- 1.0200 406m
- 1.0260 1.2b
- USD/JPY: USD amounts
- 135.00 565m
- 135.55 1b
- 137.60 1.1b
- 138.00 355m
- USD/CHF: USD amounts
- 0.9300 265m
- USD/CAD: USD amounts
- 1.2400 300m
- 1.2790 670m
- 1.3000 343m
- NZD/USD: NZD amounts
- 0.6250 1.2b
- EUR/GBP: EUR amounts
- 0.8425 200m
AUD/USD broke 0.6760 support. The pair targets 0.6670 now, economists at Westpac report.
Commodities signalling that global growth outlook is deteriorating markedly
“We remain of the view that commodities are clearly signalling that the global growth outlook is deteriorating markedly as central banks raise rates super aggressively, the Fed enacts record QT, and China maintains its zero-Covid policy.”
“Our near-term target of 0.6760/65 has now given way. Our next target level is at 0.6670 and for us to start thinking about buying into this weakness, we would need to see signs China is relaxing its zero-Covid policy and/or that the Fed is set to pause on its aggressive tightening policy. Neither of those look likely at the moment.”
It is quite possible that in August Norges Bank will hike its key rate more strongly than the 25 bps signalled. However, the Norwegian krone is set to remain under pressure amid the risk of a massive energy crisis, economists at Commerzbank report.
More pronounced rate hikes in Norway possible
“The CPI data for July is likely to be decisive for the extent of the step –25 or 50 bps – as the data will be available prior to the August meeting. If the data continues to point towards continuous upside pressure on prices, Norges Bank is likely to hike by another 50 bps. This might provide support for NOK.
“However, while the uncertainty about a possible gas crisis keeps risk aversion high, the krone will continue to struggle. I, therefore, expect that downside risks will continue to dominate NOK short-term.”
EUR/USD has almost reached parity. July’s ZEW index due today is likely to illustrate to everyone just how heavily analysts have been gripped by fears for the future. The pair could slide below 1.00 following the data, economists at Commerzbank report.
It makes sense to avoid the euro for now
“We assume that the ZEW index might drop to -45. In principle not good news for the euro, and it is likely to remain under depreciation pressure while it is unclear whether Nord Stream 1 will provide gas again by the end of July.”
“As the risk of a massive energy crisis is higher than ever at present it makes sense to avoid the euro for now.”
“Parity in EUR/USD is so close that the ZEW index will be enough of a trigger to test it this morning. Or a renewed slide in the European stock markets. That it will come is clear to me. I fear that once this dam is broken, the euro could settle below that level for the time being, until we (hopefully) know at the end of next week whether the gas is flowing again.”
- GBP/JPY extends the week-start pullback amid risk-aversion.
- UK’s political leaders step forward for President’s chair after Boris Johnson’s departure.
- Treasury yields remain pressured, portray recession fears as inflation expectations soar.
- The second round of BOE Governor Bailey, risk catalysts will be important to watch for fresh impulse.
GBP/JPY holds lower ground near the intraday bottom of 162.90 heading into Tuesday’s London open. In doing so, the cross-currency pair bears the burden of the risk-aversion wave and the UK’s political crisis, not to forget the concerns surrounding the British economic slowdown.
That said, the US Treasury yields flash recession fears as yield curves of the 10-year and 2-year Treasury bonds stay inverted, in favor of short-term maturity. Behind the move could be the record US inflation expectations, per the NY Fed’s survey of one-year-ahead consumer inflation expectations. Additionally, fears of China’s nationwide covid lockdowns in China, after fresh activity restrictions on Henan Province’s Wugang, also exert downside pressure on the market sentiment and the GBP/JPY prices.
At home, multiple key British diplomats ranging from ex-Chancellor Rishi Sunak to Foreign Secretary Liz Truss, not to forget present UK Finance Minister Nadhim Zahawi, are in the race to become the British President after sacking Boris Johnson. While Brexit is the key aspect to favor the candidature, tax cuts are being heard as the promise to win the favor.
Elsewhere, British shoppers cut back on spending for the third month in a row and sales volumes fell by the most since they were hit hard by the COVID-19 pandemic as surging inflation squeezed the economy, an industry survey showed on Tuesday per Reuters.
It’s worth mentioning that Bank of England (BOE) Governor Andrew Bailey said, per Reuters, "UK is facing a very big real income shock." The BOE Boss is up for the second round of the testimony on Tuesday and can propel the GBP/JPY moves.
Even so, the BOE’s hawkish bias contrasts with the Bank of Japan’s (BOJ) easy money policies to hint at the central bank divergence and keep the pair buyers hopeful. However, political and Brexit fears in the UK trigger a short-term pullback.
Technical analysis
GBP/JPY reverses from a three-week-old resistance line, at 163.60 by the press time, which in turn precedes the 21-DMA level surrounding 164.50 to restrict the short-term pair’s the upside. That said, bears need validation from the 100-DMA, close to 161.10 at the latest, to retake control.
The British pound has weakened in the past month as mounting economic pressures are furrowing the outlook. Economists at the National Bank of Canada expect the GBP to remain capped in the near-term.
Political shuffle
“The British economy is facing similar challenges as the rest of Europe as inflation runs rampant.”
“While the bank of England appears set to continue restricting monetary policy to tame inflation and avoid further depreciation of the currency, challenges arise from other spheres.”
“In somewhat of a historic move, Prime Minister Boris Johnson resigned from his role following a spate of abandonment from party members. While his dismissal will usher in new management, it is to be seen how government policy may differ from the avid Brexiteer.”
“We expect the pound to remain relatively contained in the near-term as growth likely moderated.”
Gold Price risks a minor pullback amid oversold conditions. As FXStreet’s Dhwani Mehta notes, the yellow metal awaits Tuesday’s closing for bear flag confirmation.
XAUUSD remains oversold, focus on Tuesday’s close
“Bears need a daily closing below the rising trendline support of $1,733 to validate the bear flag. If the bearish continuation pattern materializes, a test of the $1,700 mark remains inevitable.”
“Gold sellers will need acceptance below the $1,722 demand area to unleash the additional downside.”
“The 14-day Relative Strength Index (RSI) is inching lower within the oversold territory, suggesting a brief rebound could be in the offing.”
“A sustained break above the daily highs of $1,745 will revive the bullish interests, with sight on the $1,750 psychological level. The further upside could challenge the rising trendline resistance at $1,754, which if scaled could kick off a bullish reversal.”
Following the much-awaited meeting with US Treasury Secretary Janet Yellen on Tuesday, Japanese Finance Minister Shunichi Suzuki said that he told his US counterpart that “we are concerned about rapid yen weakening recently.”
Further comments
Told Yellen we are watching currency market with a sense of urgency.
Told Yellen excess volatility, disorderly moves can hurt economic stability.
Meanwhile, a joint statement released after their meeting showed that the two diplomats agree to 'further strengthen' bilateral ties.
Additional takeaways
Yellen, Suzuki committed to address higher food, energy and commodity prices and growing food insecurity exacerbated by Ukraine war.
US, Japan say Russia’s invasion of Ukraine has raised exchange rate volatility, which can have adverse implications for economic and financial stability.
US, Japan agree to continue consulting on foreign exchange markets, cooperate 'as appropriate' on currency issues, in line with G7, g20 commitments.
US, Japan welcome G7 efforts to continue exploring ways to curb rising energy prices, including feasibility of price caps 'where appropriate'.
US., Japan emphasize need for coordination to ensure fair burden sharing among all creditors for vulnerable middle-income countries, notably Sri Lanka.
US., Japan urge China and all relevant creditors to contribute constructively to debt treatments for low-income countries with debt issues.
Market reaction
USD/JPY is trading near-daily highs of 137.51 following the conclusion of the US-Japan bilateral meeting. The spot has erased early losses and now trades almost unchanged on the day.
USD/JPY is trading near-daily highs of 137.51 following the conclusion of the US-Japan bilateral meeting. The spot has erased early losses and now trades almost unchanged on the day.
Extra decline in NZD/USD could revisit the 0.6050 area in the next weeks, according to FX Strategists at UOB Group Lee Sue Ann and Quek Ser Leang.
Key Quotes
24-hour view: “Yesterday, NZD dropped sharply to 0.6098 during London hours before trading sideways. Downward momentum remains strong and the weakness in NZD could extend to 0.6080 first before stabilization is likely. The next support at 0.6050 is unlikely to come under threat. Resistance is at 0.6135 followed by 0.6160.”
Next 1-3 weeks: “We have held a negative NZD view since late last month. In our latest narrative from last Friday (08 Jul, spot at 0.6180), we indicated that downward momentum has waned and the odds for NZD to weaken to 0.6100 have diminished. We did not quite expect the sharp drop yesterday (11 Jul) as NZD plummeted to a low of 0.6098. The price actions suggest the weak phase is still intact and NZD could weaken further to 0.6050. On the upside, a break of 0.6190 (‘strong resistance’ level previously at 0.6230) would indicate that NZD is unlikely to weaken further.”
The kiwi is weaker this morning, struggling in the face of an unstoppable US dollar. As economists at ANZ bank note, it is hard to stand in front of the USD train.
Fed Funds rate on a par with NZ’s OCR by month-end
“Hard landing fears are building in the US, as they are here (the US 2yr-10yr curve became more inverted overnight), but the US has an inflation problem amid a still very tight labour market, and that’s likely to see the Fed Funds rate on a par with NZ’s OCR by month-end.”
“We expect the RBNZ to be hawkish tomorrow (they can’t afford not to be), but in a world of dollar dominance that may not do a lot for the beleaguered Kiwi, especially amid NZ recession fears.”
“Support 0.5940/0.6100 Resistance 0.6395/0.6575.”
International Energy Agency (IEA) Chief Fatih Birol said on Tuesday that he hopes the G7 plan to impose price caps on Russian oil gets "buy-in" from several countries.
Additional comments
Any price caps on Russian oil should include refined products.
IEA working on plan to coordinate response to critical minerals supply disruptions.
Related reads
- Crude Oil Futures: A deeper drop appears out of favour
- Senior US Treasury official: Failure of oil price cap on Russian oil could bump up prices to $140
CME Group’s flash data for crude oil futures markets noted traders trimmed their open interest positions by nearly 1.5K contracts on Monday. On the other hand, volume reversed three consecutive daily pullbacks and went up by around 35.5K contracts.
WTI faces extra gains above $105.00
Monday’s daily retracement in prices of the WTI was on the back of diminishing open interest. Against that, further losses seem not favoured for the time being, leaving the next target for the commodity at recent highs just above $105.00 before the weekly peak at $114.00 (June 29).
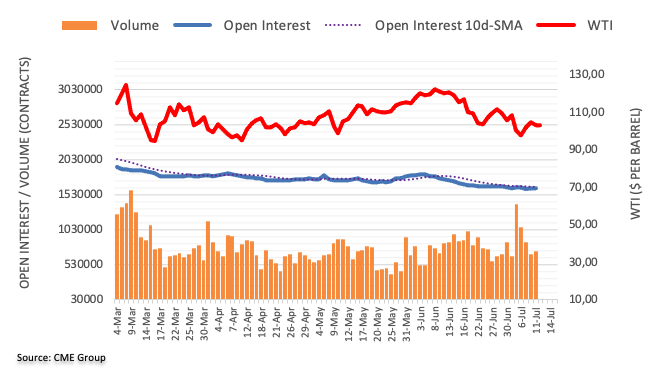
- USD/CHF refreshes monthly top during eight-day uptrend, inside bearish chart pattern of late.
- Overbought RSI, wedge tease bears but 200-SMA could challenge corrective pullback.
- Bulls have a bumpy road to the north unless crossing 0.9875.
USD/CHF remains firmer for the eighth consecutive day as it renews the monthly top around 0.9845-50 heading into Tuesday’s European session.
In doing so, the Swiss currency (CHF) pair pokes the 61.8% Fibonacci retracement (Fibo.) of the June 15-29 downturn.
That said, the USD/CHF pair remains inside a weekly rising wedge bearish chart pattern as the overbought RSI (14) probes the bulls.
Hence, the 61.8% gold ratio surrounding 0.9840 precedes the stated wedge’s upper line, close to 0.9865, to restrict the short-term USD/CHF upside.
Also acting as an upside filter is the monthly horizontal resistance area surrounding 0.9875.
In a case where the USD/CHF rises past 0.9875, the odds of witnessing a run-up towards June’s high surrounding 1.0050 can’t be ruled out.
On the contrary, pullback moves need validation from the wedge’s support line, close to 0.9800 at the latest, to lure the pair bears.
Even so, the 200-SMA level surrounding 0.9688 acts as the last defense of USD/CHF buyers.
USD/CHF: Four-hour chart

Trend: Limited upside expected
- EUR/JPY is attempting to recapture the intraday high at 138.07 as the focus shifts to Germany HICP.
- Advancing odds of an ECB-BOJ policy divergence may keep the yen bulls on the tenterhooks.
- BOJ Kuroda is sticking to its ultra-loose monetary policy.
The EUR/JPY pair has crossed the interim hurdle of 137.60 after a confident rebound from the intraday low at 137.28. On a broader note, the cross is trading back and forth in a tad wider range of 136.86-139.14 from the past three trading sessions. The asset is expected to remain sideways as investors are awaiting the release of the Germany Harmonized Index of Consumer Prices (HICP), which are due on Wednesday.
A preliminary estimate for the Germany HICP is 8.2%, similar to the prior release. The inflation rate is soaring in eurozone, thanks to the costly gas prices due to the prohibition of oil imports from Russia. It is worth noting that the European Central Bank (ECB) has not elevated its interest rates yet. Although the conclusion of the Asset Purchase Program (APP) has been announced, the rate hike has not featured like the other Western leaders.
This time, the odds of a rate hike announcement by the ECB are higher as any further delay in interest rate elevation may turn the runaway inflation into the galloping one.
On the Tokyo front, the Bank of Japan (BOJ) is dedicated to losing monetary policy further. The commentary from BOJ Governor Haruhiko Kuroda on maintaining the ultra-loose monetary policy has strengthened the odds of ECB-BOJ policy divergence.
EUR/USD has slipped from 1.14 at the end of 2021 to parity. The picture for the European economy is far from rosy and it may already be in the throes of a technical recession. Thus, economists at the National Bank of Canada expect the pair to remain under pressure.
Parity and recession
“The next half of 2022 is unlikely to foster conditions for euro appreciation as the European economy could be in a technical recession.”
“We expect the euro to remain low in the near term and will require improvements for energy prices and supply to catch a bid.”
- Gold stays pressured at yearly low, fades Asian session rebound.
- DXY refreshes 20-year high amid traders’ rush to risk-safety.
- Chatters surrounding recession could entertain traders ahead of Wednesday’s US CPI.
Gold Price (XAU/USD) remains depressed at the lowest levels since September 2021 as risk-aversion favors US dollar bulls heading into Tuesday’s European session. That said, the yellow metal lounges to $1,728 by the press time.
Growing fears of an economic slowdown could be cited as the key catalyst behind the XAU/USD’s latest weakness. Also weighing on the metal prices could be fears of higher inflation and central bankers’ aggression led by the US Federal Reserve (Fed).
Recently, an impending halt in Russian gas supplies through Nordstorm 1 pipeline joins record US inflation expectations, per the NY Fed’s survey of one-year-ahead consumer inflation expectations, to weigh on the gold prices. On the same line could be looming nationwide covid lockdowns in China after fresh activity restrictions on Henan Province’s Wugang.
It should be noted that comments from White House Press Secretary Karine Jean-Pierre, suggesting expectations of highly elevated Consumer Price Index (CPI) data join hawkish Fedspeak to drown the XAU/USD prices. At the latest, Atlanta Fed President Raphael Bostic said that recent inflation data has not been as encouraging as I would have liked, per Reuters.
Amid these plays, US equities remained depressed and the US Treasury yields kept flashing recession fears by inversion of the 10-year and 2-year Treasury yields curves. Further, Asian stocks and S&P 500 Futures also remain pressured at the latest.
Moving on, chatters surrounding recession and inflation will be important to track ahead of Wednesday’s US Consumer Price Index for June, expected 8.8% versus 8.6% prior.
Technical analysis
Gold stays pressured inside a monthly bearish megaphone pattern suggesting a further widening of the downtrend, between $1,800 and $1,716 by the press time.
Considering the oversold RSI (14), the odds of witnessing a corrective pullback towards the weekly resistance line and 50-SMA, respectively around $1,737 and $1,770, can’t be ruled out. However, the previous support line from mid-June, close to $1,775 at the latest, could challenge the XAU/USD bulls afterward.
On the contrary, the $1,700 threshold and late 2021 bottom around $1,677 could lure gold sellers in case Gold Price drops below $1,716 key support.
Gold: Four-hour chart
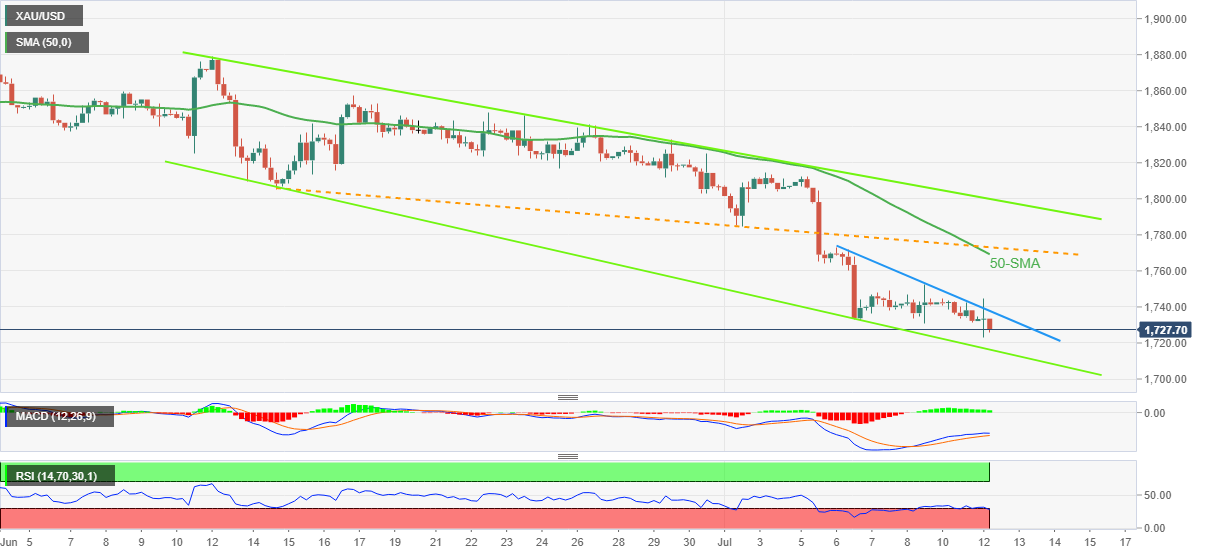
Trend: Bearish
Extra downside momentum could drag GBP/USD to a test of 1.1800 in the next weeks, comment FX Strategists at UOB Group Lee Sue Ann and Quek Ser Leang.
Key Quotes
24-hour view: “Yesterday, GBP dropped below last week’s low at 1.1877 (low of 1.1868) before rebounding. Downward momentum has improved, albeit not by much. While GBP could decline, any weakness could be limited to a test of 1.1850. The major support at 1.1800 is unlikely to come under threat. Resistance is at 1.1940 followed by 1.1970.”
Next 1-3 weeks: “In our latest narrative from last Friday (08 Jul, spot at 1.2025), we held the view that the recent GBP weakness has run its course and we expected GBP to consolidate and trade between 1.1900 and 1.2165. We did not expect the sharp drop to 1.1868 yesterday. Shorter-term downward momentum has improved, albeit not by much. From here, GBP is likely to trade with a downward bias towards 1.1800. At this stage, the odds for a sustained decline below 1.1800 are not high. Overall, only a break of 1.2010 (‘strong resistance’ level) would indicate that GBP is not ready to decline to 1.1800.”
Open interest in gold futures markets went up for the second session in a row on Monday, this time by around 17.8K contracts according to advanced prints from CME Group. Volume, instead, resumed the downside and shrank by around 1.2K contracts.
Gold: Next on the downside comes $1,700
Gold started the week on the defensive amidst rising open interest, which is supportive of extra decline in the very near term. The breach of the September 2021 low around $1,720 exposes a potential retracement to the $1,700 region.
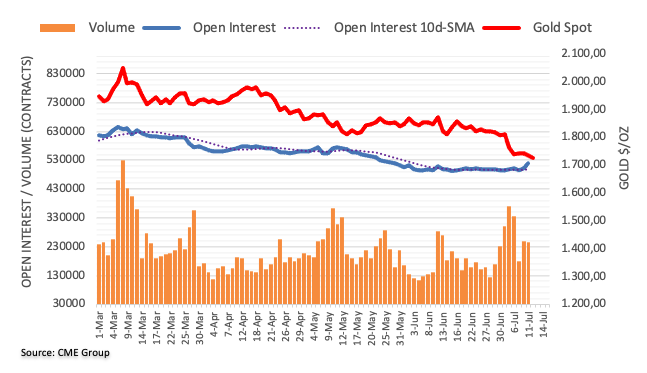
- The greenback bulls are hopeful on Bullish Flag formation.
- Advancing 50- and 200-EMAs add to the upside filters.
- A (60.00-80.00) bullish range shift by the RSI (14) signals more upside ahead.
The USD/CNH pair is marching sharply higher and has printed an intraday high of 6.7483. The major is expected to form a bullish Double Distribution Day. The asset moved higher after an inventory distribution phase in a 6.7206-6.7267 range and is expected to form one more inventory distribution on the elevated levels.
A Bullish Flag formation on a four-hour scale is underpinning the greenback bulls. The formation of a Bullish Flag denotes a consolidation phase after a vertical upside move. The north-side sheer move is been recorded from May’s low at 75.98. The consolidation phase of a Bullish Flag indicates an initiative buying structure in which the buyers initiate longs after the establishment of a bullish bias. It is worth noting that the asset is attempting a breakout of the above-mentioned chart pattern, at the press time.
The asset is holding above the 50-period Exponential Moving Average (EMA) at 6.7085, which confirms a short-term bullish momentum. While the 200-EMA at 6.6947 is advancing swiftly, which warrants that the longer trend is intact.
Also, the Relative Strength Index (RSI) (14) is oscillating in a bullish range of 60.00-80.00, which signals a continuation of upside momentum.
Should the asset oversteps June 14 high at 6.7855, the greenback bulls will drive the asset towards May 13 high at 6.8384, followed by the round-level resistance of 6.9000.
On the flip side, the greenback bulls could lose their control if the asset drops below June 15 low at 6.6668. The occurrence of the same will drag the asset towards June 3 low at 6.6138, followed by April 26 low at 6.5450.
USD/CNH four-hour chart
-637931999691496767.png)
FX Strategists at UOB Group Lee Sue Ann and Quek Ser Leang suggest EUR/USD could slip back below the parity level in the near term.
Key Quotes
24-hour view: “EUR plummeted to 1.0032 yesterday before closing on a weak note at 1.0039 (-1.41%). Strong downward momentum suggests EUR could break the critical support at 1.0000. That said, in view of the deeply oversold conditions, EUR may not be able to maintain a foothold below this level (next support is at 0.9960). Resistance is at 1.0095 followed by 1.0130.”
Next 1-3 weeks: “We have held a negative EUR view since late last month. In our latest narrative from last Friday (08 Jul, spot at 1.0185), we highlighted that further EUR weakness still appears likely even though oversold conditions could slow the pace of any further decline. We indicated, ‘the next support below 1.0100 is at 1.0000’. EUR subsequently dropped below 1.0100, rebounded and yesterday (11 Jul), it plunged to a low of 1.0032. Solid downward momentum suggests a break of 1.0000 would not be surprising. The next levels to focus on are at 0.9960 and 0.9920. On the upside, a break of 1.0180 (‘strong resistance’ level previously at 1.0270) would indicate that the weakness in EUR has stabilized.”
- USD/TRY struggles for clear direction after rising for eight consecutive days.
- Fitch cuts Turkiye’s debt rating to "B" from "B+" citing inflation, economic concerns.
- US inflation expectations fuel the latest round of advances, US CPI, risk catalysts will be important moving forward.
USD/TRY grinds higher around 17.35 as bulls seek fresh clues during early Tuesday morning in Europe. Even so, pessimism surrounding Turkiye’s economic outlook keeps the pair buyers hopeful.
TRY slipped 0.4% after rating agency Fitch downgraded the country's debt rating to "B" from "B+" on Friday, citing rising inflation and economic concerns, per Reuters.
It’s worth noting Turkish Consumer Price Index (CPI) jumped to a record high of around 39.0% during June. Even so, Turkish President Recep Tayyip Erdogan insists on lower rates and rather pushes the central bank towards qualitative measures which have been ineffective of late.
On the other hand, a record high print of the US one-year inflation expectations, as per the NY Fed’s survey of one-year-ahead consumer inflation expectations, join chatters surrounding economic slowdown to fuel the USD/TRY prices. That said, the NY Fed’s inflation precursor jumped to 6.8% in June, versus 6.6% prior.
Elsewhere, talks between Russia and Turkiye appear to have solved the riddle surrounding grain exports, which in turn may help ease some pressure off the markets. However, nothing concrete is out on the wires and hence the USD/TRY bulls keep reins.
That said, the pair traders should watch for risk catalysts for fresh impulse ahead of Wednesday’s US Consumer Price Index (CPI) for June, expected 8.8% versus 8.6% prior.
Technical analysis
Despite the USD/TRY pair’s latest inaction around a two-week top, the quote’s daily closing above a downward sloping resistance line from June 09, now support around 17.33, keeps the bulls hopeful to refresh yearly low, around 17.50 at the latest.
- USD/INR prints four-day uptrend to refresh an all-time high.
- Reuters poll hints at further pain for Indian economy, RBI as inflation is likely to remain stronger for longer.
- US dollar cheers risk-off mood amid strong inflation expectations ahead of Wednesday’s CPI.
- Headlines concerning China, Europe also weigh on the market sentiment.
USD/INR takes the bids to refresh its all-time high at 79.58 during the four-day uptrend as US dollar bulls keep the reins amid fears of recession and inflation. Also contributing to the Indian rupee (INR) pair’s run-up during Tuesday’s Asian session are the downbeat market forecasts over the nation’s economic prospects.
India's inflation will hold above the top of the central bank's tolerance band for at least the rest of 2022, longer than previously thought, making several more interest rate hikes in coming months all but inevitable, a Reuters poll showed.
The survey also forecasts India GDP growth at 7.2% in the Financial Year (FY) 2023, 6.5% in FY2024 and 6.5% in FY2025 (versus 7.5%, 6.5% and 6.5% respective expectations published in April poll).
On a broader front, a record-high print of the US one-year inflation expectations, as per the NY Fed’s survey of one-year-ahead consumer inflation expectations, join chatters surrounding recession to propel the USD/INR prices. That said, the NY Fed’s inflation precursor jumped to 6.8% in June, versus 6.6% prior.
Also contributing to the market’s pessimism are the hopes of the Fed’s aggression, previously backed by the latest US jobs report. As per Friday’s release, the US Nonfarm Payrolls (NFP) rose by 372K for June, versus the expected 268K and downward revised 384K prior while the Unemployment Rate remained unchanged at 3.6%.
Further, Shanghai’s first coronavirus Omicron sub-variant BA-5 case escalated virus woes and public outrage after the dragon nation failed to sustain the unlock activities. Moreover, strong inflation data from the Asian major and doubts over Beijing’s GDP goal, as well as on the stimulus’ ability to renew optimism, also spoil the mood and keep USD/INR sellers hopeful. It should be noted that the likely gas storage for Eurozone and the anticipated economic slowdown in the old continent also fuel the Indian rupee pair.
Amid these plays, US stock futures and Asia-Pacific shares remain pressured while the US Treasury yields keep flashing recession woes by the press time.
Moving on, risk catalysts could entertain traders ahead of Wednesday’s US Consumer Price Index for June, expected 8.8% versus 8.6% prior.
Technical analysis
Although overbought RSI (14) tests USD/INR buyers, the quote is all set to poke a fortnight-old resistance line near 79.85 unless declining below an upward sloping trend line from May 05, close to 78.80 by the press time.
- GBP/USD is likely to display more losses below 1.1860 as odds of a higher US Inflation have advanced.
- The scenario of lower earnings along with real income shock is no less than a nightmare for the households.
- The preliminary estimate for the annual CPI is 8.8% and for core CPI is 5.7%.
The GBP/USD pair is hovering around the fresh two-year low printed in the Asian session at 1.1860. A fresh round of selling looks around the corner as investors are underpinning the greenback in the entire FX gamut. Rising anxiety over the release of the US Inflation which is due on Wednesday has brought extreme selling pressure for the risk-perceived currencies.
The fact is, investors are expecting the US inflation rate at a whopping figure of 8.8%, higher than the prior print of 8.6%. However, the core Consumer Price Index (CPI) that doesn’t inculcate food and energy bills is expected to slip to 5.7% from the former release of 6%. One could do simple math and could understand that the volatility in the prices of oil and food products is so huge that despite a lower consensus for the core CPI, the plain-vanilla CPI is aiming higher.
A higher plain-vanilla CPI will hurt the paychecks of the households in the US significantly. Last week’s Average Hourly Earnings were lower than the former figures. The scenario of lower earnings along with real income shock is no less than a nightmare for the households.
On the UK front, investors have shifted their focus on the economic data, which will release on Wednesday. The Gross Domestic Product (GDP) is seen at 0% vs. -0.3% printed earlier. While the annual Manufacturing Production may slip to 0.3% from the former release of 0.5%. Apart from that, the political jitters are escalating as more officials are presenting their leadership proposals for the leader of the Conservative Party.
Amid the renewed covid flare-ups across China, thanks to the Omicron BA4 and BA5 subvariants, the country has announced a lockdown on Wugang in Henan Province.
The city in one of China’s steel hubs entered lockdown for three days after a single covid infection was detected there.
developing story ....
- Steel prints three-day downtrend to refresh yearly bottom.
- Chatters surrounding inflation and recession underpin market’s rush towards risk-safety.
- Shanghai’s covid update, doubts over China stimulus keep metal traders worried.
Steel Price remains on the back foot for the third consecutive day as sellers attack the $600 threshold, near 4010 Chinese yuan per tonne at the latest, on Shanghai Futures Exchange (SFE) during Tuesday’s Asian session.
That said, prices of steel rebar on SFE weren’t the only metal indicator that portrayed the market’s pessimism as steel prices on the London Metal Exchange (LME) and COMEX also hint at dark days for the industrial metal.
The escalating fears of economic slowdown weigh on the industrial metal prices as traders rush for risk-safety. A record-high print of the US one-year inflation expectations, as per the NY Fed’s survey of one-year-ahead consumer inflation expectations, join chatters surrounding recession to drown the Steel Price.
On the same line could be the hopes of a further increase in inflation and hawkish Fedspeak. Considering the data, White House Press Secretary Karine Jean-Pierre told reporters that she expects new Consumer Price Index (CPI) data to be highly elevated. Further, Atlanta Fed President Raphael Bostic said that recent inflation data has not been as encouraging as I would have liked, per Reuters.
Elsewhere, Shanghai’s first coronavirus Omicron sub-variant BA-5 case escalated virus woes and public outrage after the dragon nation failed to sustain the unlock activities. Moreover, strong inflation data from the Asian major and doubts over Beijing’s GDP goal, as well as on the stimulus’ ability to renew optimism, also weigh on the steel prices due to China’s status as the world’s biggest metal consumer.
On the positive side, India announced a bit of relaxation of duties on steel products and the same appears to limit the metal’s plunge, at least for now.
However, looming woes of economic contraction and central bankers’ aggression keep the steel bears hopeful with eyes on Wednesday’s Consumer Price Index (CPI) for June, expected 8.8% versus 8.6% prior.
- Asian equities have slipped strongly as lockdown worries in China have progressed.
- A back-to-back resurgence of Covid-19 in China has worsened the supply chain mechanism.
- The DXY has printed a fresh 19-year high of 108.47 as investors are focusing on US inflation.
Markets in the Asian domain are declining swiftly as escalating lockdown worries in the Chinese economy on the resurgence of Covid-19 have spooked the market sentiment. A back-to-back resurgence of the coronavirus in China has dampened the supply chain mechanism. Also, the accelerating fears of lockdown curbs to contain the pandemic are affecting the corporate sector in China to invest without hesitation.
At the press time, Japan’s Nikkei225 tumbled 1.85%, China A50 surrendered 1.43%, Hang Seng dropped 1.46%, and Nifty50 eased 0.55%.
The US dollar index (DXY) has printed a fresh 19-year high of 108.47 as investors are channelizing their funds into the safe haven on expectations of a higher inflation rate. The catalyst is seen at 8.8%, higher than the former release of 8.6%. This is strengthening the case for a bumper rate hike announcement by the Federal Reserve (Fed). The central bank announced a rate hike by 75 basis points (bps) in June and a similar kind of announcement is expected in July monetary policy.
On the oil front, soaring lockdown worries have pushed the oil prices below the psychological support of $100.00. It is worth noting that China is the largest importer of oil in the world and expectations of a slump in the demand for oil in the largest oil importing country are sufficient to drag the oil prices lower. Apart from that, a higher inflation rate in the US economy will compel the Fed to hike rates significantly, which will eventually trigger recession fears.
- USD/JPY snaps six-day uptrend as it retreats from 24-year high.
- Bearish MACD signals, nearly overbought RSI favor corrective pullback.
- Bulls need validation from 137.50 to aim for mid-1991 peak.
- Five-week-long ascending trend line, 20-DMA restrict immediate downside.
USD/JPY pares recent gains at the highest levels since 1998, marked the previous day, as intraday sellers flirt with 137.00 during Tuesday’s Asian session. In doing so, the quote prints the first daily loss in seven while retreating from an upward sloping resistance line from late June.
The yen pair’s latest pullback also gains support from the nearly overbought RSI (14) and bearish MACD signals.
However, a five-week-old support line near 136.10 precedes the 136.00 threshold to restrict the immediate USD/JPY downside. Also acting as short-term support is the 20-DMA, around 135.50 by the press time.
It’s worth noting that the quote’s downside past 135.50 could drag the pair towards the mid-June low of 131.50.
Alternatively, an upside break of the nearby resistance line, at 137.50, will amplify the bullish bias.
In that case, the 140.00 psychological magnet and the mid-1991 peak of 141.94 will be in the spotlight.
Overall, USD/JPY remains in the bullish trajectory but a corrective pullback can’t be ruled out.
USD/JPY: Daily chart
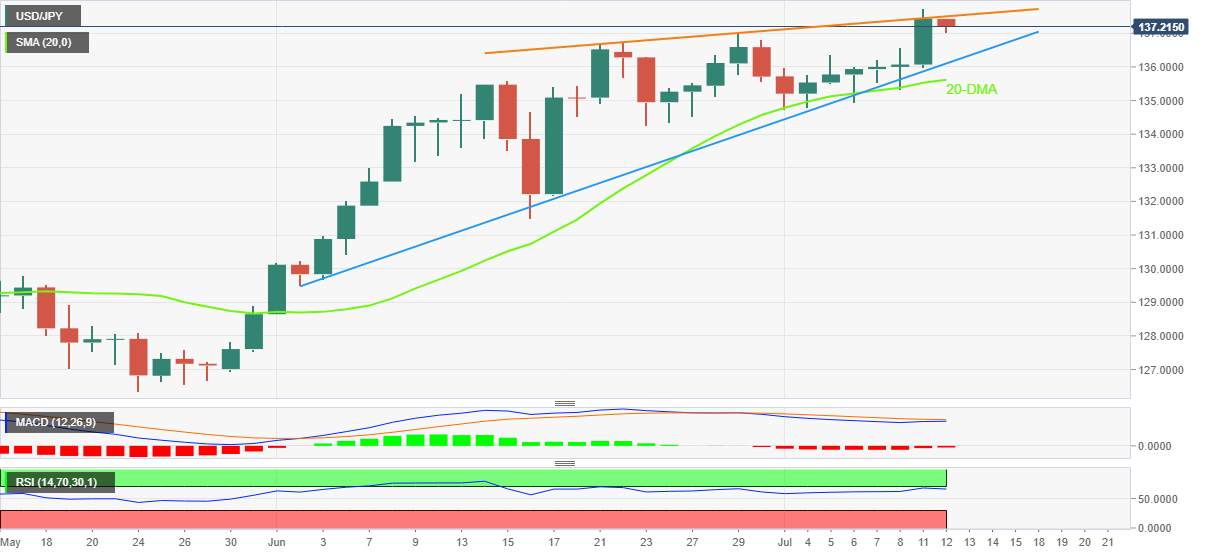
Trend: Pullback expected
- AUD/USD remains pressured around multi-month low amid sour sentiment, mixed data.
- Aussie NAB Sentiment data arrived mixed for June, economic slowdown woes prevail amid record-high US inflation expectations.
- Risk catalysts are the key to intermediate directions ahead of Aussie employment.
AUD/USD fades bounce off intraday low as sour sentiment weighs on the risk-barometer pair during Tuesday’s Asian session. That said, the quote drops to 0.6725 at the latest as bears approach the two-year low marked the previous day around 0.6700.
In addition to the risk-off mood, mixed sentiment data from Australia and caution ahead of Thursday’s Aussie employment numbers also exert downside pressure on the AUD/USD prices of late.
Talking about the data, National Australia Bank’s (NAB) Business Conditions and Business Confidence figures for June failed to impress AUD/USD buyers. That said, the Business Conditions rose to 13, versus 9 expected and prior 16, whereas the Business Confidence dropped to 1 from 8 expected and 6 previous.
On a major front, a record high print of the US one-year inflation expectations, as per the NY Fed’s survey of one-year-ahead consumer inflation expectations, join chatters surrounding economic slowdown to weigh on the AUD/USD prices. That said, the NY Fed’s inflation precursor jumped to 6.8% in June, versus 6.6% prior.
Also contributing to the market’s pessimism are the hopes of the Fed’s aggression, previously backed by the latest US jobs report. As per Friday’s release, the US Nonfarm Payrolls (NFP) rose by 372K for June, versus expected 268K and downward revised 384K prior while the Unemployment Rate remained unchanged at 3.6%.
Considering the data, White House Press Secretary Karine Jean-Pierre told reporters that she expects new Consumer Price Index (CPI) data to be highly elevated. Further, Atlanta Fed President Raphael Bostic said that recent inflation data has not been as encouraging as I would have liked, per Reuters.
It’s worth noting that Shanghai’s first coronavirus Omicron sub-variant BA-5 case escalated virus woes and public outrage after the dragon nation failed to sustain the unlock activities. Moreover, strong inflation data from the Asian major and doubts over Beijing’s GDP goal, as well as on the stimulus’ ability to renew optimism, also spoil the mood and keep AUD/USD sellers hopeful.
While portraying the mood, US equities remained depressed and the US Treasury yields kept flashing recession fears by inversion of the 10-year and 2-year Treasury yields curves. Further, Asian stocks and S&P 500 Futures also remain pressured at the latest.
Given the lack of major data up for publication on Tuesday, AUD/USD traders keep their eyes on the risk catalysts for fresh impulse. However, major attention will be given to Thursday’s Australia jobs report for June as RBA hawks appear running out of steam of late.
Technical analysis
A one-month-old bearish channel restricts AUD/USD moves between 0.6710 and 0.6890. That said, the oversold RSI conditions challenge sellers targeting March 2020 peak surrounding 0.6685.
- Gold price has displayed wild moves after surrendering the critical support of $1,732.27.
- The DXY has not displayed reversal signs and aims higher ahead of US Inflation.
- The US Retail Sales are seen meaningfully higher at 0.8% than the prior print of -0.3%.
Gold price (XAU/USD) is displaying wild swings in the Asian session. The precious metal has gyrated in a tad wider range of $1,723.27-1,744.34 in the last two hours of the trading session. No wonder, the volatile move could be a make or break for the asset. Considering the move more precisely, this seems to be a responsive buying action, which takes place when the market participants find the asset a value bet and has soaked entire offers without much effort.
Meanwhile, the US dollar index (DXY) has faced profit-booking after printing a fresh 19-year high at 108.47. The DXY has delivered a stellar performance on expectations of a higher release of the inflation rate. A preliminary estimate for the US Consumer Price Index (CPI) is 8.8%, higher than the prior release of 8.6%. A higher than or within expectation release of the inflation rate will compel the Federal Reserve (Fed) to tighten its policy further and raise interest rates to 2.25-2.50%.
Apart from the US Inflation, US Retail Sales also hold significant importance, which will release on Friday. The economic data is seen meaningfully higher at 0.8% than the prior print of -0.3%.
Gold technical analysis
On an intraday scale, the gold prices have witnessed a V-shape recovery after hitting a low of. This V-shape recovery indicates a responsive buying action and is followed by a pullback move. The precious metal has reclaimed the crucial support placed from the previous week’s low at $1,732.27. The bright metal has also attacked the 200-EMA at $1,740.00, however, it failed to sustain above the same. Meanwhile, the Relative Strength Index (RSI) (14) has returned to the 40.00-60.00 range.
Gold intraday chart
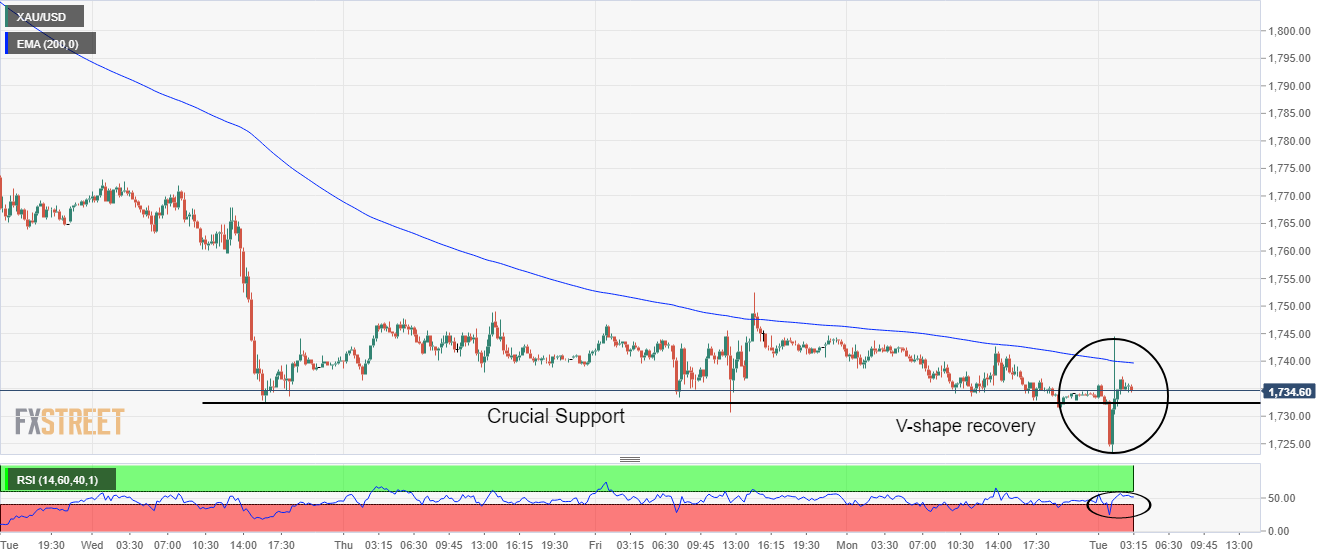
- EUR/USD has displayed a mild recovery after hitting a low near 1.0000.
- Soaring inflation consensus has underpinned the risk-off impulse.
- The outcome of the Eurogroup meeting will be of utmost importance.
The EUR/USD pair has picked bids after hitting a low much closer to the psychological support of 1.0000 in the Asian session. Earlier, the asset slipped after the downside break of the consolidation movement formed in a narrow range of 1.0034-1.0055 in early Tokyo. The mild corrective doesn’t seem a confident one, therefore the downside looks possible in case of violation of the 1.000 magical figure.
The greenback is performing stronger in the FX domain as the higher consensus for US inflation has accelerated the odds of a consecutive 75 basis points (bps) rate hike by the Federal Reserve (Fed). Considering the market consensus, the inflation rate is expected to climb to 8.6%. This has trimmed the risk appetite of investors.
The catalyst that is creating havoc for the Fed is that the price pressures are not cooling-off despite the vigorous deployment of policy tightening measures. The central bank has already accelerated the inflation rate to 1.50-1.75% in the past three monetary policy meetings along with a quick balance sheet reduction program.
On the eurozone front, investors are awaiting the minutes from the ongoing Eurogroup meeting. As expected, the discussions will be on fetching oil for catering the required demand, more sanctions on Russia, Brexit matters, and a higher Harmonized Index of Consumer Prices (HICP) rate. A meaningful decision on the matters will bring substantial volatility to the asset. This week, the release of the Germany HICP will be keenly watched. As per the market consensus, the inflation rate is seen stable at 8.2%.
Japan Finance Minister Shunichi Suzuki is out on wires now, via Reuters, expressing concern about the falling yen, noting that it has recently been rapid.
Additional quotes
Will monitor FX closely with a strong sense of urgency.
Will take appropriate measures, if necessary, on FX.
Closely communicating with other countries FX authorities.
Meanwhile, Japan's Chief Cabinet Secretary Hirokazu Matsuno was reported as saying that attention needs to be paid to inflation causing lower spending power.
Market reaction
At the time of writing, USD/JPY is trading at 137.18, down 0.17% on the day. Risk-aversion dominates Asia, with the US dollar strongly bid and the Treasury yields extending the downside.
| Raw materials | Closed | Change, % |
|---|---|---|
| Silver | 19.111 | -0.76 |
| Gold | 1734.035 | -0.4 |
| Palladium | 2135.83 | -0.54 |
A senior U.S. Treasury official said on Tuesday, “failure to implement proposed oil price cap on Russian oil, with an exemption for purchases below cap, could see the oil price rise to around $140/barrel.”
Additional comments
Yellen to discuss proposed cap on Russian oil price with Japan’s Suzuki, goal is to minimize negative impact on Japan, others, while curtailing Russian revenues.
Japan has expressed concerns about proposed price cap being set too low, has not rejected range of $40-$60/barrel.
US Treasury Secretary Janet Yellen will discuss implementation of the proposed oil price cap with Japanese Finance Minister Shunichi Suzuki when they meet later on Tuesday
Yellen to tell Japanese Finance Minister Suzuki that the US remains very strong despite inflation and drop in Q1 GDP.
Market reaction
WTI is bouncing back towards $100.50 on the above comments, having hit daily lows at $99.73 in the last hour.
- USD/CAD stays firmer above a short-term support line, up for the second consecutive day.
- Successful bounce off 50-HMA, firmer RSI also keeps buyers hopeful.
- A two-month-old ascending resistance line appears the key hurdle for the bulls.
USD/CAD picks up bids to 1.3020 while extending the previous day’s run-up during Tuesday’s Asian session.
The Loonie pair’s latest uptrend could be linked to the quote’s ability to stay beyond the 50-HMA and a three-day-old upward sloping support line. Also keeping the buyers hopeful is the ascending RSI (14).
That said, the USD/CAD prices currently aim for a downward sloping resistance line from July 05, around 1.3050, a break of which could propel the quote towards the monthly high of 1.3083.
It’s worth noting, however, that an ascending resistance line from May 12, close to 1.3090 by the press time, will precede the 1.3100 psychological magnet to challenge the bulls afterward.
Meanwhile, pullback moves may initially battle the nearby support line, around 1.2995, before retesting the 50-HMA support level surrounding 1.2985.
In a case where the USD/CAD prices remain weak past 1.2985, the 200-HMA level of 1.2953 will act as the last defense of the pair buyers before directing the sellers towards the late June’s low around 1.2820.
USD/CAD: Hourly chart
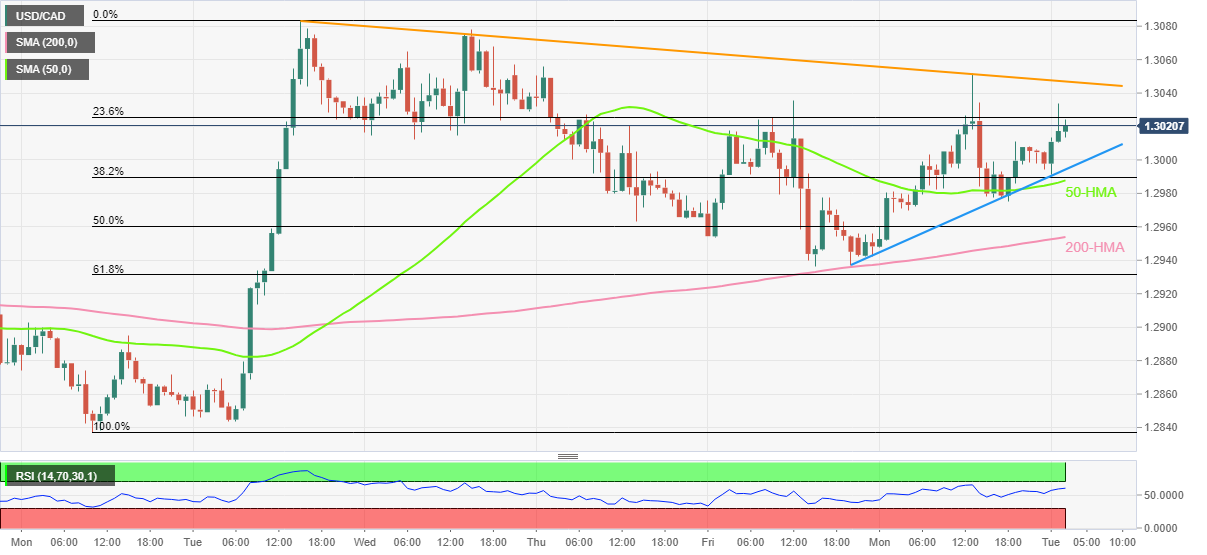
Trend: Further upside expected
- S&P 500 Futures extend the previous day’s pullback from two-week high.
- Widening gap of US 10-year, 2-year Treasury yields curve hints at recession fears.
- Jump in the US inflation expectations, hawkish Fedspeak also strengthen risk-aversion wave.
Market sentiment remains sour during Tuesday’s Asian session amid prevalent economic fears. While portraying the mood, the S&P 500 Futures drop 0.40% to stretch the previous day’s losses towards $3,840 whereas the US Treasury yields also remain pressured at the latest.
That said, the difference between the US 10-year Treasury yields and its counterpart for the 2-year validity also portrays the risk-off mood, by marking the higher rate of 3.03% for the near-term bond while the lower yield of 2.96% for the longer-term bonds.
A record high in the one-year US inflation expectations and comments from the US policymakers suggesting more pain ahead escalated the fears of economic slowdown, which in turn propelled the market’s rush towards risk safety. Also adding to the risk-off mood, as well as to the broad US dollar strength, were Friday’s upbeat US employment data and geopolitical/trade fears.
That said, one-year US inflation expectations jumped to the record high of 6.8% in June, versus 6.6% prior, as per the NY Fed’s survey data released the previous day. It’s worth noting the latest US jobs report mentioned the US Nonfarm Payrolls (NFP) rose by 372K for June, versus expected 268K and downward revised 384K prior while the Unemployment Rate remained unchanged at 3.6%.
On the same line, Shanghai’s first coronavirus Omicron sub-variant BA-5 case escalated virus woes after the dragon nation failed to sustain the unlock activities. Moreover, strong inflation data from the Asian major and doubts over Beijing’s GDP goal, as well as on the stimulus’ ability to renew optimism, also weigh on the market’s sentiment.
Moving on, fears of the economic slowdown can keep weighing on the market’s risk appetite ahead of Wednesday’s US Consumer Price Index for June, expected 8.8% versus 8.6% prior.
It’s worth mentioning that the risk-off mood underpins the US dollar strength and weighs on prices of commodities, as well as Antipodeans.
Also read: US Dollar Index dribbles around multi-year above 108.00 ahead of US inflation
NZD/USD holds on to the previous day’s bearish bias around the lowest levels since May 2020, sellers flirt with the 0.6100 round figure during Tuesday’s Asian session.
In doing so, the Kiwi pair justifies the options market pessimism amid broad US dollar strength.
That said, the one-month Risk Reversal (RR) of the NZD/USD pair, the key options market gauge, marked the lowest level since July 01 the previous day. It’s worth noting that the RR is different between the call options and the put options and hence indicates the market’s bias.
It’s worth noting that the latest NZD/USD RR also snaps a three-day rebound with -0.140 figures.
The bearish bias over the Kiwi pair could be linked to the fears of recession and the broad US dollar strength. However, bears should remain cautious ahead of Wednesday’s monetary policy decision of the Reserve Bank of New Zealand (RBNZ).
Also read: NZD/USD bears attack 0.6100 at two-year low amid inflation/recession fears, RBNZ eyed
- Silver extends Monday’s losses towards renewing two-year low marked the previous week.
- Sustained trading below fortnight-old resistance line joins impending bear cross on MACD to favor sellers.
- Short-term rectangle, 50-SMA test buyers, descending trend line from June 24 lure sellers.
Silver Price (XAG/USD) takes offers to renew a two-year low of around $18.87 during Tuesday’s Asian session. In doing so, the bright metal extends the week-start losses to break the previous rectangle formation to the downside.
In addition to the downside break of the rectangle, an impending bear cross on the MACD and the quote’s sustained trading below a 12-day-old resistance line, around $1,910, also keep XAG/USD sellers hopeful.
Even if the silver manages to cross the $19.10 hurdle, the aforementioned rectangle’s upper line, near $19.50, will precede the 50-SMA level surrounding $19.55, to challenge commodity buyers.
In a case where the XAG/USD prices rally beyond $19.55, the odds of witnessing the run-up towards the monthly high of $20.20 can’t be ruled out.
Meanwhile, silver sellers may look for the metal’s successful break of rectangle’s support, at $18.92 by the press time, as oversold RSI (14) challenges further downside.
Should the quote remains below $18.92, the downward sloping support line from June 24, close to $18.15, will be in focus.
Silver: Four-hour chart
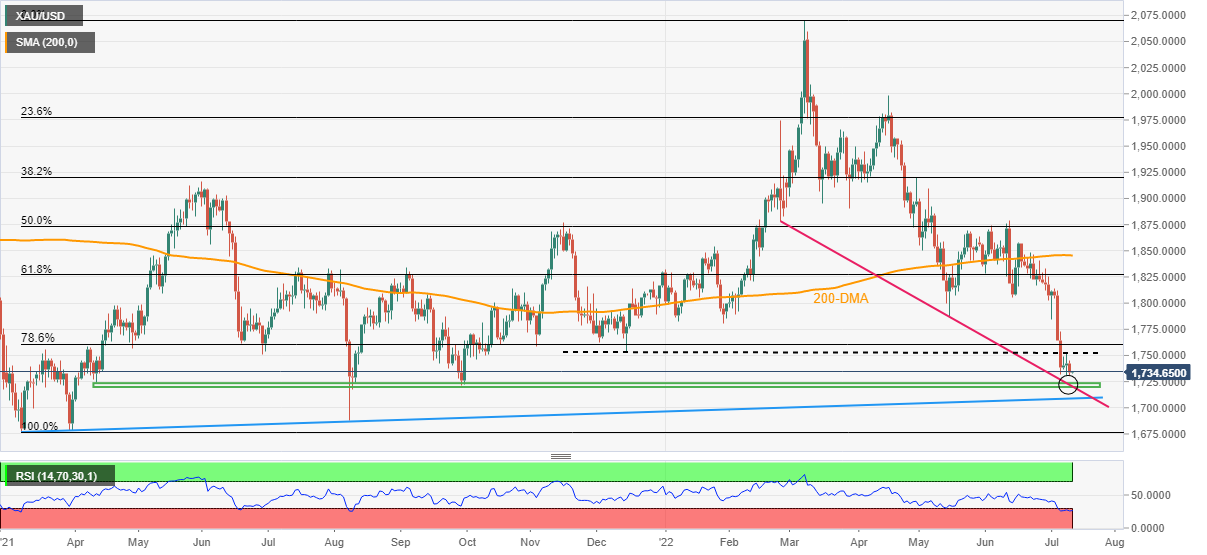
Trend: Bearish
In recent trade today, the People’s Bank of China (PBOC) set the yuan (CNY) at 6.7287 vs. the last close of 6.7140.
About the fix
China maintains strict control of the yuan’s rate on the mainland.
The onshore yuan (CNY) differs from the offshore one (CNH) in trading restrictions, this last one is not as tightly controlled.
Each morning, the People’s Bank of China (PBOC) sets a so-called daily midpoint fix, based on the yuan’s previous day's closing level and quotations taken from the inter-bank dealer.
- USD/JPY bears have started to move in on the hourly time frame.
- There is a focus on 138 but 137 is vulnerable to profit-taking ahead of US CPI later this week.
USD/JPY is a mixed bag given the risk-off tones that support both the yen and the US dollar, how far it has climbed already, earnings season and critical US data that is approaching fast this week. At the time of writing, the pair is trading at 137.20 and is on the back foot, falling from a high of 137.44 in the session with eyes on 137.14 the low. The pair is up 1.12% for the week and 2.10% for the month so far.
It was a risk-off start to the week which fuelled a bid on the US dollar. The greenback head to a 24-year high on the yen on Monday following Japan's ruling conservative coalition's strong election. The markets are of the mind that the yen will therefore stay lower for longer despite the tendency to buy into the yen at times of uncertainty and risk-off sentiment. Instead, global growth fears have helped the safe-haven flows find their way into the US currency more broadly which has given rise to the fresh bull cycle highs in the pair. The dollar climbed to as high as 137.75 yen and the firmest since late 1998. The dollar index (DXY) reached a fresh cycle high of 108.232, but it has since pulled back to 108.069 the low in Asia on Tuesday.
For the day ahead, the markets will be driven by sentiment but traders may be reluctant to stay in the trend given how far the greenback has come already ahead of the US data this week. This could give rise to some temporary profit-taking which is what could be playing out in USD/JPY currently. The main focus following Friday's evidence that the US jobs market is strong from the US Nonfarm Payrolls outcome will be the inflation data on Wednesday. Markets have been reassured to expect a 75bp hike at the July Federal Reserve meeting following the labour market report from Friday and will be looking for further evidence in this week's inflation data.
''Core prices likely stayed strong in June, with the series registering a 0.5% MoM gain. Shelter inflation likely maintained momentum, but we look for airfares to retreat following double-digit m/m expansions in March-May,'' analysts at TD Securities said. ''Separately, we expect gasoline prices to remain a notable force, accelerating to an 11% MoM pace. Our MoM forecasts imply 8.9%/5.7% YoY for total/core prices.''
USD/JPY technical analysis
- USD/JPY Price Analysis: Bulls take on fresh bull cycle highs, but how far can this run?
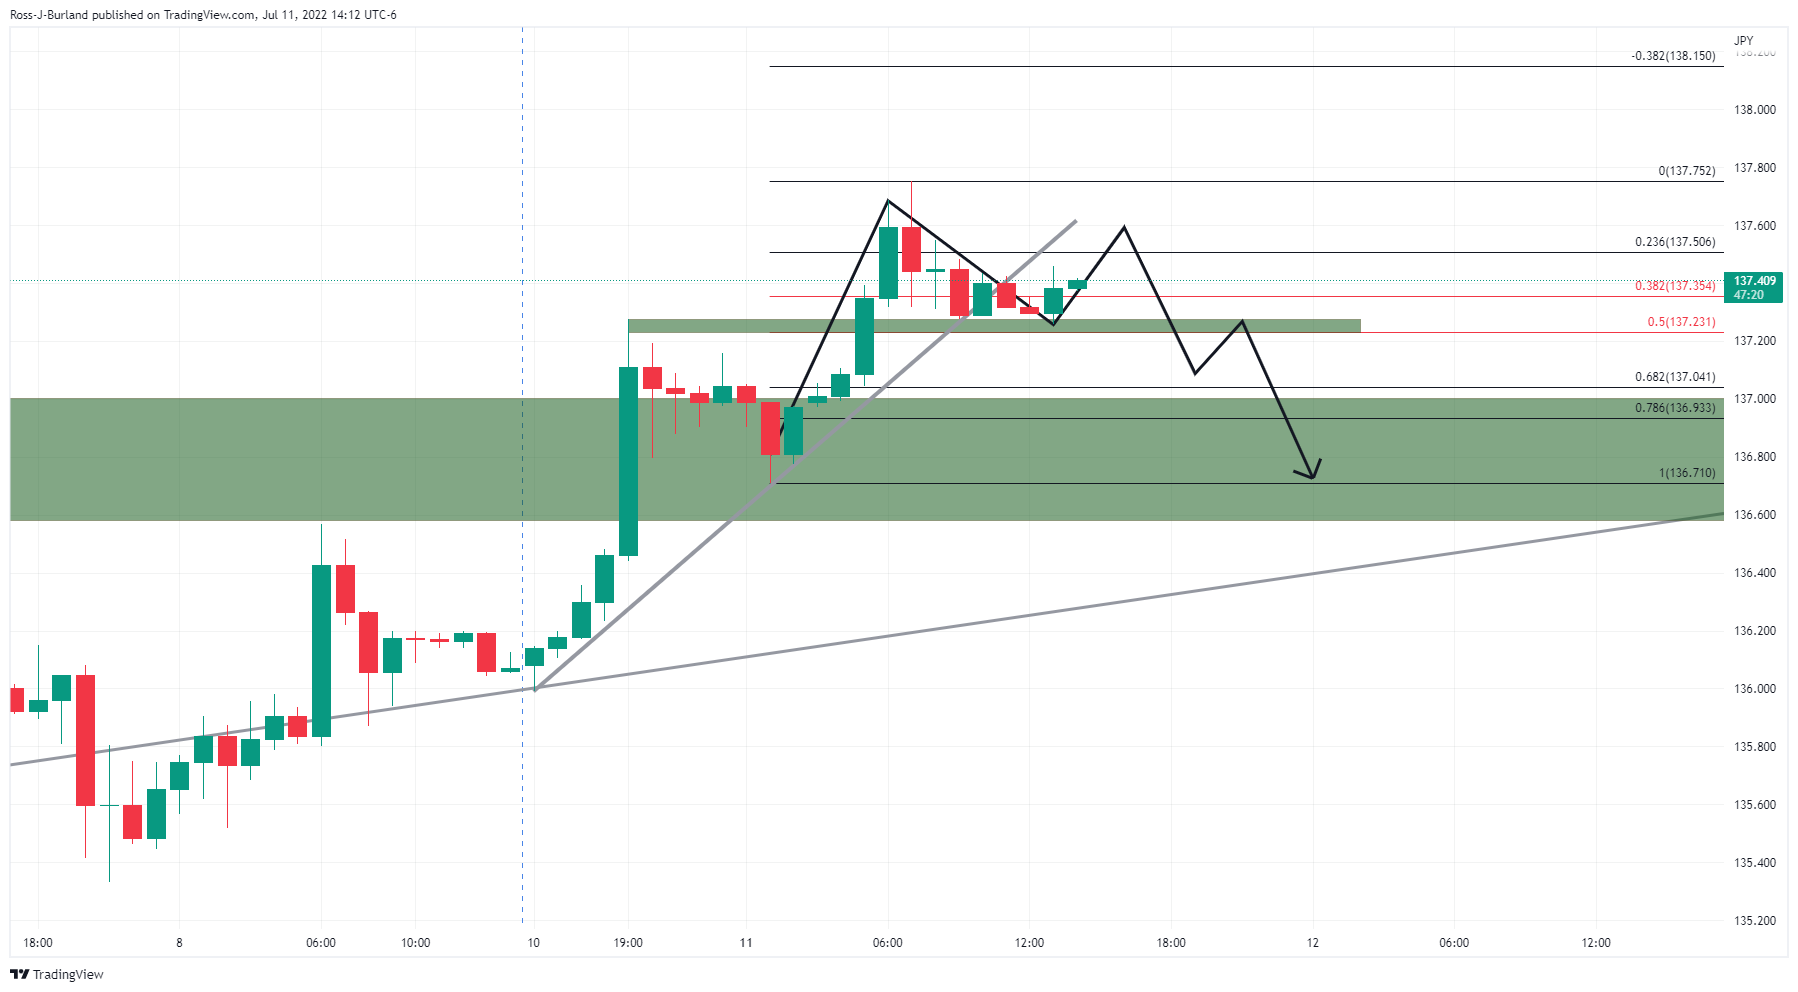
As per the prior analysis above, the bearish scenario could be starting to play out in today's Asian session:

- EUR/GBP is aiming lower below 0.8440 on wide ECB-BOE policy divergence.
- The BOE is expected to elevate its interest rates further due to large real income shocks.
- Germany's HICP is seen in line with the prior release of 8.2% on an annual basis.
The EUR/GBP pair is consolidating in a narrow range of 0.8439-0.8446 after a perpendicular downside move. The asset is auctioning in a balanced market profile from the past two trading sessions. However, the downside move is expected on higher odds of an escalation in European Central Bank (ECB)-Bank of England (BOE) policy divergence.
The comments from BOE Governor Andrew Bailey that its economy is facing a very large real income shock have triggered the odds of one more bumper rate hike by the BOE. The inflation rate has escalated to 9.1% in the UK economy and the investing community is betting on a two-digit inflation figure. Apart from that, BOE Bailey dictated that the economy will bring the price pressures to the targeted rate of 2% in a time period of two years.
This week, the economic data from the UK Office for National Statistics will be the major event. The Gross Domestic Product (GDP) is seen at 0% vs. -0.3% printed earlier. While the annual Manufacturing Production may slip to 0.3% from the former release of 0.5%.
On the eurozone front, the ECB has not followed the footprints of its Western leaders yet and has not paddled their interest rate. Policy tightening measures have been initiated and the Asset Purchase Program (APP) has been concluded. However, the interest rate elevation is still not featured to combat the Harmonized Index of Consumer Prices (HICP). This week, the release of the Germany HICP will be keenly watched. As per the market consensus, the inflation rate is seen stable at 8.2%.
- GBP/USD struggles to recover from the lowest levels since March 2020.
- Multiple key UK politicians have applied for British President’s seat, tax cuts appear as the key promotion.
- Broad fears of inflation, recession join UK retailers’ biggest squeeze since pandemic to weigh on prices.
- BOE’s Bailey, risk catalyst will be important for near-term directions.
GBP/USD bears flirt with the 1.1900 threshold during Tuesday’s Asian session, after refreshing the two-year low around 1.1845 the previous day. The Cable pair’s latest losses could be linked to the political moves in the UK, as well as fears of recession.
That said, multiple key British diplomat ranging from ex-Chancellor Rishi Sunak to Foreign Secretary Liz Truss, not to forget present UK Finance Minister Nadhim Zahawi, all are in the race to become the British President after sacking Boris Johnson. While Brexit is the key aspect to favor the candidature, tax cuts are being heard as the promise to win the favor.
Elsewhere, British shoppers cut back on spending for the third month in a row and sales volumes fell by the most since they were hit hard by the COVID-19 pandemic as surging inflation squeezed the economy, an industry survey showed on Tuesday per Reuters.
It should be noted that Bank of England (BOE) Governor Andrew Bailey said, per Reuters, "UK is facing a very big real income shock." The news also exert downside pressure on the GBP/USD prices amid economic fears in the nation.
On a broader front, the all-time high US inflation expectations and comments from the US policymakers suggesting more pain ahead escalated the fears of economic slowdown, which in turn propelled the risk-off mood and drown the GBP/USD prices. That said, one-year US inflation expectations jumped to the record high of 6.8% in June, versus 6.6% prior, per the NY Fed’s survey of one-year-ahead consumer inflation expectations. Also contributing to the market’s pessimism are the hopes of Fed’s aggression, previously backed by the latest US jobs report. As per Friday’s release, the US Nonfarm Payrolls (NFP) rose by 372K for June, versus expected 268K and downward revised 384K prior while the Unemployment Rate remained unchanged at 3.6%.
Against this backdrop, equities remained depressed and the US Treasury yields kept flashing recession fears. Further, S&P 500 Futures track Wall Street losses by the press time.
Moving on, the second round of testimony from BOE Governor Bailey will be important for the GBP/USD traders to watch. However, major attention will be given to risk catalysts like political updates and inflation fears.
Technical analysis
A two-month-old support line, around 1.1840, restricts short-term GBP/USD downside amid the oversold RSI (14).
- The downside break of the Darvas box has resulted in volatility expansion in the asset.
- A bear cross, represented by the 20- and 50-EMAs at 0.6827 adds to the downside filters.
- A (20.00-40.00) bearish range shift by the RSI (14) adds to the downside filters.
The AUD/USD pair is displaying topsy-turvy moves in the Asian session. The asset has auctioned in a tad lower range of 0.6732-0.6746 amid a lackluster movement in the US dollar index (DXY). On Monday, the major remained vulnerable after surrendering the critical support of 0.6760. The asset recorded a fresh two-year low of 0.6716.
The break of the Darvas Box formation results in a volatility expansion in the counter. The above-mentioned chart pattern formed in a wider range of 0.6761-0.6900 from the first trading session of July.
A bear cross by the 20- and 50-period Exponential Moving Averages (EMAs) at 0.6827 adds to the downside filters.
Meanwhile, the Relative Strength Index (RSI) (14) has shifted into the bearish range of 20.00-40.00, which indicates more losses ahead. The momentum oscillator RSI (14) is not displaying any sign of divergence and oversold.
Should the asset drop below Monday’s low at 0.6713, the greenback bulls will drag the asset towards the 29 May 2020 high at 0.6683. A breach of the latter will drag the asset towards the 30 April 2020 high at 0.6570.
On the contrary, the greenback bulls could lose their grip if the asset violates July 5 high at 0.6896. An occurrence of the same will drive the asset towards June 30 high at 0.6920, followed by June 28 high at 0.6965.
AUD/USD hourly chart
-637931833090291718.png)
- US Dollar Index seesaws near the highest level since October 2002.
- Market sentiment remains sour amid recession, inflation woes.
- US CPI is the key data for this week, risk catalysts could entertain greenback buyers.
US Dollar Index (DXY) bulls take a breather around the 20-year high as it takes round to 108.20 during the initial Asian session on Tuesday, after initially easing to 108.06. The greenback’s gauge versus the six major currencies rallied the most in three days while rising to the fresh high since October 2002 on Monday. That said, fears of further increases in prices amplify recession woes and underpin the US dollar’s safe-haven demand.
It should be noted that one-year US inflation expectations jumped to the record high of 6.8% in June, versus 6.6% prior, per the NY Fed’s survey of one-year-ahead consumer inflation expectations. Also contributing to the market’s pessimism are the hopes of Fed’s aggression, previously backed by the latest US jobs report. As per Friday’s release, the US Nonfarm Payrolls (NFP) rose by 372K for June, versus expected 268K and downward revised 384K prior while the Unemployment Rate remained unchanged at 3.6%.
Considering the data, White House Press Secretary Karine Jean-Pierre told reporters that she expects new Consumer Price Index (CPI) data to be highly elevated. Further, Atlanta Fed President Raphael Bostic said that recent inflation data has not been as encouraging as I would have liked, per Reuters.
Elsewhere, Shanghai’s first coronavirus Omicron sub-variant BA-5 case escalated virus woes after the dragon nation failed to sustain the unlock activities. Moreover, strong inflation data from the Asian major and doubts over Beijing’s GDP goal, as well as on the stimulus’ ability to renew optimism, exert additional downside pressure on the market sentiment and propel DXY.
While portraying the mood, equities remained depressed and the US Treasury yields kept flashing recession fears. S&P 500 Futures, however, print mild gains by the press time.
Looking forward, fears of an economic slowdown appear crucial support for the DXY buyers and hence chatters surrounding the same will be important to track ahead of Wednesday’s US Consumer Price Index for June, expected 8.8% versus 8.6% prior.
Technical analysis
The monthly resistance line challenges DXY bulls around 109.00 amid overbought RSI (14). The pullback, however, remains elusive unless breaking the previous resistance line from May 13, close to 106.40 by the press time.
| Index | Change, points | Closed | Change, % |
|---|---|---|---|
| NIKKEI 225 | 295.11 | 26812.3 | 1.11 |
| Hang Seng | -601.58 | 21124.2 | -2.77 |
| KOSPI | -10.34 | 2340.27 | -0.44 |
| ASX 200 | -73.3 | 6604.7 | -1.1 |
| FTSE 100 | 0.39 | 7196.59 | 0.01 |
| DAX | -182.79 | 12832.44 | -1.4 |
| CAC 40 | -36.83 | 5996.3 | -0.61 |
| Dow Jones | -164.31 | 31173.84 | -0.52 |
| S&P 500 | -44.95 | 3854.43 | -1.15 |
| NASDAQ Composite | -262.71 | 11372.6 | -2.26 |
| Pare | Closed | Change, % |
|---|---|---|
| AUDUSD | 0.67324 | -1.65 |
| EURJPY | 137.923 | -0.47 |
| EURUSD | 1.00385 | -1.38 |
| GBPJPY | 163.369 | -0.26 |
| GBPUSD | 1.18898 | -1.18 |
| NZDUSD | 0.61094 | -1.19 |
| USDCAD | 1.30048 | 0.44 |
| USDCHF | 0.98234 | 0.58 |
| USDJPY | 137.426 | 0.95 |
- GBP/JPY is oscillating in a range of 163.03-163.54 as investors await UK economic data.
- BOJ’S ultra-dovish commentary may weaken the yen bulls further.
- The BOE could bring the inflation rate to the targeted rate of 2% in two years.
The GBP/JPY pair is displaying a balanced auction profile in a narrow range of 163.03-163.54 from Monday. On a broader note, the cross is going through a time correction phase after hitting a high of 164.47 on Monday. Therefore the upside remains favored, which will be backed by the continuation of an ultra-loose monetary policy by the Bank of Japan (BOJ).
The extreme dovish commentary from BOJ Governor Haruhiko Kuroda on Monday has weakened the yen bulls on a broader note. The investing community is aware of the fact that the Japanese yen is in bearish territory for a tad longer period. Pity to the efforts by the BOJ on accelerating the inflation rate and failing on the same.
The plain vanilla inflation rate in Japan has crossed the inflation target of 2%. However, the major trigger behind reaching the inflation target is soaring energy bills and food prices. Therefore, BOJ Kuroda is bent on the deployment of additional monetary easing measures.
On the UK front, soaring price pressures have resulted in a very large real income shock for the households. Bank of England (BOE) Governor Andrew Bailey sees an inflation rate near targeted levels in two years. Also, the escalating real income shock will also lower the price pressures as the households are expected to drop their demand volumes itself significantly to equalize the shopping list with the paychecks.
This week, the release of the UK data will be of utmost importance. The Gross Domestic Product (GDP) is seen at 0% vs. -0.3% printed earlier. While the annual Manufacturing Production may slip to 0.3% from the former release of 0.5%.
- Gold remains depressed at the lowest levels in 10 months.
- Risk-aversion underpins the US dollar’s safe-haven demand as record inflation expectations propel recession woes.
- Concerns over China also weighed on metal prices.
- US CPI, risk catalysts are important for intraday directions.
Gold Price (XAU/USD) fades a bounce off the lowest levels since September 2021, marked the previous day, as it retreats to $1,733 during Tuesday’s Asian session. The metal’s latest weakness could be linked to the market’s rush towards risk-safety amid fears of higher inflation and economic slowdown.
The all-time high US inflation expectations and comments from the US policymakers suggesting more pain ahead escalated the fears of economic slowdown, which in turn propelled the risk-off mood. Also weighing on the XAU/USD is Friday’s upbeat US employment data and geopolitical/trade fears.
That said, one-year US inflation expectations jumped to the record high of 6.8% in June, versus 6.6% prior, per the NY Fed’s survey of one-year-ahead consumer inflation expectations. It’s worth noting the latest US jobs report mentioned the US Nonfarm Payrolls (NFP) rose by 372K for June, versus expected 268K and downward revised 384K prior while the Unemployment Rate remained unchanged at 3.6%.
On a different page, White House Press Secretary Karine Jean-Pierre told reporters that she expects new Consumer Price Index (CPI) data to be highly elevated. Further, Atlanta Fed President Raphael Bostic said that recent inflation data has not been as encouraging as I would have liked, per Reuters.
Additionally, Shanghai’s first coronavirus Omicron sub-variant BA-5 case escalated virus woes after the dragon nation failed to sustain the unlock activities. Moreover, inflation data from the Asian major and doubts over Beijing’s GDP goal, as well as on the stimulus’ ability to renew optimism, exert additional downside pressure on the market sentiment and gold prices.
Against this backdrop, equities remained depressed and the US Treasury yields kept flashing recession fears. S&P 500 Futures, however, print mild gains by the press time.
Looking forward, Wednesday’s US inflation data will be crucial for this week while chatters surrounding recession and the Fed’s hawkish path could entertain XAU/USD traders.
Technical analysis
Although oversold RSI (14) offers a breathing space to the gold sellers around a multi-month low, the metal remains on the bear’s radar unless crossing the support-turned-resistance from December 2021, around $1,755.
Even if the XAU/USD manages to rise past $1,755, the 61.8% Fibonacci retracement of March 2021-2022 upside, around $1,828, could challenge the buyers.
Meanwhile, a convergence of the 15-month-old horizontal support and a downward sloping trend line from February offers the key support of around $1,720 for gold traders to watch. Also acting as a downside filter is an ascending trend line from March 2021, close to $1,708 by the press time.
Gold: Daily chart

Trend: Bearish


© 2000-2026. All rights reserved.
This site is managed by Teletrade D.J. LLC 2351 LLC 2022 (Euro House, Richmond Hill Road, Kingstown, VC0100, St. Vincent and the Grenadines).
The information on this website is for informational purposes only and does not constitute any investment advice.
The company does not serve or provide services to customers who are residents of the US, Canada, Iran, The Democratic People's Republic of Korea, Yemen and FATF blacklisted countries.
Making transactions on financial markets with marginal financial instruments opens up wide possibilities and allows investors who are willing to take risks to earn high profits, carrying a potentially high risk of losses at the same time. Therefore you should responsibly approach the issue of choosing the appropriate investment strategy, taking the available resources into account, before starting trading.
Use of the information: full or partial use of materials from this website must always be referenced to TeleTrade as the source of information. Use of the materials on the Internet must be accompanied by a hyperlink to teletrade.org. Automatic import of materials and information from this website is prohibited.
Please contact our PR department if you have any questions or need assistance at pr@teletrade.global.
transfers