- Analytics
- News and Tools
- Market News
CFD Markets News and Forecasts — 24-12-2021
- The shared currency losses against the greenback but remains above the 1.1300 figure.
- EUR/USD Price Forecast: A descending triangle in a downtrend opens the door for a challenge of the YTD low at 1.1186.
The EUR/USD is barely down late in the European session, trading at 1.1318 at the time of writing. As US markets as a whole remain closed on Christmas eve, the market sentiment is upbeat.
On Friday, the greenback benefits from thin liquidity conditions gaining ground against all G8 currencies, though as of late against the GBP, which is down 0.02% though clings to the 1.3400 figure.
By Tuesday, it appeared that a Santa rally was not coming in 2021. However, as news of a study in South Africa reported that people infected with the Omicron variant were 80% less susceptible to needing hospitalization, it improved the market mood. Further in the UK, two studies reported the same results as in South Africa, though the percentage of people was between 50% to 70%. That, alongside the US Food and Drug Administration (FDA) approving Covid-19 treatments by Pfizer and Merck
EUR/USD Price Forecast: Technical outlook
The EUR/USD daily chart depicts the pair has a downward bias, as shown by the daily moving averages (DMAs) residing above the spot price. In the near term, the EUR/USD is in consolidation ahead of 2022. However, as of lately, a descending triangle chart pattern formed that could target the YTD low around 1.1186, though it would face some hurdles on the way down.
The first support would be the 1.1300 figure. The latter's breach would expose the December 15 cycle low at 1.1221, followed by the November 24 YTD low at 1.1186.
-637759592228330580.png)
- The greenback gains some ground against the aussie, amid closed US equity and money markets.
- Covid-19 positive news improved investors' mood as the year-end looms.
- AUD/USD Price Forecast: Bulls prepare for a challenge of crucial resistance around 0.7280-0.7300.
The AUD/USD slides during the late European trading session, down some 0.33% trading at 0.7224 at the time of writing. The market sentiment is upbeat, as shown by some European bourses that opened on Friday. However, thin liquidity conditions spurred by some financial centers closed on Christmas eve, keeping the greenback on the bid against most G8 currencies.
The week witnessed a late Santa rally spurred by positive news on the Covid-19 front. On Tuesday, a study in South Africa reported that people infected with the Omicron variant were 80% less susceptible to needing hospitalization. That, alongside the US Food and Drug Administration (FDA) approving Covid-19 treatments by Pfizer and Merck, was the last piece of the puzzle that prompted the US S&P 500 towards a new all-time high around 4700.
Those events ultimately benefitted risk-sensitive currencies in the FX market, like the AUD. The Australian dollar rallied some 150-pips since Tuesday, but as of today, a pullback towards 0.7220s appears to be a pause necessary before challenging of breaking essential resistance levels.
AUD/USD Price Forecast: Technical outlook
The AUD/USD daily chart depicts the pair has a downward bias, as the daily moving averages (DMAs) reside above the spot price. Nevertheless, the recent upside move stalled some 40-pips short of the confluence of the 50 and the 100-day moving averages (DMAs), which lie at 0.7280 and 0.7294, respectively.
In the event of breaking above the aforementioned levels, that would pave the way for further gains, exposing crucial resistance levels. The first one would be November’s 15 swing high at 0.7371, followed by 0.7400.
-637759572736955777.png)
- Gold gains for the second week in a row, but still remains under $1810.
- While above $1785, the bullish bias could persist in the short term.
Gold rose for the second week in a row and finished slightly below $1810 after rebounding from $1783. It was unable to hit fresh monthly highs.
The yellow metal continued to improve its outlook, with a close above the 55-week simple moving average. The upside continues to face resistance around $1810/15. A break of that area should clear the way for a test of the next critical level seen at the $1830 region.
The immediate short-term support could be seen at $1793 followed by the 20-day simple moving average at $1784. A daily close under $1780 could anticipate more losses and a potential slide to $1750.
The upside in gold is being supported by a weaker US dollar and the improvement in market sentiment. On the contrary, the main negative factors are US yields, that many analysts see moving to the upside amid expectations of interest rate hikes from the Federal Reserve next year.
Technical levels
- The Mexican peso is rising across the board on Friday.
- USD/MXN heads for lowest daily close in a month.
The USD/MXN is falling on Friday for the third consecutive day and it trades at 20.56, the lowest level in a month. The Mexican peso remains supported by an improvement in global risk sentiment. Also, a weaker dollar contributes to the decline of the pair.
Downside continues after data
Data released on Thursday showed inflation in Mexico was lower than expected during the first half of December, but core exceeded forecasts, and still, the headline is above 7%, far from Banxico’s target. The numbers warrant more rate hikes in Mexico.
In the US, economic numbers on Thursday also show inflation at elevated numbers, helping expectations about some action from the Federal Reserve next year. The dollar failed to rise on the back of the economic indicators, affected by higher equity prices.
The optimism around financial markets continues to help emerging market currencies like the Mexican peso. If the situation persists, USD/MXN will likely continue to slide.
The pair is approaching the 20.45/50 area, strong support and also around the 100-day simple moving average. The mentioned area should limit the downside, and favor a rebound, probably to the 20.70 zone. A break under 20.45, would expose the November low at 20.23. On the upside, the immediate resistance zone now is 20.65/70 followed by 20.90.
Technical levels
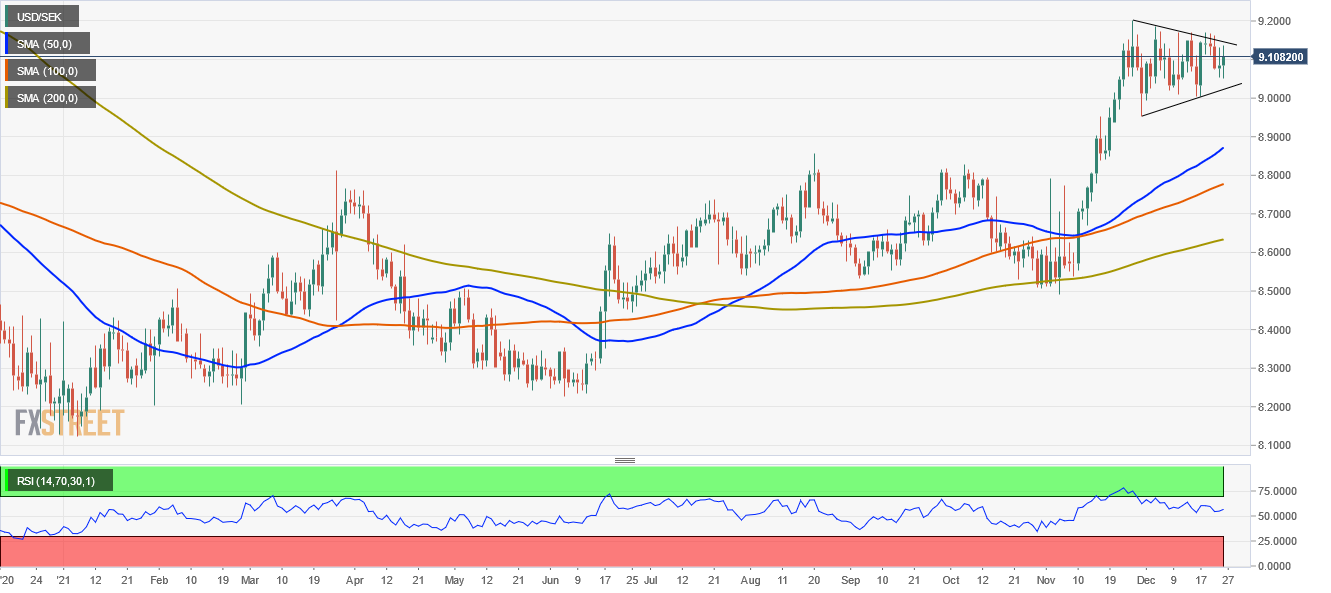
- The USD/SEK advances some 0.36% during the day at press time.
- Thin market liquidity conditions have favored the greenback, which advances against most G8 currencies.
- USD/SEK Price Forecast: A textbook bullish-flag chart patterns, targets 9.4000.
The USD/SEK advances late in the European session, trading at 9.1256 at the time of writing. On Friday, Wall Street is closed in the US in observance of Christmas; US equity and money markets would re-open on Monday.
Thin market liquidity conditions keep the greenback in the right foot against most G8 majors, except for the British pound, gaining some 0.03%. In the equity markets, most European bourses that opened on Friday are in the green, except for the CAC 40, down some 0.28%.
A recap for US money markets, the US 10-year Treasury yield finished the week at 1.493%, while the US Dollar Index clung to the 96.00 figure, at 96.06, despite losing in the last three trading sessions ahead of Christmas eve.
USD/SEK Price Forecast: Technical outlook
During the Asian and European session, the USD/SEK dipped as low as 9.0500, pierced the December 22 daily low at 9.0535. However, as European traders got to their desks, the pair rallied up to the December 23 daily high around 9.1323, which capped the upward move, settling around current levels.
From the daily chart perspective, the USD/SEK depicts the formation of a “perfect” textbook bullish-flag chart pattern, formed through the month of December, that in the event of breaking around the 9.1500 figure would target 9.4000.
Nevertheless, it would find some hurdles on the way north. The first resistance would be the psychological 9.1500 figure. A breach of the latter would expose successive daily highs/resistance levels reached in December, like the December 20 daily high at 9.1704, followed by the December 3 high at 9.1864, and then the November 26 YTD high at 9.2026.
On the flip side, the first support would be 9.0500. A break below that level would expose the December 16 9.0043, followed by the figure at 9.000.
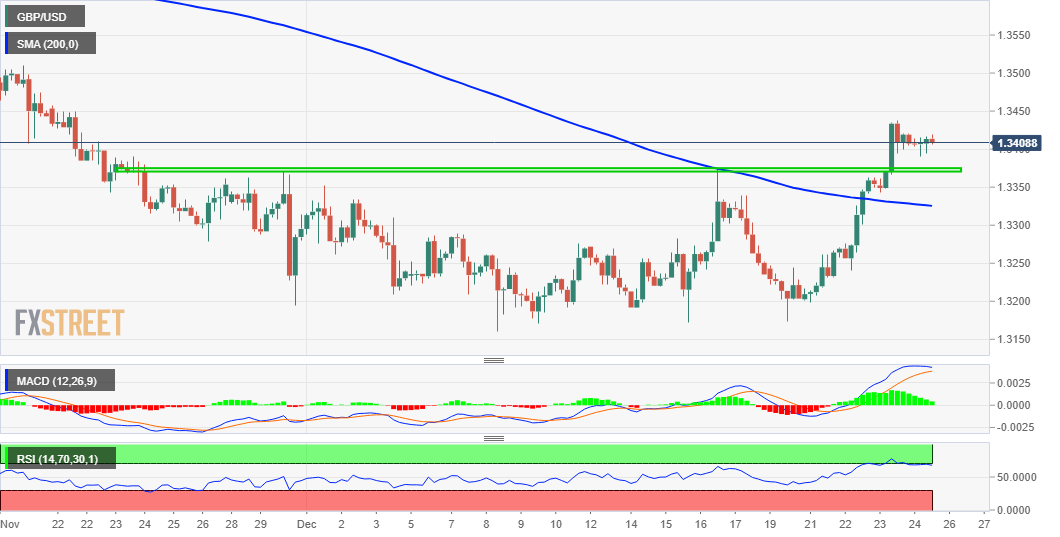
- GBP/USD edged higher for the fourth straight day on Friday.
- The set-up remains tilted firmly in favour of bullish traders.
- The stage seems set for a move to reclaim the 1.3500 mark.
The GBP/USD pair attracted some dip-buying near the 1.3390-85 region on Friday and turned positive for the fourth successive day. The pair held on to its modest intraday gains through the mid-European session and was last seen trading near the daily top, around the 1.3415-20 region.
From a technical perspective, the overnight sustained move beyond the 1.3370-75 horizontal resistance, or the post-BoE swing high was seen as a fresh trigger for bullish traders. This, in turn, supports prospects for an extension of this week's solid bounce from the vicinity of the YTD low.
The constructive outlook is reinforced by the fact that technical indicators on the daily chart have just started moving into the positive territory. A subsequent move beyond the monthly top, around the 1.3435-40 region will reaffirm the bullish bias and pave the way for additional gains.
The GBP/USD pair could then accelerate the appreciating move and aim to reclaim the key 1.3500 psychological mark. The momentum could get extended and push spot prices beyond an intermediate hurdle near 1.3515, towards testing the next relevant barrier near the 1.3560-65 region.
On the flip side, any meaningful slide below the 1.3375-70 resistance breakpoint could now be seen as a buying opportunity and remain limited near the 1.3335 area. Some follow-through selling below the 1.3300 mark might negate the positive bias and expose the 1.3265-60 support.
GBP/USD 4-hour chart
Technical levels to watch
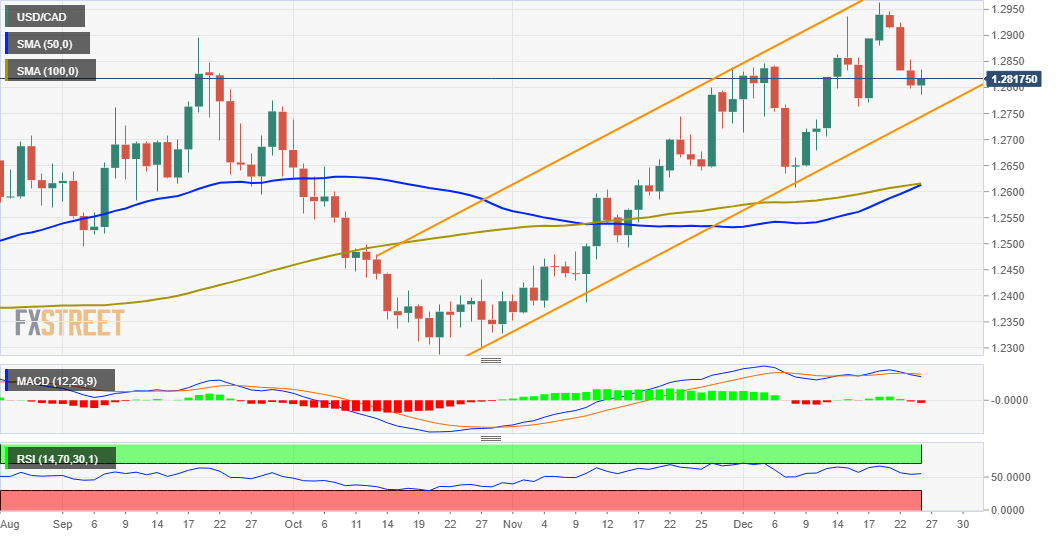
- USD/CAD witnessed some intraday selling on Friday and dropped to a fresh weekly low.
- The ascending channel formation supports prospects for the emergence of dip-buying.
- A convincing break below the 1.2740-35 area is needed to negate the positive outlook.
The USD/CAD pair struggled to capitalize on its modest intraday gains, instead met with a fresh supply near the 1.2835 region on Friday and refreshed weekly low during the mid-European session. The pair, however, quickly reversed the dip and jumped back above the 1.2800 round-figure mark in the last hour.
Looking at the broader picture, the USD/CAD pair has been trending higher along an ascending channel over the past two months or so, pointing to a short-term uptrend. Apart from this, oscillators on the daily chart – though have been losing traction – are still holding in the positive territory and favour bullish traders.
This, in turn, supports prospects for the emergence of some dip-buying at lower levels. Hence, any subsequent weakness below the 1.2770-60 horizontal support is more likely to stall near the lower boundary of the mentioned channel, currently around the 1.2740 region, which should now act as a key pivotal point.
A convincing break below will negate any near-term positive bias and pave the way for an extension of the recent pullback from the YTD high touched on Monday. The USD/CAD pair would then turn vulnerable to break below the 1.2700 mark and accelerate the fall towards testing the next relevant support near the 1.2640-35 region.
On the flip side, momentum beyond the daily swing high, around the 1.2835 region, might confront some resistance near the 1.2860 area. Some follow-through buying will reaffirm the bullish outlook and allow the USD/CAD pair to reclaim the 1.2900 mark. The momentum could further push spot prices to the 1.2960-65 area, or the YTD top.
USD/CAD daily chart
Technical levels to watch
- USD/CHF edged lower for the third successive day and dropped to a near three-week low on Friday.
- A modest USD weakness was seen as a key factor exerting some downward pressure on the major.
- The risk-on mood undermined the safe-haven CHF and limited losses amid the year-end thin liquidity.
The USD/CHF pair remained depressed through the first half of the European session and was last seen hovering near a three-week low, around the 0.9170-65 region.
The pair edged lower for the third successive day on Friday and prolonged this week's rejection slide from the 0.9250 resistance zone. The downtick was exclusively sponsored by a modest US dollar weakness, with bears now looking to extend the downward trajectory further below the very important 200-day SMA.
That said, a generally positive tone around the equity markets undermined the safe-haven Swiss franc and extended some support to the USD/CHF pair. The global risk sentiment remained well supported by the recent studies, indicating that Omicron infections are less likely to lead to hospitalization.
Apart from this, the Fed's hawkish outlook acted as a tailwind for the greenback and should further help limit any deeper losses for the USD/CHF pair, at least for now. It is worth recalling that the so-called dot plot indicated that the Fed could hike interest rates at least three times next year.
From a technical perspective, the ongoing slide dragged the USD/CHF pair below support marked by the lower end of a near three-week-old trading range. A subsequent fall below the 0.9160-55 support area will reaffirm the negative bias and pave the way for a further near-term depreciating move.
The divergence between the fundamental backdrop and the technical setup warrants some caution before placing aggressive directional bets. Moreover, the year-end thin liquidity conditions suggest that the USD/CHF pair is more likely to enter a consolidation phase and oscillate in a narrow band on the Christmas Eve.
Technical levels to watch
China's finance ministry has announced on Friday that they will be extending tariff exemptions on some imported goods from the United States until June 30, 2022.
Market reaction
There was no market reaction to this headline as trading conditions remain thin on Christmas Eve. US stock markets will return to action next Monday, December 27. The S&P 500 Index registered impressive gains this week and closed within a touching distance of the record-high it set at 4,743. On a weekly basis, the index gained more than 2%.
- EUR/USD gained some positive traction on Friday and moved back to the weekly high.
- The risk-on mood continued underpinning the safe-haven USD and extended support.
- The Fed’s hawkish outlook should limit the USD losses and cap the upside for the pair.
The EUR/USD pair edged higher through the first half of the European session and was last seen hovering near the weekly high, just below mid-1.1300s.
The pair gained some positive traction on the last day of the week and is now looking to build on this week's goodish bounce from the 1.1235 region touched on Monday. The prevalent risk-on environment continued acting as a headwind for the safe-haven US dollar, which, in turn, was seen as a key factor that provided a modest lift to the EUR/USD pair.
The latest optimism led by reports that the Omicron variant might be less severe than feared remained supportive of the underlying bullish sentiment in the financial markets. Adding to this, various studies indicated that Omicron infections are less likely to lead to hospitalization and severe disease, which further boosted investors' confidence.
That said, the year-end thin liquidity conditions held back traders from placing aggressive directional bets. This, along with the Fed's hawkish outlook, should help limit any meaningful USD losses and cap the upside for the EUR/USD pair. This, in turn, warrants some caution before positioning for any further appreciating move for the major.
It is worth recalling that the so-called dot plot indicated that the Fed could hike rates at least three times next year. The expectations were reaffirmed by the US Personal Consumption Expenditures (PCE) Price Index, which accelerated to 5.7% YoY in November. This marked the largest annual growth since 1982 and validated expectations for an eventual Fed liftoff.
The fundamental backdrop seems tilted in favour of the USD bulls. Even from a technical perspective, the EUR/USD pair has been oscillating in a familiar trading range since the beginning of this month. This further makes it prudent to wait for a strong follow-through buying before confirming that the pair might have already formed a near-term bottom.
Technical levels to watch
- GBP/USD lacked any firm directional bias and seesawed between tepid gains/minor losses.
- Receding Omicron fears acted as a tailwind for the sterling and extended some support.
- Traders seemed reluctant to place aggressive bets amid the end-of-year thin liquidity.
The GBP/USD pair refreshed daily high in the last hour, albeit quickly retreated a few pips thereafter and was last seen trading in the neutral territory around the 1.3400 mark.
Following the overnight modest pullback from over one-month low, the GBP/USD pair seesawed between tepid gains/minor losses through the early part of the trading on Friday. The latest optimism led by reports that the Omicron variant might be less severe than feared helped offset worries about the continuous surge in new COVID-19 cases in the UK. Adding to this, a UK study indicated that Omicron infections are less likely to lead to hospitalization, which, in turn, acted as a tailwind for the British pound.
Apart from this, subdued US dollar demand was seen as another factor that provided a modest lift to the GBP/USD pair. That said, the UK-EU impasse over the Northern Ireland Protocol held back traders from placing aggressive bullish bets. Apart from this, the Fed's hawkish outlook – indicating at least three rate hikes next year – should limit any meaningful USD downside and cap gains for the pair. This, in turn, warrants some caution before positioning for any further appreciating move amid the year-end thin liquidity.
From a technical perspective, the overnight strong move beyond the post-BoE swing high, around the 1.3370-75 horizontal hurdle, could be seen as a fresh trigger for bullish traders. Hence, any meaningful corrective pullback could be seen as a buying opportunity and is more likely to remain limited near the mentioned resistance breakpoint. Nevertheless, the GBP/USD pair remains on track to end the week with strong gains and register its highest weekly close since mid-November.
Technical levels to watch
- USD/CAD defended the 1.2800 mark and staged a modest bounce on the last day of the week.
- Retreating oil prices undermined the loonie and provided a modest intraday boost to the pair.
- Subdued USD price action failed to impress amid the end-of-year thin liquidity in the markets.
The USD/CAD pair maintained its bid tone through the early European session and was last seen hovering near the top end of the daily trading range, around the 1.2820-25 region.
The pair attracted some buying near the 1.2800 mark on Friday and for now, seems to have stalled the recent pullback from the YTD top touched on the first day of the current week. Crude oil prices snapped a three-day rally and witnessed a modest pullback from a one-month high. This, in turn, undermined the commodity-linked loonie and provided a modest lift to the USD/CAD pair.
The uptick, however, lacked bullish conviction and remained limited amid subdued US dollar demand. The optimism led by reports that the new Omicron variant of the coronavirus might be less severe than feared boosted investors' confidence. This was evident from the risk-on rally in the equity markets, which continued weighing on traditional safe-haven currencies, including the greenback.
That said, the Fed's hawkish outlook, indicating three rate hikes in 2022, acted as a tailwind for the buck. The market expectations were reaffirmed by strong US inflation data released on Thursday. In fact, the Fed's preferred inflation gauge – the Personal Consumption Expenditures (PCE) Price Index – accelerated to 5.7% YoY in November, marking the largest annual growth since 1982.
The fundamental backdrop seems tilted in favour of the USD bulls. Even from a technical perspective, the USD/CAD pair has been trending higher along an upward sloping channel over the past two months or so. This, in turn, suggests that the path of least resistance for the USD/CAD pair is to the upside, though the year-end thin liquidity could hold back traders from placing fresh bullish bets.
Technical levels to watch
- The risk-on mood undermined the safe-haven JPY and acted as a tailwind for USD/JPY.
- Subdued USD price action capped the upside amid year-end thin liquidity conditions.
- The fundamental backdrop supports prospects for an extension of the recent move up.
The USD/JPY pair remained confined in a range through the early European session and was last seen trading just below mid-114.00s, or a near one-month high touched earlier this Friday.
The prevalent risk-on environment – as depicted by an extension of the recent rally in the equity markets – continued undermining the safe-haven Japanese yen. This, in turn, was seen as a key factor that acted as a tailwind for the USD/JPY pair, though subdued US dollar price action kept a lid on any meaningful upside.
The recent optimism was led by reports indicating that the current vaccines may be more effective than first thought in fighting the Omicron variant. Adding to this, studies suggested that the Omicron infections are less likely to lead to hospitalization, which further boosted investors' appetite for perceived riskier assets.
Bullish traders further took cues from the recent leg up in the US Treasury bond yields, bolstered by the Fed's hawkish outlook and strong US inflation data released on Thursday. It is worth recalling that the so-called dot plot indicated that the Fed officials expect to raise the fed funds rate at least three times next year.
The Personal Consumption Expenditures (PCE) Price Index – the Fed's preferred inflation gauge – accelerated to 5.7% YoY in November, marking the largest annual growth since 1982. This lifted expectations for a Fed liftoff in March 2022, which supports prospects for the emergence of some USD dip-buying and further gains for the USD/JPY pair.
Investors, however, seemed reluctant to place aggressive bets amid the year-end thin liquidity conditions and absent relevant market moving economic releases. This, in turn, suggests that the USD/JPY pair is more likely to prolong its range-bound price action and consolidate its recent gains recorded over the past three weeks or so.
Technical levels to watch
Here is what you need to know on Friday, December 24:
After closing the first three days of the week in the negative territory, the US Dollar Index steadied above 96.00 after the data from the US showed that the Core PCE inflation rose at a stronger pace than expected in November. Major financial markets will be closed on Christmas Eve on Friday and no action is expected.
The US Bureau of Economic Analysis reported on Thursday that the Core Personal Consumption Expenditures (PCE), the Fed's preferred gauge of inflation, jumped to 4.7% on a yearly basis in November from 4.2%. This reading surpassed the market expectation of 4.5%. Other data from the US revealed that the weekly Initial Jobless Claims remained unchanged at 205K, New Home Sales increased by 12.4% in November and Durable Goods Orders rose by 2.5% in the same period.
EUR/USD fell below 1.1300 in the American session on Thursday but ended up closing the day virtually unchanged at 1.1330. The pair remains on track to register weekly gains.
GBP/USD gathered bullish momentum this week on some positive Brexit headlines and easing worries over additional coronavirus-related restrictions in the UK. The pair is up more than 100 pips since the beginning of the week and seems to have settled above 1.3400.
Gold tested $1,800 with the initial reaction to US inflation data on Thursday but didn't have a difficult time holding above that level. The 10-year US Treasury bond yield came within a touching distance of 1.5% on Thursday. The bond market will also be shut on Christmas Eve.
USD/JPY continues to trade sideways near the monthly high it set at 114.50.
Bitcoin gained nearly 5% and stays afloat above $50,000. Ethereum continues to trade near the upper limit of its 10-day-old range around $4,000.
- AUD/USD edged lower on Friday and snapped three successive days of the winning streak.
- The downtick could be attributed to some profit-taking following this week’s strong rally.
- The risk-on mood should help limit any meaningful slide for the perceived riskier aussie.
The AUD/USD pair remained on the defensive through the first half of the trading on Friday and was last seen hovering around the 0.7230 region heading into the European session.
The pair witnessed some selling on the last day of the week and for now, seems to have stalled this week's positive move to an over one-month high, around mid-0.7200s touched on Thursday. The downtick lacked any obvious fundamental catalyst and could be attributed to some profit-taking following a strong rally of around 150 pips over the past three sessions.
That said, the prevalent risk-on mood – as depicted by a positive tone around the equity markets – should continue to lend support to the perceived riskier aussie. Investors turned optimistic amid reports that the current vaccines may be more effective in fighting the new variant than first thought and that the Omicron infections are less likely to lead to hospitalization.
Meanwhile, receding fears about the potential economic fallout from the fast-spreading Omicron variant kept the safe-haven US dollar depressed near the weekly low. This could further act as a tailwind for the AUD/USD pair and help limit any deeper losses. Traders might also be reluctant to place aggressive bets amid the year-end thin liquidity conditions.
The short-term fundamental backdrop seems tilted in favour of bullish traders, though the Fed's hawkish outlook should limit any meaningful USD downfall and cap gains for the AUD/USD pair. It is worth recalling that the so-called dot plot indicated that the Fed could hike interest rates at least three times next year amid rising inflationary pressures.
The expectations were reaffirmed by Thursday's strong Personal Consumption Expenditures (PCE) data. In fact, the Fed's preferred inflation gauge — the PCE Price Index — accelerated to 5.7% YoY in November, marking the largest annual growth since 1982. This could have boosted bets for an eventual Fed liftoff in March 2022, which should help revive the USD demand.
Technical level to watch
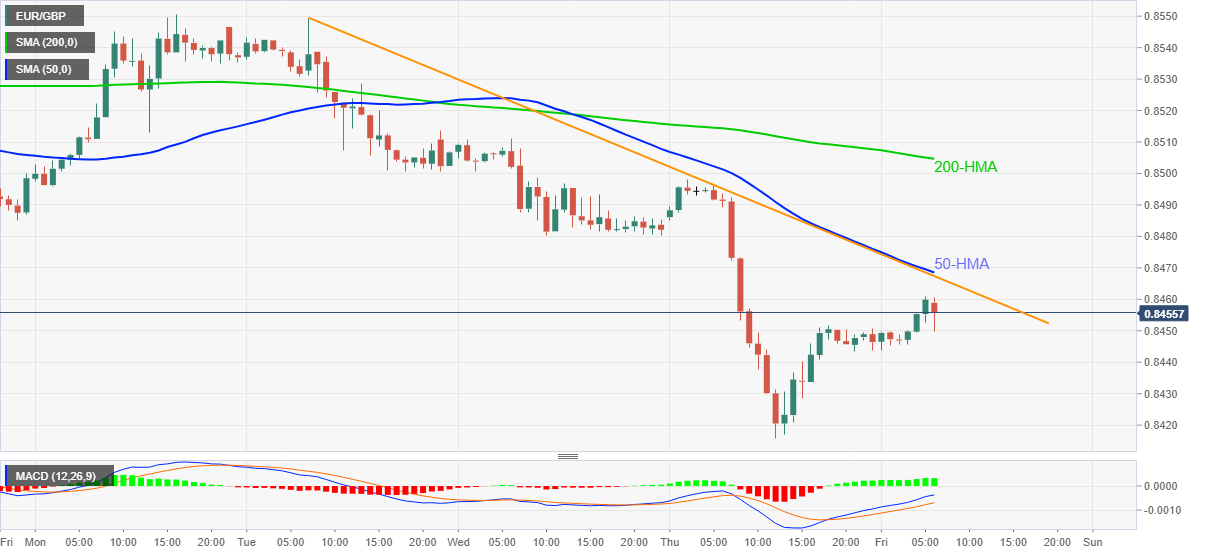
- EUR/GBP bounces off monthly low to snap three-day declines.
- Bullish MACD signals hint at further rebound but 50-HMA, weekly resistance line tests immediate upside.
- Sellers remain on the way to yearly low until crossing 200-HMA.
EUR/GBP rises 0.10% on a day to post the first daily upside in four around 0.8455, retreating from the intraday top during Friday’s European morning.
Although the bullish MACD signals keep the EUR/GBP pair buyers hopeful, a convergence of short-term descending trend line and 50-HMA, around 0.8470 restricts the quote’s nearby advances.
Also acting as an upside filter is the 0.8480 level and the 200-HMA surrounding 0.8505.
In a case where the EUR/GBP prices remain firmer past 0.8505, the weekly top of 0.8550 should lure the bulls.
Alternatively, fresh declines may initially aim for 0.8440 and the recent lows near 0.8415.
However, any further weakness past 0.8415 won’t hesitate to challenge the yearly low of 0.8380, marked in November.
EUR/GBP: Hourly chart
Trend: Further weakness expected
- GBP/JPY reverses from monthly high, stays offered near intraday low.
- Market sentiment dwindles amid light calendar, holiday mood.
- Brexit woes, fears of rising Omicron cases and Sino-American tussles test previous risk-on mood.
GBP/JPY snaps three-day uptrend, down 0.17% intraday around 153.20 during early Friday morning in Europe. The cross-currency pair refreshed the monthly high the previous day before taking a U-turn from 153.70.
The pair’s latest weakness could be linked to the market’s consolidation during the Christmas holidays in the West. Adding to the bearish bias are the recent doubts over Merck’s Covid-19 pill, which got US Food and Drug Administration’s (FDA) approval on Thursday.
On the same line were headlines concerning the all-time high covid cases in the UK, as well as rising infections in Europe.
Additionally, chatters over French readiness to fight a legal battle over fishing licenses with the UK join firmer US Treasury yields to weigh on the GBP/JPY prices. Not only the firmer yields but the mixed performance of Asia-Pacific stocks also weighs on the pair.
Even so, recent studies showing the fewer odds of hospitalization due to the South African covid variant, dubbed as Omicron, keep the risk-aversion at a limited distance.
That being said, GBP/JPY traders should keep a track of the risk catalysts amid a light calendar and Christmas Eve holiday in the West for fresh impulse.
Technical analysis
GBP/JPY remains bullish until providing a daily closing below the 200-DMA level of 152.50. That said, a downside break of 50-DMA level near 153.20 may extend short-term pullback.
- USD/CHF remains pressured around multi-day low during three-day downtrend.
- Bearish MACD signals, 0.9215 key support break favors sellers.
- Bulls need validation from 0.9255, bears eye four-month-old ascending trend line.
USD/CHF stays depressed around a three-week low, down 0.08% on a day near 0.9170 during early Friday.
The Swiss currency (CHF) pair’s latest loss could be linked to the clear downside break of the 200-DMA. Also adding to the bearish bias are the downbeat MACD signals and sustained trading below 0.9215 support-turned-resistance confluence including 100-DMA and an upward sloping trend line from November 01.
That said, the USD/CHF bears are on the way to a four-month-old support line, near 0.9130. Though, any further weakness will be challenged by the 0.9100 threshold and November’s low of 0.9088.
Meanwhile, corrective pullback remains elusive below the 200-DMA level of 0.9178, a break of which will recall the 0.9200 round figure on the chart.
It’s worth noting that USD/CHF sellers keep the reins until witnessing a clear upside break of the 0.9215 resistance confluence stated above.
Even so, multiple levels marked since late October offer additional filters to the north around 0.9255.
USD/CHF: Daily chart
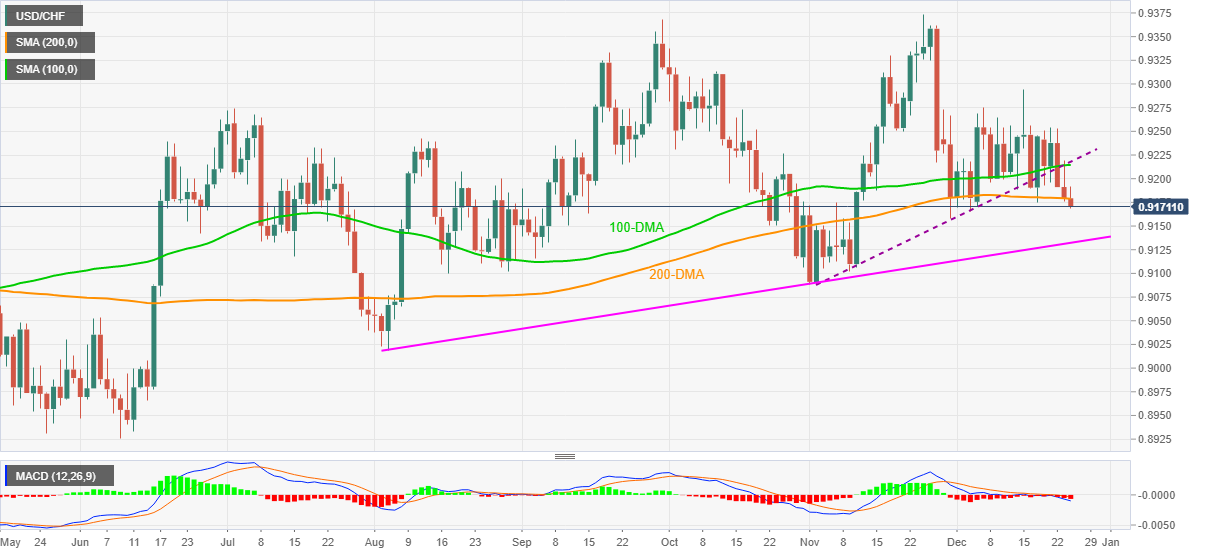
Trend: Further weakness expected
- Gold stayed mildly bid around weekly top before Christmas Eve.
- Risk-on mood battles recently firmer yields to test buyers.
- Sellers need to conquer strong hurdles to retake controls.
- Gold 2022 Outlook: Correlation with US T-bond yields to drive yellow metal
Gold (XAU/USD) prices refreshed weekly high before turning dead around $1,810 as market players struggle for fresh clues during the Christmas holidays in the West.
The yellow metal buyers initially cheered optimism tackling the South African covid variant, dubbed as Omicron, as well as US President Joe Biden’s Build Back Better (BBB). However, firmer US data propelled the Treasury yields to a monthly peak and challenged the buyers afterward. Also testing the gold buyers were pessimism surrounding the Sino-US relations and doubts over the recently approved covid pills, not to forget US Senator Joe Manchin’s full-stop to negotiations over the current version of the Build Back Better Act.
That said, the gold bulls have an upper hand considering the cautious optimism in the market but the bears are lurking for entry while waiting for fresh clues. As a result, the final days of 2021 are likely to restrict the gold price moves amid an absence of major data/events.
Read: Gold Price Forecast: XAU/USD portrays Christmas mood above $1,800
Gold Price: Key levels to watch
The Technical Confluences Detector shows that the gold prices have already crossed the key hurdles around $1,804 and $1,809 but refrained to cross the weekly high near $1,814.
That said, the latest advances aim for $1,814 comprising Bollinger Band four-hour upper, previous weekly high and pivot point one-day R1.
Following that, the metal’s run-up towards the $1,823 level including pivot point one-week R1 can’t be ruled out. However, any further advances will be challenged by the $1,834 level comprising 61.8% Fibo. on monthly, as well as tops marked during July and September.
On the contrary, Fibonacci 38.2% one-day, SMA 200 on four-hour and Bollinger Band one-day upper will restrict the immediate downside around $1,809.
Also acting as short-term key support is $1,804 level that encompasses Fibonacci 61.8% one-day, Bollinger Band one-hour lower and SMA 10 on four-hour.
Even if the quote drops below $1,804, SMA 50 one-day and Fibonacci 23.6% one-week will offer an additional filter to the south before directing the quote towards $1,791 that has SMA 10 one-day and Fibonacci 38.2% one-week.
Here is how it looks on the tool
About Technical Confluences Detector
The TCD (Technical Confluences Detector) is a tool to locate and point out those price levels where there is a congestion of indicators, moving averages, Fibonacci levels, Pivot Points, etc. If you are a short-term trader, you will find entry points for counter-trend strategies and hunt a few points at a time. If you are a medium-to-long-term trader, this tool will allow you to know in advance the price levels where a medium-to-long-term trend may stop and rest, where to unwind positions, or where to increase your position size.
- USD/IDR bounces off two-month low flashed on Wednesday.
- BI’s Warjiyo expects firmer bond yields but shrugs off rate hike calls.
- Asia-Pacific markets remain quiet, mildly amid virus-linked risk-on mood.
USD/IDR seesaws around $14,210, following an uptick to $14,250, during early Friday morning. In doing so, the Indonesian rupiah (IDR) pair prints daily gains for the first time in four days while bouncing off the monthly low marked two days before, also the lowest levels since October.
The corrective pullback move could be linked to the Bank Indonesia (BI) Governor Perry Warjiyo’s comments, shared by Reuters at the latest.
“Indonesian bonds will have to rise by 50 basis points (bps) next year to match an expected increase of 50 to 75 bps in U.S. Treasury yields as the United States tightens monetary policy,” said BI’s Warjiyo.
The Indonesia central bank boss also predicted the increase in inflation would start in the third quarter of 2022, per the news. However, the BI leader reiterated the bank's pledge to keep Indonesian interest rates low until inflation started heating up.
On a different page, the Christmas Eve holiday in multiple Western markets and a light calendar restrict the USD/IDR moves. However, upbeat US Treasury yields at the last, backed by the firmer US Core PCE Price Index, not to forget Durable Goods Orders and Michigan Consumer Sentiment Index, favored the pair buyers. Alternatively, positive updates over the covid strain’s cure and studies taming fears of hospitalizations keep the market’s sentiment mildly positive and guard the USD/IDR pair’s immediate upside.
Technical analysis
Unless providing a daily close beyond the $14,283-87 region comprising the 100-DMA and 50-DMA, USD/IDR bears remain hopeful. Alternatively, May’s low around $14,090 lures the pair sellers for now.
- EUR/USD pares intraday losses during a sluggish Asian session.
- Firmer US data propelled yields but concerns over Omicron, stimulus keep buyers hopeful.
- Off in multiple bourses can restrict intraday moves, beware of spikes during thin volumes.
EUR/USD picks up bids to consolidate intraday losses around 1.1330, down 0.05% during early Friday.
The major currency pair snapped three-day advances the previous day but closed with minor losses. That said, the quote remains sluggish as mixed concerns over the key risk catalysts join the Christmas Eve-linked market inaction.
Among the key positives are the global studies showing the fewer odds of hospitalization due to the South African covid variant, dubbed as Omicron. The US Food and Drug Administration’s (FDA) approval of Merck's Covid-19 pill, a day after approving Pfizer’s pill to battle the Omicron, also favor the risk-on mood and the EUR/USD buyers. Earlier in the week, US Military also conveyed news of developing a single cure for covid and all variants.
Alternatively, the French cancellation of orders for Merck’s pill, citing notably lesser effect than promoted, joins a steady rise in Omicron cases to challenge the market optimism and EUR/USD prices. Further, the US data that underpinned the US Treasury yields to refresh monthly high near 1.50% also weigh on the pair as the last comment from a Fed policymaker, namely Christopher Waller, were hawkish and signaled rate hikes in early 2022.
That said, upticks in the Fed’s preferred gauge of inflation, namely the Core PCE Price Index, not to forget Durable Goods Orders and Michigan Consumer Sentiment Index, favored the bond bears of late.
Elsewhere, indecision over US President Joe Biden’s Build Back Better (BBB) plan and China’s dislike for the American passage of a bill that highlights Uyghur minority issues, as well as rising covid cases in Europe and resulted activity restrictions, also challenge the risk-on mood and test the EUR/USD buyers.
As most American and European markets will remain closed on Friday, due to Christmas Holiday, thin market liquidity and a light calendar should play their role to restrict immediate EUR/USD moves.
Technical analysis
200-EMA on four-hour chart joins resistance line of a monthly symmetrical triangle to restrict short-term EUR/USD upside around 1.1350. However, the 100-EMA level of 1.1300 is likely to challenge the immediate downside, if not then a subsequent fall towards 1.1270 becomes imminent.
- USD/TRY consolidates recent losses around six-week low, sidelined of late.
- Turkish FinMin Nebati conveyed success of ‘dollarization’ measures.
- US Treasury yields, firmer US data also back corrective pullback amid quiet session.
- Bulls remain hopeful considering CBRT’s refrain from rate hikes despite heavy inflation.
USD/TRY holds onto the previous day’s bounce-off mid-November lows around $11.55 during early Friday morning in Europe.
The Turkish lira pair justifies the market’s consolidation amid lackluster Asian session and ultra-thin volumes due to the holiday mood. In doing so, the USD/TRY fails to portray optimism over the Turkey government actions cheered by Finance Minister (FinMin) Nureddin Nebati.
“Turks transferred 10 billion lira ($889 million) worth of forex deposits into a new instrument the government introduced this week that covers any FX depreciation losses,” said Turkish FinMin Nebati on Thursday per Reuters.
Nebati also praised the government’s plan to intervene through the central bank or Treasury on broadcaster NTV while adding, “Is Turkey an unskillful country that watches the developments by itself and doesn't use all the instruments at its disposal in a positive way? It uses all the instruments."
It should, however, be noted that the dollarization plan has led to the exhaustion of the Turkish central bank reserves, which in turn could lead the future greenback demand. Additionally, the latest words from a Fed policymaker, namely Christopher Waller, were hawkish and signaled rate hikes in early 2022, which in turn challenge the USD/TRY pair’s further downside considering the latest upbeat US data and tapering.
For the day, an off in multiple western markets and a light calendar could restrict the pair moves.
Technical analysis
A convergence of 100-DMA and an ascending support line from early September, near $10.10, becomes the key level to reject the recovery hopes.
- Indian Rupee takes on the US dollar in a sharp move.
- USD/INR bulls could be looking to step in for a scalp towards prior H1 resistance.
In a risk-on environment, USD/INR has suffered a very hard landing into a daily support structure and the following illustrates the prospects of near term correction in holiday thin markets.
USD/INR daily chart
-637759138566067396.png)
As illustrated, there is now some room for a correction from the daily support structure that could target the prior highs looking left that have confluence with the 38.2% Fibonacci retracement level. This is located near to 75.60.
USD/INR H1 chart
-637759141116305581.png)
From an hourly perspective, the price has already rallied to the 61.8% Fibo of the hourly impulse. If this breaks, then the bulls will be well and truly in control. 75.50s will be eyed.
- NZD/USD remains pressured around intraday low, prints daily losses for the first time in four.
- Sustained break of 21-DMA, bullish MACD favor buyers to approach a wall of resistance.
NZD/USD refreshes intraday low to 0.6811, down 0.28% on a day, to become the biggest G10 loser on a sluggish Friday morning. In doing so, the Kiwi pair snaps a three-day uptrend to ease from the highest level in three weeks.
Although the 0.6800 threshold becomes imminent support to watch during the latest easing, the 21-DMA level of 0.6785 will restrict the pair’s further downside.
In a case where the quote drops below 0.6785, the 0.6740 level may act as a buffer before dragging the quote towards the yearly low surrounding 0.6700.
On the flip side, sustained trading beyond 21-DMA enables NZD/USD buyers to attack a horizontal area comprising multiple levels marked since September, around 0.6855-60.
While the quote’s advances past 0.6860 seem difficult, a successful run won’t hesitate to challenge the 100-DMA level of 0.6985.
To sum up, NZD/USD prices are likely to witness further correction further the bulls aren’t out of the woods.
NZD/USD: Daily chart
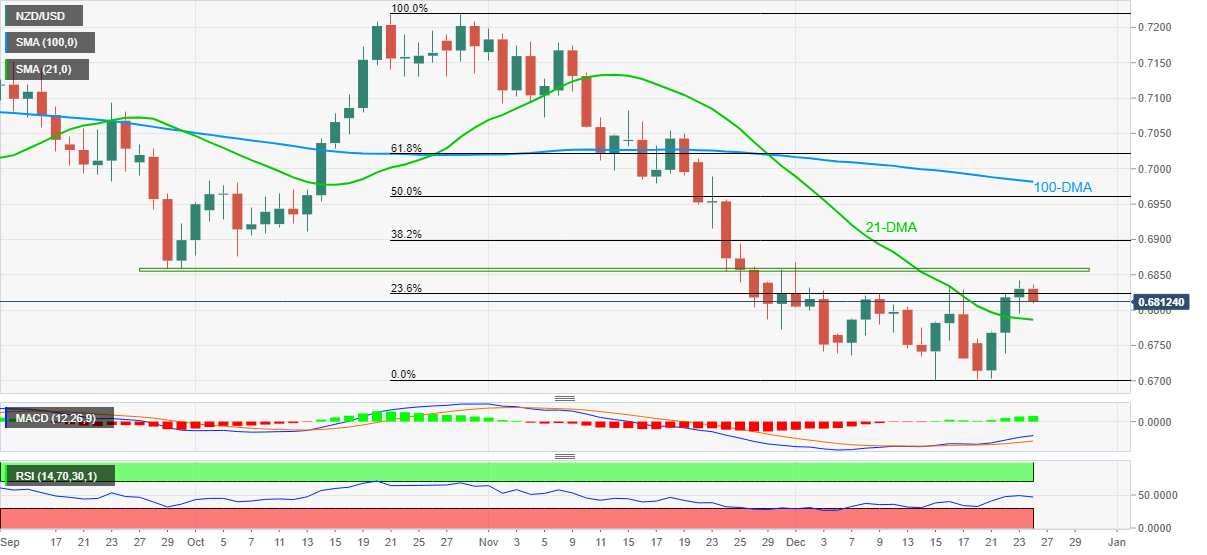
Trend: Further consolidation of recent gains expected
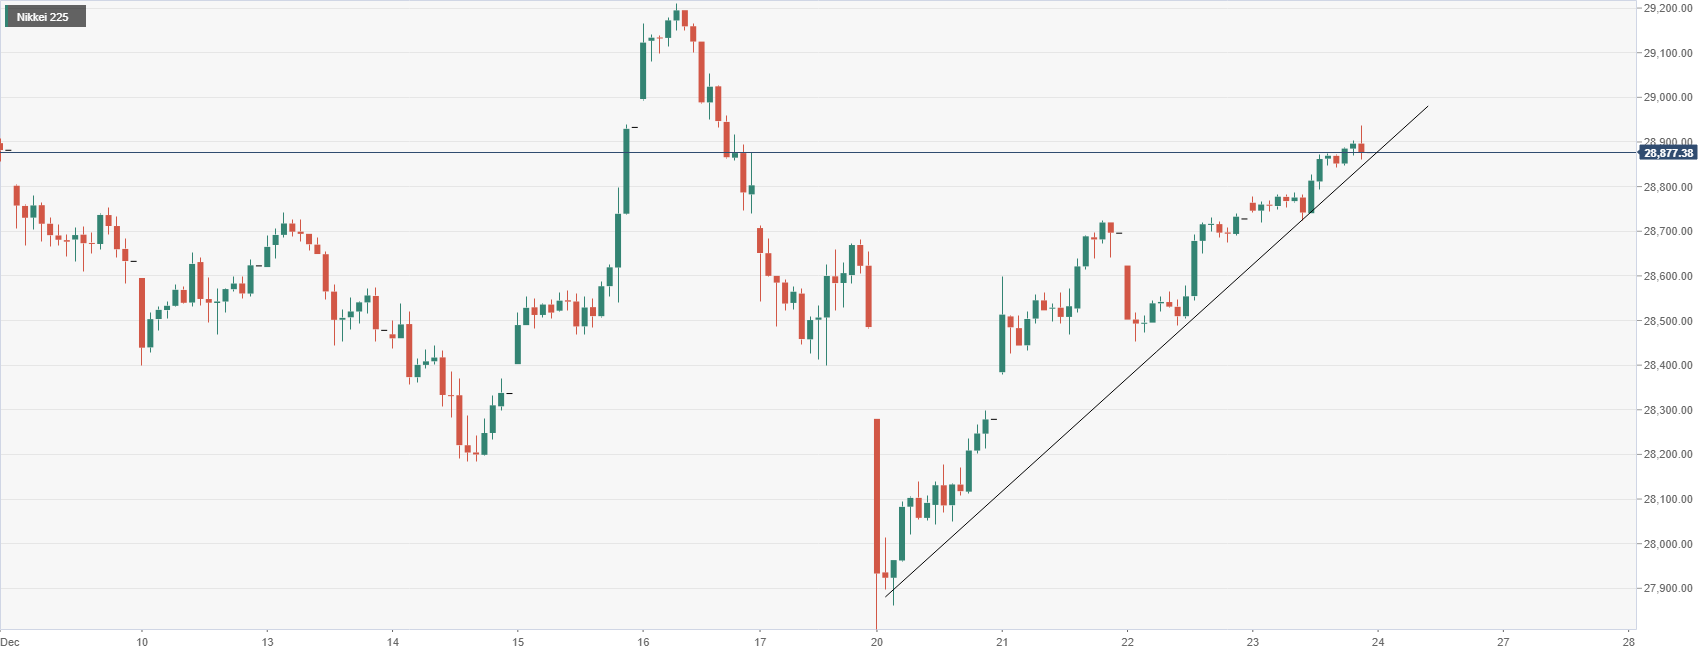
Asian stock markets have joined Wall Streets recovery this week into the 11th hour ahead of the Christmas holidays as traders cheer the positive sentiment around the omicron variant of the COVID-19 virus. The S&P 500 was closing at a new record.
In Japan, the Nikkei 225 opened and stays higher on the day so far. It is trading at 28,282 at the time of writing on news that US authorities approved Pfizer's (PFE) oral COVID-19 drug and following South African reporting that the omicron variant is relatively mild.
Additionally, AstraZeneca (AZN) said its Evusheld preventive antibody retained its neutralizing activity against the omicron variant in clinical trials conducted by Oxford University in the UK and the University of Washington in the US.
Meanwhile in data today for Japan, the Japan National CPI (YoY) in November came in at 0.6% (exp 0.5%; prev 0.1%). The National CPI Ex-Fresh Food (YoY) for November arrived at 0.5% (exp 0.4%; prev 0.1%) The National CPI Ex-Fresh Food, Energy (YoY) for the same month came in at -0.6% (exp -0.6%; -0.7%). This was, yet again, missing the Bank of Japan's target by a mile.
Elsewhere, Hong Kong’s Hang Seng index advanced 0.48%. Mainland Chinese stocks were also in positive territory, with the Shanghai composite fractionally higher.
In Australia, the S&P/ASX 200 added 0.62%.
Meanwhile, some markets in Asia-Pacific, including Australia, Singapore and Hong Kong, are set to close early on Friday due to Christmas Eve. In the US, the stock market will be closed in observation of Xmas day that falls on a Saturday.
Nikkei H1 chart
| Raw materials | Closed | Change, % |
|---|---|---|
| Brent | 76.63 | 1.77 |
| Silver | 22.9 | 0.46 |
| Gold | 1807.782 | 0.23 |
| Palladium | 1938.54 | 3.85 |
- Gold prices remain inactive following an upward grind near the weekly top.
- Risk-on mood, softer USD favored gold buyers despite firmer yields.
- Omicron, US stimulus and China are the key catalysts to watch for short-term direction.
- Gold 2022 Outlook: Correlation with US T-bond yields to drive yellow metal
Gold (XAU/USD) prices hang in balance around $1,809, after refreshing the week’s high to $1,810 the previous day. In doing so, the yellow metal shows the typical market inactivity during Christmas Eve.
That said, the bulls recently cheered optimism concerning the fewer odds of hospitalization due to the South African covid variant, dubbed as Omicron. Also positive for gold was the US Food and Drug Administration’s (FDA) approval of Merck's Covid-19 pill, a day after approving Pfizer’s pill to battle the Omicron. Earlier in the week, US Military also conveyed news of developing a single cure for covid and all variants.
It should be noted, however, that the French cancellation of orders for Merck’s pill, citing notably lesser effect than promoted, joins a steady rise in Omicron cases to challenge the market optimism and gold prices.
On the same line were the firmer US data that underpinned the US Treasury yields to refresh monthly high near 1.50%. Among the key economics, upticks in the Fed’s preferred gauge of inflation, namely the Core PCE Price Index, not to forget Durable Goods Orders and Michigan Consumer Sentiment Index, favored the bond bears of late.
Additionally, indecision over US President Joe Biden’s Build Back Better (BBB) plan and China’s dislike for the American passage of a bill that highlights Uyghur minority issues also challenge the risk-on mood and test the gold buyers.
Distantly, the latest words from a Fed policymaker, namely Christopher Waller, were hawkish and signaled rate hikes in early 2022, which in turn challenge the metal’s further upside.
Above all, holiday-thinned market volume and off in multiple Western bourses could challenge momentum traders.
Technical analysis
Gold prices seesaw around 200-SMA as sluggish MACD and nearly overbought RSI line suggest pullback but an absence of market moves keep the recovery moves intact.
That said, the $1,800 round figure holds the key for the metal’s fresh declines targeting the 100-SMA level near $1,785.
It should be noted, however, that multiple supports near $1,770 and the early December low of $1,762 may test bears before directing them to the monthly low close to $1,753.
Alternatively, tops marked during late November and the monthly high, close to $1,814-16, challenges short-term gold buyers before directing them to the highs marked in July and September around $1,834.
Gold: Four-hour chart
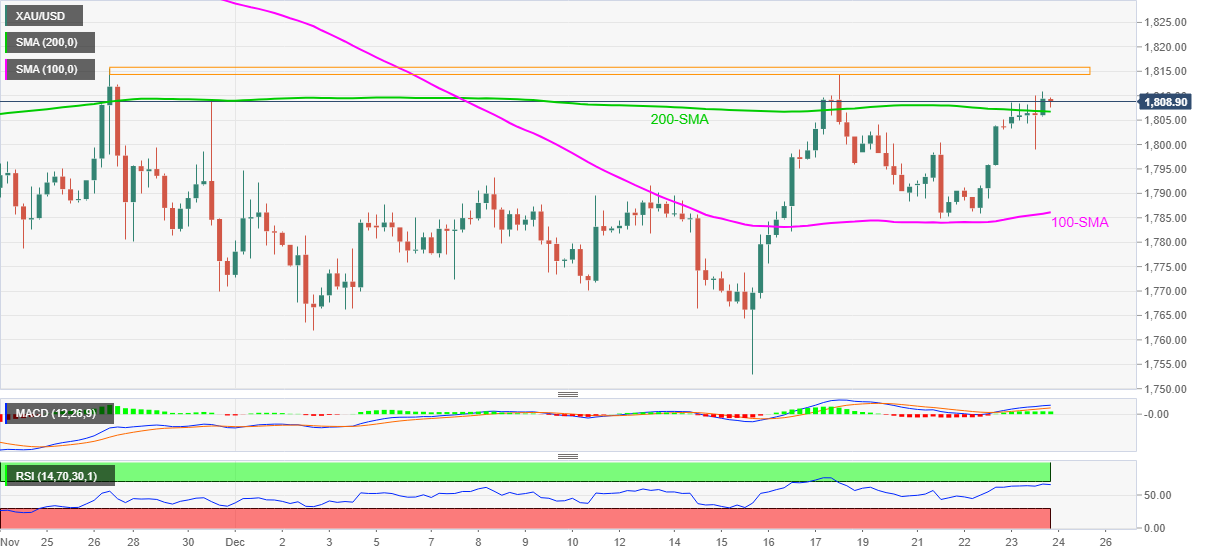
Trend: Pullback expected
- GBP/USD bears are taking control from weekly resistance.
- The weekly W-formation is a compelling reversion pattern.
GBP/USD has started to consolidate on the longer-term time frames which leave the downside exposed for the forthcoming days as per the following analysis of the weekly chart.
GBP/USD weekly chart
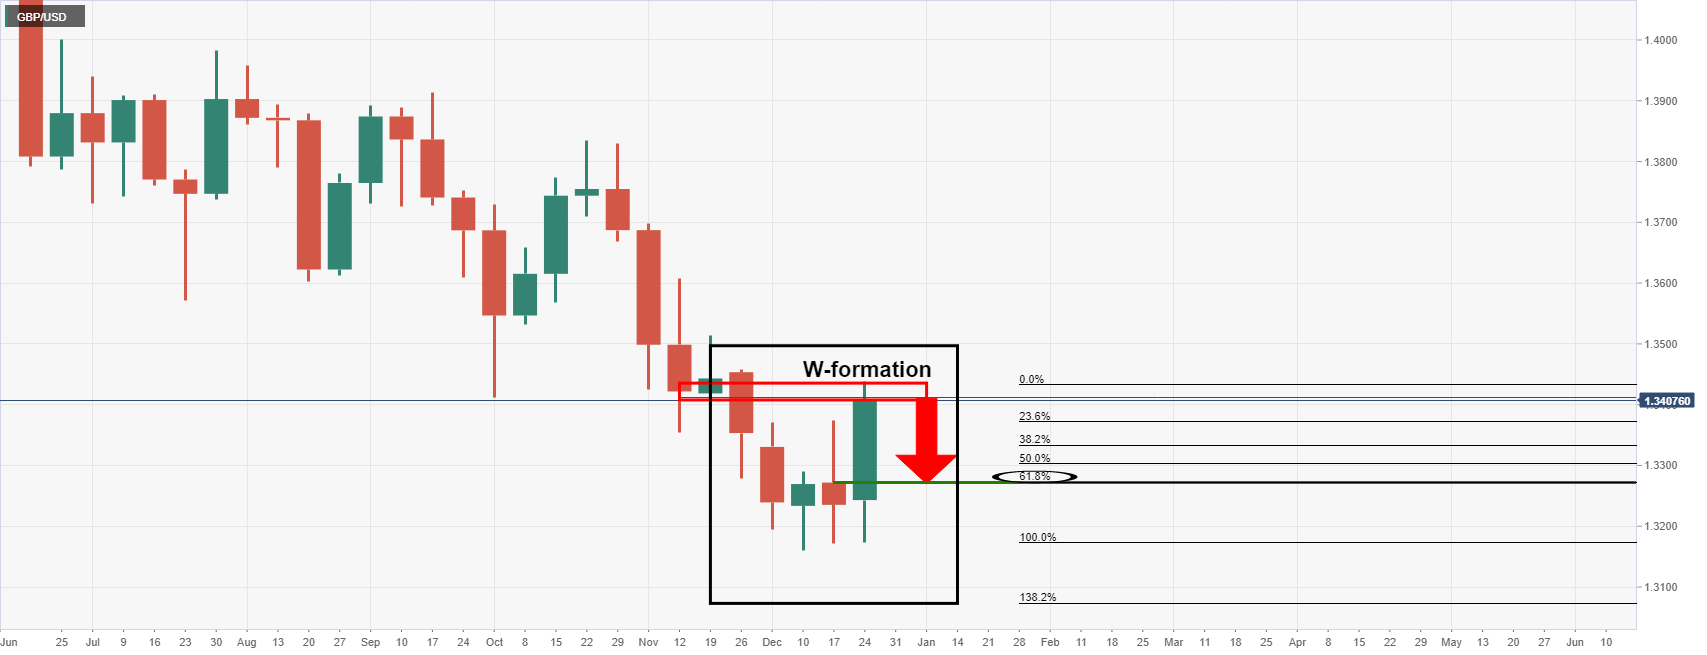
The hourly chart revealed a series of support structures on the way to the W-formation's neckline on the weekly chart above.
GBP/USD H1 chart
On the way to the weekly chart's W-formation's neckline, near 1.3270, the bears first need to breach 1.3380 and then 1.3340 as the daily chart's 23.6% and 38.2% Fibonacci retracements:
GBP/USD daily chart
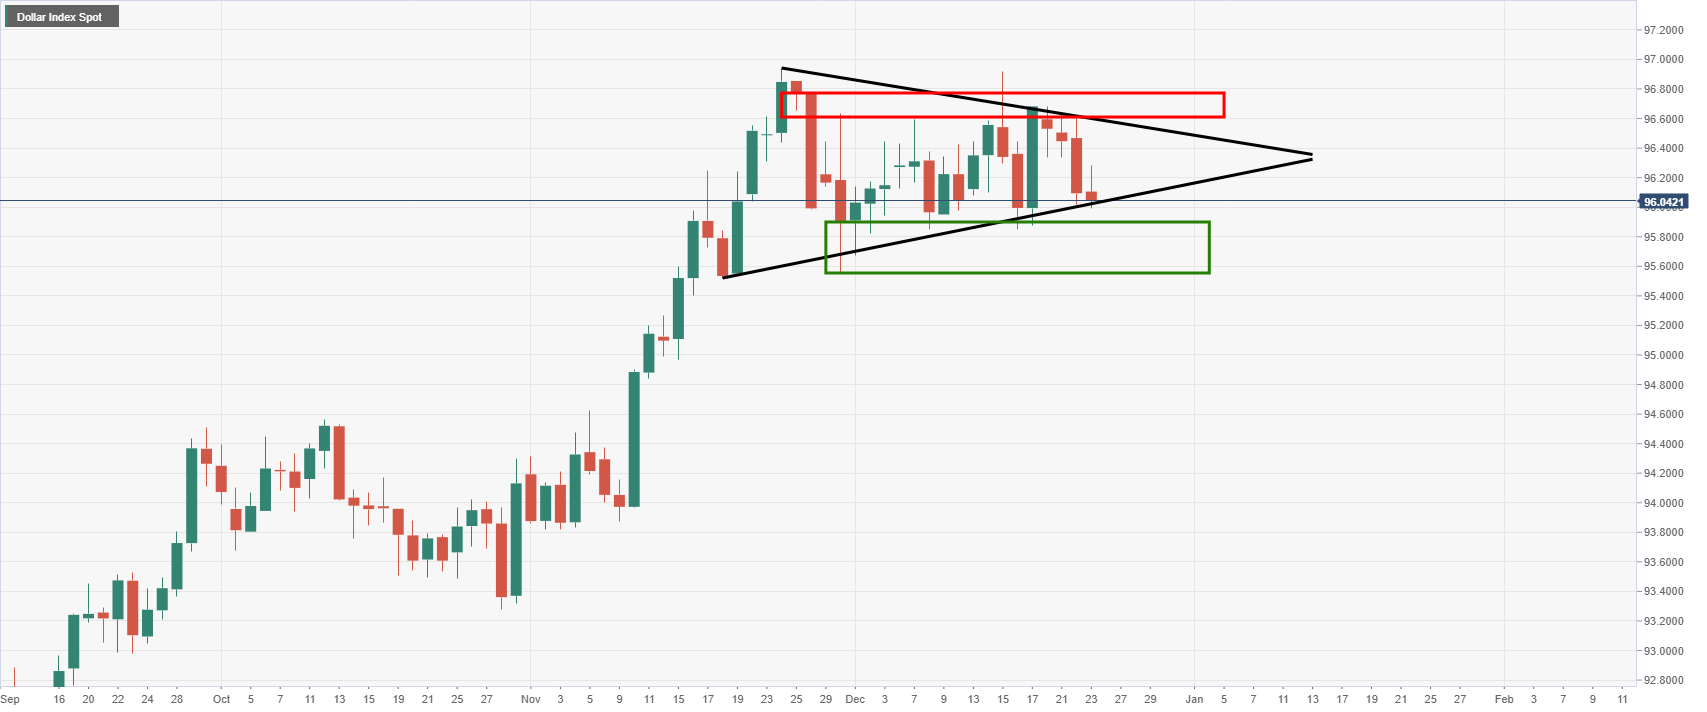
- DXY pauses four-day declines while bouncing off one-week low, stays pressured though.
- Firmer yields, strong data seems to have tested greenback bulls.
- Upbeat sentiment, holiday mood and off in the West will test momentum traders.
US Dollar Index (DXY) bears take a breather around the weekly low near 96.00 during Friday’s Asian session.
The greenback gauge dropped consecutively in the last four days before bouncing off 95.98-98 support confluence. Adding strength to the corrective pullback could be the rebound in the US 10-year Treasury yields and consolidation of the latest losses during the holiday mood.
The US 10-year Treasury yields refreshed the monthly high to 1.50%, before ending Thursday’s North American session with 3.5 basis points (bps) of an upside to 1.493%.
The market’s rush towards selling US Treasury bonds could be linked to the mixed updates concerning the South African variant of covid, namely Omicron, as well as the US stimulus, not to forget strong US data. It should be noted, however, that positive updates over the covid strain’s cure and studies taming fears of hospitalizations keep the market’s sentiment mildly positive and guard the DXY’s immediate upside.
The US Food and Drug Administration (FDA) also approved Merck's Covid-19 pill on Thursday, a day after approving Pfizer’s pill to battle the Omicron on Wednesday. Earlier in the week, US Military also conveyed news of developing a single cure for covid and all variants. Also on the positive side were the studies showing Omicron has lesser scope hospitalization. On the contrary, the French cancellation of orders for Merck’s pill, citing notably lesser effect than promoted, joins a steady rise in Omicron cases to challenge the market optimism.
Elsewhere, US President Joe Biden and House Speaker Nancy Pelosi remain hopeful of getting the Build Back Better (BBB) plan through the House even as Senator Joe Manchin opposes the bill. As per the latest news from CNN, “Sen. Joe Manchin effectively put an end to negotiations over the current version of the Build Back Better Act, in part over concerns that some provisions might exacerbate inflation. But many economists believe its effect on inflation would be marginal.”
Furthermore, upbeat prints of the Fed’s preferred gauge of inflation, namely the Core PCE Price Index, not to forget Durable Goods Orders and Michigan Consumer Sentiment Index, also favored the Treasury yields and probed US Dollar Index bears.
Moving on, an off in the majority of the Western markets and a light calendar joins holiday mood elsewhere to restrict DXY moves.
Technical analysis
The 200-SMA on the four-hour chart joins an upward sloping trend line from November 30 to act as strong support around 96.00, a break of which could quickly refresh the monthly low. On the contrary, the US Dollar Index rebound need validation from the 96.35 resistance level to convince the short-term buyers.
- WTI crude oil consolidates recent gains, pressured around intraday low.
- Bullish MACD signals join upside breaks of previous key resistance to keep buyers hopeful.
- Further upside awaits $74.65 break, intraday sellers aim for $73.20-15 as immediate support.
WTI crude oil retreats from a one-month high to $73.65 by the end of Thursday’s NY settlement. In doing so, the black gold justifies overbought RSI conditions to pause a three-day uptrend.
However, the quote remains beyond the 200-SMA level of $73.50, which in turn joins the bullish MACD signals to favor energy bulls.
Also adding to the bullish bias is the commodity’s clear upside break of a descending trend line from early November and a horizontal line comprising monthly resistance.
That said, November 21 swing low near $74.65 guards the commodity’s immediate upside ahead of an expected run-up towards the $77.00 threshold. Following that, late November highs near $79.00 and the $80.00 round figure will be watched carefully by WTI buyers.
Alternatively, WTI’s break of the 200-SMA level near $73.50 will immediately drag the quote towards a three-week-old horizontal line, close to $73.30.
Adding to the downside filter is the 50-SMA level of $70.80 and the $70.00 psychological magnet.
However, oil buyers remain positive until the quote stays above the previous resistance line from early November, surrounding $69.75.
WTI: Four-hour chart
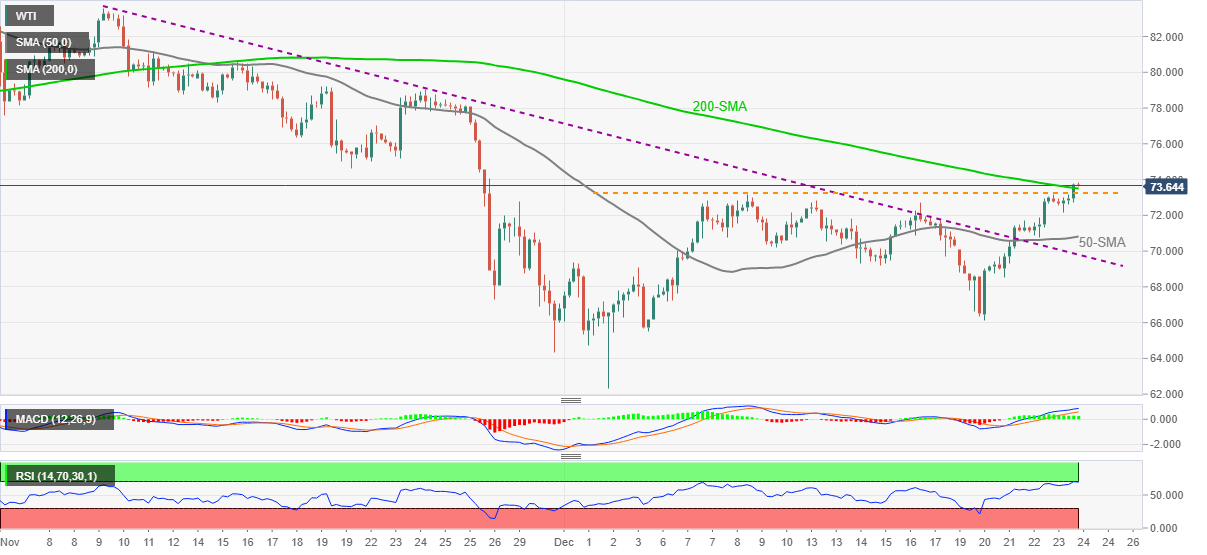
Trend: Further upside expected
| Time | Country | Event | Period | Previous value | Forecast |
|---|---|---|---|---|---|
| 05:00 (GMT) | Japan | Construction Orders, y/y | November | 2.1% | |
| 05:00 (GMT) | Japan | Housing Starts, y/y | November | 10.4% | 7.1% |
In recent trade today, the People’s Bank of China (PBOC) set the yuan (CNY) at 6.3692 vs. estimate of 6.3661.
About the fix
China maintains strict control of the yuan’s rate on the mainland.
The onshore yuan (CNY) differs from the offshore one (CNH) in trading restrictions, this last one is not as tightly controlled.
Each morning, the People’s Bank of China (PBOC) sets a so-called daily midpoint fix, based on the yuan’s previous day closing level and quotations taken from the inter-bank dealer.
- EUR/JPY bears are lurking in weekly resistance.
- 129 the figure guards a deeper retracement to the weekly W-formation's neckline.
EUR/JPY is stalling on the upside and the bears are lurking, expecting a correction. The following illustrates the outlook from the bearish perspective which leaves 129 the figure exposed.
EUR/JPY monthly analysis

The monthly chart is correcting to a 38.2% Fibonacci retracement of the prior bearish impulse. This could hold and lead to a downside continuation deeper into the support zone.
EUR/JPY weekly chart

The W-formation on the weekly chart is also compelling. The formation is a reversion pattern and leaves the neckline exposed near to 128.40.
EUR/JPY daily chart

On the daily chart, the price is already stalling and the 38.2% Fibi is aligned with the old structure near 128.90.
- USD/CAD stays defensive around one-week low, mildly bid on a day.
- Oil bulls take a breather at the monthly top.
- Mixed updates over Omicron, US stimulus join holiday mood to restrict market moves.
USD/CAD bounces off 20-DMA to consolidate weekly losses around 1.2815, up 0.10% intraday during early Friday.
The loonie pair tracks a pause in the prices of Canada’s key export item WTI crude oil to print the latest corrective pullback. However, lackluster markets during the holiday season challenge the moves of late.
That said, Thursday’s firmer US Treasury yields and upbeat prints of the Fed’s preferred gauge of inflation, namely the Core PCE Price Index, seemed to have prepared the based for the USD/CAD buyer’s return. It should be noted that Canadian GDP matched 0.8% upbeat forecasts, versus 0.2% upwardly revised prior, for October.
In addition to the firmer US data, indecision over the Omicron conditions and US stimulus also challenge the pair’s further downside.
The US Food and Drug Administration (FDA) also approved Merck's Covid-19 pill on Thursday, a day after approving Pfizer’s pill to battle the Omicron on Wednesday. Earlier in the week, US Military also conveyed news of developing a single cure for covid and all variants. Also on the positive side were the studies showing Omicron has lesser scope hospitalization. On the contrary, the French cancellation of orders for Merck’s pill, citing notably lesser effect than promoted, joins a steady rise in Omicron cases to challenge the market optimism.
Elsewhere, US President Joe Biden and House Speaker Nancy Pelosi remain hopeful of getting the Build Back Better (BBB) plan through the House even as Senator Joe Manchin opposes the bill. As per the latest news from CNN, “Sen. Joe Manchin effectively put an end to negotiations over the current version of the Build Back Better Act, in part over concerns that some provisions might exacerbate inflation. But many economists believe its effect on inflation would be marginal.”
Amid these plays, the US 10-year Treasury yields refreshed yearly high and the Wall Street benchmarks also posted gains. However, the Asia-Pacific stocks are lackluster by the press time.
Given the off in most of the Western markets and a light calendar, the USD/CAD prices are expected to remain sidelined amid a lack of major data/events.
Technical analysis
Although the 20-DMA restricts the immediate downside of the USD/CAD prices near the 1.2800 round figure, a clear break of an upward sloping trend line from December 08, close to 1.2885, tests the quote’s rebound.
- AUD/USD fails to extend three-day uptrend, pressured of late.
- RSI, MACD join 20-DMA breakout to keep buyers hopeful.
- September’s low lures short-term sellers, key SMAs also challenge the bulls.
AUD/USD fades the bounce off intraday low, down 0.16% on a day around 0.7235 during Friday’s Asian session. In doing so, the Aussie pair snaps a three-day run-up while stepping back from a short-term key resistance.
Although a clear upside break of 20-DMA and bullish MACD signals favor AUD/USD bulls, an upward sloping trend line from November 30, around 0.7250, challenges the immediate advances.
Even if the quote manages to cross the stated hurdle near 0.7250, the 50-DMA and the 100-DMA, around 0.7285 and 0.7295 respectively, will act as tough resistances for the pair buyers to cross. Adding to the upside filters is the 0.7300 threshold, a break of which will escalate the run-up towards the mid-November swing high near 0.7370.
Alternatively, pullback moves may initially aim for the 0.7200 round figure before challenging September’s low near 0.7170. Should the AUD/USD bears remain dominant past 0.7170, the 20-DMA level of 0.7135 will flash on their radars.
To sum up, AUD/USD is likely to consolidate recent gains but holiday mood in the market will join strong supports to restrict the downside.
AUD/USD: Daily chart

Trend: Pullback expected
- GBP/USD pauses three-day uptrend to consolidate recent gains inside a choppy range.
- France to extend Brexit fights over fishing licences to 2022, BCC conveyed Brexit woes for UK firms.
- British study cites lower hospitalization rate for Omicron, record virus cases.
- Firmer yields, light calendar and holiday mood to test cable traders.
GBP/USD adheres to consolidation of the recent gains, like other major currency pairs, during the quiet Asian session on Friday. The cable pair refreshed the monthly top to 1.3437 the previous day before recently taking rounds to 1.3410.
Fresh challenges to the GBP/USD prices could have come from the Brexit front, as well as firmer yields by the end of Thursday’s North American session. Holiday mood and light volume add to the trading filters.
Among the key Brexit negatives was news from France, conveyed by Reuters, “Litigation against Britain on the issue of post-Brexit fishing licenses will be kicked-off in early January, French Europe Minister Clement Beaune told France 2 television on Thursday.”
On the same line were the results of the British Chambers of Commerce (BCC) survey for October. The results mention that 45% of businesses found it very or relatively difficult to trade goods with the EU, up from 30% in January when the Trade and Cooperation Agreement (TCA) came into effect, per Reuters.
Elsewhere, multiple studies showing fewer odd of hospitalization due to Omicron, including those from the UK, joining the US Food and Drug Administration’s (FDA) approval to Merck's Covid-19 pill on Thursday to underpin the market’s risk-on mood.
However, French cancellation of orders for Merck’s pill, citing notable lesser effect than promoted, joins steady rise in Omicron cases to challenge the optimism. That said, Sky News mentions, “The Office for National Statistics said around 1.4 million people in the UK were probably infected with COVID-19 in the week ending 16 December, which is the highest figure since comparable records began in autumn 2020.”
Talking about the data, US Durable Goods Orders and PCE Price Index for November came in firmer but couldn’t reverse the previous run-up of equities and riskier assets despite favoring the US Treasury yields before the close.
While a light calendar and a reassessment of the risk catalysts seem to trigger the GBP/USD pullback, the holiday mood may restrict the quote’s short-term moves.
Technical analysis
A clear upside break of the monthly ascending trend line, near 1.3375, helps GBP/USD buyers to aim for the 50-DMA resistance surrounding 1.3450.
| Pare | Closed | Change, % |
|---|---|---|
| AUDUSD | 0.72426 | 0.43 |
| EURJPY | 129.607 | 0.31 |
| EURUSD | 1.13276 | 0.05 |
| GBPJPY | 153.485 | 0.8 |
| GBPUSD | 1.34149 | 0.52 |
| NZDUSD | 0.68243 | 0.23 |
| USDCAD | 1.28079 | -0.23 |
| USDCHF | 0.9183 | -0.11 |
| USDJPY | 114.418 | 0.28 |
- USD/JPY bulls are in charge in the final days of the year.
- The risk-on sentiment has damaged the yen as investors cheer the COVID headlines.
USD/JPY is perched in bullish territory although the W-formation on the daily chart could be troublesome for the bulls in the next few days. At the time of writing, the pair is trading at 114.45 and has moved between a low of 114.32 and a high of 114.47.
Risk sentiment improved this week due to a stream of cautiously positive headlines which have been weighing on the greenback and the yen. Investors are expecting that COVID variants will not disrupt global development after all and this has given the bulls on Wall Street good reason to get on board the Santa Claus rally.
AstraZeneca (AZN) said its Evusheld preventive antibody retained its neutralizing activity against the omicron variant in clinical trials conducted by Oxford University in the UK and the University of Washington in the US.
Santa Claus rally took off to fresh highs
The recent covid-variant news is a breath of fresh air for investors that have otherwise been concerned by a combination of virus fears, tighter policy, and a bleak outlook for US fiscal stimulus.
Closing at all-time closing highs, the S&P rose 0.6% to 4,725.78, up 2.3% in the holiday-shortened week marking three straight daily gains. The Nasdaq Composite advanced 0.9% to 15,653.37 and the Dow Jones Industrial Average gained 0.6% to 35,950.63, but those indices remained below record highs set in November.
As for the bond markets, the 10-year US Treasury yield rose to 1.50% on the last full day of trade in the bonds and stocks before Xmas Eve, (the bond market was to close at 2 pm ET ahead of a market holiday Friday, while the stock market was slated to remain open until 4 as usual but it seems it will be closed in observation of Xmas day that falls on a Saturday).
The greenback, as measured by the DXY, ended the New York session down some 0.11% and printed a low of 95.99. The index fell from a high of 96.277 within the sideways channel/daily wedge formation:
DXY daily index
Meanwhile, in recent trade, the Japan National CPI (YoY) in November came in at 0.6% (exp 0.5%; prev 0.1%). The National CPI Ex Fresh Food (YoY) for November arrived at 0.5% (exp 0.4%; prev 0.1%) The National CPI Ex Fresh Food, Energy (YoY) for the same month came in at -0.6% (exp -0.6%; -0.7%).
US data in focus
In US data, the US Initial Jobless Claims totalled 205,000 during the week ended December 18, in line with market expectations. Personal Consumption Expenditure Inflation added 0.6% on a monthly basis in November and 5.7% annually, in line with expectations. However, excluding volatile food and energy costs, the measure was up 4.7% year-over-year, the most since 1989 which have helped to keep yield elevated and the US dollar supported.
Additionally, personal income rose 0.4% in November versus market expectations for a gain of 0.5%, while spending grew 0.6% in line with estimates. While there is no data on Frdua, the usual University of Michigan Consumer Sentiment Index was brought forward and it was revised up slightly Thursday to a reading of 70.6 for December from the 70.4 preliminary estimates.
USD/JPY daily chart
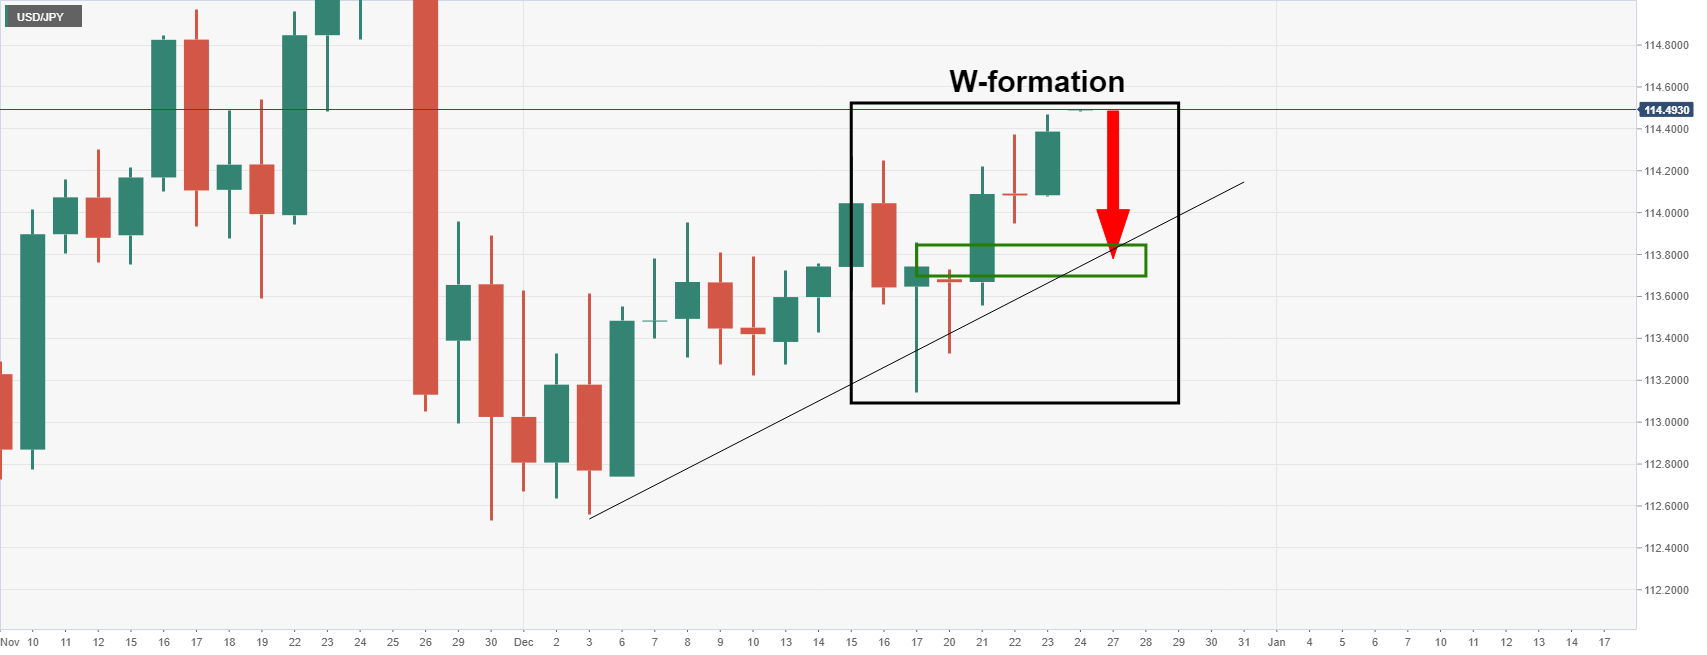
The W-formation is a reversion pattern and the neckline of the pattern would be expected to act as support on a retest near 113.85.


© 2000-2026. All rights reserved.
This site is managed by Teletrade D.J. LLC 2351 LLC 2022 (Euro House, Richmond Hill Road, Kingstown, VC0100, St. Vincent and the Grenadines).
The information on this website is for informational purposes only and does not constitute any investment advice.
The company does not serve or provide services to customers who are residents of the US, Canada, Iran, The Democratic People's Republic of Korea, Yemen and FATF blacklisted countries.
Making transactions on financial markets with marginal financial instruments opens up wide possibilities and allows investors who are willing to take risks to earn high profits, carrying a potentially high risk of losses at the same time. Therefore you should responsibly approach the issue of choosing the appropriate investment strategy, taking the available resources into account, before starting trading.
Use of the information: full or partial use of materials from this website must always be referenced to TeleTrade as the source of information. Use of the materials on the Internet must be accompanied by a hyperlink to teletrade.org. Automatic import of materials and information from this website is prohibited.
Please contact our PR department if you have any questions or need assistance at pr@teletrade.global.
transfers