- Analytics
- News and Tools
- Market News
CFD Markets News and Forecasts — 30-03-2021
| Time | Country | Event | Period | Previous value | Forecast |
|---|---|---|---|---|---|
| 00:30 (GMT) | Australia | Private Sector Credit, m/m | February | 0.2% | |
| 00:30 (GMT) | Australia | Private Sector Credit, y/y | February | 1.7% | |
| 00:30 (GMT) | Australia | Building Permits, m/m | February | -19.4% | |
| 01:00 (GMT) | China | Non-Manufacturing PMI | March | 51.4 | |
| 01:00 (GMT) | China | Manufacturing PMI | March | 50.6 | |
| 05:00 (GMT) | Japan | Construction Orders, y/y | February | 14.1% | |
| 05:00 (GMT) | Japan | Housing Starts, y/y | February | -3.1% | |
| 06:00 (GMT) | United Kingdom | Nationwide house price index, y/y | March | 6.9% | 6.5% |
| 06:00 (GMT) | United Kingdom | Nationwide house price index | March | 0.7% | 0.5% |
| 06:00 (GMT) | United Kingdom | Business Investment, y/y | Quarter IV | -11.6% | |
| 06:00 (GMT) | United Kingdom | Business Investment, q/q | Quarter IV | 14.5% | |
| 06:00 (GMT) | United Kingdom | Current account, bln | Quarter IV | -15.7 | |
| 06:00 (GMT) | United Kingdom | GDP, q/q | Quarter IV | 16% | 1% |
| 06:00 (GMT) | United Kingdom | GDP, y/y | Quarter IV | -8.7% | -7.8% |
| 06:45 (GMT) | France | CPI, m/m | March | 0% | |
| 06:45 (GMT) | France | Consumer spending | February | -4.6% | |
| 06:45 (GMT) | France | CPI, y/y | March | 0.6% | |
| 07:55 (GMT) | Germany | Unemployment Change | March | 9 | |
| 07:55 (GMT) | Germany | Unemployment Rate s.a. | March | 6% | |
| 08:00 (GMT) | Switzerland | Credit Suisse ZEW Survey (Expectations) | March | 55.5 | |
| 09:00 (GMT) | Eurozone | Harmonized CPI | March | 0.2% | |
| 09:00 (GMT) | Eurozone | Harmonized CPI ex EFAT, Y/Y | March | 1.1% | |
| 09:00 (GMT) | Eurozone | Harmonized CPI, Y/Y | March | 0.9% | |
| 12:15 (GMT) | U.S. | ADP Employment Report | March | 117 | 403 |
| 12:30 (GMT) | Canada | GDP (m/m) | January | 0.1% | |
| 13:45 (GMT) | U.S. | Chicago Purchasing Managers' Index | March | 59.5 | 60.1 |
| 14:00 (GMT) | Switzerland | SNB Quarterly Bulletin | |||
| 14:00 (GMT) | U.S. | Pending Home Sales (MoM) | February | -2.8% | -3.5% |
| 14:30 (GMT) | U.S. | Crude Oil Inventories | March | 1.912 | |
| 14:45 (GMT) | U.S. | FOMC Member Bostic Speaks | |||
| 21:30 (GMT) | Australia | AIG Manufacturing Index | March | 58.8 | |
| 23:50 (GMT) | Japan | BoJ Tankan. Non-Manufacturing Index | Quarter I | -5 | -5 |
| 23:50 (GMT) | Japan | BoJ Tankan. Manufacturing Index | Quarter I | -10 |
eFXdata reports that Citi's analysts updated the estimate of this month-end fixing model point to moderate USD selling into tomorrow's fix.
"The signal has changed to a moderate USD sell. The strength of this month’s signal is below the historical norm, measuring 0.4 standard deviations on average."
"The discrepancy between the JPY sell and buy-signals for other currencies suggests that EURJPY, GBPJPY and other JPY crosses may also move higher ahead of this month-end."
Carsten Brzeski, the Global Head of Macro for ING Research, notes that Germany's headline inflation continued its upward trend in March and will continue to do so in the coming months.
"Based on inflation outcomes of several regional states, German inflation in March came in at 1.7% year-on-year, from 1.3% in February."
"The further acceleration in German inflation is mainly due to higher energy prices. Also, don’t forget that these numbers are still distorted by lockdowns and imputed prices as many goods and services are simply not available."
"With supply chain disruptions, like higher container prices, delivery problems with semiconductors and most prominently, the recent problems in the Suez Canal, producer prices are set to increase further, possibly putting more pressure on consumer prices. Add to this a post-lockdown reflation in some sectors and the reversal of the German VAT rate and for German (and eurozone) inflation, the only way is up. In our view, German headline inflation could eventually range between 3% and 4% in the second half of this year."
"Inflation mainly as a result of supply-side shocks and one-off factors is rather more deflationary than inflationary. This is why the ECB has front-loaded its asset purchases, continuing with very accommodative monetary policy, rather than reacting with any policy normalisation."
"Since the last press conference, the ECB has further clarified its reaction function and its commitment to maintaining favourable financing conditions and to look through (temporarily) higher inflation. Today’s German inflation numbers suggest that this commitment has come not a moment too soon."
FXStreet notes that copper has jumped about 18% this quarter, and it has averaged above $8,475/t so far this year with a high of $9,605/t back in late-February. However, Bart Melek, Head of Commodity Strategy at TD Securities, suggests that the recent disruptions and pending structural deficits will not be enough to keep the metal used in the manufacturing of various goods ranging from autos to electronics bid.
“The reversal of temporary supply disruptions, along with spec long liquidations and a high probability that supply will outpace demand by some 900k tonnes over the next three years, suggests that prices will drop back down toward $7,000/t in the not too distant future.”
The Conference
Board announced on Tuesday its U.S. consumer confidence surged 19.3 points to 109.7
in March from 90.4 in February. This was the highest reading since March 2020.
Economists had
expected consumer confidence to come in at 96.9.
February’s
consumer confidence reading was revised down from the originally estimated 91.3.
The survey
showed that the present situation index climbed from 89.6 in February to 110.0 this
month. Meanwhile, the expectations index jumped from 90.9 last month to 109.6
in March.
“Consumer
Confidence increased to its highest level since the onset of the pandemic in
March 2020,” noted Lynn Franco, Senior Director of Economic Indicators at The
Conference Board. “Consumers’ assessment of current conditions and their
short-term outlook improved significantly, an indication that economic growth
is likely to strengthen further in the coming months. Consumers’ renewed
optimism boosted their purchasing intentions for homes, autos and several
big-ticket items. However, concerns of inflation in the short-term rose, most
likely due to rising prices at the pump, and may temper spending intentions in
the months ahead.”
S&P
reported on Tuesday its Case-Shiller Home Price Index, which tracks home prices
in 20 U.S. metropolitan areas, jumped 11.1 percent y-o-y in January 2021, following
a revised 10.2 percent y-o-y climb in December 2020 (originally a 10.1 percent
y-o-y surge). This was the biggest annual gain in house prices since March
2014.
Economists had
expected a climb of 11.0 percent y-o-y.
Phoenix (+15.8
percent y-o-y), Seattle (+14.3 percent y-o-y) and San Diego (+14.2 percent
y-o-y) recorded the highest y-o-y advances among the 20 cities in January. All
20 cities reported greater price gains in the year ending January 2021 versus
the year ending December 2020.
Meanwhile, the S&P/Case-Shiller U.S. National Home
Price Index, which measures all nine U.S. census divisions, surged 11.2 percent
y-o-y in January, following a 10.4 percent y-o-y jump in the previous month.
U.S. stock-index futures fell on Tuesday, as a spike in U.S. bond yields prompted investors to sell off tech-related stocks.
Global Stocks:
Index/commodity | Last | Today's Change, points | Today's Change, % |
Nikkei | 29,432.70 | +48.18 | +0.16% |
Hang Seng | 28,577.50 | +239.20 | +0.84% |
Shanghai | 3,456.68 | +21.38 | +0.62% |
S&P/ASX | 6,738.40 | -61.10 | -0.90% |
FTSE | 6,744.82 | +8.65 | +0.13% |
CAC | 6,046.35 | +30.84 | +0.51% |
DAX | 14,920.36 | +102.64 | +0.69% |
Crude oil | $60.56 | -1.62% | |
Gold | $1,681.10 | -1.95% |
FXStreet notes that the S&P 500 spotlight remains on its record high and two-month channel top at 3984/91 and analysts at Credit Suisse suspect this again caps for now for a fresh pullback into the range. Big picture, they maintain a core bullish outlook for 4070/75.
“Whilst our broader outlook stays bullish for an eventual move to 4070/75, we suspect key resistance from the range highs and two-month channel top at 3984/91 again caps for now for a fresh pullback into the range.”
“Support remains at 3944/43 initially, then more importantly at the price gap from Friday morning at 3918/10. We look for this to now ideally hold to keep the immediate risk higher in the range. Below though would instead open the door to a retest of last week’s low and the 63-day average at 3854.”
(company / ticker / price / change ($/%) / volume)
3M Co | MMM | 195.51 | -0.23(-0.12%) | 989 |
ALCOA INC. | AA | 31.99 | -0.05(-0.16%) | 21932 |
ALTRIA GROUP INC. | MO | 52.13 | -0.17(-0.33%) | 9749 |
Amazon.com Inc., NASDAQ | AMZN | 3,057.37 | -18.36(-0.60%) | 16357 |
Apple Inc. | AAPL | 120.28 | -1.11(-0.91%) | 721962 |
AT&T Inc | T | 30.59 | 0.03(0.10%) | 79036 |
Boeing Co | BA | 251 | 0.48(0.19%) | 89289 |
Caterpillar Inc | CAT | 229.94 | -0.28(-0.12%) | 4630 |
Chevron Corp | CVX | 106.31 | -0.61(-0.57%) | 5948 |
Cisco Systems Inc | CSCO | 52.29 | -0.23(-0.44%) | 19124 |
Citigroup Inc., NYSE | C | 71.74 | 0.16(0.22%) | 52405 |
Deere & Company, NYSE | DE | 365 | -2.07(-0.56%) | 1023 |
E. I. du Pont de Nemours and Co | DD | 78.05 | -0.05(-0.06%) | 222 |
Exxon Mobil Corp | XOM | 56.97 | -0.43(-0.75%) | 48099 |
Facebook, Inc. | FB | 289.34 | -1.48(-0.51%) | 75863 |
Ford Motor Co. | F | 12.12 | -0.03(-0.25%) | 452602 |
Freeport-McMoRan Copper & Gold Inc., NYSE | FCX | 31.67 | -0.43(-1.34%) | 75969 |
General Electric Co | GE | 12.97 | 0.02(0.15%) | 176969 |
General Motors Company, NYSE | GM | 56.06 | 0.12(0.21%) | 59675 |
Goldman Sachs | GS | 326.78 | 1.05(0.32%) | 5302 |
Google Inc. | GOOG | 2,060.00 | 4.05(0.20%) | 4968 |
Home Depot Inc | HD | 303.99 | 1.79(0.59%) | 2449 |
HONEYWELL INTERNATIONAL INC. | HON | 219.5 | 0.62(0.28%) | 10764 |
Intel Corp | INTC | 63.85 | -0.65(-1.01%) | 80144 |
International Business Machines Co... | IBM | 135.53 | -0.33(-0.24%) | 3905 |
Johnson & Johnson | JNJ | 165.53 | -0.51(-0.31%) | 4130 |
JPMorgan Chase and Co | JPM | 152.98 | 0.30(0.20%) | 14488 |
McDonald's Corp | MCD | 226.74 | -0.61(-0.27%) | 1222 |
Merck & Co Inc | MRK | 78.24 | -0.06(-0.08%) | 4642 |
Microsoft Corp | MSFT | 233.4 | -1.84(-0.78%) | 107503 |
Pfizer Inc | PFE | 36.57 | -0.05(-0.14%) | 66537 |
Procter & Gamble Co | PG | 137 | -0.57(-0.41%) | 6847 |
Starbucks Corporation, NASDAQ | SBUX | 108.64 | -0.49(-0.45%) | 3810 |
Tesla Motors, Inc., NASDAQ | TSLA | 598.66 | -12.63(-2.07%) | 413570 |
The Coca-Cola Co | KO | 53.7 | -0.15(-0.28%) | 27357 |
Twitter, Inc., NYSE | TWTR | 62.28 | -0.66(-1.05%) | 53190 |
Verizon Communications Inc | VZ | 58.8 | -0.03(-0.05%) | 29029 |
Visa | V | 213.59 | -0.92(-0.43%) | 6311 |
Wal-Mart Stores Inc | WMT | 136.78 | 0.11(0.08%) | 9496 |
Walt Disney Co | DIS | 184 | -0.85(-0.46%) | 18378 |
Yandex N.V., NASDAQ | YNDX | 62.6 | -1.14(-1.79%) | 3468 |
Alphabet (GOOGL/GOOG) upgraded to Buy from Hold at Stifel; target raised to $2350
Germany's
Federal Statistical Office (Destatis) reported on Tuesday the country’s
consumer price index (CPI) is expected to increase 0.5 percent m-o-m in March after
gaining 0.7 percent m-o-m in the previous month.
On the y-o-y
basis, Germany’s CPI is seen to surge 1.7 in March, following a 1.3 percent
jump in February. This represents the largest advance since February 2020.
Economists had
predicted inflation would rise 0.5 percent m-o-m and 1.7 percent y-o-y in March.
According to
the report, food price increased 1.6 percent y-o-y in March after a 1.4 percent
y-o-y gain in February. Services costs also grew 1.6 percent y-o-y in March, accelerating
from 1.4 percent y-o-y in the previous month. Energy prices jumped 4.8 percent
y-o-y after a 0.3 percent y-o-y advance in February.
Meanwhile, the
harmonized index of consumer prices for Germany (HICP), which is calculated for
European purposes, is expected to rise 0.5 percent m-o-m and 2.0 percent y-o-y.
FXStreet reports that U.S. Bond Yields are expected to see a more gradual and stilted rise during the second quarter, with an elevated risk of a short-term pullback in the first part of the quarter. Nevertheless, the Credit Suisse analyst team is looking for 10yr US Bond Yields to rise to 1.82% during the second quarter and 1.96/2.00% later in the year.
“The market enters Q2 with short-term momentum waning slightly and medium-term momentum remaining at levels that are typically consistent with a pause. We therefore expect to see a more stilted move higher during Q2, with the risk of a near term correction elevated.
“The next major support zone at 1.82% is likely to prove a tough barrier during Q2.”
“Longer-term, we recently raised our core medium-term objective to 1.965/2.00%, however we think it’s less likely that this level will be reached during Q2.”
| Time | Country | Event | Period | Previous value | Forecast | Actual |
|---|---|---|---|---|---|---|
| 06:45 | France | Consumer confidence | March | 91 | 91 | 94 |
| 07:00 | Switzerland | KOF Leading Indicator | March | 102.6 | 104.6 | 117.8 |
| 09:00 | Eurozone | Industrial confidence | March | -3.1 | 2 | |
| 09:00 | Eurozone | Consumer Confidence | March | -14.8 | -10.8 | -10.8 |
| 09:00 | Eurozone | Economic sentiment index | March | 93.4 | 96 | 101 |
USD rose against its major counterparts in the European session on Tuesday as rapid vaccinations and the prospect of more stimulus in the U.S. pushed inflation expectations and the U.S. Treasury yields higher.
Benchmark 10-year Treasury note yields are trading at 1.764% at the moment after surging to a fresh 14-month high of 1.776% in overnight trading. On this background, the U.S. Dollar Index (DXY), measuring the U.S. currency's value relative to a basket of foreign currencies, passed the 93.00-mark for the first time since early November. The DXY is currently trading at 93.21, up 29%.
Investors awaited details of the U.S. President Joe Biden's plan to boost infrastructure spending as part of a $3 trillion stimulus deal, set to be unveiled on Wednesday.
In addition, market participants continued to weigh the fallout from the defaults of the U.S. hedge fund Archegos Capital.
FXStreet notes that AUD/USD is correcting lower after peaking recently at 0.8007, but downside momentum ebbs as the aussie approaches the early February lows of 0.7564. A bearish head-and-shoulders pattern appears as a work in progress pattern, but further declines require momentum best fuelled by a decline in iron ore prices, Benjamin Wong, Strategist at DBS Bank, suggests.
“Technically, what is driving the decline appears to be two-fold – the inability of the mid-March advance to rally past 0.7849 (given the importance of the prior 0.7838 resistance pivot), and a bearish head-and-shoulders pattern has come to the fore. The latter pattern is in play as long as AUD does not push right through the 0.7802, 0.7835 shoulder points.”
“The reluctance to push right under 0.7564 means the right-hand shoulder of the pattern is a work in progress. This pattern would be in validation mode only (thus conditional) if AUD shows determined momentum under its 0.7650 neckline.”
GBP/USD to look for a deeper correction lower - Credit Suisse
FXStreet notes that the GBP/USD pair maintains a top below a cluster of supports seen centred on 1.3779, including its medium-term uptrend and economists at Credit Suisse look for further corrective weakness.
“GBP/USD has extended its near-term recovery but with a top seen in place beneath the lower end of the March range, 55-day average and medium-term uptrend centred on 1.3779/82 this stays seen as temporary and we continue to look for a more significant turn lower.”
“Near-term support moves to 1.3756, below which should add weight to our view for a fall back to 1.3693 ahead of 1.3670/63 and then the 38.2% retracement of the September/February rally at 1.3641.
“Whilst we would look for an initial rebound from the 1.3641 mark, we look for a break in due course with support seen next at 1.3567, ahead of 1.3530/20 and then the 50% retracement and the YTD low at 1.3456/52. Whilst we look for this to hold at first, a break in due course can see the “measured top objective” at 1.3322.”
USD/JPY to race higher towards the 110.30/38 region - Commerzbank
FXStreet reports that USD/JPY has reached the June 2020 high at 109.85. Axel Rudolph, Senior FICC Technical Analyst at Commerzbank, expects the pair to continue to surge higher towards 110.30/38.
“USD/JPY’s rise above the June 2020 peak at 109.85 put the January 2020 high and September 2018 low at 110.30/38 on the map. Then there is the late July 2018 low at 110.58 and also the 111.13/38 October 2018 low and mid-February 2019 high.”
“We will retain our overall bullish forecast while the cross stays above the March 10 and 23 lows at 108.41/34.”
FXStreet notes that the NZD/USD pair maintains a “head & shoulders” top and analysts at Credit Suisse stay bearish for a test of the 200-day average at 0.6878.
“Although further short-term sideways trading is likely, with a large ‘head and shoulders’ top in place and daily MACD momentum still pointing lower, we look for a resumption of the downmove in due course.”
“Support is initially seen at 0.6995, then 0.6972, ahead of the current year low at 0.6943. Removal of here would open the door to a fall back to the 200-day average, currently at 0.6878, where we would expect to see a more concerted pause.”
“Resistance moves to 0.7034 initially, ahead of 0.7073 and then the ‘neckline’ to the top at 0.7102, which ideally caps any potential reversal higher for now."
- ECB could skew its bond purchases towards greener assets but should not be responsible for developing new benchmarks for climate-friendly quantitative easing
- That’s something we should absolutely consider
- My preference would be for us not to come up with allocation ourselves, but that there would be somewhat better benchmark developed outside central banking world that we could then use to tilt these purchases
- ECB could act as catalyst in creating new methodologies, but more corporate disclosure is required and credit rating agencies also need to incorporate climate risk in their assessments
- This is all about imperfect pricing, a sort of market failure, and we could only get better pricing of climate-related risk once there is more data, more information, out there
- That’s why we stimulate the harmonisation of disclosure standards
Bloomberg reports that Oxford Economics forecast that China’s ambitious plan to vaccinate 40% of its population by the end of June could pave the way for lifting the economy’s growth rate to 9.3% this year.
Business confidence and consumer spending will improve should China be able to achieve its targeted rate, which Oxford Economics estimates will require inoculating 10 million people a day -- twice the current pace.
This would translate into a 0.4 percentage point gain to the gross domestic product growth rate from Oxford Economics’s 8.9% baseline scenario, which assumes five to six million doses are administered per day, according to its report released Tuesday.
Household consumption this year could increase by 7% from its pre-Covid level in 2019, while export of tourism services will recover to about 50% of its 2019 level in the second half of the year, and imports of tourism services will recover around 70%. Fixed investment will also improve, the research institution said.
In a worse-than-expected scenario, where only 40% of population will be vaccinated by the end of the year, economic growth could end up 0.2 percentage points lower from the baseline case at 8.7%, the report said.
FXStreet reports that in the view of economists at HSBC, despite the volatility, supportive foundations for most EM FX are expected to be in place in 2021.
“Many FX market participants remembered the damage to emerging markets (EM) FX caused by the ‘taper tantrum’ in 2013, and are wondering if something similar is about to happen today. Notwithstanding the comparable repricing of US yields, we believe EM FX has been relatively steadier this time around for good reasons – current account balances are healthier, portfolio outflows from EM are slower and valuations are low.”
“Our base case is that the strong recoveries in the US and elsewhere will eventually have positive spill-over effects to EM growth. Loose monetary policies in developed markets (DM) and vaccination progress globally would support risk appetite for EM assets. So we have pencilled in modest EM FX appreciation by year-end 2021.”
According to the report from European Commission, in March 2021, the Economic Sentiment Indicator (ESI) improved sharply in both the EU (+6.9 points to 100.0) and the euro area (+7.6 points to 101.0). For the first time since the outbreak of COVID-19 on the continent, the ESI is back at (EU), or slightly above (EA), its long-term average. Also the Employment Expectations Indicator (EEI) saw a forceful increase (+6.1 points to 98.0 in the EU and +6.8 points to 97.7 in the euro area), bringing the indicator in both regions close to its long-term average.
In the EU, the ESI’s increase in March was driven by improving confidence in all surveyed business sectors (i.e. industry, services, retail trade, construction) and among consumers. The increases were of a magnitude not seen since last summer’s steep recovery following the first phase of the pandemic.
Industry confidence increased for the fourth month in a row (+4.6), thanks to very positive developments in all its components, i.e. managers’ production expectations, their assessments of the current level of overall order books and the adequacy of the stocks of finished products. Services confidence (+7.0) posted the first sharp pick-up since September last year, driven by managers’ much more optimistic demand expectations and, to a lesser extent, more positive views on the past business situation and past demand.
Consumer confidence firmed (+3.6), as households’ expectations improved both in respect of the general economic situation in their country, and their personal situation, as measured by their future financial situation and their intentions to make major purchases.
The rise in retail trade confidence (+6.1) reflected marked improvements in all components of the indicator. Construction confidence brightened (+4.4) thanks to managers’ significantly improved employment expectations and appraisals of the level of order books. When compared to the other sectors, the improvement in financial services confidence (not included in the ESI) was comparatively mild by the standards of the typical fluctuations of the indicator (+5.2). All its components improved, i.e. managers’ appraisals of past demand and the past business situation, as well as their demand expectations.
FXStreet reports that in the view of strategists at UBS, the drop in oil prices is likely to be short-lived and forecast Bren Oil at $75/bbl in the second half of 2021.
“Vaccination progress has been uneven across countries. But in nations where vaccinations have been progressing more rapidly, reopening plans are more advanced. We believe this points to the direction of travel as laggards ramp up vaccination. As reopening progresses we expect oil demand to recover to 100mbpd later this year from current levels around 94mbpd. Meanwhile, oil exporters remain committed to keeping supply constrained, and we expect OPEC+ to reduce production cuts only when demand recovers.”
According to the report from National Institute of Statistics (ISTAT), in February 2021, compared with the previous month, industrial producer prices increased by 0.5%. On domestic market producer prices increased by 0.5%, on non-domestic market they increased by 0.6%.
Over the last three months, compared to the previous three months, industrial producer prices increased by 1,7% (+2.0% for the domestic market, +0.9% for the non-domestic market).
In February 2021, compared with February 2020, industrial producer prices increased by 0.7% (+0.7% on domestic market, +0.4% on foreign market).
In February 2021 construction producer prices of residential buildings and non-residential buildings increased by 0.4% on monthly basis and by 2.1% on annual basis; construction producer prices of roads and railways stayed unchanged compared with the previous month and increased by 1.7% on annual basis.
Over the last three months, compared to the previous three months, construction producer prices increased by 1.2% both for residential buildings and non-residential buildings and increased by 1.1% for roads and railways.
FXStreet reports that Jane Foley, Senior FX Strategist at Rabobank notes, investors will be keeping a close eye on this week’s releases of the ADP employment survey, initial claims and the ISM employment component.
“The market is in danger of pricing in too much inflation risk. Assuming that the Fed retains a cautious view and that this is justified by economic data releases, there is scope for some of the enthusiasm that has been supporting the USD to be reined back over the coming quarter or two.”
“While we see scope for the USD to soften in the months ahead, upside may have further to run in the short-term. For sure, in a week when the market is feeling so optimistic about the forthcoming payrolls release, it seems very likely that the greenback will find strong support.”
KOF Economic Research Agency said that in March the economic barometer rose to 117.8 points, which is markedly above its long-term average of 100. The increase over the previous month is 15.2 points (from 102.6 points, revised from 102.7). Economists had expected an increase to 104.6. This is largely due to the indicators from the Swiss manufacturing industry. The other groups of indicators, both for domestic and foreign demand, all signal a positive development, albeit significantly weaker.
In the goods producing sector (manufacturing and construction), the order backlog is particularly assessed as improved, followed by production and the competitiveness situation. The assessment of firms’ inventories, on the other hand, has become slightly less favourable.
In the manufacturing sector, all sectors reflected in the Barometer indicate an improvement compared to the previous month. This is particularly pronounced in the metal industry, followed by the textile and chemical industries and then by mechanical engineering and the paper industry.
| Time | Country | Event | Period | Previous value | Forecast | Actual |
|---|---|---|---|---|---|---|
| 06:45 | France | Consumer confidence | March | 91 | 91 | 94 |
| 07:00 | Switzerland | KOF Leading Indicator | March | 102.6 | 104.6 | 117.8 |
During today's Asian trading, the US dollar rose against the euro and the Japanese yen.
The epidemiological situation in Europe continues to put pressure on investor sentiment. France is due to host a defense council on Wednesday to discuss tougher quarantine measures. Meanwhile, German Chancellor Angela Merkel warned about the possibility of strengthening control over the implementation of quarantine measures by the federal government, noting that not all federal states take them seriously.
Meanwhile, investors are waiting for a speech by US President Joe Biden, who plans to present an infrastructure spending plan on Wednesday.
The ICE index, which tracks the dollar's performance against six currencies (euro, swiss franc, yen, canadian dollar, pound sterling and swedish krona), rose 0.09%.
The yen fell 0.35% against the US dollar, despite the Japanese data. Retail sales in Japan in February decreased by 1.5% per annum, according to official data. The rate of decline slowed down compared to January (2.4%). Experts on average expected a drop of 2.8%. Japan's jobless rate in February remained at 2.9% for the fourth month in a row. This is the lowest figure since July last year. Analysts had expected an increase of up to 3%.
According to the report from INSEE, in March 2021, households’ confidence in the economic situation has bounced back slightly. At 94, the synthetic index has gained three points but remains below its long-term average (100).
In March, the households’ opinion balance related to their future financial situation has gained four points and passes over its long-term average. The households’ opinion balance related to their past financial situation has increased slightly. It has gained one point and remains above its average.
The share of households considering it is a suitable time to make major purchases has increased. The corresponding balance has gained two points but remains below its average.
In March, the share of households considering it is a suitable time to save has increased again. The corresponding balance has gained three points, and reaches its new highest historical level.
Conversely, households’ opinion balance related to their future saving capacity has lost two points. Households’ opinion balance related to their current saving capacity has been stable. Both balances remain well above their averages.
In March, households considering that prices will be on the rise during the next twelve months have been a bit more numerous than in February. The corresponding balance has gained five points, and remains above its long-term average.
The share of households considering that prices were on the rise during the past twelve months has been almost stable. The corresponding balance has gained one point, but still remains well below its long-term average.
Reuters reports that Bank of Japan (BOJ) Governor Haruhiko Kuroda offered a cautiously optimistic view of the economy, saying global and Japanese growth are picking up from the damage caused by the coronavirus pandemic thanks to aggressive stimulus measures.
Kuroda said Japan’s economic growth will be “clearly positive” in the country’s new fiscal year, beginning in April, thanks to solid global trade and domestic demand for durable goods.
But Kuroda stressed the BOJ’s resolve to maintain its massive stimulus and take additional easing steps “without hesitation” if risks derail Japan’s recovery.
Critics of Kuroda’s radical policies have called on the BOJ to ditch its 2% inflation target and start focusing more on addressing the damage of low rates to Japan’s banking system.
Kuroda countered such views, saying that monetary policy must focus on achieving price stability.
“Price stability can be pursued with monetary policy, while a sound financial system can be achieved with macro-prudential tools,” Kuroda said, signalling the BOJ won’t dial back stimulus just to mitigate the side-effects on banks.
As reported by the Federal Statistical Office (Destatis), the index of import prices increased by 1.4% in February 2021 compared with the corresponding month of the preceding year. Economists had expected a 1.1% increase. In January 2021 and in December 2020 the annual rates of change were -1.2% and -3.4%, respectively. From January 2021 to February 2021 the index rose by 1.7%. Economists had expected a 1.3% increase.
The index of import prices, excluding crude oil and mineral oil products, increased by 1.5% in February 2021 compared with February 2020 and in comparison with January 2021 it rose by 1.0%.
The index of export prices increased by 0.7% in February 2021 compared with the corresponding month of the preceding year. In January 2021 and in December 2020 the annual rates of change were +0.1% and -0.6%, respectively. From January 2021 to February 2021 the index rose by 0.5%.
EUR/USD
Resistance levels (open interest**, contracts)
$1.1872 (55)
$1.1841 (375)
$1.1818 (216)
Price at time of writing this review: $1.1762
Support levels (open interest**, contracts):
$1.1715 (4806)
$1.1680 (1913)
$1.1639 (3191)
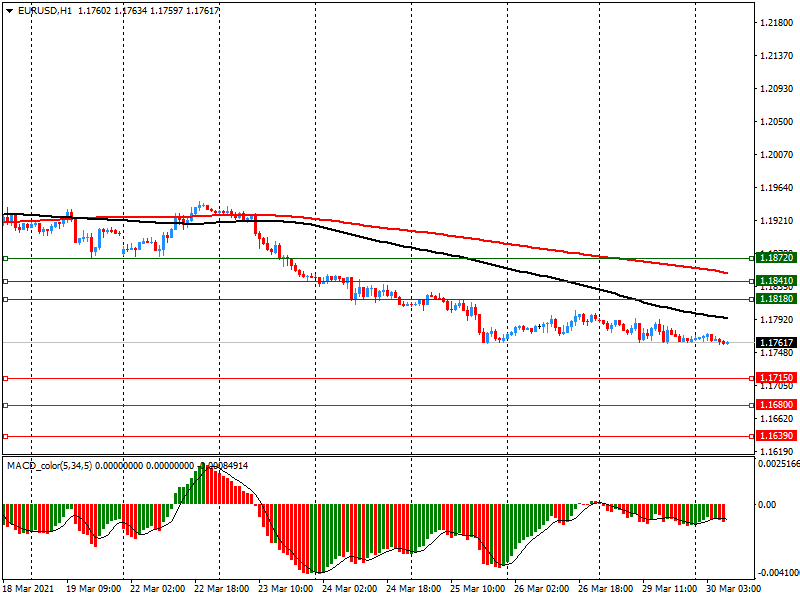
Comments:
- Overall open interest on the CALL options and PUT options with the expiration date April, 9 is 66698 contracts (according to data from March, 29) with the maximum number of contracts with strike price $1,1750 (4806);
GBP/USD
$1.3887 (132)
$1.3830 (202)
$1.3811 (562)
Price at time of writing this review: $1.3765
Support levels (open interest**, contracts):
$1.3727 (853)
$1.3708 (462)
$1.3684 (1239)
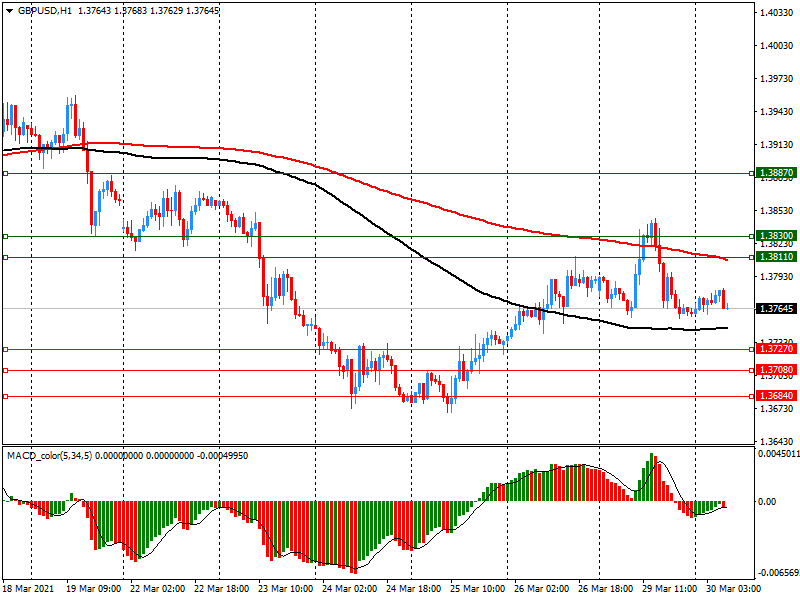
Comments:
- Overall open interest on the CALL options with the expiration date April, 9 is 9718 contracts, with the maximum number of contracts with strike price $1,4100 (1179);
- Overall open interest on the PUT options with the expiration date April, 9 is 15498 contracts, with the maximum number of contracts with strike price $1,3750 (1239);
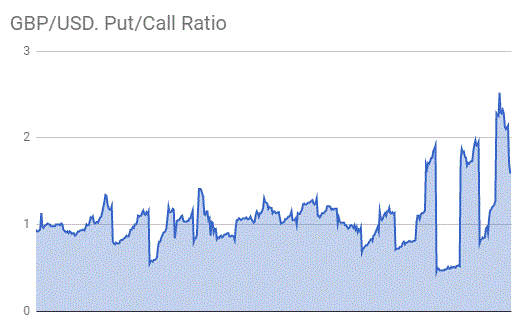
- The ratio of PUT/CALL was 1.59 versus 1.59 from the previous trading day according to data from March, 29
* - The Chicago Mercantile Exchange bulletin (CME) is used for the calculation.
** - Open interest takes into account the total number of option contracts that are open at the moment.
RTTNews reports that the Ministry of Economy, Trade and Industry said that the total value of retail sales in Japan was down 1.5 percent on year in February, coming in at 11.628 trillion yen. That beat forecasts for a decline of 2.8 percent following the 2.4 percent drop in the previous month. On a monthly basis, retail sales jumped 1.4 percent after dropping 1.7 percent in January.
Meanwhile, the Ministry of Internal Affairs and Communications said that the unemployment rate came in at a seasonally adjusted 2.9 percent in February. That was unchanged from the January reading and was below forecasts for 3.0 percent.
The participation rate was 61.9 percent in February - exceeding expectations for 61.8 percent, which would have been unchanged from the previous month's number.
| Raw materials | Closed | Change, % |
|---|---|---|
| Brent | 65.11 | 0.95 |
| Silver | 24.637 | -1.4 |
| Gold | 1711.647 | -1.11 |
| Palladium | 2525.54 | -5.48 |
| Pare | Closed | Change, % |
|---|---|---|
| AUDUSD | 0.76329 | -0.02 |
| EURJPY | 129.199 | -0.1 |
| EURUSD | 1.17652 | -0.22 |
| GBPJPY | 151.106 | -0.07 |
| GBPUSD | 1.37587 | -0.16 |
| NZDUSD | 0.69942 | 0.08 |
| USDCAD | 1.25897 | 0.13 |
| USDCHF | 0.93883 | 0.07 |
| USDJPY | 109.814 | 0.1 |


© 2000-2026. All rights reserved.
This site is managed by Teletrade D.J. LLC 2351 LLC 2022 (Euro House, Richmond Hill Road, Kingstown, VC0100, St. Vincent and the Grenadines).
The information on this website is for informational purposes only and does not constitute any investment advice.
The company does not serve or provide services to customers who are residents of the US, Canada, Iran, The Democratic People's Republic of Korea, Yemen and FATF blacklisted countries.
Making transactions on financial markets with marginal financial instruments opens up wide possibilities and allows investors who are willing to take risks to earn high profits, carrying a potentially high risk of losses at the same time. Therefore you should responsibly approach the issue of choosing the appropriate investment strategy, taking the available resources into account, before starting trading.
Use of the information: full or partial use of materials from this website must always be referenced to TeleTrade as the source of information. Use of the materials on the Internet must be accompanied by a hyperlink to teletrade.org. Automatic import of materials and information from this website is prohibited.
Please contact our PR department if you have any questions or need assistance at pr@teletrade.global.
transfers