- Analytics
- News and Tools
- Market News
CFD Markets News and Forecasts — 30-08-2017
(raw materials / closing price /% change)
Oil 45.97 +0.02%
Gold 1,313.80 -0.02%
(index / closing price / change items /% change)
Nikkei +143.99 19506.54 +0.74%
TOPIX +9.89 1607.65 +0.62%
Hang Seng +329.60 28094.61 +1.19%
CSI 300 -0.24 3834.30 -0.01%
Euro Stoxx 50 +15.49 3403.71 +0.46%
FTSE 100 +27.83 7365.26 +0.38%
DAX +56.59 12002.47 +0.47%
CAC 40 +24.42 5056.34 +0.49%
DJIA +27.06 21892.43 +0.12%
S&P 500 +11.29 2457.59 +0.46%
NASDAQ +66.42 6368.31 +1.05%
S&P/TSX +50.43 15133.13 +0.33%
(pare/closed(GMT +3)/change, %)
EUR/USD $1,1892 -0,64%
GBP/USD $1,2923 +0,03%
USD/CHF Chf0,96222 +0,76%
USD/JPY Y110,22 +0,52%
EUR/JPY Y131,09 -0,11%
GBP/JPY Y142,445 +0,55%
AUD/USD $0,7903 -0,57%
NZD/USD $0,7201 -0,67%
USD/CAD C$1,26199 +0,82%
01:00 Australia HIA New Home Sales, m/m July -6.9%
01:00 China Manufacturing PMI August 51.4 51.3
01:00 China Non-Manufacturing PMI August 54.5
01:00 New Zealand ANZ Business Confidence August 19.4
01:30 Australia Private Sector Credit, y/y July 5.4%
01:30 Australia Private Sector Credit, m/m July 0.6% 0.5%
05:00 Japan Construction Orders, y/y July 2.3%
05:00 Japan Housing Starts, y/y July 1.7% -0.3%
06:00 Germany Retail sales, real unadjusted, y/y July 1.5% 3.5%
06:00 Germany Retail sales, real adjusted July 1.1% -0.4%
06:45 France CPI, y/y (Preliminary) August 0.7%
06:45 France CPI, m/m (Preliminary) August -0.3% 0.5%
07:55 Germany Unemployment Rate s.a. August 5.7% 5.7%
07:55 Germany Unemployment Change August -9 -6
09:00 Eurozone Harmonized CPI ex EFAT, Y/Y (Preliminary) August 1.2%
09:00 Eurozone Harmonized CPI, Y/Y (Preliminary) August 1.3% 1.4%
09:00 Eurozone Unemployment Rate July 9.1% 9.1%
12:30 Canada GDP (m/m) June 0.6% 0.1%
12:30 Canada GDP QoQ Quarter II 0.9%
12:30 Canada GDP (YoY) Quarter II 3.7% 3.7%
12:30 U.S. Continuing Jobless Claims 1954 1950
12:30 U.S. Initial Jobless Claims 234 236
12:30 U.S. Personal Income, m/m July 0% 0.3%
12:30 U.S. Personal spending July 0.1% 0.4%
12:30 U.S. PCE price index ex food, energy, Y/Y July 1.5% 1.4%
12:30 U.S. PCE price index ex food, energy, m/m July 0.1% 0.1%
13:45 U.S. Chicago Purchasing Managers' Index August 58.9 58.5
14:00 U.S. Pending Home Sales (MoM) July 1.5% 0.5%
23:30 Australia AIG Manufacturing Index August 56.0

Major US stock indexes completed the session in positive territory, receiving support from US GDP data and the US labor market report.
Data from Automatic Data Processing (ADP) showed that the growth rate of employment in the private sector of the US accelerated in August stronger than expected. According to the report, the number of employees increased by 237 thousand in comparison with the revised upward indicator for July at the level of 201 thousand (originally reported growth of 178 thousand). Analysts had expected that the number of employed will increase by 185 thousand.
A second estimate by the Ministry of Trade showed that the recovery in the US economy in the second quarter was stronger than originally reported. According to the report, GDP grew by 3% from April to June, compared with the original rate of 2.6%. This was the fastest quarterly growth in the last two years. Compared with the previous revision, there were several more strong consumer spending and investments in business. Economists had expected a smaller upward revision in the second quarter of GDP to 2.7%. The economy climbed 1.2% in the first quarter. Economists say that the most recent data show that the US is on track to keep 3% growth in the third quarter. Consumer spending was the main engine in the second quarter, an increase of 3.3% in the second quarter. This was higher than the government's initial estimate of 1.9%. The cost of investment in the business rose by a revised 0.6% in the second quarter, compared with the previous estimate of 0.4%. The report also confirms that inflation is moving away from the Fed's 2% annual target in the second quarter. Inflation, measured by the preferred Fed by the PCE index, fell sharply to 0.3% in the second quarter compared to 2.2% in the first quarter. As a result, the PCE index fell to 1.6% per annum in the second quarter, compared to 2% in the first quarter.
Components of the DOW index finished trading in different directions (14 in positive territory, 16 in negative territory). The leader of growth were the shares of Cisco Systems, Inc. (CSCO, + 1.72%). Outsider were the shares of The Travelers Companies, Inc. (TRV, -1.02%).
Most sectors of the S & P index showed an increase. The services sector grew most (+ 0.8%). The utilities sector showed the greatest decrease (-0.4%).
At closing:
DJIA + 0.11% 21.889.93 +24.56
Nasdaq + 1.05% 6,368.31 +66.42
S & P + 0.46% 2,457.46 +11.16
U.S. commercial crude oil inventories (excluding those in the Strategic Petroleum Reserve) decreased by 5.4 million barrels from the previous week. At 457.8 million barrels, U.S. crude oil inventories are in the middle of the average range for this time of year.
Total motor gasoline inventories remained unchanged last week, and are near the upper limit of the average range. Finished gasoline inventories increased while blending components inventories decreased last week. Distillate fuel inventories increased by 0.7 million barrels last week and are in the upper half of the average range for this time of year. Propane/propylene inventories increased by 1.4 million barrels last week but are in the lower half of the average range. Total commercial petroleum inventories decreased by 1.1 million barrels last week.
EURUSD: Nothing of note
USDJPY: 109.00 (565m) 109.50 (825m) 110.00 (360m)
GBPUSD: 1.2900 (GBP 225m)
USDCAD: 1.2450 (USD 1.1bln)
U.S. stock-index futures were flat, as investors assessed ADP's monthly report on private-sector jobs and the second estimate of Q2 GDP.
Global Stocks:
Nikkei 19,506.54 +143.99 +0.74%
Hang Seng 28,094.61 +329.60 +1.19%
Shanghai 3,362.99 -2.23 -0.07%
S&P/ASX 5,669.72 +0.709 +0.01%
FTSE 7,371.34 +33.91 +0.46%
CAC 5,065.31 +33.39 +0.66%
DAX 12,039.37 +93.49 +0.78%
Crude $46.09 (-0.75%)
Gold $1,313.10 (-0.44%)
(company / ticker / price / change ($/%) / volume)
| ALCOA INC. | AA | 43.38 | 0.38(0.88%) | 14702 |
| ALTRIA GROUP INC. | MO | 63.76 | -0.05(-0.08%) | 462 |
| Amazon.com Inc., NASDAQ | AMZN | 956.26 | 2.20(0.23%) | 15012 |
| Apple Inc. | AAPL | 163.44 | 0.53(0.33%) | 255618 |
| Barrick Gold Corporation, NYSE | ABX | 17.75 | -0.07(-0.39%) | 97630 |
| Boeing Co | BA | 240.85 | 0.36(0.15%) | 886 |
| Caterpillar Inc | CAT | 116.15 | 0.14(0.12%) | 1540 |
| Chevron Corp | CVX | 107.9 | 0.04(0.04%) | 1036 |
| Cisco Systems Inc | CSCO | 31.39 | -0.09(-0.29%) | 325 |
| Citigroup Inc., NYSE | C | 67.71 | 0.23(0.34%) | 16983 |
| Exxon Mobil Corp | XOM | 76.5 | 0.05(0.07%) | 800 |
| Facebook, Inc. | FB | 168.2 | 0.15(0.09%) | 38830 |
| Freeport-McMoRan Copper & Gold Inc., NYSE | FCX | 15.18 | -0.03(-0.20%) | 27377 |
| General Electric Co | GE | 24.41 | -0.03(-0.12%) | 17141 |
| General Motors Company, NYSE | GM | 35.79 | 0.27(0.76%) | 140 |
| Goldman Sachs | GS | 220.93 | 0.97(0.44%) | 2390 |
| Google Inc. | GOOG | 923 | 1.71(0.19%) | 1280 |
| Home Depot Inc | HD | 150.34 | 0.50(0.33%) | 1098 |
| Intel Corp | INTC | 34.87 | 0.14(0.40%) | 403 |
| JPMorgan Chase and Co | JPM | 91.5 | 0.40(0.44%) | 6275 |
| McDonald's Corp | MCD | 158.5 | 0.06(0.04%) | 1158 |
| Microsoft Corp | MSFT | 73.2 | 0.15(0.21%) | 5124 |
| Nike | NKE | 52.8 | 0.07(0.13%) | 1236 |
| Tesla Motors, Inc., NASDAQ | TSLA | 348.53 | 1.17(0.34%) | 23732 |
| The Coca-Cola Co | KO | 45.64 | 0.19(0.42%) | 118 |
| Twitter, Inc., NYSE | TWTR | 16.95 | 0.02(0.12%) | 3708 |
| Verizon Communications Inc | VZ | 48.5 | -0.01(-0.02%) | 3643 |
| Wal-Mart Stores Inc | WMT | 78.9 | 0.13(0.17%) | 3251 |
| Walt Disney Co | DIS | 102.75 | 0.18(0.18%) | 763 |
Canada's current account deficit (on a seasonally adjusted basis) widened by $3.4 billion in the second quarter to $16.3 billion, as the deficit on international trade in goods expanded.
In the financial account (unadjusted for seasonal variation), foreign investment in Canadian bonds was the largest contributor to the net inflow of funds in the economy.
The deficit on international trade in goods expanded $3.3 billion to reach $5.2 billion in the second quarter, as imports advanced by more than exports. This followed a $2.0 billion deterioration of the goods balance in the first quarter.
On a geographical basis, the goods deficit with non-US countries was up $1.8 billion, mainly reflecting a higher deficit with China. Meanwhile, the surplus with the United States was reduced $1.5 billion to $10.4 billion after three straight quarters of increases.
Real gross domestic product (GDP) increased at an annual rate of 1.2 percent in the first quarter of 2017, according to the "second" estimate released by the Bureau of Economic Analysis. In the fourth quarter, real GDP increased 2.1 percent.
Real gross domestic income (GDI) increased 0.9 percent in the first quarter, in contrast to a decrease of 1.4 percent (revised) in the fourth. The average of real GDP and real GDI, a supplemental measure of U.S. economic activity that equally weights GDP and GDI, increased 1.0 percent in the first quarter,
compared with an increase of 0.3 percent in the fourth quarter.
The price index for gross domestic purchases increased 2.6 percent in the first quarter, compared with an increase of 2.0 percent in the fourth quarter. The PCE price index increased 2.4 percent, compared with an increase of 2.0 percent. Excluding food and energy prices, the PCE price index increased 2.1 percent, compared with an increase of 1.3 percent
Private sector employment increased by 237,000 jobs from July to August according to the August ADP National Employment Report.
"In August, the goods-producing sector saw the best performance in months with solid increases in both construction and manufacturing," said Ahu Yildirmaz, vice president and co-head of the ADP Research Institute. "Additionally, the trade industry pulled ahead to lead job gains across all industries, adding the most jobs it has seen since the end of 2016. This could be an industry to watch as consumer spending and wage growth improves." Mark Zandi, chief economist of Moody's Analytics, said, "The job market continues to power forward. Job creation is strong across nearly all industries, company sizes. Mounting labor shortages are set to get much worse. The initial BLS employment estimate is often very weak in August due to measurement problems, and is subsequently revised higher. The ADP number is not impacted by those problems."
The inflation rate in Germany as measured by the consumer price index is expected to be 1.8% in August 2017. Based on the results available so far, the Federal Statistical Office (Destatis) also reports that the consumer prices are expected to increase by 0.1% on July 2017.
In August 2017, the harmonised index of consumer prices for Germany, which is calculated for European purposes, is expected to increase by 1.8% year on year and by 0.2% on July 2017.
The final results for August 2017 will be released on 13 September 2017.
-
Forecasts euro area gdp growth of 2.1% in 2017 and 1.9% in 2018 after 1.7% in 2016
-
Expects U.S. growth of 2.2% in 2017 and 2.3% in 2018, down from 2.4% and 2.5%, respectively
-
Expects euro area monetary policy to become less supportive in 2018, provided that the current growth momentum remains intact
-
Revised up its real gdp growth forecast for Italy to 1.3% in 2017 and 2018 from 0.8% and 1% respectively
-
Revised up Germany's gdp growth forecasts to 2.2% and 2.0% for 2017 and 2018 respectively
Broad money fell by £0.8 billion in July, the first negative outturn since April 2016. Within this, households' money increased by a similar amount to the recent average but this was largely offset by a fall for non-intermediate other financial corporations (NIOFCs). Private non-financial corporations (PNFCs) money fell by a small amount (Table C), the first fall since April 2016. The net flow of sterling credit was close to zero in July. Increases in both households' and PNFCs' borrowing were almost fully offset by a fall in NIOFCs' borrowing.
The £3.6 billion flow of net secured lending in July was similar to recent months. At 68,689, house purchase approvals were stronger than recent months, returning to the levels seen at the beginning of the year. Approvals for remortgaging, at 46,231, were also stronger and have been on a slight upward trend. The annual growth rate of consumer credit fell to 9.8%, the lowest since April 2016, as the July flow was a little weaker than recent months.
According to the flash estimate issued by the INE, the annual inflation of the CPI in August 2017 was expected to be 1.6%. This indicator provides a preview of the CPI that, if confirmed, would imply an increase of one tenth in the annual rate, since in July this rate was 1.5%.
It is worth nothing in this behaviour the increase in the prices of fuels (diesel and gasoline/petrol). In turn, the annual rate of the flash estimate of the HICP in August stood at 2.0%. If confirmed, the annual rate of the HICP would increase three tenths as compared to the previous month.
-
Would not use DTIS while housing market continues to moderate
-
Further surge in house prices can't be ruled out as mortgage rates are low, net migration flows strong
-
Long-term inflation expectations remain well anchored at the target mid-point of 2 percent
-
Lvrs are not expected to be a permanent measure, but their removal would require a degree of confidence that financial stability risks won't deteriorate again
-
There's a risk of a housing market resurgence if lvrs were removed at this time
EUR/USD
Resistance levels (open interest**, contracts)
$1.2041 (4451)
$1.2020 (4002)
$1.2004 (2260)
Price at time of writing this review: $1.1948
Support levels (open interest**, contracts):
$1.1927 (4701)
$1.1895 (1268)
$1.1862 (1812)
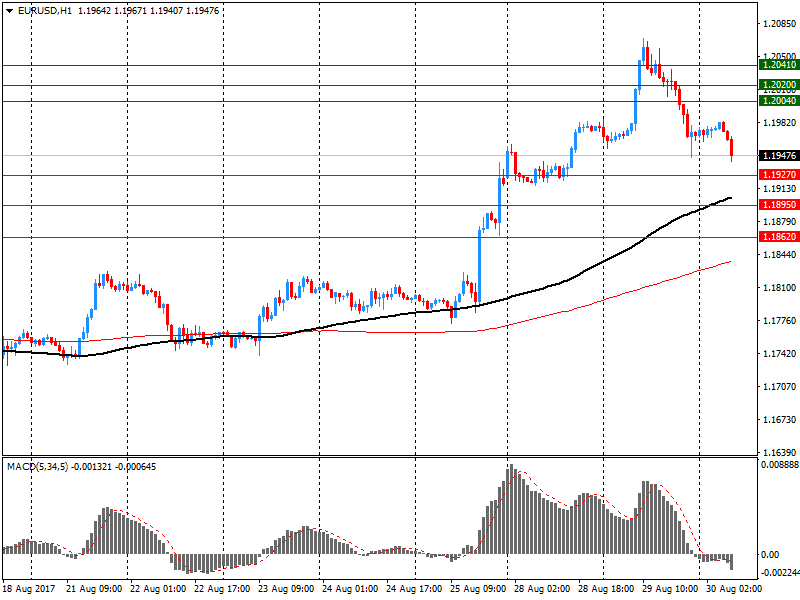
Comments:
- Overall open interest on the CALL options and PUT options with the expiration date September, 8 is 137031 contracts (according to data from August, 29) with the maximum number of contracts with strike price $1,1600 (5952);
GBP/USD
Resistance levels (open interest**, contracts)
$1.3030 (3160)
$1.3000 (1161)
$1.2960 (715)
Price at time of writing this review: $1.2904
Support levels (open interest**, contracts):
$1.2854 (2655)
$1.2821 (2368)
$1.2781 (2460)
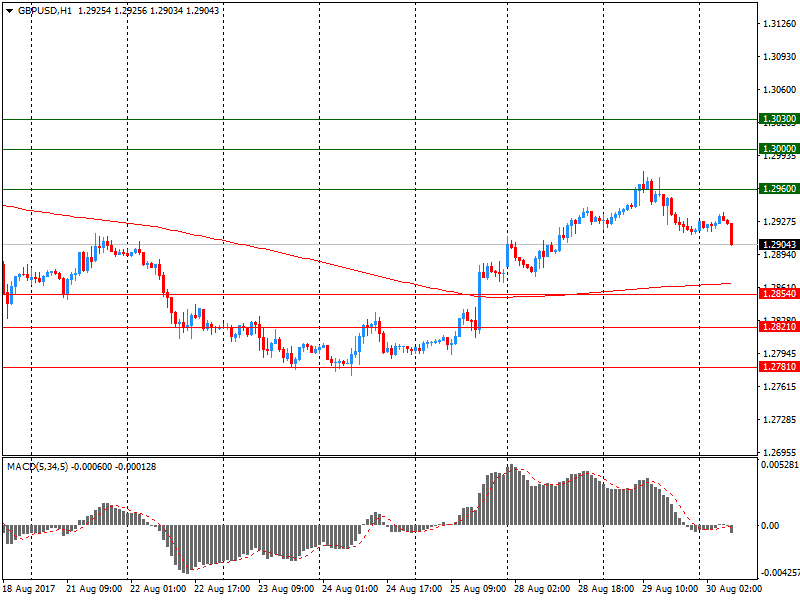
Comments:
- Overall open interest on the CALL options with the expiration date September, 8 is 37517 contracts, with the maximum number of contracts with strike price $1,3000 (3160);
- Overall open interest on the PUT options with the expiration date September, 8 is 32568 contracts, with the maximum number of contracts with strike price $1,2900 (2655);
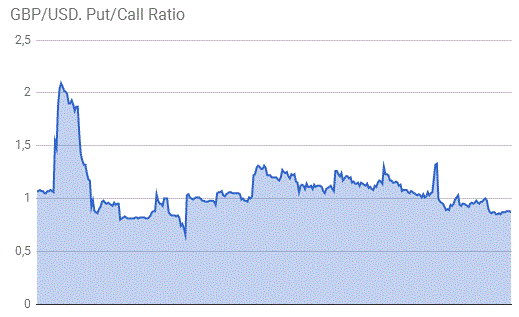
- The ratio of PUT/CALL was 0.87 versus 0.87 from the previous trading day according to data from August, 29
* - The Chicago Mercantile Exchange bulletin (CME) is used for the calculation.
** - Open interest takes into account the total number of option contracts that are open at the moment.
Total construction
-
The trend estimate for total construction work done rose 0.6% in the june quarter 2017.
-
The seasonally adjusted estimate for total construction work done rose 9.3% to $51,669.7m in the june quarter.
Building work done
The trend estimate for total building work done rose 0.5% in the june quarter.
-
The trend estimate for non-residential building work rose 3.0% and residential building work fell 0.9%.
-
The seasonally adjusted estimate of total building work done rose 0.1% to $26,996.9m in the june quarter.
Engineering work done
-
The trend estimate for engineering work done rose 0.7% in the june quarter.
-
The seasonally adjusted estimate for engineering work done rose 21.5% to $24,672.8m in the june quarter.
The UBS consumption indicator stood at 1.38 points in July, suggesting that the third quarter started with a level of consumption growth that is slightly below the long-term average. This aligns with the forecasts of UBS Chief Investment Office Wealth Management, which forecasts that consumption in private households would grow by 1.3% in 2017.
The relatively weak level of employment growth in recent quarters remains a burden on consumption. In July, the consumption indicator was also negatively influenced by new car registrations, which fell by 4.6% year-on-year. With only 24,885 new registrations for the month, car sales were lower than at any other month since 2009. The weaker figures from the car market were offset by the number of overnight hotel stays by Swiss nationals. The 1.41 million overnight stays recorded in July represent an increase of 9.4% from the previous year, and also set a new record for the month.
The fall in the value of the Swiss franc in recent months is expected to lead to higher inflation, potentially limiting the purchasing power of households. On the other hand, the devaluation enhances the competitiveness of retail trade and tourism in Switzerland relative to neighboring countries. On the whole, the weaker franc could have a slightly positive effect on Swiss consumption growth.
Germany's DAX stock index took a bruising as European equities fell to more-than-six-month lows after North Korea's missile launch over Japan jangled investors nerves and the euro rose. The Stoxx Europe 600 index SXXP, -1.04% dropped 1% to end at 368.42, its lowest close since mid-February, FactSet data showed.
U.S. stock benchmarks on Tuesday staged a recovery from heavy selling earlier in the session that came after a North Korean missile test over Japanese airspace rattled investors and sent Wall Street trawling for assets perceived as safe. The Dow Jones Industrial Average DJIA, +0.26% rose 56.97 points, or 0.3%, to close at 21,865.37. Blue chips had been off by as much as 135 points, or 0.6%, at its session low.
Asia-Pacific stocks rebounded Wednesday after selling off a day earlier following North Korea's latest missile launch, as equities in the U.S. recovered as well. The return to risk assets came despite a stern response from President Donald Trump. His insistence that all options are on table "should have escalated the risk-off" sentiment seen Tuesday, said Bart Wakabayashi, Tokyo branch manager at State Street.


© 2000-2026. All rights reserved.
This site is managed by Teletrade D.J. LLC 2351 LLC 2022 (Euro House, Richmond Hill Road, Kingstown, VC0100, St. Vincent and the Grenadines).
The information on this website is for informational purposes only and does not constitute any investment advice.
The company does not serve or provide services to customers who are residents of the US, Canada, Iran, The Democratic People's Republic of Korea, Yemen and FATF blacklisted countries.
Making transactions on financial markets with marginal financial instruments opens up wide possibilities and allows investors who are willing to take risks to earn high profits, carrying a potentially high risk of losses at the same time. Therefore you should responsibly approach the issue of choosing the appropriate investment strategy, taking the available resources into account, before starting trading.
Use of the information: full or partial use of materials from this website must always be referenced to TeleTrade as the source of information. Use of the materials on the Internet must be accompanied by a hyperlink to teletrade.org. Automatic import of materials and information from this website is prohibited.
Please contact our PR department if you have any questions or need assistance at pr@teletrade.global.
transfers