- Analytics
- News and Tools
- Market News
CFD Markets News and Forecasts — 31-08-2017
(raw materials / closing price /% change)
Oil 47.09 -0.30%
Gold 1,326.50 +0.33%
(index / closing price / change items /% change)
Nikkei +139.70 19646.24 +0.72%
TOPIX +9.76 1617.41 +0.61%
Hang Seng -124.31 27970.30 -0.44%
CSI 300 -12.21 3822.09 -0.32%
Euro Stoxx 50 +17.76 3421.47 +0.52%
FTSE 100 +65.36 7430.62 +0.89%
DAX +53.37 12055.84 +0.44%
CAC 40 +29.25 5085.59 +0.58%
DJIA +55.67 21948.10 +0.25%
S&P 500 +14.06 2471.65 +0.57%
NASDAQ +60.36 6428.66 +0.95%
S&P/TSX +78.74 15211.87 +0.52%
(pare/closed(GMT +3)/change, %)
EUR/USD $1,1919 +0,23%
GBP/USD $1,2924 +0,01%
USD/CHF Chf0,95811 -0,43%
USD/JPY Y19,92 -453,24%
EUR/JPY Y131,03 -0,05%
GBP/JPY Y142,09 -0,25%
AUD/USD $0,7945 +0,53%
NZD/USD $0,7175 -0,37%
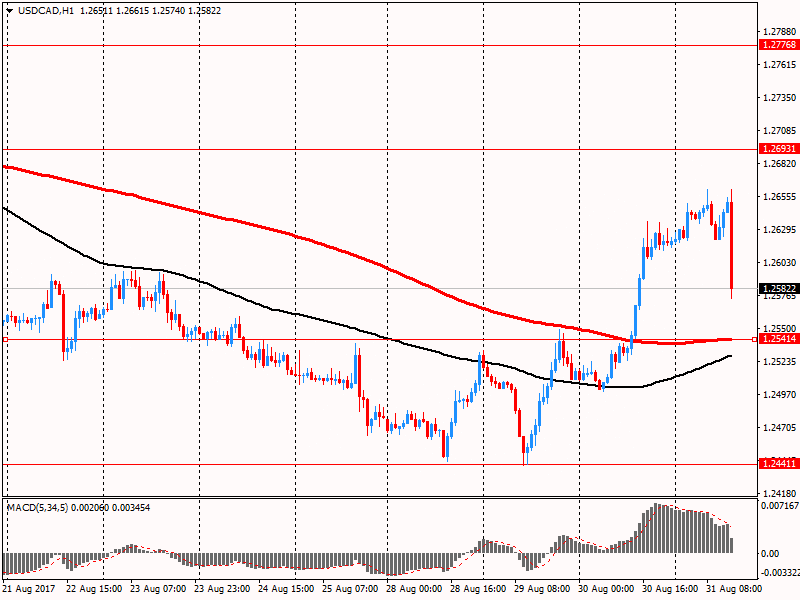
USD/CAD C$1,24848 -1,08%
00:30 Japan Manufacturing PMI (Finally) August 52.1 52.8
01:45 China Markit/Caixin Manufacturing PMI August 51.1 50.9
05:00 Japan Consumer Confidence August 43.8 43.7
07:15 Switzerland Retail Sales (MoM) July 0.8%
07:15 Switzerland Retail Sales Y/Y July 1.5% 1.7%
07:30 Switzerland Manufacturing PMI August 60.9 60.5
07:50 France Manufacturing PMI (Finally) August 54.9 55.8
07:55 Germany Manufacturing PMI (Finally) August 58.1 59.4
08:00 Eurozone Manufacturing PMI (Finally) August 56.6 57.4
08:30 United Kingdom Purchasing Manager Index Manufacturing August 55.1 55
09:15 Eurozone ECB's Vitor Constancio Speaks
12:30 U.S. Manufacturing Payrolls August 16 9
12:30 U.S. Government Payrolls August 4
12:30 U.S. Average workweek August 34.5 34.5
12:30 U.S. Private Nonfarm Payrolls August 205 178
12:30 U.S. Average hourly earnings August 0.3% 0.2%
12:30 U.S. Labor Force Participation Rate August 62.9%
12:30 U.S. Nonfarm Payrolls August 209 182
12:30 U.S. Unemployment Rate August 4.3% 4.3%
13:45 U.S. Manufacturing PMI (Finally) August 53.3 52.5
14:00 U.S. Construction Spending, m/m July -1.3% 0.6%
14:00 U.S. ISM Manufacturing August 56.3 56.5
14:00 U.S. Reuters/Michigan Consumer Sentiment Index (Finally) August 93.4 97.4
17:00 U.S. Baker Hughes Oil Rig Count September 759
19:00 U.S. Total Vehicle Sales, mln August 16.73 16.6
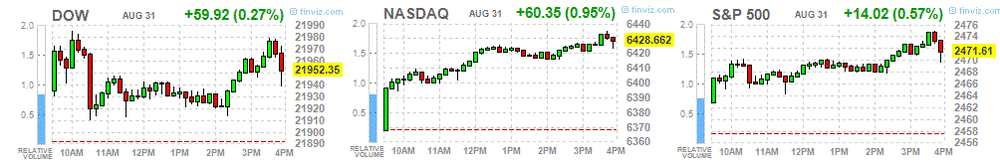
The main US stock indexes have moderately grown, as the block of global strong economic data contributed to the growth of investors' appetite for risk, while tensions on the Korean peninsula and concerns about the effects of tropical storm Harvey decreased.
The focus of the market participants was focused on the report of the Ministry of Trade, which showed that consumer spending in the US grew slightly less than expected in July, and annual inflation increased at the slowest pace since the end of 2015. According to the report, consumer spending, accounting for more than two-thirds of US economic activity, rose 0.3% last month after revised with an increase of 0.2% in June. Economists predicted that consumer spending in July will grow by 0.4% after earlier reported an increase of 0.1% in June.
In addition, the indicator of economic activity in the Chicago region in August did not change after the departure from the 3-year high in July. The index of purchasing managers Chicago (PMI) remained at 58.9 for the second month in a row. Economists had expected a small decline in the index in August - to 58.5.
However, according to the National Association of Realtors, unfinished transactions for the sale of housing fell in July for the fourth time in five months, since only in the West there was an increase in the activity of signing contracts. The index of unfinished transactions for the sale of housing - the forecast figure based on the signing of contracts - fell by 0.8% to 109.1 in July from the revised 110.0 in June. After the decline last month, the index is now 1.3% lower than a year ago, with the annual rate declining in three of the last four months.
Most components of the DOW index recorded a rise (21 out of 30). The leader of growth was the shares of E. I. du Pont de Nemours and Company (DD, + 1.96%). Outsider were shares of The Walt Disney Company (DIS, -1.60%).
All sectors of the S & P index finished trading in positive territory. The healthcare sector grew most (+ 1.8%). The utilities sector showed a minimal increase (+ 0.1%).
At closing:
DJIA + 0.27% 21.952.42 +59.99
Nasdaq + 0.95% 6.428.66 +60.35
S & P + 0.57% 2.471.56 +13.97
Pending homes sales stumbled in July for the fourth time in five months as only the West saw an increase in contract activity, according to the National Association of Realtors.
The Pending Home Sales Index, a forward-looking indicator based on contract signings, decreased 0.8 percent to 109.1 in July from a downwardly revised 110.0 in June. After last month's decline, the index is now 1.3 percent below a year ago and has fallen on an annual basis in three of the past four months.
Lawrence Yun, NAR chief economist, says the staggering inventory woes throughout the country continue to stall contract activity. "With the exception of a minimal gain in the West, pending sales were weaker in most areas in July as house hunters saw limited options for sale and highly competitive market conditions," he said. "The housing market remains stuck in a holding pattern with little signs of breaking through. The pace of new listings is not catching up with what's being sold at an astonishingly fast pace."
EUR/USD: 1.1700-10(553 млн), 1.1875(726 млн), 1.1900(641 млн)
USD/JPY: 107.00(765 млн), 108.00(393 млн), 109.00(316 млн), 110.00-02(570 млн), 110.25(390 млн)
U.S. stock-index futures rose on Thursday, as upbeat global economic data brought back investors' appetite for riskier assets, while concerns over tensions on the Korean Peninsula as well as worries about the economic impact of tropical storm Harvey eased.
Global Stocks:
Nikkei 19,646.24 +139.70 +0.72%
Hang Seng 27,970.30 -124.31 -0.44%
Shanghai 3,361.00 -2.63 -0.08%
S&P/ASX 5,714.52 +44.80 +0.79%
FTSE 7,414.71 +49.45 +0.67%
CAC 5,091.03 +34.69 +0.69%
DAX 12,075.59 +73.12 +0.61%
Crude $46.02 (+0.13%)
Gold $1,311.20 (-0.22%)
(company / ticker / price / change ($/%) / volume)
| ALCOA INC. | AA | 43.55 | 0.46(1.07%) | 12471 |
| Amazon.com Inc., NASDAQ | AMZN | 974.1 | 6.51(0.67%) | 35863 |
| Apple Inc. | AAPL | 163.65 | 0.30(0.18%) | 115455 |
| AT&T Inc | T | 37.8 | 0.13(0.35%) | 1880 |
| Barrick Gold Corporation, NYSE | ABX | 17.77 | 0.02(0.11%) | 21759 |
| Boeing Co | BA | 240.55 | 0.09(0.04%) | 609 |
| Caterpillar Inc | CAT | 117.53 | -0.02(-0.02%) | 681 |
| Cisco Systems Inc | CSCO | 31.97 | -0.02(-0.06%) | 1318 |
| Citigroup Inc., NYSE | C | 68.1 | 0.09(0.13%) | 350 |
| Exxon Mobil Corp | XOM | 76.21 | 0.11(0.14%) | 5153 |
| Facebook, Inc. | FB | 170.39 | 0.47(0.28%) | 33991 |
| Ford Motor Co. | F | 10.97 | 0.03(0.27%) | 5964 |
| Freeport-McMoRan Copper & Gold Inc., NYSE | FCX | 14.71 | 0.15(1.03%) | 36791 |
| General Electric Co | GE | 24.35 | 0.07(0.29%) | 23393 |
| General Motors Company, NYSE | GM | 35.93 | 0.11(0.31%) | 730 |
| Goldman Sachs | GS | 223.35 | 0.93(0.42%) | 1205 |
| Google Inc. | GOOG | 932 | 2.43(0.26%) | 1444 |
| Home Depot Inc | HD | 150.5 | 0.50(0.33%) | 1262 |
| Intel Corp | INTC | 34.97 | 0.08(0.23%) | 4430 |
| JPMorgan Chase and Co | JPM | 91.2 | -0.11(-0.12%) | 450 |
| McDonald's Corp | MCD | 159.46 | -0.07(-0.04%) | 310 |
| Merck & Co Inc | MRK | 63.3 | 0.18(0.29%) | 300 |
| Microsoft Corp | MSFT | 74.1 | 0.09(0.12%) | 8697 |
| Starbucks Corporation, NASDAQ | SBUX | 54.65 | 0.13(0.24%) | 1514 |
| Tesla Motors, Inc., NASDAQ | TSLA | 354.07 | 0.89(0.25%) | 12759 |
| Twitter, Inc., NYSE | TWTR | 16.97 | 0.04(0.24%) | 23469 |
| United Technologies Corp | UTX | 120 | 0.40(0.33%) | 460 |
| Visa | V | 104.1 | 0.37(0.36%) | 403 |
| Wal-Mart Stores Inc | WMT | 78.9 | 0.36(0.46%) | 250 |
| Walt Disney Co | DIS | 102.92 | 0.05(0.05%) | 740 |
The nearest resistance araound that level (1.2769 - August 16 high). Strong support level at 1.2541 (MA (200 H1).
Real gross domestic product (GDP) grew 0.3% in June, rising for the eighth month in a row as 14 of 20 industrial sectors grew. With the exception of October, GDP has grown every month since June 2016. Goods-producing industries rose 0.5% while service producing industries edged up 0.2%.
The construction sector (+2.0%) was the main contributor to the increase in June, posting its largest gain since July 2013. The increase in the sector more than offset the decline in May, which was partly due to a strike in the last week of that month by unionized construction workers in Quebec.
Every component of the construction sector increased in June. Residential construction was up 2.7% in June, its largest increase since May 2014. There was higher output related to the construction of single, double, row and apartment housing along with increased activity related to home alterations and improvements.
Non-residential construction grew 2.9% in June, following a 2.0% decline in May, which was largely attributable to the Quebec labour strike. Repair construction was up 1.7% while engineering and other construction grew 1.1%.
Personal income increased $65.6 billion (0.4 percent) in July according to estimates released today by the Bureau of Economic Analysis. Disposable personal income (DPI) increased $39.6 billion (0.3 percent) and personal consumption expenditures (PCE) increased $44.7 billion (0.3 percent).
Real DPI increased 0.2 percent in July and Real PCE increased 0.2 percent. The PCE price index increased 0.1 percent. Excluding food and energy, the PCE price index increased 0.1 percent.
The $29.3 billion increase in real PCE in July reflected an increase of $18.7 billion in spending for goods and an $11.8 billion increase in spending for services. Within goods, furnishings and durable household equipment was the leading contributor to the increase. Within services, the largest contributor to the increase was spending for food services and accommodat
In the week ending August 26, the advance figure for seasonally adjusted initial claims was 236,000, an increase of 1,000 from the previous week's revised level. The previous week's level was revised up by 1,000 from 234,000 to 235,000. The 4-week moving average was 236,750, a decrease of 1,250 from the previous week's revised average. The previous week's average was revised up by 250 from 237,750 to 238,000.
-
Inflation expectations are still above levels reported by statistics service
The euro area (EA19) seasonally-adjusted unemployment rate was 9.1% in July 2017, stable compared to June 2017 and down from 10.0% in July 2016. This is the lowest rate recorded in the euro area since February 2009. The EU28 unemployment rate was 7.7% in July 2017, stable compared to June 2017 and down from 8.5% in July 2016. This remains the lowest rate recorded in the EU28 since December 2008. These figures are published by Eurostat, the statistical office of the European Union. Eurostat estimates that 18.916 million men and women in the EU28, of whom 14.860 million in the euro area, were unemployed in July 2017. Compared with June 2017, the number of persons unemployed increased by 93 000 in the EU28 and by 73 000 in the euro area. Compared with July 2016, unemployment fell by 1.928 million in the EU28 and by 1.309 million in the euro area.
Among the Member States, the lowest unemployment rates in July 2017 were recorded in the Czech Republic (2.9%), Germany (3.7%) and Malta (4.1%). The highest unemployment rates were observed in Greece (21.7% in May 2017) and Spain (17.1%).
Euro area annual inflation is expected to be 1.5% in August 2017, up from 1.3% in July 2017, according to a flash estimate from Eurostat, the statistical office of the European Union. Looking at the main components of euro area inflation, energy is expected to have the highest annual rate in August (4.0%, compared with 2.2% in July), followed by services (1.6%, stable compared with July), food, alcohol & tobacco (1.4%, stable compared with July) and non-energy industrial goods (0.5%, stable compared with July).
In July 2017, 23.063 million persons were employed, +0.3% over June 2017. Unemployed were 2.950 million, +2.1% over the previous month.
Employment rate was 58.0%, +0.1 percentage points over June 2017, unemployment rate was 11.3%, +0.2 percentage points over the previous month, and inactivity rate was 34.4%, -0.3 percentage points in a month.
Youth unemployment rate (aged 15-24) was 35.5%, +0.3 percentage points over the previous month and youth unemployment ratio in the same age group was 9.5%, +0.5 percentage points over June 2017.
EUR/USD: 1.1700-10(553 m), 1.1875(726 m), 1.1900(641 m)
USD/JPY: 107.00(765 m), 108.00(393 m), 109.00(316 m), 110.00-02(570 m), 110.25(390 m)
-
Believes economy has little or no output gap
-
Does not expect a modest rise in rates will have a disproportionate effect on spending
-
Monetary policy not seeking to fully prevent boost to consumer prices from sterling's fall, but nor are we indifferent to it
-
MPC has tools to respond either way to swings in the economy, as needed
Over a year, the Consumer Price Index (CPI) should increase by 0.9% in August 2017, after +0.7% in the previous month, according to the provisional estimate made at the end of the month. This rise in year-on-year inflation should result from a sharp acceleration in energy prices and a slightly faster growth, in services prices. On the other hand, food prices are set to slow down slightly and manufactured product prices should fall more sharply than in the previous month.
Over one month, consumer prices should recover sharply (+0.5% after -0,3% in July). This increase should mainly be due to a seasonal rebound in manufactured product prices after the summer sales in the metropolitan area, and a seasonal momentum, in the prices of some tourism-related services. Energy prices should pick up strongly, due to the annual revision in electricity fees and a rebound in petroleum product prices. Food prices are set to be stable after a slight rise in the previous month.
EUR/USD
Resistance levels (open interest**, contracts)
$1.1976 (4247)
$1.1936 (3929)
$1.1916 (2391)
Price at time of writing this review: $1.1872
Support levels (open interest**, contracts):
$1.1827 (2007)
$1.1799 (2013)
$1.1766 (3324)
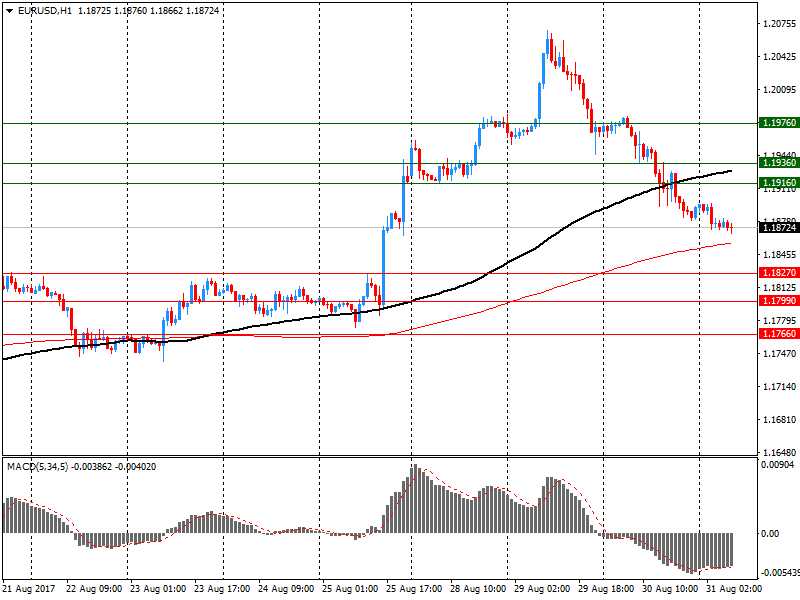
Comments:
- Overall open interest on the CALL options and PUT options with the expiration date September, 8 is 138687 contracts (according to data from August, 30) with the maximum number of contracts with strike price $1,1600 (5961);
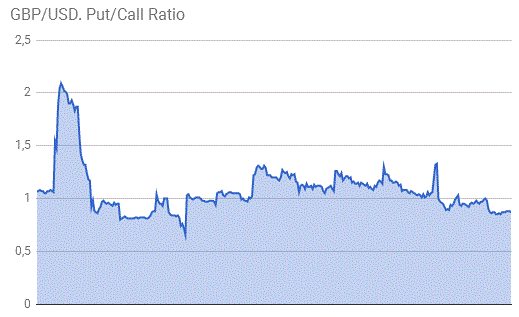
GBP/USD
Resistance levels (open interest**, contracts)
$1.3028 (3002)
$1.2997 (1255)
$1.2974 (1556)
Price at time of writing this review: $1.2918
Support levels (open interest**, contracts):
$1.2886 (1951)
$1.2859 (2587)
$1.2825 (2369)
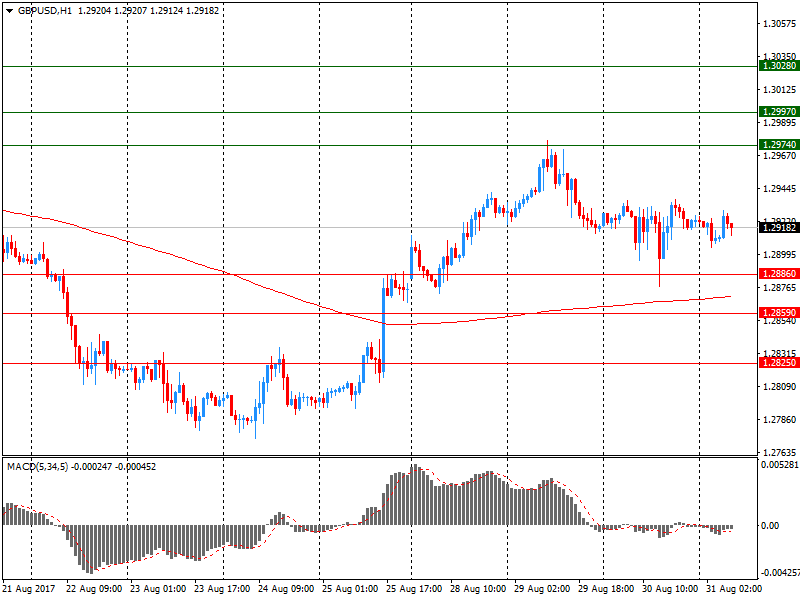
Comments:
- Overall open interest on the CALL options with the expiration date September, 8 is 37938 contracts, with the maximum number of contracts with strike price $1,3150 (3078);
- Overall open interest on the PUT options with the expiration date September, 8 is 32680 contracts, with the maximum number of contracts with strike price $1,2900 (2587);
- The ratio of PUT/CALL was 0.86 versus 0.87 from the previous trading day according to data from August, 30
* - The Chicago Mercantile Exchange bulletin (CME) is used for the calculation.
** - Open interest takes into account the total number of option contracts that are open at the moment.
Actual expenditure (volume terms):
-
The trend volume estimate for total new capital expenditure rose 0.6% in the june quarter 2017 while the seasonally adjusted estimate rose by 0.8%.
-
The trend volume estimate for buildings and structures rose by 0.3% in the june quarter 2017 while the seasonally adjusted estimate fell by 0.6%.
-
The trend volume estimate for equipment, plant and machinery rose by 1.1% in the june quarter 2017 while the seasonally adjusted estimate rose by 2.7%.
Expected expenditure (current price terms):
-
This issue includes the seventh estimate (estimate 7) for 2016-17 and the third estimate (estimate 3) for 2017-18.
-
Estimate 7 for 2016-17 is $114,281m. This is 10.5% lower than estimate 7 for 2015-16. Estimate 7 is 1.0% higher than estimate 6 for 2016-17.
-
Estimate 3 for 2017-18 is $101,783m. This is 3.6% lower than estimate 3 for 2016-17. Estimate 3 is 17.6% higher than estimate 2 for 2017-18.
China's manufacturing PMI fell by 0.3 pts from the previous month to 51.4 in July, indicating a moderation in the growth in the manufacturing sector in China. 7 of the 13 sub-indices were higher than their respective levels in the previous month.
The output index dropped from 54.4 in June to 53.5 in July, showing a deceleration in output growth. The new orders index dropped by 0.3 pts in July.1 In comparison, the new export orders index fell at a faster pace, by 1.1 pts, in July, indicating that the growth in new export orders posted a sharper deceleration than the growth in new domestic orders in the month. Also noteworthy is that the input prices index rose strongly by 7.5 pts from the previous month to 57.9 in July, showing that the prices of production inputs have risen at a fast pace lately.
By size of enterprises, the PMI of 'large enterprises' came in at 52.9 in July, up from 52.7 in June. The PMI of 'medium enterprises' went down to 49.6 in July from 50.5 in June, while the PMI of 'small enterprises' fell to 48.9 in July from 50.1 in June.
According to provisional data turnover in retail trade in July 2017 was in real terms 2.7% and in nominal terms 4.2% larger than that in July 2016. The number of days open for sale was 26 in July 2017 and in July 2016.
Compared with the previous year, turnover in retail trade was in the first seven months of 2017 in real terms 2.8% and in nominal terms 4.6% larger than in the corresponding period of the previous year.
European stocks rebounded from a six-month low on Wednesday, as tensions after North Korea's latest missile launch eased for now and spurred investors to take on more risk. The Stoxx Europe 600 index SXXP, +0.70% rose 0.7% to close at 371.01, after sliding 1% to settle at its lowest level since Feb. 10 on Tuesday. That drop came after North Korea launched a ballistic missile over Japan, in a move seen as another direct provocation from Pyongyang meant to destabilize the Asian region.
U.S. stock-market indexes closed higher Wednesday, with the benchmark S&P 500 posting gains for a fourth straight session after a pair of strong economic reports. Wednesday's advance was marked by bouts of volatility triggered by ongoing tensions between the U.S. and North Korea. Markets also watched President Donald Trump's speech on tax reform in Springfield, Mo. Trump called for an easy-to-understand tax code that would create jobs and higher wages.
Asian stock markets were mixed Thursday after Wall Street rose on a stronger estimate of U.S. economic growth and Chinese factory activity improved. The Shanghai Composite Index lost 0.4 per cent to 3,350.44 while Tokyo's Nikkei 225 gained 0.7 per cent to 19,652. Hong Kong's Hang Seng shed 0.4 per cent to 27,978.42 and Sydney's S&P-ASX 200 advanced 0.5 per cent to 5,700.10.


© 2000-2026. All rights reserved.
This site is managed by Teletrade D.J. LLC 2351 LLC 2022 (Euro House, Richmond Hill Road, Kingstown, VC0100, St. Vincent and the Grenadines).
The information on this website is for informational purposes only and does not constitute any investment advice.
The company does not serve or provide services to customers who are residents of the US, Canada, Iran, The Democratic People's Republic of Korea, Yemen and FATF blacklisted countries.
Making transactions on financial markets with marginal financial instruments opens up wide possibilities and allows investors who are willing to take risks to earn high profits, carrying a potentially high risk of losses at the same time. Therefore you should responsibly approach the issue of choosing the appropriate investment strategy, taking the available resources into account, before starting trading.
Use of the information: full or partial use of materials from this website must always be referenced to TeleTrade as the source of information. Use of the materials on the Internet must be accompanied by a hyperlink to teletrade.org. Automatic import of materials and information from this website is prohibited.
Please contact our PR department if you have any questions or need assistance at pr@teletrade.global.
transfers