- Analytics
- News and Tools
- Market News
Analytics, News, and Forecasts for CFD Markets: stock news — 15-02-2018.
(index / closing price / change items /% change)
Nikkei +310.81 21464.98 +1.47%
TOPIX +16.55 1719.27 +0.97%
Euro Stoxx 50 +19.80 3389.63 +0.59%
FTSE 100 +20.84 7234.81 +0.29%
DAX +7.01 12346.17 +0.06%
CAC 40 +57.26 5222.52 +1.11%
DJIA +306.88 25200.37 +1.23%
S&P 500 +32.57 2731.20 +1.21%
NASDAQ +112.82 7256.43 +1.58%
S&P/TSX +79.39 15407.66 +0.52%
Major US stock indexes finished trading in positive territory, as the rise in price of shares in the technology sector and the utilities sector compensated for the losses in the shares of the base materials sector.
A certain influence on the dynamics of trading was also provided by the US data. The Ministry of Labor reported that US producer prices rose in January, which was the last indicator of an increase in inflationary pressures in the economy. The producer price index, a measure of prices charged by companies for their goods and services, increased by 0.4% in seasonally adjusted terms in January, compared with a month earlier. This was in line with the expectations of economists. In annual terms, producer prices rose by 2.7%. Producer prices were unchanged in December, showed revised data. Until this month, prices have been growing steadily in the second half of 2017. With the exception of food and energy categories, prices rose 0.4% in January. With the exception of the unstable category of trade services, prices also increased by 0.4%, which is the highest growth since April 2017. The growth was expected to be 0.2% for both major measures. A separate report from the Ministry of Labor. showed that the number of Americans applying for new unemployment benefits rose last week, but remained close to historical lows. Initial applications for unemployment benefits, an indicator of layoffs across the United States, increased by 7,000 to 230,000 for the week ending February 10. This was in line with the expectations of economists. Weekly applications for unemployment benefits were held below 300,000 for almost three years, the longest period since 1970, when the US population was much smaller than today. Data on applications for unemployment benefits can be unstable from week to week. The four-week moving average, a more stable measure, increased by 3,500 to 228,500 last week. The number of repeated applications for unemployment benefits increased by 15,000 to 1,942,000 in the week to February 3.
Most components of the DOW index finished trading in positive territory (26 out of 30). Leader of the growth were shares of Cisco Systems, Inc. (CSCO, + 4.73%). Outsider were shares UnitedHealth Group Incorporated (UNH, -1.33%).
Almost all sectors of S & P recorded a rise. The utilities sector grew most (+ 1.7%). Decrease showed only the sector of basic materials (-0.1%).
At closing:
Dow + 1.23% 25,200.37 +306.88
Nasdaq + 1.58% 7,256.43 +112.82
S & P + 1.21% 2.731.20 +32.57
U.S. stock-index futures rose on Thursday shrugged off concerns that the Fed would quicken its pace of monetary tightening following hotter-than-expected January CPI reading.
Global Stocks:
Nikkei 21,464.98 +310.81 +1.47%
Hang Seng 31,115.43 +599.83 +1.97%
Shanghai -
S&P/ASX 5,909.00 +67.80 +1.16%
FTSE 7,239.70 +25.73 +0.36%
CAC 5,237.08 +71.82 +1.39%
DAX 12,412.12 +72.96 +0.59%
Crude $60.42 (-0.30%)
Gold $1,355.20 (-0.21%)
(company / ticker / price / change ($/%) / volume)
| 3M Co | MMM | 232.3 | 1.66(0.72%) | 3642 |
| ALCOA INC. | AA | 48.99 | 0.45(0.93%) | 2876 |
| ALTRIA GROUP INC. | MO | 65.33 | 0.15(0.23%) | 646 |
| Amazon.com Inc., NASDAQ | AMZN | 1,463.78 | 12.73(0.88%) | 119475 |
| American Express Co | AXP | 96.96 | 0.73(0.76%) | 1746 |
| AMERICAN INTERNATIONAL GROUP | AIG | 59.75 | 0.34(0.57%) | 844 |
| Apple Inc. | AAPL | 169.5 | 2.13(1.27%) | 524760 |
| AT&T Inc | T | 36.52 | 0.11(0.30%) | 24004 |
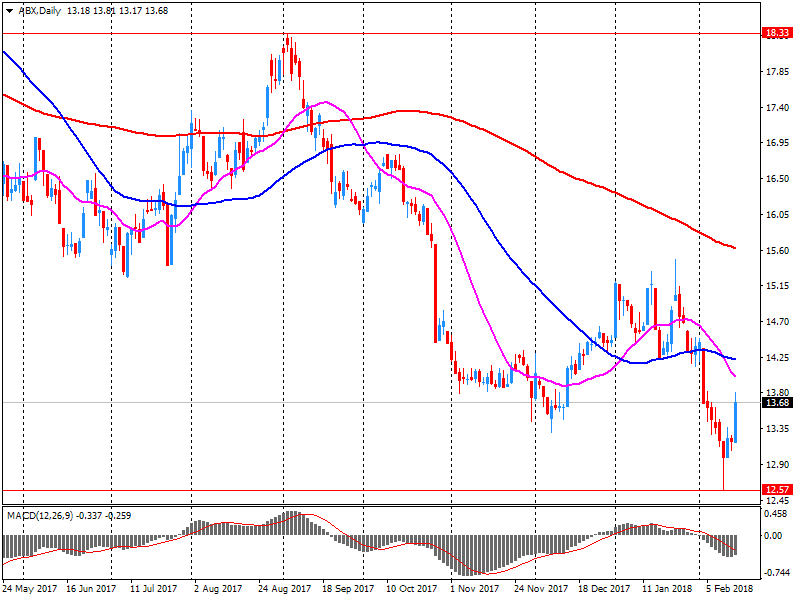
| Barrick Gold Corporation, NYSE | ABX | 13.7 | 0.05(0.37%) | 15272 |
| Boeing Co | BA | 348.1 | 3.25(0.94%) | 24220 |
| Caterpillar Inc | CAT | 159.32 | 1.26(0.80%) | 8984 |
| Chevron Corp | CVX | 112.91 | 0.40(0.36%) | 1620 |
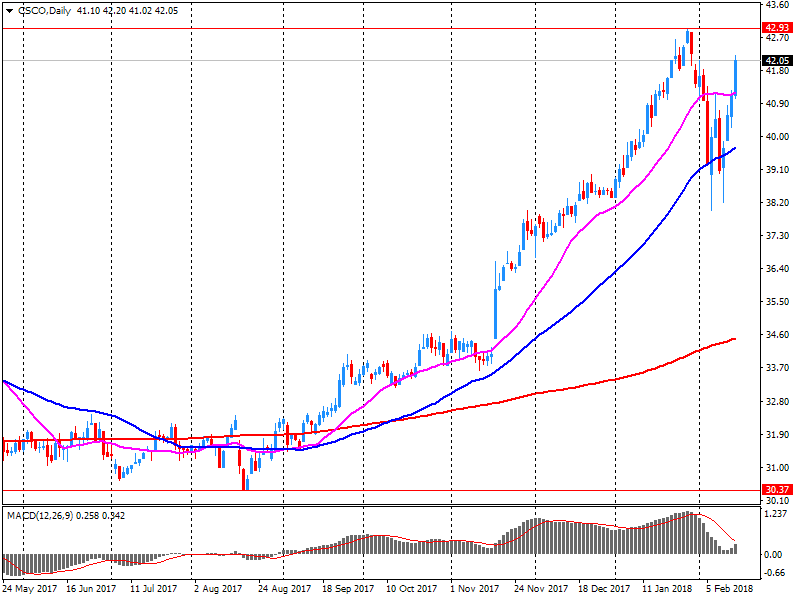
| Cisco Systems Inc | CSCO | 45.23 | 3.14(7.46%) | 591433 |
| Citigroup Inc., NYSE | C | 77.25 | 0.54(0.70%) | 24048 |
| Deere & Company, NYSE | DE | 165 | 1.72(1.05%) | 3388 |
| Exxon Mobil Corp | XOM | 76.76 | 0.30(0.39%) | 7502 |
| Facebook, Inc. | FB | 180.5 | 0.98(0.55%) | 183151 |
| Ford Motor Co. | F | 10.8 | 0.06(0.56%) | 24137 |
| Freeport-McMoRan Copper & Gold Inc., NYSE | FCX | 19.24 | 0.12(0.63%) | 40281 |
| General Electric Co | GE | 14.99 | 0.09(0.60%) | 122165 |
| General Motors Company, NYSE | GM | 42 | 0.19(0.45%) | 1864 |
| Goldman Sachs | GS | 264.85 | 2.27(0.86%) | 7017 |
| Google Inc. | GOOG | 1,076.89 | 7.19(0.67%) | 15641 |
| Hewlett-Packard Co. | HPQ | 21.58 | 0.29(1.36%) | 1130 |
| Home Depot Inc | HD | 185.7 | 1.01(0.55%) | 6133 |
| HONEYWELL INTERNATIONAL INC. | HON | 151.8 | 1.42(0.94%) | 1619 |
| Intel Corp | INTC | 45.73 | 0.35(0.77%) | 73335 |
| International Business Machines Co... | IBM | 155.5 | 0.74(0.48%) | 22607 |
| Johnson & Johnson | JNJ | 130.45 | 0.78(0.60%) | 3723 |
| JPMorgan Chase and Co | JPM | 116 | 0.97(0.84%) | 21860 |
| McDonald's Corp | MCD | 160.79 | 0.80(0.50%) | 3842 |
| Merck & Co Inc | MRK | 55.37 | 0.47(0.86%) | 1046 |
| Microsoft Corp | MSFT | 91.23 | 0.42(0.46%) | 38361 |
| Nike | NKE | 68.07 | 0.11(0.16%) | 1710 |
| Pfizer Inc | PFE | 35.4 | 0.21(0.60%) | 22460 |
| Procter & Gamble Co | PG | 81.16 | 0.48(0.59%) | 5049 |
| Starbucks Corporation, NASDAQ | SBUX | 56.31 | 0.32(0.57%) | 1291 |
| Tesla Motors, Inc., NASDAQ | TSLA | 324.1 | 1.79(0.56%) | 19605 |
| The Coca-Cola Co | KO | 44.36 | 0.26(0.59%) | 8080 |
| Travelers Companies Inc | TRV | 141.68 | 1.08(0.77%) | 634 |
| Twitter, Inc., NYSE | TWTR | 33.96 | 0.21(0.62%) | 116041 |
| United Technologies Corp | UTX | 126.62 | 0.62(0.49%) | 2800 |
| UnitedHealth Group Inc | UNH | 230 | 1.22(0.53%) | 1436 |
| Verizon Communications Inc | VZ | 49.65 | 0.14(0.28%) | 4115 |
| Visa | V | 121.25 | 0.63(0.52%) | 6626 |
| Wal-Mart Stores Inc | WMT | 102.3 | 0.60(0.59%) | 14306 |
| Walt Disney Co | DIS | 105.28 | 0.68(0.65%) | 4323 |
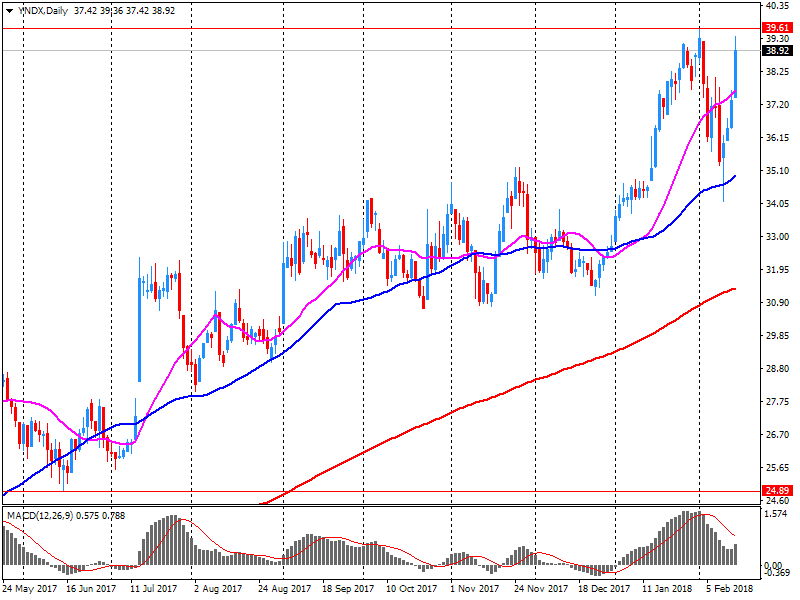
| Yandex N.V., NASDAQ | YNDX | 41.9 | 3.01(7.74%) | 257192 |
General Electric (GE) initiated with Equal Weight at Barclays
3M (MMM) initiated with Underweight at Barclays
United Tech (UTX) initiated with Overweight at Barclays
Сisco Systems (CSCO) target raised to $46 from $40 at Stifel
Yandex N.V. (YNDX) reported Q4 FY 2017 earnings of RUB15.79 per share (versus RUB9.94 in Q4 FY 2016), beating analysts' consensus estimate of RUB14.50.
The company's quarterly revenues amounted to RUB27.860 bln (+26.0% y/y), generally in-line with analysts' consensus estimate of RUB27.576 bln.
YNDX rose to $42.00 (+8.00%) in pre-market trading.
Barrick Gold (ABX) reported Q4 FY 2017 earnings of $0.22 per share (versus $0.22 in Q4 FY 2016), beating analysts' consensus estimate of $0.20.
The company's quarterly revenues amounted to $2.228 bln (-3.9% y/y), generally in-line with analysts' consensus estimate of $2.207 bln.
ABX rose to $13.72 (+0.51%) in pre-market trading.
Cisco Systems (CSCO) reported Q2 FY 2018 earnings of $0.63 per share (versus $0.57 in Q2 FY 2017), beating analysts' consensus estimate of $0.59.
The company's quarterly revenues amounted to $11.887 bln (+2.7% y/y), generally in-line with analysts' consensus estimate of $11.806 bln.
The company also issued upside guidance for Q3, projecting EPS of $0.64-0.66 (versus analysts' consensus estimate of $0.63) at Q3 revenues of ~$12.30-12.54 bln (+3-5% y/y; versus analysts' consensus estimate of $12.13 bln).
Cisco declared a quarterly dividend of $0.33 per common share, up 14% over the previous quarter's dividend, and approved a $25 billion increase to the authorization of the stock repurchase program.
CSCO rose to $45.10 (+7.15%) in pre-market trading.
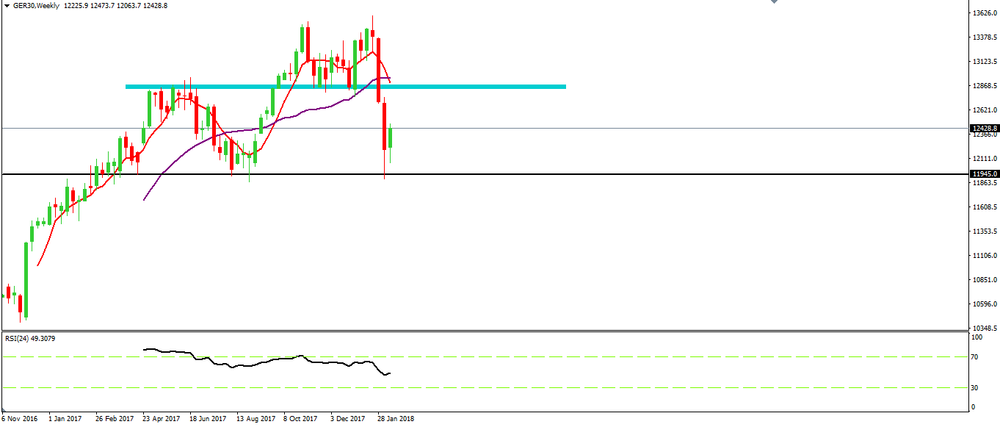
On weekly time frame chart, we can see that the DAX has depreciating for the last two weeks.
At this moment, we can see that the price is showing some signs of rejection new down movements and eventually we might have here a possible new bullish movement.
Also, we can see that there is a chart pattern (head and shoulders) which we cannot confirm yet because of the right shoulder.
Therefore, whether the price confirms the chart pattern or not, we might expect a new bullish movement (recovery by the price) until the blue zone.


© 2000-2026. All rights reserved.
This site is managed by Teletrade D.J. LLC 2351 LLC 2022 (Euro House, Richmond Hill Road, Kingstown, VC0100, St. Vincent and the Grenadines).
The information on this website is for informational purposes only and does not constitute any investment advice.
The company does not serve or provide services to customers who are residents of the US, Canada, Iran, The Democratic People's Republic of Korea, Yemen and FATF blacklisted countries.
Making transactions on financial markets with marginal financial instruments opens up wide possibilities and allows investors who are willing to take risks to earn high profits, carrying a potentially high risk of losses at the same time. Therefore you should responsibly approach the issue of choosing the appropriate investment strategy, taking the available resources into account, before starting trading.
Use of the information: full or partial use of materials from this website must always be referenced to TeleTrade as the source of information. Use of the materials on the Internet must be accompanied by a hyperlink to teletrade.org. Automatic import of materials and information from this website is prohibited.
Please contact our PR department if you have any questions or need assistance at pr@teletrade.global.
transfers