- Analiza
- Novosti i instrumenti
- Vesti sa tržišta
- AUD/JPY Price Analysis: Retreats from 83.80 amid risk-off market sentiment
AUD/JPY Price Analysis: Retreats from 83.80 amid risk-off market sentiment
- AUD/JPY reaches a fresh three-month high around the 83.80 range.
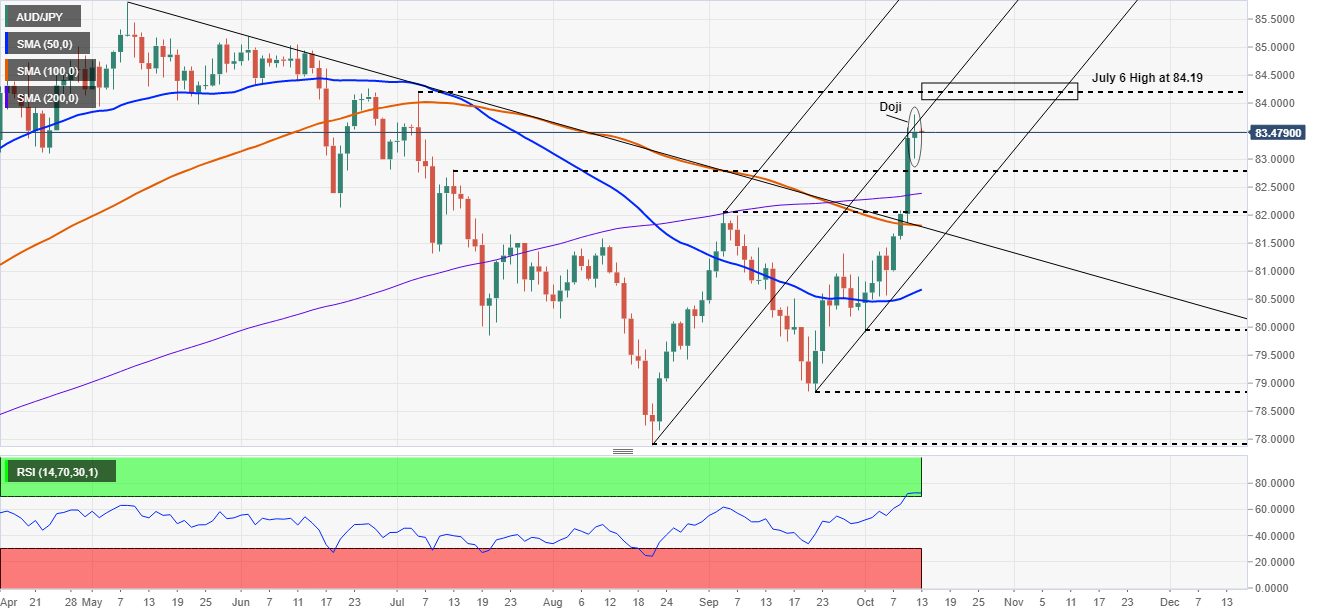
- AUD/JPY: A Doji in the daily chart depicts that the pair might correct lower before resuming the uptrend, supported by momentum indicators.
The AUD/JPY is trading unchanged as the Asian session begins and is trading at 83.48, barely down 0.01%, during the day at the time of writing. The market sentiment is mixed, as depicted by Asian equity futures, seesawing between gainers and losers.
AUD/JPY Price Forecast: Technical outlook
Daily chart
On Tuesday, the AUD/JPY reached 83.80 above the middle of the Andrew Pitchfork channel, but strong seeling pressure capped the move, retreating the cross-currency to 83.50. A breach of the latter could accelerate an upside move towards the July 6 high at 84.19, but oversold levels at the Relative Strength Index (RSI) at 73, suggests the pair could be headed for a correction towards the 200-day moving average (DMA) at 82.37, before resuming a move towards higher prices. Nevertheless, in case of a push below the 200-DMA, the September 3 high at 82.02 will be the next support before reaching the 100-DMA at 81.83.
Worth notice: the October 12 price action portrayed a Doji in the middle of the Pitchfork channel, meaning the pair could reverse the upward trend.
1-hour chart
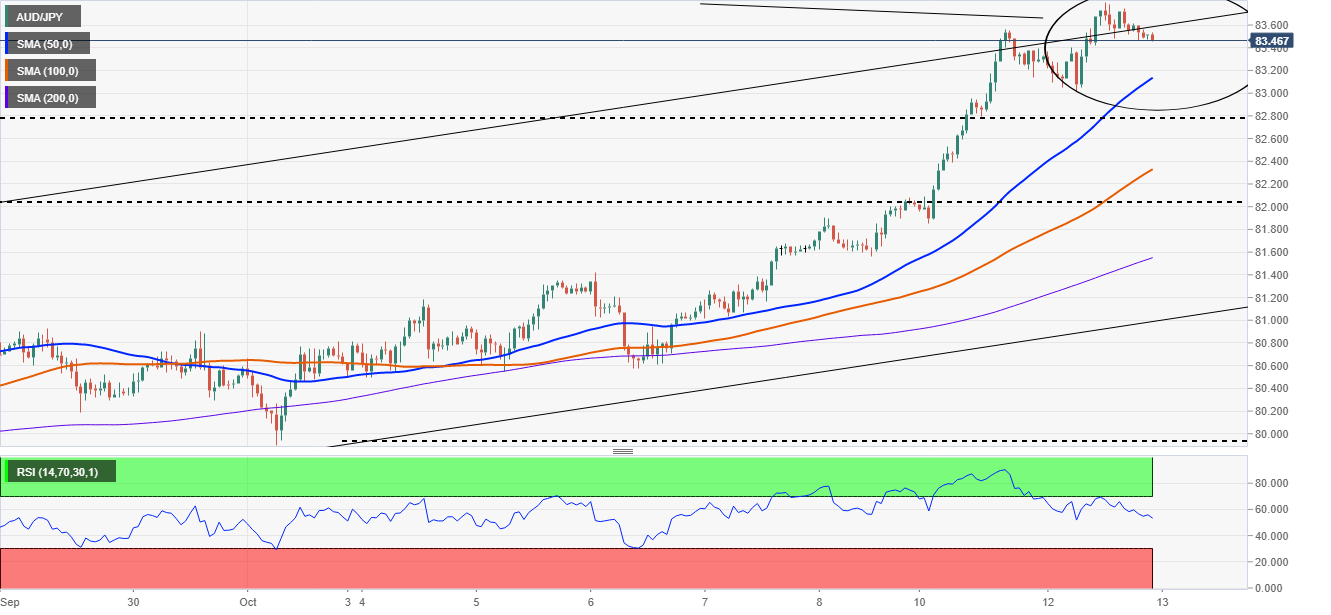
The AUD/JPY is trading within a narrow range between 83.50-83.80. A break beyond the upside level could open the way towards 84.00. However, the Relative Strength Index at 53, suggesting that an upside move might be on the cards. Failure to an upside break could signal that consolidation or a correction could lie ahead for the AUD/JPY in the near term.
On the flip side, a break beneath the bottom level will find the daily pivot at 83.41 as the first support level, followed by the 83.00 psychological level. A breach beneath the latter would exert downward pressure on the pair towards the confluence of the 50-simple moving average (SMA) and the S1 pivot level around the 83.12-83.22 area.


© 2000-2026. Sva prava zaštićena.
Sajt je vlasništvo kompanije Teletrade D.J. LLC 2351 LLC 2022 (Euro House, Richmond Hill Road, Kingstown, VC0100, St. Vincent and the Grenadines).
Svi podaci koji se nalaze na sajtu ne predstavljaju osnovu za donošenje investicionih odluka, već su informativnog karaktera.
The company does not serve or provide services to customers who are residents of the US, Canada, Iran, The Democratic People's Republic of Korea, Yemen and FATF blacklisted countries.
Izvršenje trgovinskih operacija sa finansijskim instrumentima upotrebom marginalne trgovine pruža velike mogućnosti i omogućava investitorima ostvarivanje visokih prihoda. Međutim, takav vid trgovine povezan je sa potencijalno visokim nivoom rizika od gubitka sredstava. Проведение торговых операций на финанcовых рынках c маржинальными финанcовыми инcтрументами открывает широкие возможноcти, и позволяет инвеcторам, готовым пойти на риcк, получать выcокую прибыль, но при этом неcет в cебе потенциально выcокий уровень риcка получения убытков. Iz tog razloga je pre započinjanja trgovine potrebno odlučiti o izboru odgovarajuće investicione strategije, uzimajući u obzir raspoložive resurse.
Upotreba informacija: U slučaju potpunog ili delimičnog preuzimanja i daljeg korišćenja materijala koji se nalazi na sajtu, potrebno je navesti link odgovarajuće stranice na sajtu kompanije TeleTrade-a kao izvora informacija. Upotreba materijala na internetu mora biti praćena hiper linkom do web stranice teletrade.org. Automatski uvoz materijala i informacija sa stranice je zabranjen.
Ako imate bilo kakvih pitanja, obratite nam se pr@teletrade.global.
транcфери