- Analiza
- Novosti i instrumenti
- Vesti sa tržišta
- Silver Price Analysis: XAG/USD breaks through a multi-month descending trend-line hurdle
Silver Price Analysis: XAG/USD breaks through a multi-month descending trend-line hurdle
- Silver rallied to over one-month tops during the early European session on Tuesday.
- The momentum seems strong enough to push the XAG/USD beyond the $24.00 mark.
Silver caught aggressive bids on Tuesday and shot to one-month tops, around the $23.70 region during the early European session.
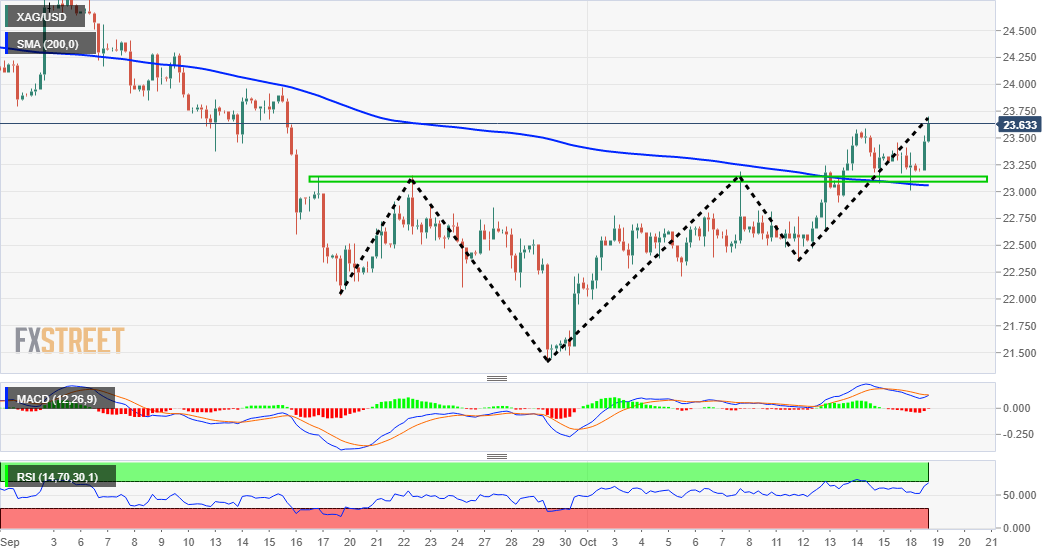
From a technical perspective, the XAG/USD showed some resilience below the 200-period SMA on the 4-hour chart and managed to defend the $23.00 mark for the second consecutive session on Monday. The subsequent positive move validated the recent bullish breakout through an inverted head and shoulders neckline. This, in turn, supports prospects for a further near-term appreciating move.
Silver 4-hour chart
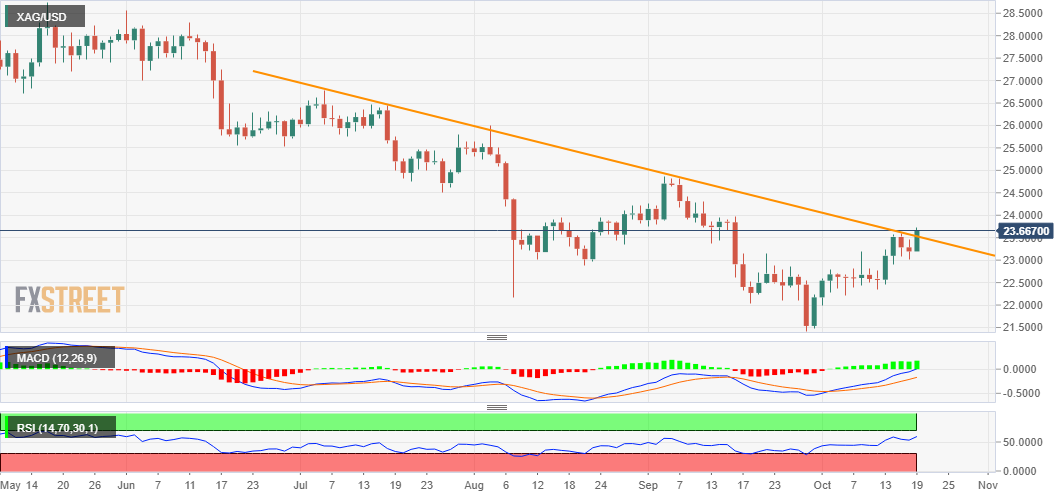
The constructive setup is reinforced by the fact that technical indicators on the daily chart have just started moving into the bullish territory and are still far from being in the overbought zone. Bulls might now be looking to build on the momentum further beyond a downward-sloping trend-line resistance, extending from July monthly swing highs, around the $26.75-80 region.
Silver daily chart
Nevertheless, the XAG/USD seems all set to extend its recent recovery move from YTD lows and aim to reclaim the $24.00 round-figure mark. This is followed by resistance near the $24.15-20 region, above which the momentum could further get extended towards the next relevant hurdle around the $24.75-80 region. The white metal could eventually climb to the key $25.00 psychological mark.
On the flip side, the $23.50 region now seems to protect the immediate downside. Any subsequent pullback might still be seen as a buying opportunity near the $23.00 mark, which should act as a strong near-term base for the XAG/USD and a key pivotal point for traders. A convincing break below might prompt some technical selling and accelerate the corrective fall towards the $22.75-70 region.
Technical levels to watch


© 2000-2026. Sva prava zaštićena.
Sajt je vlasništvo kompanije Teletrade D.J. LLC 2351 LLC 2022 (Euro House, Richmond Hill Road, Kingstown, VC0100, St. Vincent and the Grenadines).
Svi podaci koji se nalaze na sajtu ne predstavljaju osnovu za donošenje investicionih odluka, već su informativnog karaktera.
The company does not serve or provide services to customers who are residents of the US, Canada, Iran, The Democratic People's Republic of Korea, Yemen and FATF blacklisted countries.
Izvršenje trgovinskih operacija sa finansijskim instrumentima upotrebom marginalne trgovine pruža velike mogućnosti i omogućava investitorima ostvarivanje visokih prihoda. Međutim, takav vid trgovine povezan je sa potencijalno visokim nivoom rizika od gubitka sredstava. Проведение торговых операций на финанcовых рынках c маржинальными финанcовыми инcтрументами открывает широкие возможноcти, и позволяет инвеcторам, готовым пойти на риcк, получать выcокую прибыль, но при этом неcет в cебе потенциально выcокий уровень риcка получения убытков. Iz tog razloga je pre započinjanja trgovine potrebno odlučiti o izboru odgovarajuće investicione strategije, uzimajući u obzir raspoložive resurse.
Upotreba informacija: U slučaju potpunog ili delimičnog preuzimanja i daljeg korišćenja materijala koji se nalazi na sajtu, potrebno je navesti link odgovarajuće stranice na sajtu kompanije TeleTrade-a kao izvora informacija. Upotreba materijala na internetu mora biti praćena hiper linkom do web stranice teletrade.org. Automatski uvoz materijala i informacija sa stranice je zabranjen.
Ako imate bilo kakvih pitanja, obratite nam se pr@teletrade.global.
транcфери