- Analiza
- Novosti i instrumenti
- Vesti sa tržišta
- Gold Price Forecast: XAU/USD bounces but $1800 appears elusive ahead of a Big week – Confluence Detector
Gold Price Forecast: XAU/USD bounces but $1800 appears elusive ahead of a Big week – Confluence Detector
- Gold price rebounds but not out of the woods yet amid firmer USD, yields.
- Gold’s fate hinges on the all-important Fed decision and US NFP release.
- XAU/USD’s drop below $1,780 an ominous sign ahead of Fed.
Gold bulls are coming up for the last dance ahead of the all-important US Federal Reserve (Fed) policy decision, with odds of hints of an earlier-than-expected rate hike higher after Friday’s PCE inflation came in hotter. The US dollar remains broadly higher in tandem with the Treasury yields starting out a fresh month. The US Nonfarm Payrolls (NFP) release this Friday will also help determine the next direction in gold price.
Read: Gold Chart of the Week: Possible bear scalp for the open, longer-term outlook is mixed
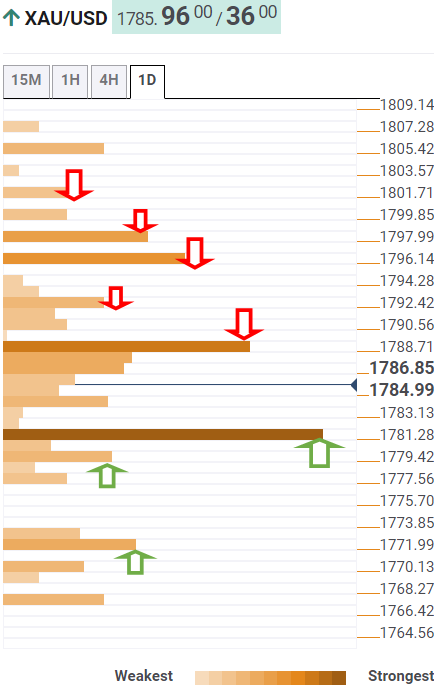
Gold Price: Key levels to watch
The Technical Confluences Detector shows that gold is approaching powerful resistance at $1789 on its road to recovery. That hurdle is the convergence of the Fibonacci 38.2% one-month and SMA100 one-day.
A sustained move above the latter is needed to take on the $1792 barrier, which is the confluence of the SMA200 one-day and SMA10 four-hour.
Up next, gold bulls eye $1796, the intersection of the SMA100 one-hour, SMA5 one-day and Fibonacci 61.8% one-week.
The Fibonacci 23.6% one-month at $1798 will be on the buyers’ radars if the bullish momentum remains unabated.
The meeting point of the previous day’s high and pivot point one-day R1 around $1801 will be the level to beat for gold bulls.
On the flip side, strong support is now seen at the previous resistance at $1782, where the SMA50 one-day and Fibonacci 23.6% one-week merge.
The next critical demand area is aligned around $1778-$1780, where the SMA100 four-hour, Fibonacci 23.6% one-day and the previous low four-hour coincide.
Further south, the confluence of the previous day’s low and Fibonacci 61.8% one-month at $1772 will test the bullish commitments.
Here is how it looks on the tool
About Technical Confluences Detector
The TCD (Technical Confluences Detector) is a tool to locate and point out those price levels where there is a congestion of indicators, moving averages, Fibonacci levels, Pivot Points, etc. If you are a short-term trader, you will find entry points for counter-trend strategies and hunt a few points at a time. If you are a medium-to-long-term trader, this tool will allow you to know in advance the price levels where a medium-to-long-term trend may stop and rest, where to unwind positions, or where to increase your position size.


© 2000-2026. Sva prava zaštićena.
Sajt je vlasništvo kompanije Teletrade D.J. LLC 2351 LLC 2022 (Euro House, Richmond Hill Road, Kingstown, VC0100, St. Vincent and the Grenadines).
Svi podaci koji se nalaze na sajtu ne predstavljaju osnovu za donošenje investicionih odluka, već su informativnog karaktera.
The company does not serve or provide services to customers who are residents of the US, Canada, Iran, The Democratic People's Republic of Korea, Yemen and FATF blacklisted countries.
Izvršenje trgovinskih operacija sa finansijskim instrumentima upotrebom marginalne trgovine pruža velike mogućnosti i omogućava investitorima ostvarivanje visokih prihoda. Međutim, takav vid trgovine povezan je sa potencijalno visokim nivoom rizika od gubitka sredstava. Проведение торговых операций на финанcовых рынках c маржинальными финанcовыми инcтрументами открывает широкие возможноcти, и позволяет инвеcторам, готовым пойти на риcк, получать выcокую прибыль, но при этом неcет в cебе потенциально выcокий уровень риcка получения убытков. Iz tog razloga je pre započinjanja trgovine potrebno odlučiti o izboru odgovarajuće investicione strategije, uzimajući u obzir raspoložive resurse.
Upotreba informacija: U slučaju potpunog ili delimičnog preuzimanja i daljeg korišćenja materijala koji se nalazi na sajtu, potrebno je navesti link odgovarajuće stranice na sajtu kompanije TeleTrade-a kao izvora informacija. Upotreba materijala na internetu mora biti praćena hiper linkom do web stranice teletrade.org. Automatski uvoz materijala i informacija sa stranice je zabranjen.
Ako imate bilo kakvih pitanja, obratite nam se pr@teletrade.global.
транcфери