- Analiza
- Novosti i instrumenti
- Vesti sa tržišta
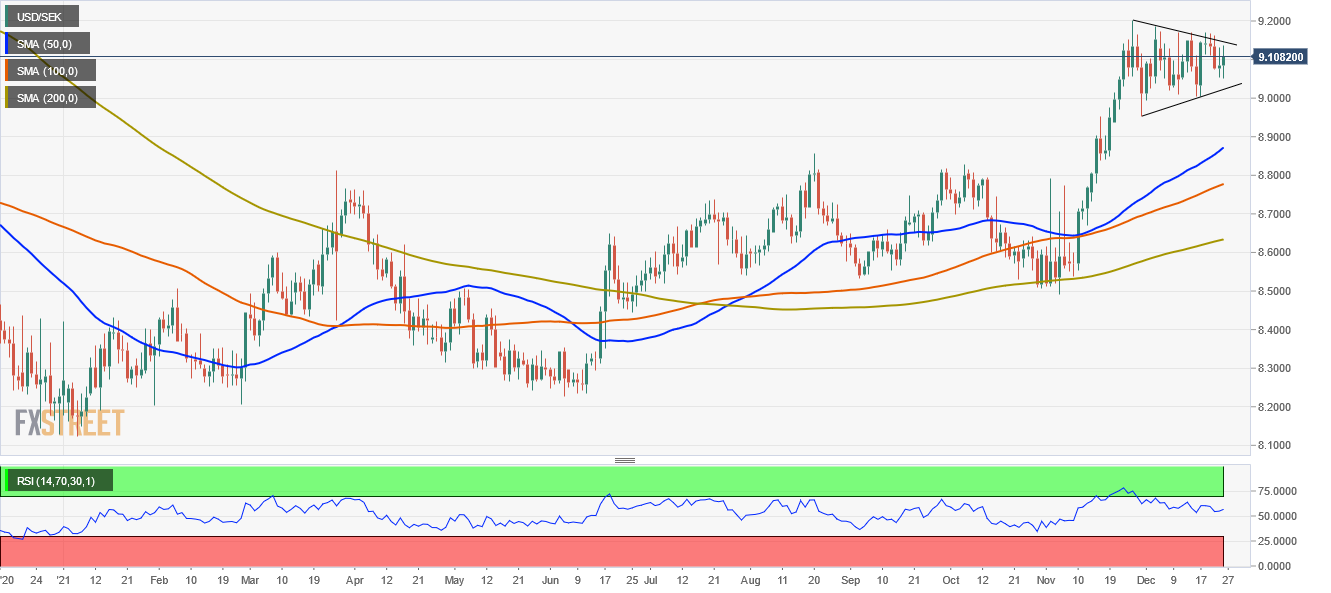
- USD/SEK Price Analysis: Bullish-flag chart pattern in the daily chart targets 9.4000
USD/SEK Price Analysis: Bullish-flag chart pattern in the daily chart targets 9.4000
- The USD/SEK advances some 0.36% during the day at press time.
- Thin market liquidity conditions have favored the greenback, which advances against most G8 currencies.
- USD/SEK Price Forecast: A textbook bullish-flag chart patterns, targets 9.4000.
The USD/SEK advances late in the European session, trading at 9.1256 at the time of writing. On Friday, Wall Street is closed in the US in observance of Christmas; US equity and money markets would re-open on Monday.
Thin market liquidity conditions keep the greenback in the right foot against most G8 majors, except for the British pound, gaining some 0.03%. In the equity markets, most European bourses that opened on Friday are in the green, except for the CAC 40, down some 0.28%.
A recap for US money markets, the US 10-year Treasury yield finished the week at 1.493%, while the US Dollar Index clung to the 96.00 figure, at 96.06, despite losing in the last three trading sessions ahead of Christmas eve.
USD/SEK Price Forecast: Technical outlook
During the Asian and European session, the USD/SEK dipped as low as 9.0500, pierced the December 22 daily low at 9.0535. However, as European traders got to their desks, the pair rallied up to the December 23 daily high around 9.1323, which capped the upward move, settling around current levels.
From the daily chart perspective, the USD/SEK depicts the formation of a “perfect” textbook bullish-flag chart pattern, formed through the month of December, that in the event of breaking around the 9.1500 figure would target 9.4000.
Nevertheless, it would find some hurdles on the way north. The first resistance would be the psychological 9.1500 figure. A breach of the latter would expose successive daily highs/resistance levels reached in December, like the December 20 daily high at 9.1704, followed by the December 3 high at 9.1864, and then the November 26 YTD high at 9.2026.
On the flip side, the first support would be 9.0500. A break below that level would expose the December 16 9.0043, followed by the figure at 9.000.


© 2000-2026. Sva prava zaštićena.
Sajt je vlasništvo kompanije Teletrade D.J. LLC 2351 LLC 2022 (Euro House, Richmond Hill Road, Kingstown, VC0100, St. Vincent and the Grenadines).
Svi podaci koji se nalaze na sajtu ne predstavljaju osnovu za donošenje investicionih odluka, već su informativnog karaktera.
The company does not serve or provide services to customers who are residents of the US, Canada, Iran, The Democratic People's Republic of Korea, Yemen and FATF blacklisted countries.
Izvršenje trgovinskih operacija sa finansijskim instrumentima upotrebom marginalne trgovine pruža velike mogućnosti i omogućava investitorima ostvarivanje visokih prihoda. Međutim, takav vid trgovine povezan je sa potencijalno visokim nivoom rizika od gubitka sredstava. Проведение торговых операций на финанcовых рынках c маржинальными финанcовыми инcтрументами открывает широкие возможноcти, и позволяет инвеcторам, готовым пойти на риcк, получать выcокую прибыль, но при этом неcет в cебе потенциально выcокий уровень риcка получения убытков. Iz tog razloga je pre započinjanja trgovine potrebno odlučiti o izboru odgovarajuće investicione strategije, uzimajući u obzir raspoložive resurse.
Upotreba informacija: U slučaju potpunog ili delimičnog preuzimanja i daljeg korišćenja materijala koji se nalazi na sajtu, potrebno je navesti link odgovarajuće stranice na sajtu kompanije TeleTrade-a kao izvora informacija. Upotreba materijala na internetu mora biti praćena hiper linkom do web stranice teletrade.org. Automatski uvoz materijala i informacija sa stranice je zabranjen.
Ako imate bilo kakvih pitanja, obratite nam se pr@teletrade.global.
транcфери