- Analiza
- Novosti i instrumenti
- Vesti sa tržišta
- Gold Price Forecast: XAU/USD faces a wall of resistances around $1,812 – Confluence Detector
Gold Price Forecast: XAU/USD faces a wall of resistances around $1,812 – Confluence Detector
- Gold price is retreating from multi-day top but holds comfortably above $1,800.
- The US dollar rebound is weighing on gold but weaker yields could cap the losses.
- Gold awaits a sustained move above $1,815 amid favorable technicals.
Gold price extended the previous week’s upbeat momentum into a fresh on Monday, but bulls fail to sustain at higher levels amid a lack of fresh catalysts and thin liquidity. Gold price is easing from six-day highs, courtesy of the rebound in the US dollar across the board. However, weaker Treasury yields lend support to bulls, limiting the corrective decline in gold price. Looking ahead, gold price will remain at the mercy of year-end flows, dynamics in the dollar and the yields.
Read: Gold 2022 Outlook: Correlation with US T-bond yields to drive yellow metal
Gold Price: Key levels to watch
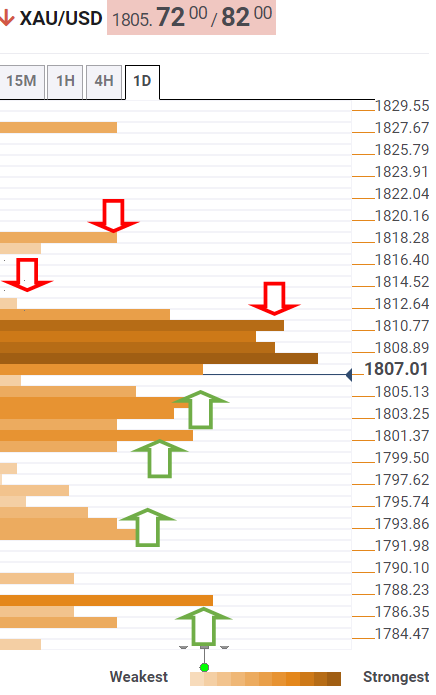
The Technical Confluences Detector shows that the gold price is turning south after facing a wall of resistances stacked up around $1,1812.
Around that price zone, the pivot point one-day R2, Fibonacci 161.8% one-day and the previous high four-hour coincide.
A sustained move above the latter is needed to take out the December month highs of $1,814.
Acceptance above the monthly peak will put the pivot point one-day R2 at $1,817 to test.
Alternatively, immediate support is aligned at $1,803, the confluence of the Fibonacci 38.2% one-month and SMA50 one-hour.
The next stop for gold sellers is seen at $1,800, the intersection of the SMA50 one-day, Fibonacci 38.2% one-week and SMA5 one-day.
If the selling pressure intensifies, then bears would target $1,792, the point of contact of the Fibonacci 61.8% one-week, SMA10 one-day and pivot point one-week S1.
The next line of defense for XAU bulls is seen at $1,789, where the SMA100 one-day appears.
Further down, the confluence of the Fibonacci 23.6% one-month and SMA100 four-hour at $1,787 will get tested.
Here is how it looks on the tool
About Technical Confluences Detector
The TCD (Technical Confluences Detector) is a tool to locate and point out those price levels where there is a congestion of indicators, moving averages, Fibonacci levels, Pivot Points, etc. If you are a short-term trader, you will find entry points for counter-trend strategies and hunt a few points at a time. If you are a medium-to-long-term trader, this tool will allow you to know in advance the price levels where a medium-to-long-term trend may stop and rest, where to unwind positions, or where to increase your position size.


© 2000-2026. Sva prava zaštićena.
Sajt je vlasništvo kompanije Teletrade D.J. LLC 2351 LLC 2022 (Euro House, Richmond Hill Road, Kingstown, VC0100, St. Vincent and the Grenadines).
Svi podaci koji se nalaze na sajtu ne predstavljaju osnovu za donošenje investicionih odluka, već su informativnog karaktera.
The company does not serve or provide services to customers who are residents of the US, Canada, Iran, The Democratic People's Republic of Korea, Yemen and FATF blacklisted countries.
Izvršenje trgovinskih operacija sa finansijskim instrumentima upotrebom marginalne trgovine pruža velike mogućnosti i omogućava investitorima ostvarivanje visokih prihoda. Međutim, takav vid trgovine povezan je sa potencijalno visokim nivoom rizika od gubitka sredstava. Проведение торговых операций на финанcовых рынках c маржинальными финанcовыми инcтрументами открывает широкие возможноcти, и позволяет инвеcторам, готовым пойти на риcк, получать выcокую прибыль, но при этом неcет в cебе потенциально выcокий уровень риcка получения убытков. Iz tog razloga je pre započinjanja trgovine potrebno odlučiti o izboru odgovarajuće investicione strategije, uzimajući u obzir raspoložive resurse.
Upotreba informacija: U slučaju potpunog ili delimičnog preuzimanja i daljeg korišćenja materijala koji se nalazi na sajtu, potrebno je navesti link odgovarajuće stranice na sajtu kompanije TeleTrade-a kao izvora informacija. Upotreba materijala na internetu mora biti praćena hiper linkom do web stranice teletrade.org. Automatski uvoz materijala i informacija sa stranice je zabranjen.
Ako imate bilo kakvih pitanja, obratite nam se pr@teletrade.global.
транcфери