- Analiza
- Novosti i instrumenti
- Vesti sa tržišta
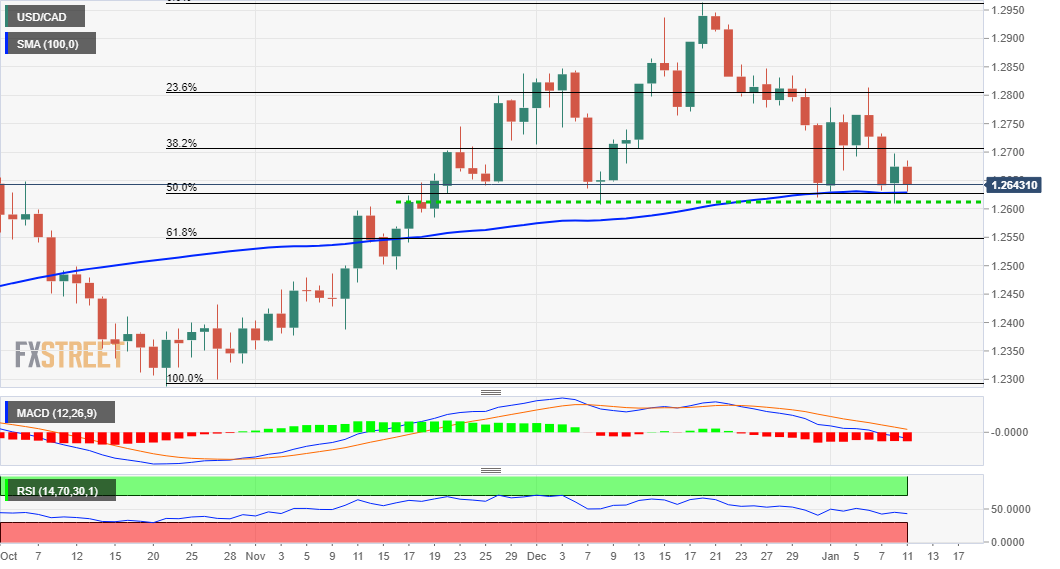
- USD/CAD Price Analysis: Bears flirt with 100-DMA/50% Fibo. confluence, below mid-1.2600s
USD/CAD Price Analysis: Bears flirt with 100-DMA/50% Fibo. confluence, below mid-1.2600s
- USD/CAD struggled to capitalize on the overnight bounce and met with a fresh supply on Tuesday.
- The technical set-up supports prospects for an extension of the recent pullback from a one-year high.
- Bears, however, might wait for a convincing break below the 1.2600 mark before placing fresh bets.
The USD/CAD pair struggled to capitalize on the previous day's goodish rebound from the vicinity of the 1.2600 mark, or a one-month low and met with a fresh supply on Tuesday. The pair maintained its offered tone through the first half of the European session and was last seen trading just below mid-1.2600s.
From a technical perspective, the USD/CAD pair, so far, has managed to hold its neck above confluence support comprising of 100-day SMA and the 50% Fibonacci level of the 1.2288-1.2964 move up. This is closely followed by the overnight swing low, which if broken will be seen as a fresh trigger for bearish traders.
Given that oscillators on the daily chart have started gaining negative traction, a convincing break below will set the stage for an extension of the recent pullback from a one-year high set in December. The USD/CAD pair might then accelerate the fall to the 1.2540 area (61.8% Fibo.) en-route the key 1.2500 psychological mark.
On the flip side, the overnight swing high, around the 1.2700 mark, which coincides with the 38.2% Fibo. level, now seems to act as an immediate strong barrier. Some follow-through buying might push spot prices towards the 1.2755-60 horizontal resistance, above which bulls could aim to conquer the 1.2800 mark.
The latter also represents the 23.6% Fibo. level hurdle and should act as a key pivotal point for traders. A sustained strength beyond might negate any near-term negative bias and trigger a short-covering move, which might push the USD/CAD pair towards the next relevant hurdle near the 1.2860 horizontal zone.
USD/CAD daily chart
Levels to watch


© 2000-2026. Sva prava zaštićena.
Sajt je vlasništvo kompanije Teletrade D.J. LLC 2351 LLC 2022 (Euro House, Richmond Hill Road, Kingstown, VC0100, St. Vincent and the Grenadines).
Svi podaci koji se nalaze na sajtu ne predstavljaju osnovu za donošenje investicionih odluka, već su informativnog karaktera.
The company does not serve or provide services to customers who are residents of the US, Canada, Iran, The Democratic People's Republic of Korea, Yemen and FATF blacklisted countries.
Izvršenje trgovinskih operacija sa finansijskim instrumentima upotrebom marginalne trgovine pruža velike mogućnosti i omogućava investitorima ostvarivanje visokih prihoda. Međutim, takav vid trgovine povezan je sa potencijalno visokim nivoom rizika od gubitka sredstava. Проведение торговых операций на финанcовых рынках c маржинальными финанcовыми инcтрументами открывает широкие возможноcти, и позволяет инвеcторам, готовым пойти на риcк, получать выcокую прибыль, но при этом неcет в cебе потенциально выcокий уровень риcка получения убытков. Iz tog razloga je pre započinjanja trgovine potrebno odlučiti o izboru odgovarajuće investicione strategije, uzimajući u obzir raspoložive resurse.
Upotreba informacija: U slučaju potpunog ili delimičnog preuzimanja i daljeg korišćenja materijala koji se nalazi na sajtu, potrebno je navesti link odgovarajuće stranice na sajtu kompanije TeleTrade-a kao izvora informacija. Upotreba materijala na internetu mora biti praćena hiper linkom do web stranice teletrade.org. Automatski uvoz materijala i informacija sa stranice je zabranjen.
Ako imate bilo kakvih pitanja, obratite nam se pr@teletrade.global.
транcфери