- Analiza
- Novosti i instrumenti
- Vesti sa tržišta
- Gold Price Forecast: XAU/USD looks north towards $1,837 ahead of US inflation – Confluence Detector
Gold Price Forecast: XAU/USD looks north towards $1,837 ahead of US inflation – Confluence Detector
- Gold price pauses as bulls take a breather ahead of the US inflation data.
- Treasury yields and risk sentiment remain the key drivers impacting gold price.
- Gold has room to rise amid inflation fears and bull cross.
Gold price is treading water on Wednesday while sitting at the highest levels in roughly two weeks near $1,830. The pullback in the US Treasury yields from two-and-a-half year highs fuelled a drop in the dollar across its main peers, limiting the retreat in gold price. The further upside, however, remains capped by the risk-on market mood, thanks to the Wall Street tech boost.
In absence of significant US macro data, gold price will continue to track the yields’ price action, as investors keep an eye on the Russia-Ukraine geopolitical developments. Cleveland Fed Chief Loretta Mester’s speech and 10-year Treasuries auction will be awaited as well for any fresh impulse on gold trading but the reaction could be limited ahead of Thursday’s all-important US inflation data,
Read: Gold prices surge ahead of key inflation data – What’s next?
Gold Price: Key levels to watch
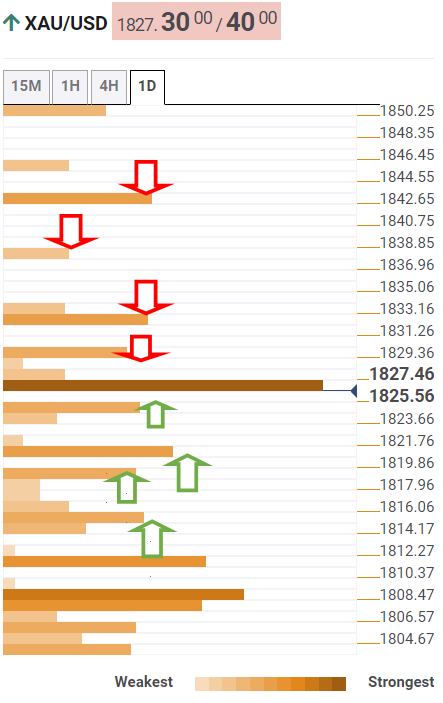
The Technical Confluences Detector shows that the gold price is yearning for acceptance above powerful resistance at $1,826, which is the convergence of the Fibonacci 23.6% one-day, Fibonacci 61.8% one-month and SMA5 four-hour.
The next bullish target is placed at the previous day’s high of $1,829, above which fresh buying opportunities will emerge towards $1,832, the confluence of the pivot point one-day R1 and pivot point one-week R2.
Further up, the pivot point one-day R2 at $1,837 will challenge the bearish commitments en-route $1,843, where the pivot point one-month R1 aligns.
On the flip side, immediate support is seen at the Fibonacci 38.2% one-day at $1,824, below which sellers will gear up for a test of $1,820.
That level is the point of intersection of the Fibonacci 61.8% one-day and pivot point one-week R1.
The additional declines will seek a test of a dense cluster of healthy support levels around $1,815, where the SMA200 four-hour, the previous week’s high and SMA5 one-day coincide.
Here is how it looks on the tool
About Technical Confluences Detector
The TCD (Technical Confluences Detector) is a tool to locate and point out those price levels where there is a congestion of indicators, moving averages, Fibonacci levels, Pivot Points, etc. If you are a short-term trader, you will find entry points for counter-trend strategies and hunt a few points at a time. If you are a medium-to-long-term trader, this tool will allow you to know in advance the price levels where a medium-to-long-term trend may stop and rest, where to unwind positions, or where to increase your position size.


© 2000-2026. Sva prava zaštićena.
Sajt je vlasništvo kompanije Teletrade D.J. LLC 2351 LLC 2022 (Euro House, Richmond Hill Road, Kingstown, VC0100, St. Vincent and the Grenadines).
Svi podaci koji se nalaze na sajtu ne predstavljaju osnovu za donošenje investicionih odluka, već su informativnog karaktera.
The company does not serve or provide services to customers who are residents of the US, Canada, Iran, The Democratic People's Republic of Korea, Yemen and FATF blacklisted countries.
Izvršenje trgovinskih operacija sa finansijskim instrumentima upotrebom marginalne trgovine pruža velike mogućnosti i omogućava investitorima ostvarivanje visokih prihoda. Međutim, takav vid trgovine povezan je sa potencijalno visokim nivoom rizika od gubitka sredstava. Проведение торговых операций на финанcовых рынках c маржинальными финанcовыми инcтрументами открывает широкие возможноcти, и позволяет инвеcторам, готовым пойти на риcк, получать выcокую прибыль, но при этом неcет в cебе потенциально выcокий уровень риcка получения убытков. Iz tog razloga je pre započinjanja trgovine potrebno odlučiti o izboru odgovarajuće investicione strategije, uzimajući u obzir raspoložive resurse.
Upotreba informacija: U slučaju potpunog ili delimičnog preuzimanja i daljeg korišćenja materijala koji se nalazi na sajtu, potrebno je navesti link odgovarajuće stranice na sajtu kompanije TeleTrade-a kao izvora informacija. Upotreba materijala na internetu mora biti praćena hiper linkom do web stranice teletrade.org. Automatski uvoz materijala i informacija sa stranice je zabranjen.
Ako imate bilo kakvih pitanja, obratite nam se pr@teletrade.global.
транcфери