- Analiza
- Novosti i instrumenti
- Vesti sa tržišta
- Gold Price Forecast: XAU/USD looks vulnerable whilst below $1,941 – Confluence Detector
Gold Price Forecast: XAU/USD looks vulnerable whilst below $1,941 – Confluence Detector
- Gold price remains stuck in a familiar range below $1,940, lacking a clear direction.
- Treasury yields firm up on hawkish Fed while the Russia-Ukraine crisis rages on.
- Gold bulls to face an uphill battle amid hawkish Fed, Ukraine saga.
Amidst the hawkish Fed’s outlook and the Russia-Ukraine stand-off, gold price is struggling to find a clear direction. The bright metal continues to gyrate in a $20 narrow range so far this week, looking for a decisive break in either direction. Fed Chair Jerome Powell remains confident on the US economy, backing a 50bps rate hike in May. The aggressive Fed’s tightening plans have pushed the US Treasury yields through the roof, capping gold’s upside. Meanwhile, increased Russian hostilities on Ukraine and a stalemate on the peace talks keep the downside cushioned in gold price.
Read: Gold Price Forecast: XAU/USD to offset Fed rate hikes by virtue of safe-haven demand – ANZ
Gold Price: Key levels to watch
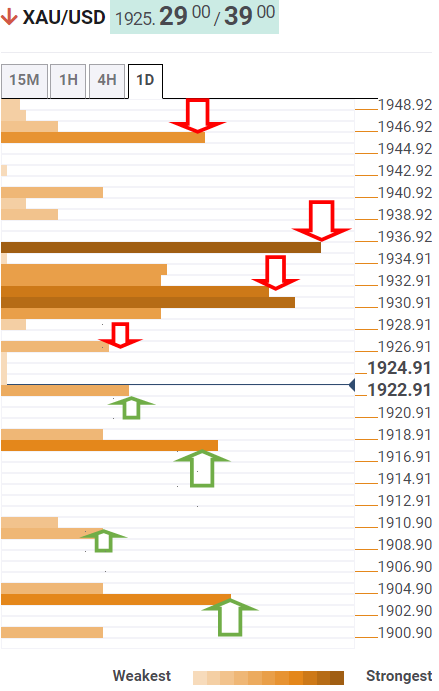
The Technical Confluences Detector shows that gold price is extending declines to test the pivot point one-day S1 at $1,923.
Acceptance below that level will call on sellers to target strong support at $1,918, which is the convergence of the Fibonacci 23.6% one-week, the previous day’s low and Bollinger Band four-hour Lower.
If the sell-off intensifies, then a sharp drop towards the confluence of the SMA200 four-hour and the pivot point one-day S2 at $1,909 cannot be ruled out.
The intersection of the Fibonacci 161.8% one-day and Fibonacci 38.2% one-month at $1,904 will be a level to beat for gold bears.
Alternatively, if bulls jump back into the game, then immediate resistance is seen at $1,926, the Fibonacci 61.8% one-day.
Further up, gold bulls will need to find a strong foothold above a dense cluster of resistance levels around $1,931.
That level comprises of SMA5 one-day, SMA10 four-hour, Fibonacci 38.2% one-day and one-week.
The next powerful upside barrier is that of the Fibonacci 26.3% one-day, where the $1,936 level aligns.
The previous day’s high of $1,941 will be next on buyers’ radars on a sustained move higher.
Here is how it looks on the tool
About Technical Confluences Detector
The TCD (Technical Confluences Detector) is a tool to locate and point out those price levels where there is a congestion of indicators, moving averages, Fibonacci levels, Pivot Points, etc. If you are a short-term trader, you will find entry points for counter-trend strategies and hunt a few points at a time. If you are a medium-to-long-term trader, this tool will allow you to know in advance the price levels where a medium-to-long-term trend may stop and rest, where to unwind positions, or where to increase your position size.


© 2000-2026. Sva prava zaštićena.
Sajt je vlasništvo kompanije Teletrade D.J. LLC 2351 LLC 2022 (Euro House, Richmond Hill Road, Kingstown, VC0100, St. Vincent and the Grenadines).
Svi podaci koji se nalaze na sajtu ne predstavljaju osnovu za donošenje investicionih odluka, već su informativnog karaktera.
The company does not serve or provide services to customers who are residents of the US, Canada, Iran, The Democratic People's Republic of Korea, Yemen and FATF blacklisted countries.
Izvršenje trgovinskih operacija sa finansijskim instrumentima upotrebom marginalne trgovine pruža velike mogućnosti i omogućava investitorima ostvarivanje visokih prihoda. Međutim, takav vid trgovine povezan je sa potencijalno visokim nivoom rizika od gubitka sredstava. Проведение торговых операций на финанcовых рынках c маржинальными финанcовыми инcтрументами открывает широкие возможноcти, и позволяет инвеcторам, готовым пойти на риcк, получать выcокую прибыль, но при этом неcет в cебе потенциально выcокий уровень риcка получения убытков. Iz tog razloga je pre započinjanja trgovine potrebno odlučiti o izboru odgovarajuće investicione strategije, uzimajući u obzir raspoložive resurse.
Upotreba informacija: U slučaju potpunog ili delimičnog preuzimanja i daljeg korišćenja materijala koji se nalazi na sajtu, potrebno je navesti link odgovarajuće stranice na sajtu kompanije TeleTrade-a kao izvora informacija. Upotreba materijala na internetu mora biti praćena hiper linkom do web stranice teletrade.org. Automatski uvoz materijala i informacija sa stranice je zabranjen.
Ako imate bilo kakvih pitanja, obratite nam se pr@teletrade.global.
транcфери