- Analiza
- Novosti i instrumenti
- Vesti sa tržišta
- Gold Price Forecast: XAU/USD eyes $1,906 and $1,912 on less hawkish Fed – Confluence Detector
Gold Price Forecast: XAU/USD eyes $1,906 and $1,912 on less hawkish Fed – Confluence Detector
- Gold Price extends the rebound as the US dollar corrects with Treasury yields.
- Fed tempers aggressive rate hike bets, lifts the overall market mood.
- Healthy support levels cap gold’s downside, more recovery gains in the offing.
Gold Price is capitalizing on an overdue correction in the US dollar, as the Fed poured cold water on aggressive tightening bets. Fed Chair Jerome Powell explicitly said Wednesday that the US central bank is not considering a 75 bps rate hike in June, sounding a less hawkish tone than markets had expected. The US Treasury yields also took a beating while the Wall Street indices gallops on a risk-on market profile. The dollar also felt the pain from reduced demand for safe havens, aiding the Gold Price rebound. Looking forward, the US Nonfarm Payrolls will offer fresh insights on the Fed’s forward guidance. In the meantime, the broader market sentiment and China’s covid lockdowns-led growth fears will continue to influence gold trades.
Also read: Gold Price Forecast: XAU/USD needs to beat $1,920-$1,925 hurdle to confirm Fed-led bullish reversal
Gold Price: Key levels to watch
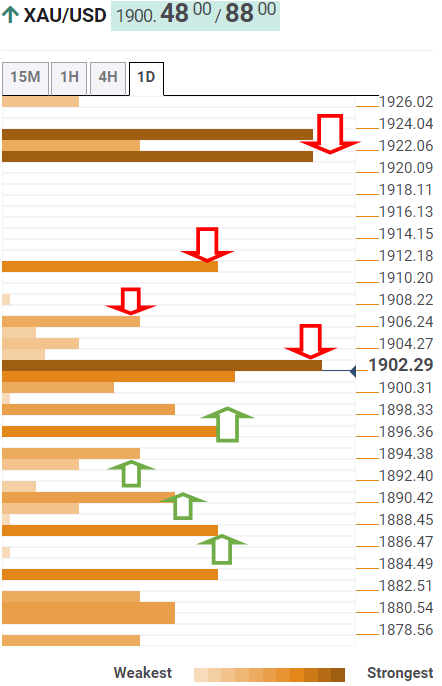
The Technical Confluences Detector shows that Gold Price failed to find acceptance above the powerful barrier at $1,904, where the Fibonacci 23.6% one-week and the previous high four-hour converge.
Fresh buying opportunities above the latter will see a test of the $1,906 level, which is the pivot point one-day R2.
The Fibonacci 61.8% one-week at $1,912 could guard the further upside.
The next critical upside target is seen around $1,920-$1,925. That price area is the confluence of the Fibonacci 38.2% one-month and pivot point one-day
Alternatively, if the recovery momentum fizzles out, then sellers could go back to test the SMA10 one-day and Fibonacci 38.2% one-week around $1,897.
The bulls will await the next support at the pivot point one-day R1 at $1,894, below which the previous day’s high of $1,889 will be back into play.
The Fibonacci 23.6% one-week at $1,887 will be on the sellers’ radars If the pullback gathers steam.
Here is how it looks on the tool
About Technical Confluences Detector
The TCD (Technical Confluences Detector) is a tool to locate and point out those price levels where there is a congestion of indicators, moving averages, Fibonacci levels, Pivot Points, etc. If you are a short-term trader, you will find entry points for counter-trend strategies and hunt a few points at a time. If you are a medium-to-long-term trader, this tool will allow you to know in advance the price levels where a medium-to-long-term trend may stop and rest, where to unwind positions, or where to increase your position size.


© 2000-2026. Sva prava zaštićena.
Sajt je vlasništvo kompanije Teletrade D.J. LLC 2351 LLC 2022 (Euro House, Richmond Hill Road, Kingstown, VC0100, St. Vincent and the Grenadines).
Svi podaci koji se nalaze na sajtu ne predstavljaju osnovu za donošenje investicionih odluka, već su informativnog karaktera.
The company does not serve or provide services to customers who are residents of the US, Canada, Iran, The Democratic People's Republic of Korea, Yemen and FATF blacklisted countries.
Izvršenje trgovinskih operacija sa finansijskim instrumentima upotrebom marginalne trgovine pruža velike mogućnosti i omogućava investitorima ostvarivanje visokih prihoda. Međutim, takav vid trgovine povezan je sa potencijalno visokim nivoom rizika od gubitka sredstava. Проведение торговых операций на финанcовых рынках c маржинальными финанcовыми инcтрументами открывает широкие возможноcти, и позволяет инвеcторам, готовым пойти на риcк, получать выcокую прибыль, но при этом неcет в cебе потенциально выcокий уровень риcка получения убытков. Iz tog razloga je pre započinjanja trgovine potrebno odlučiti o izboru odgovarajuće investicione strategije, uzimajući u obzir raspoložive resurse.
Upotreba informacija: U slučaju potpunog ili delimičnog preuzimanja i daljeg korišćenja materijala koji se nalazi na sajtu, potrebno je navesti link odgovarajuće stranice na sajtu kompanije TeleTrade-a kao izvora informacija. Upotreba materijala na internetu mora biti praćena hiper linkom do web stranice teletrade.org. Automatski uvoz materijala i informacija sa stranice je zabranjen.
Ako imate bilo kakvih pitanja, obratite nam se pr@teletrade.global.
транcфери