- Analiza
- Novosti i instrumenti
- Vesti sa tržišta
- USD/JPY embarks on a significant correction below key daily support
USD/JPY embarks on a significant correction below key daily support
- USD/JPY bears sink in their teeth on lower US yields, stocks and a heightened sense of risk aversion.
- Bears break below critical support, bucking the trend of bullish flag breakouts.
USD/JPY fell on Thursday to a low of 127.51 from a high of 130.05. A combination of lower US yields and global shares are at their lowest point in 18-months has been supporting both the greenback to a fresh 20-year-high and the yen that has moved out of bearish territory vs. the US dollar.
As a consequence of the risk-off sentiment, the DXY, an index that measures the US dollar vs. a basket of rivals is trading at a new cycle high of 104.925, carving out the way towards the 2002 high near 107. However, the yen has caught a bid also, rallying to its way out of a bullish structure on the daily chart.
Benchmark 10-year Treasury yields, which hit the lowest level in two weeks are down over 3% while the more Fed tentative 2-years are losing 3.7%, weighed by Producer Prices that fell short of expectations. The US Producer Price Index increased by 0.5% in April compared with a 1.6% jump in March. Excluding food and energy, the core PPI climbed by 0.4%, lagging the 0.7% gain expected. Core PPI grew by 1.2% in March. On a year-over-year basis, producer price inflation surged 11% in April, and core PPI jumped 8.8%, the Bureau of Labor Statistics said Thursday.
Meanwhile, the summary of opinions from the April 27-28 Bank of Japan meeting came across as universally dovish and largely unconcerned about rising inflation and the weak yen. The Next policy meeting is June 16-17 and all signs point to continued dovishness from the BOJ.
USD/JPY technical analysis
The pair has bucked the trend on Thursday, breaking below prior support and has denied the bulls that were otherwise seeking more from the bullish flag pattern on the daily chart:
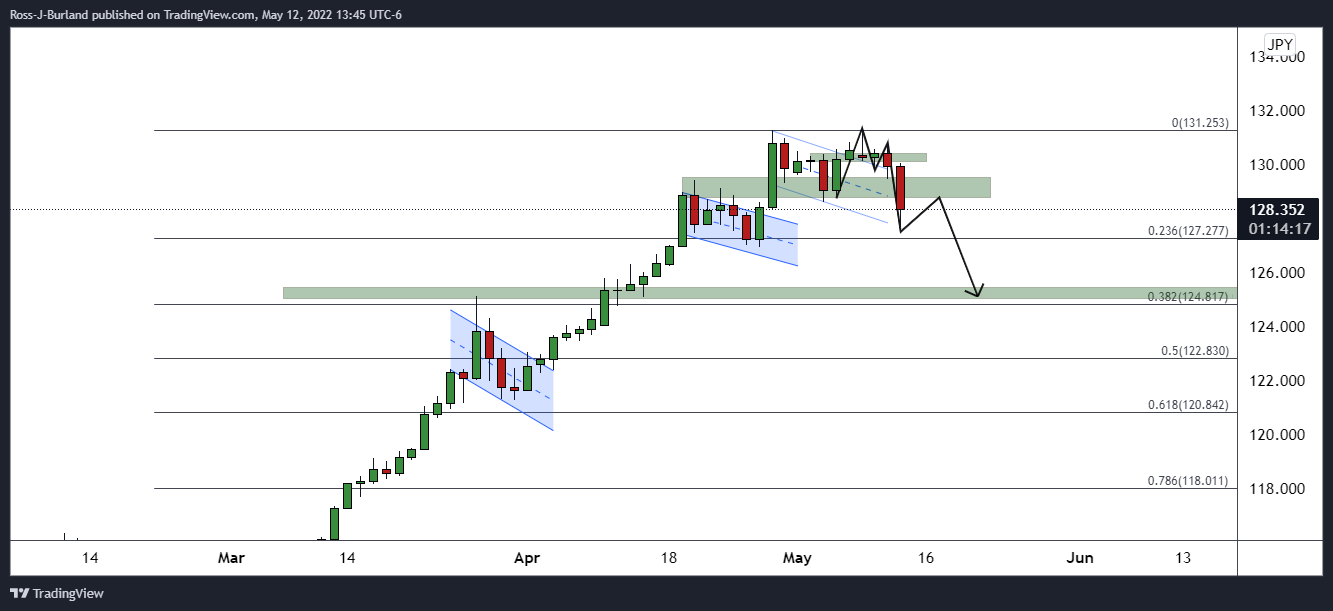
The price action has left an M-formation on the daily chart, a pattern which often sees the price reverting to restest the prior lows, or the neckline of the chart pattern.


© 2000-2026. Sva prava zaštićena.
Sajt je vlasništvo kompanije Teletrade D.J. LLC 2351 LLC 2022 (Euro House, Richmond Hill Road, Kingstown, VC0100, St. Vincent and the Grenadines).
Svi podaci koji se nalaze na sajtu ne predstavljaju osnovu za donošenje investicionih odluka, već su informativnog karaktera.
The company does not serve or provide services to customers who are residents of the US, Canada, Iran, The Democratic People's Republic of Korea, Yemen and FATF blacklisted countries.
Izvršenje trgovinskih operacija sa finansijskim instrumentima upotrebom marginalne trgovine pruža velike mogućnosti i omogućava investitorima ostvarivanje visokih prihoda. Međutim, takav vid trgovine povezan je sa potencijalno visokim nivoom rizika od gubitka sredstava. Проведение торговых операций на финанcовых рынках c маржинальными финанcовыми инcтрументами открывает широкие возможноcти, и позволяет инвеcторам, готовым пойти на риcк, получать выcокую прибыль, но при этом неcет в cебе потенциально выcокий уровень риcка получения убытков. Iz tog razloga je pre započinjanja trgovine potrebno odlučiti o izboru odgovarajuće investicione strategije, uzimajući u obzir raspoložive resurse.
Upotreba informacija: U slučaju potpunog ili delimičnog preuzimanja i daljeg korišćenja materijala koji se nalazi na sajtu, potrebno je navesti link odgovarajuće stranice na sajtu kompanije TeleTrade-a kao izvora informacija. Upotreba materijala na internetu mora biti praćena hiper linkom do web stranice teletrade.org. Automatski uvoz materijala i informacija sa stranice je zabranjen.
Ako imate bilo kakvih pitanja, obratite nam se pr@teletrade.global.
транcфери