- Analiza
- Novosti i instrumenti
- Vesti sa tržišta
- Gold Price Forecast: XAU/USD upside appears compelling beyond $1,834 – Confluence Detector
Gold Price Forecast: XAU/USD upside appears compelling beyond $1,834 – Confluence Detector
- Gold keeps the upside break of $1,834 key hurdle around weekly top.
- Stock futures rise, yields drop amid sluggish markets, mixed clues.
- The path of least resistance appears up but the USD rebound can test the bulls.
Gold Price remains sidelined around one-week high after crossing the short-term crucial hurdles the previous day. That said, the metal approaches another key resistance, around $1,848, as bulls cheer the previous breakout of the 200-DMA and monthly resistance line, not to forget Fibonacci 38.2% one-week.
Softer US data and repeated chatters of 50 bps Fed rate hike seem to have weighed the US dollar, which in turn allows the gold prices to regain upside momentum. The XAU/USD advances also take clues from the recently firmer stock futures and downbeat US Treasury yields as traders seek clear directions on the major central banks’ next moves. The market’s indecision joins a lack of major data/events to trigger gold’s consolidation move, as it braces for the first weekly gains in five. Moving on, a light calendar and mixed updates may keep the gold prices higher unless any surprise macro propels the US dollar buying.
Also read: Gold Price Forecast: XAUUSD bulls recapture 200-DMA, more gains likely?
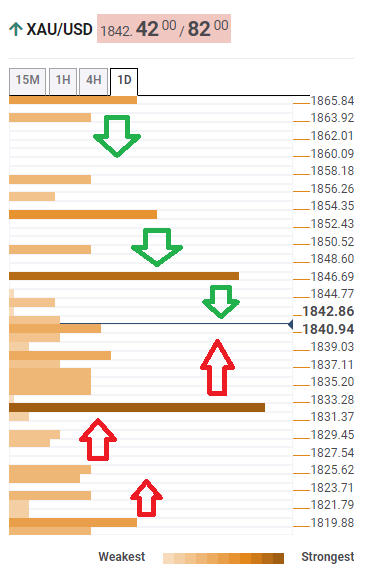
Gold Price: Key levels to watch
The Technical Confluences Detector shows that the Gold Price stays firmer after crossing the Fibonacci 38.2% one-week, as well as SMA100 on 15-minute, close to $1,834.
Also justifying the bullish bias is the XAU/USD’s sustained trading beyond the 200-DMA and Fibonacci 38.2% one-week, respectively around $1,840 and $1,838.
It’s worth noting that Fibonacci 23.6% one-week and SMA100 on hourly chart portrays another important support around $1,820.
That said, the Gold Price aims $1,848 hurdle comprising upper Bollinger on 4H and Pivot Point 1Month S1.
Should the quote rises past $1,848, the Fibonacci 61.8% one-week and upper Bollinger on hourly play could lure the XAU/USD buyers around $1,855.
Here is how it looks on the tool
About Technical Confluences Detector
The TCD (Technical Confluences Detector) is a tool to locate and point out those price levels where there is a congestion of indicators, moving averages, Fibonacci levels, Pivot Points, etc. If you are a short-term trader, you will find entry points for counter-trend strategies and hunt a few points at a time. If you are a medium-to-long-term trader, this tool will allow you to know in advance the price levels where a medium-to-long-term trend may stop and rest, where to unwind positions, or where to increase your position size.


© 2000-2026. Sva prava zaštićena.
Sajt je vlasništvo kompanije Teletrade D.J. LLC 2351 LLC 2022 (Euro House, Richmond Hill Road, Kingstown, VC0100, St. Vincent and the Grenadines).
Svi podaci koji se nalaze na sajtu ne predstavljaju osnovu za donošenje investicionih odluka, već su informativnog karaktera.
The company does not serve or provide services to customers who are residents of the US, Canada, Iran, The Democratic People's Republic of Korea, Yemen and FATF blacklisted countries.
Izvršenje trgovinskih operacija sa finansijskim instrumentima upotrebom marginalne trgovine pruža velike mogućnosti i omogućava investitorima ostvarivanje visokih prihoda. Međutim, takav vid trgovine povezan je sa potencijalno visokim nivoom rizika od gubitka sredstava. Проведение торговых операций на финанcовых рынках c маржинальными финанcовыми инcтрументами открывает широкие возможноcти, и позволяет инвеcторам, готовым пойти на риcк, получать выcокую прибыль, но при этом неcет в cебе потенциально выcокий уровень риcка получения убытков. Iz tog razloga je pre započinjanja trgovine potrebno odlučiti o izboru odgovarajuće investicione strategije, uzimajući u obzir raspoložive resurse.
Upotreba informacija: U slučaju potpunog ili delimičnog preuzimanja i daljeg korišćenja materijala koji se nalazi na sajtu, potrebno je navesti link odgovarajuće stranice na sajtu kompanije TeleTrade-a kao izvora informacija. Upotreba materijala na internetu mora biti praćena hiper linkom do web stranice teletrade.org. Automatski uvoz materijala i informacija sa stranice je zabranjen.
Ako imate bilo kakvih pitanja, obratite nam se pr@teletrade.global.
транcфери