- Analiza
- Novosti i instrumenti
- Vesti sa tržišta
- USD/CHF Price Analysis: Buyers to step in around 0.9550 after falling from YTD highs
USD/CHF Price Analysis: Buyers to step in around 0.9550 after falling from YTD highs
- The Swiss franc continues its two-week rally vs. the greenback, surging almost 1.50% in two days.
- A weaker US Dollar and a dismal mood increased appetite for the CHF, so the USD/CHF falls.
- USD/CHF Price Forecast: After falling close to 500-pips, bulls find the 0.9550 as a solid demand zone to step in, capping the ongoing pullback.
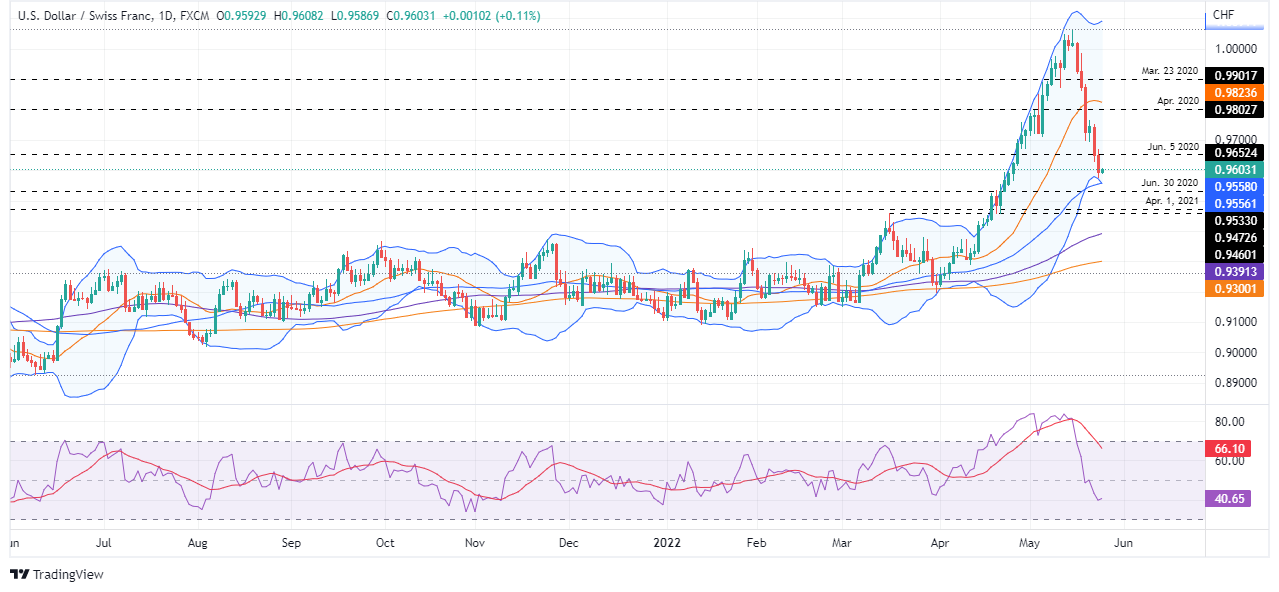
The USD/CHF continues its free-fall, courtesy of a softer greenback amidst investors’ negative mood, which caused global equities to fall and the buck to lose the 102.000 mark. At the time of writing, the USD/CHF is trading at 0.9605, recording minimal gains of 0.13% as the Asian session begins.
On Tuesday, the market sentiment remained sour throughout the day. US equities finished with losses, except for the Dow Jones. The US Dollar Index, a gauge of the greenback’s value vs. a basket of peers, edged lower, recording a fresh four-week low at around 101.768, down so far in the week almost 1.30%.
USD/CHF Price Forecast: Technical outlook
Tuesday’s session left the USD/CHF trading above the 50-day moving average (DMA) at 0.9558. It’s worth noting that the confluence of Bollinger’s band lower band with the previously-mentioned moving average is a zone that could find some buyers stepping in as the greenback remains in an uptrend. Nevertheless, the two-week pullback weighed on the USD/CHF, which has fallen almost 500 pips from the YTD high at the parity; however, the RSI, albeit in bearish territory, begins to aim higher, meaning the major might consolidate before resuming upwards/downwards.
Upwards, the USD/CHF first resistance would be the 0.9700 mark. If USD/CHF bulls reclaim the aforementioned, a re-test of the 20-DMA at 0.9823 is on the cards, but firstly, a break above the 0.9800 mark is needed before extending the pair’s rally.
On the flip side, the USD/CHF first support would be 0.9600. Break below would expose the confluence of the 50-DMA and Bollinger’s band lower band around 0.9558. Once cleared, the next demand zone would be March 16, 0.9533 daily high.
Key Technical Levels


© 2000-2026. Sva prava zaštićena.
Sajt je vlasništvo kompanije Teletrade D.J. LLC 2351 LLC 2022 (Euro House, Richmond Hill Road, Kingstown, VC0100, St. Vincent and the Grenadines).
Svi podaci koji se nalaze na sajtu ne predstavljaju osnovu za donošenje investicionih odluka, već su informativnog karaktera.
The company does not serve or provide services to customers who are residents of the US, Canada, Iran, The Democratic People's Republic of Korea, Yemen and FATF blacklisted countries.
Izvršenje trgovinskih operacija sa finansijskim instrumentima upotrebom marginalne trgovine pruža velike mogućnosti i omogućava investitorima ostvarivanje visokih prihoda. Međutim, takav vid trgovine povezan je sa potencijalno visokim nivoom rizika od gubitka sredstava. Проведение торговых операций на финанcовых рынках c маржинальными финанcовыми инcтрументами открывает широкие возможноcти, и позволяет инвеcторам, готовым пойти на риcк, получать выcокую прибыль, но при этом неcет в cебе потенциально выcокий уровень риcка получения убытков. Iz tog razloga je pre započinjanja trgovine potrebno odlučiti o izboru odgovarajuće investicione strategije, uzimajući u obzir raspoložive resurse.
Upotreba informacija: U slučaju potpunog ili delimičnog preuzimanja i daljeg korišćenja materijala koji se nalazi na sajtu, potrebno je navesti link odgovarajuće stranice na sajtu kompanije TeleTrade-a kao izvora informacija. Upotreba materijala na internetu mora biti praćena hiper linkom do web stranice teletrade.org. Automatski uvoz materijala i informacija sa stranice je zabranjen.
Ako imate bilo kakvih pitanja, obratite nam se pr@teletrade.global.
транcфери