- Analiza
- Novosti i instrumenti
- Vesti sa tržišta
- Gold Price Forecast: XAUUSD bears eye $1,838 and $1,836 as next downside targets – Confluence Detector
Gold Price Forecast: XAUUSD bears eye $1,838 and $1,836 as next downside targets – Confluence Detector
- Gold Price is back in the red, falling for the second straight day.
- Less hawkish Fed minutes failed to impress gold bulls but not for long.
- XAUUSD inches closer towards critical 200-DMA support ahead of US data.
Gold Price is feeling the pull of gravity after less hawkish FOMC minutes released on Wednesday offered a brief reprieve to XAU bulls. The bright metal is extending the retreat from two-week highs of $1,870, as the US dollar clings onto minor recovery gains amid a cautious risk environment. The precious metal, however, seems to find some comfort from falling Treasury yields, as investors digest the latest Fed minutes, which squashed hopes for a more than 50 bps rate hike in the coming months. Going forward, gold’s fate hinges on the key US GDP, Pending Home Sales and PCE data, as it could impact the central bank’s expectations.
Also read: Gold Price Forecast: Key $1,838 support could be at risk ahead of US GDP
Gold Price: Key levels to watch
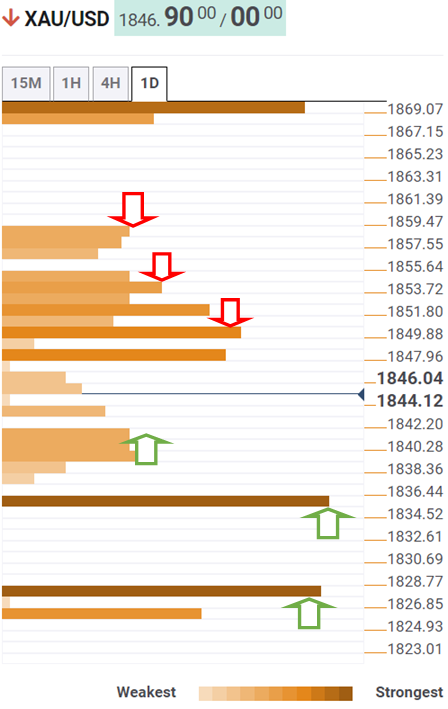
The Technical Confluences Detector shows that the Gold Price is facing a wall of powerful resistance levels, as it attempts a minor comeback.
Where the Fibonacci 23.6% one-day retracement and the 100-four-hour SMA converge at $1,848, provides an immediate upside barrier.
The next resistance is envisioned at around $1,850, where the Fibonacci 38.2% one-day retarcement, 5-four-hour SMA, and the previous high on the four-hour chart align.
Bulls will then look to take out the meeting point of the 5-day SMA and the 100-hour SMA at $1,854.
Further up, the Fibonacci 61.8% one-day retracement at $1,858 will be the level to beat for XAU buyers.
Alternatively, a sustained break below the $1,838 demand area, will trigger a fresh downswing. That price zone is a confluence of the previous day’s low, the daily S1 pivot point and the 200-day SMA.
Strong support at the intersection of the Fibonacci 23.6% weekly retracement, and the 10-day SMA at $1,836 will come to the rescue of bulls.
Should the selling pressure intensify, a steep drop towards the S2 daily pivot point at $1,827 will be in the offing.
Here is how it looks on the tool
About Technical Confluences Detector
The TCD (Technical Confluences Detector) is a tool to locate and point out those price levels where there is a congestion of indicators, moving averages, Fibonacci levels, pivot points, etc.
If you are a short-term trader, you will find entry points for counter-trend strategies and hunt a few points at a time. If you are a medium-to-long-term trader, this tool will allow you to know in advance the price levels where a medium-to-long-term trend may stop and rest, where to unwind positions, or where to increase your position size.


© 2000-2026. Sva prava zaštićena.
Sajt je vlasništvo kompanije Teletrade D.J. LLC 2351 LLC 2022 (Euro House, Richmond Hill Road, Kingstown, VC0100, St. Vincent and the Grenadines).
Svi podaci koji se nalaze na sajtu ne predstavljaju osnovu za donošenje investicionih odluka, već su informativnog karaktera.
The company does not serve or provide services to customers who are residents of the US, Canada, Iran, The Democratic People's Republic of Korea, Yemen and FATF blacklisted countries.
Izvršenje trgovinskih operacija sa finansijskim instrumentima upotrebom marginalne trgovine pruža velike mogućnosti i omogućava investitorima ostvarivanje visokih prihoda. Međutim, takav vid trgovine povezan je sa potencijalno visokim nivoom rizika od gubitka sredstava. Проведение торговых операций на финанcовых рынках c маржинальными финанcовыми инcтрументами открывает широкие возможноcти, и позволяет инвеcторам, готовым пойти на риcк, получать выcокую прибыль, но при этом неcет в cебе потенциально выcокий уровень риcка получения убытков. Iz tog razloga je pre započinjanja trgovine potrebno odlučiti o izboru odgovarajuće investicione strategije, uzimajući u obzir raspoložive resurse.
Upotreba informacija: U slučaju potpunog ili delimičnog preuzimanja i daljeg korišćenja materijala koji se nalazi na sajtu, potrebno je navesti link odgovarajuće stranice na sajtu kompanije TeleTrade-a kao izvora informacija. Upotreba materijala na internetu mora biti praćena hiper linkom do web stranice teletrade.org. Automatski uvoz materijala i informacija sa stranice je zabranjen.
Ako imate bilo kakvih pitanja, obratite nam se pr@teletrade.global.
транcфери