- Analiza
- Novosti i instrumenti
- Vesti sa tržišta
- Gold Price Forecast: XAUUSD stages a comeback, key levels to watch – Confluence Detector
Gold Price Forecast: XAUUSD stages a comeback, key levels to watch – Confluence Detector
- Gold Price is heading back towards $1900 amid mixed markets.
- US dollar recovers ground but the correction doesn’t seem to be over yet.
- XAUUSD’s path of least resistance appears to the upside, for now.
Gold Price is staging a solid comeback after finding strong support near the $1,840 region over the past two trading days. The bright metal is looking to retest the two-week highs on the road to recovery, as the US dollar is struggling to recover further ground amid mixed market sentiment and subdued Treasury yields. Dismal US GDP, Markit Manufacturing PMI and Pending Home Sales point to signs of US economic slowdown, cooling off the aggressive Fed tightening expectations and keeping the dollar broadly undermined. This week’s turnaround in global stocks is also weighing on the greenback’s safe-haven appeal, benefiting the USD-priced gold.
Also read: Gold Price Forecast: Key $1,838 support could be at risk ahead of US GDP
Gold Price: Key levels to watch
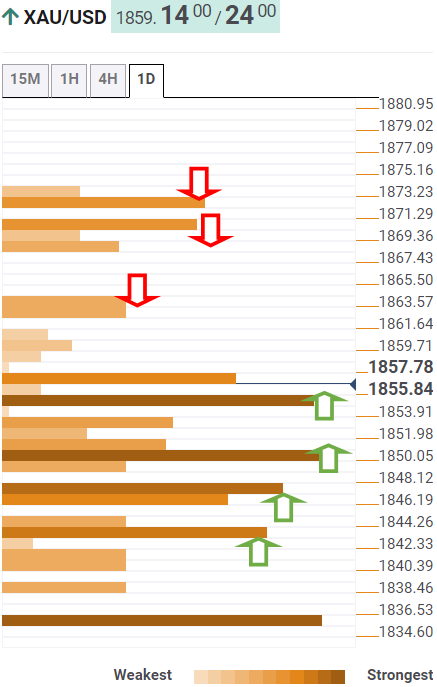
The Technical Confluences Detector shows that the Gold Price is fast approaching strong resistance at $1,863, as the renewed upside gathers steam.
That level is the convergence of the Fibonacci 161.8% one-day and the pivot point one-day R2.
The next significant upside barrier awaits at the confluence of the pivot point one-day R3, pivot point one-week R1 and the two-week highs at $1,870.
The previous month’s low of $1,872 will be a tough nut to crack for gold bulls.
Alternatively, the immediate downside will be capped by $1,855, which is the meeting point of the SMA5 one-day and the previous day’s high.
Failure to defend the latter will threaten the $1,850 demand area, where the previous week’s high and the Fibonacci 61.8% one-day merge.
Gold sellers will then target the intersection of the SMA100 four-hour, pivot point one-month S1 and the Fibonacci 38.2% one-day at $1,847.
The last relevant support is pegged at the pivot point one-day S1 at $1,844.
Here is how it looks on the tool
About Technical Confluences Detector
The TCD (Technical Confluences Detector) is a tool to locate and point out those price levels where there is a congestion of indicators, moving averages, Fibonacci levels, Pivot Points, etc. If you are a short-term trader, you will find entry points for counter-trend strategies and hunt a few points at a time. If you are a medium-to-long-term trader, this tool will allow you to know in advance the price levels where a medium-to-long-term trend may stop and rest, where to unwind positions, or where to increase your position size.


© 2000-2026. Sva prava zaštićena.
Sajt je vlasništvo kompanije Teletrade D.J. LLC 2351 LLC 2022 (Euro House, Richmond Hill Road, Kingstown, VC0100, St. Vincent and the Grenadines).
Svi podaci koji se nalaze na sajtu ne predstavljaju osnovu za donošenje investicionih odluka, već su informativnog karaktera.
The company does not serve or provide services to customers who are residents of the US, Canada, Iran, The Democratic People's Republic of Korea, Yemen and FATF blacklisted countries.
Izvršenje trgovinskih operacija sa finansijskim instrumentima upotrebom marginalne trgovine pruža velike mogućnosti i omogućava investitorima ostvarivanje visokih prihoda. Međutim, takav vid trgovine povezan je sa potencijalno visokim nivoom rizika od gubitka sredstava. Проведение торговых операций на финанcовых рынках c маржинальными финанcовыми инcтрументами открывает широкие возможноcти, и позволяет инвеcторам, готовым пойти на риcк, получать выcокую прибыль, но при этом неcет в cебе потенциально выcокий уровень риcка получения убытков. Iz tog razloga je pre započinjanja trgovine potrebno odlučiti o izboru odgovarajuće investicione strategije, uzimajući u obzir raspoložive resurse.
Upotreba informacija: U slučaju potpunog ili delimičnog preuzimanja i daljeg korišćenja materijala koji se nalazi na sajtu, potrebno je navesti link odgovarajuće stranice na sajtu kompanije TeleTrade-a kao izvora informacija. Upotreba materijala na internetu mora biti praćena hiper linkom do web stranice teletrade.org. Automatski uvoz materijala i informacija sa stranice je zabranjen.
Ako imate bilo kakvih pitanja, obratite nam se pr@teletrade.global.
транcфери