- Analiza
- Novosti i instrumenti
- Vesti sa tržišta
- Gold Price Forecast: XAUUSD vulnerable amid firmer USD, key levels to watch – Confluence Detector
Gold Price Forecast: XAUUSD vulnerable amid firmer USD, key levels to watch – Confluence Detector
- Gold Price is extending a two-day bearish momentum on Friday.
- The US dollar reigns supreme as risk-aversion remains at full steam.
- XAUUSD appears vulnerable, with all eyes on next week’s Fed decision.
Gold Price is trading with size-able losses on the final trading day of the week, as investors continue to seek refuge in the safe-haven US dollar amid persistent fears over rising inflation and a potential recession. Central banks tightening worldwide to quell inflation have re-ignited growth fears. The yellow metal is leaning bearish, despite a minor pullback in the US Treasury yields, as hot inflation and pre-Fed meeting anxiety keep the sentiment around the dollar underpinned.
Also read: Gold Price Forecast: XAUUSD at a critical juncture, US inflation holds the key
Gold Price: Key levels to watch
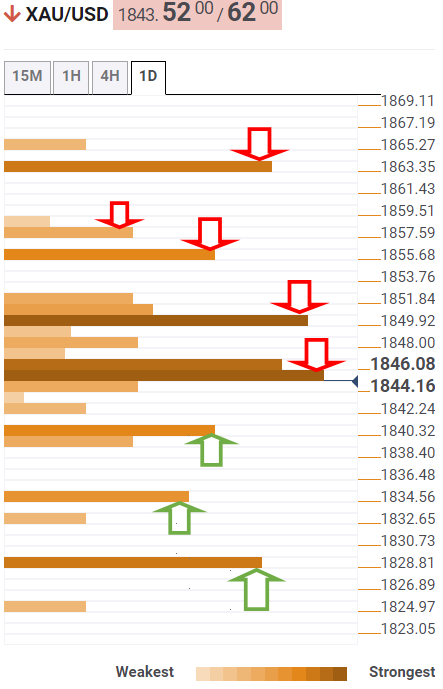
The Technical Confluence Detector shows that Gold Price is teasing the crucial SMA200 one-day support at $1,842.
A sustained move below the latter will put the previous day’s low of $1,840 at risk. At that level, the pivot point one-day S1 and Fibonacci 23.6% one-week merge.
The next relevant downside target is seen at $1,833; the confluence of the Fibonacci 38.2% one-month and the pivot point one-day S2.
The line in the sand for gold buyers is aligned at the intersection of the previous week’s low and the pivot point one-week S1 at $1,829.
On the upside, powerful resistance appears around the $1,845 region, where the SMA5 four-hour, Fibonacci 38.2% one-day and one-week coincide.
Further up, bulls will challenge the SMA5 one-day, Fibonacci 61.8% one-day and SMA10 one-day convergence at $1,850.
Acceptance above the latter will open doors for a fresh advance towards the previous day’s high of $1,855, above which the Fibonacci 61.8% one-week at $1,857 will be probed.
The meeting point of the Fibonacci 61.8% one-month and the pivot point one-day R2 at $1,863 will be a tough nut to crack for XAU bulls.
Here is how it looks on the tool
About Technical Confluences Detector
The TCD (Technical Confluences Detector) is a tool to locate and point out those price levels where there is a congestion of indicators, moving averages, Fibonacci levels, Pivot Points, etc. If you are a short-term trader, you will find entry points for counter-trend strategies and hunt a few points at a time. If you are a medium-to-long-term trader, this tool will allow you to know in advance the price levels where a medium-to-long-term trend may stop and rest, where to unwind positions, or where to increase your position size.


© 2000-2026. Sva prava zaštićena.
Sajt je vlasništvo kompanije Teletrade D.J. LLC 2351 LLC 2022 (Euro House, Richmond Hill Road, Kingstown, VC0100, St. Vincent and the Grenadines).
Svi podaci koji se nalaze na sajtu ne predstavljaju osnovu za donošenje investicionih odluka, već su informativnog karaktera.
The company does not serve or provide services to customers who are residents of the US, Canada, Iran, The Democratic People's Republic of Korea, Yemen and FATF blacklisted countries.
Izvršenje trgovinskih operacija sa finansijskim instrumentima upotrebom marginalne trgovine pruža velike mogućnosti i omogućava investitorima ostvarivanje visokih prihoda. Međutim, takav vid trgovine povezan je sa potencijalno visokim nivoom rizika od gubitka sredstava. Проведение торговых операций на финанcовых рынках c маржинальными финанcовыми инcтрументами открывает широкие возможноcти, и позволяет инвеcторам, готовым пойти на риcк, получать выcокую прибыль, но при этом неcет в cебе потенциально выcокий уровень риcка получения убытков. Iz tog razloga je pre započinjanja trgovine potrebno odlučiti o izboru odgovarajuće investicione strategije, uzimajući u obzir raspoložive resurse.
Upotreba informacija: U slučaju potpunog ili delimičnog preuzimanja i daljeg korišćenja materijala koji se nalazi na sajtu, potrebno je navesti link odgovarajuće stranice na sajtu kompanije TeleTrade-a kao izvora informacija. Upotreba materijala na internetu mora biti praćena hiper linkom do web stranice teletrade.org. Automatski uvoz materijala i informacija sa stranice je zabranjen.
Ako imate bilo kakvih pitanja, obratite nam se pr@teletrade.global.
транcфери