- Analiza
- Novosti i instrumenti
- Vesti sa tržišta
- Gold Price Forecast: XAUUSD eyes $1,845 and $1,842 on aggressive Fed tightening bets – Confluence Detector
Gold Price Forecast: XAUUSD eyes $1,845 and $1,842 on aggressive Fed tightening bets – Confluence Detector
- Gold Price slips from five-week highs as Fed set to hike rate aggressively.
- The US dollar, yields soar on the Fed expectations and risk-off flows.
- XAUUSD remains exposed to more downside ahead of the Fed decision.
Gold Price is correcting sharply from five-week peaks of $1,879, reversing most of Friday’s strong rally. The inverse correlation between the US Treasury yields and the bright metal is back in play. The benchmark 10-year yields are trading at their highest level since 2018 on the bets that the Fed will go for a 75 bps rate hike at least once in its next three meetings to curb rampant inflation. The zero-yielding gold is feeling the heat of soaring yields, which have driven the US dollar higher alongside. Aggressive Fed tightening expectations have overshadowed heightening recession fears while influencing XAUUSD price. Markets now eagerly await Wednesday’s Fed decision for the rate hike guidance and its impact on the related assets.
Also read: Gold Price Forecast: 50 DMA could be a tough nut to crack, as focus shifts to Fed
Gold Price: Key levels to watch
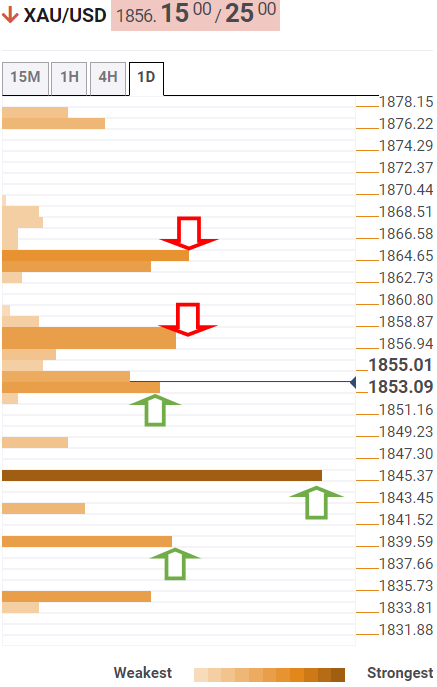
The Technical Confluence Detector shows that Gold Price challenged the fierce support at $1,853, which is the convergence of the SMA10 one-day and SMA200 four-hour.
The next significant downside target is pegged at $1,845, where the Fibonacci 61.8% one-day and one-week merge.
Further south, the SMA200 one-day at $1,842 will test the bullish commitments once again, opening floors for a retest of the pivot point one-week S1 and pivot point one-day S1 intersection at $1,839.
On the flip side, bulls test the confluence of the Fibonacci 38.21% one-day and one-month at $1,858, above which a fresh advance towards $1,863 cannot be ruled out.
At that level, the Fibonacci 61.8% one-month, Fibonacci 23.6% one-day and one-week coincide.
Friday’s high of $1,876 will be put to test should bulls resume the recent bullish momentum.
Here is how it looks on the tool
About Technical Confluences Detector
The TCD (Technical Confluences Detector) is a tool to locate and point out those price levels where there is a congestion of indicators, moving averages, Fibonacci levels, Pivot Points, etc. If you are a short-term trader, you will find entry points for counter-trend strategies and hunt a few points at a time. If you are a medium-to-long-term trader, this tool will allow you to know in advance the price levels where a medium-to-long-term trend may stop and rest, where to unwind positions, or where to increase your position size.


© 2000-2026. Sva prava zaštićena.
Sajt je vlasništvo kompanije Teletrade D.J. LLC 2351 LLC 2022 (Euro House, Richmond Hill Road, Kingstown, VC0100, St. Vincent and the Grenadines).
Svi podaci koji se nalaze na sajtu ne predstavljaju osnovu za donošenje investicionih odluka, već su informativnog karaktera.
The company does not serve or provide services to customers who are residents of the US, Canada, Iran, The Democratic People's Republic of Korea, Yemen and FATF blacklisted countries.
Izvršenje trgovinskih operacija sa finansijskim instrumentima upotrebom marginalne trgovine pruža velike mogućnosti i omogućava investitorima ostvarivanje visokih prihoda. Međutim, takav vid trgovine povezan je sa potencijalno visokim nivoom rizika od gubitka sredstava. Проведение торговых операций на финанcовых рынках c маржинальными финанcовыми инcтрументами открывает широкие возможноcти, и позволяет инвеcторам, готовым пойти на риcк, получать выcокую прибыль, но при этом неcет в cебе потенциально выcокий уровень риcка получения убытков. Iz tog razloga je pre započinjanja trgovine potrebno odlučiti o izboru odgovarajuće investicione strategije, uzimajući u obzir raspoložive resurse.
Upotreba informacija: U slučaju potpunog ili delimičnog preuzimanja i daljeg korišćenja materijala koji se nalazi na sajtu, potrebno je navesti link odgovarajuće stranice na sajtu kompanije TeleTrade-a kao izvora informacija. Upotreba materijala na internetu mora biti praćena hiper linkom do web stranice teletrade.org. Automatski uvoz materijala i informacija sa stranice je zabranjen.
Ako imate bilo kakvih pitanja, obratite nam se pr@teletrade.global.
транcфери