- Analiza
- Novosti i instrumenti
- Vesti sa tržišta
- Gold Price Forecast: XAU/USD oscillates below $1,840 as focus shifts to Fed Powell’s testimony
Gold Price Forecast: XAU/USD oscillates below $1,840 as focus shifts to Fed Powell’s testimony
- Gold price is displaying a lackluster performance as investors are awaiting Fed Powell’s testimony.
- The DXY is underperforming on lower forecasts for the US PMI.
- Investors should brace for one more 75 bps interest rate hike by the Fed in July.
Gold price (XAU/USD) is displaying back and forth moves in a narrow range of $1,835.59-1,839.15 in the early Asian session. The precious metal is going through a corrective action as a gradual decline has been recorded in the gold prices after the asset recorded a high of $1,857.64 on Thursday.
The gold prices are facing the headwinds of an extremely tight policy period. Investors have still not passed the hangover of the 75 basis points (bps) interest rate hike announcement last week. Now, advancing odds of a consecutive 75 bps rate hike are hurting the greenback bulls.
The US dollar index (DXY) has turned sideways below 104.50 as investors are awaiting the Federal Reserve (Fed) chair Jerome Powell’s testimony, which is due on Wednesday. Apart from that lower forecasts for the US Purchase Managers Index (PMI) will keep hammering the DXY.
The Composite PMI is seen higher marginally to 53.5 from the prior print of 53.4. The estimates for the Manufacturing and Services indicate an underperformance. The Services PMI is seen extremely lower at 49.1 against the prior print of 53.2. While the Manufacturing PMI is expected to slip to 54.7 from the former figure of 55.7.
Gold technical analysis
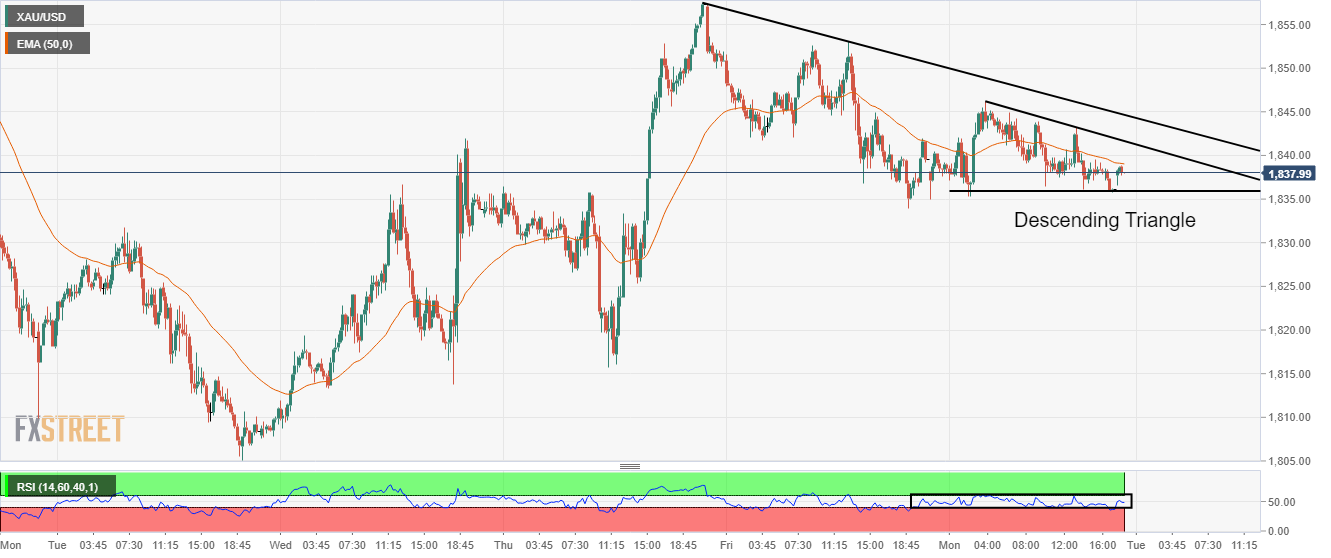
On an intraday scale, the gold prices are auctioning in a Descending Triangle pattern. The horizontal support of the chart pattern is placed from $1,836.04 while the downward sloping trendline is plotted from Monday’s high at $1,845.54. The primary trendline placed from last week’s high at $1,857.58. The asset is trading near the 50-period Exponential Moving Average (EMA) at $1,839.14, which signals a consolidation ahead. While, the Relative Strength Index (RSI) (14) is oscillating in a 40.00-60.00 range, which signals a continuation of a sideways move.
Gold intraday chart


© 2000-2026. Sva prava zaštićena.
Sajt je vlasništvo kompanije Teletrade D.J. LLC 2351 LLC 2022 (Euro House, Richmond Hill Road, Kingstown, VC0100, St. Vincent and the Grenadines).
Svi podaci koji se nalaze na sajtu ne predstavljaju osnovu za donošenje investicionih odluka, već su informativnog karaktera.
The company does not serve or provide services to customers who are residents of the US, Canada, Iran, The Democratic People's Republic of Korea, Yemen and FATF blacklisted countries.
Izvršenje trgovinskih operacija sa finansijskim instrumentima upotrebom marginalne trgovine pruža velike mogućnosti i omogućava investitorima ostvarivanje visokih prihoda. Međutim, takav vid trgovine povezan je sa potencijalno visokim nivoom rizika od gubitka sredstava. Проведение торговых операций на финанcовых рынках c маржинальными финанcовыми инcтрументами открывает широкие возможноcти, и позволяет инвеcторам, готовым пойти на риcк, получать выcокую прибыль, но при этом неcет в cебе потенциально выcокий уровень риcка получения убытков. Iz tog razloga je pre započinjanja trgovine potrebno odlučiti o izboru odgovarajuće investicione strategije, uzimajući u obzir raspoložive resurse.
Upotreba informacija: U slučaju potpunog ili delimičnog preuzimanja i daljeg korišćenja materijala koji se nalazi na sajtu, potrebno je navesti link odgovarajuće stranice na sajtu kompanije TeleTrade-a kao izvora informacija. Upotreba materijala na internetu mora biti praćena hiper linkom do web stranice teletrade.org. Automatski uvoz materijala i informacija sa stranice je zabranjen.
Ako imate bilo kakvih pitanja, obratite nam se pr@teletrade.global.
транcфери