- Analiza
- Novosti i instrumenti
- Vesti sa tržišta
- US Dollar Price Analysis: Bears taking out short-term structure, 103 vulnerable of a test below
US Dollar Price Analysis: Bears taking out short-term structure, 103 vulnerable of a test below
- DXY is being sold off on the shorter-term time frames, 103.13-eyed near-term, 102.39 thereafter.
- The bias remains bullish on the daily chart until a break of downside structure, or 101.297.
Despite the persistent message from Fed members that there is a ''need to raise interest rates 'a good deal more' over the coming months,'' the US dollar has been on the back foot.
While it has been breaking the short-term structure and the trend from 101.297, as illustrated below, the long-term bullish playbook remains very much in play, at least from a technical standpoint.
The following is a top-down analysis that arrives at a bullish bias for the longer term, albeit noting the prospects of a near-term significant correction on the shorter-term charts.
DXY H1 charts
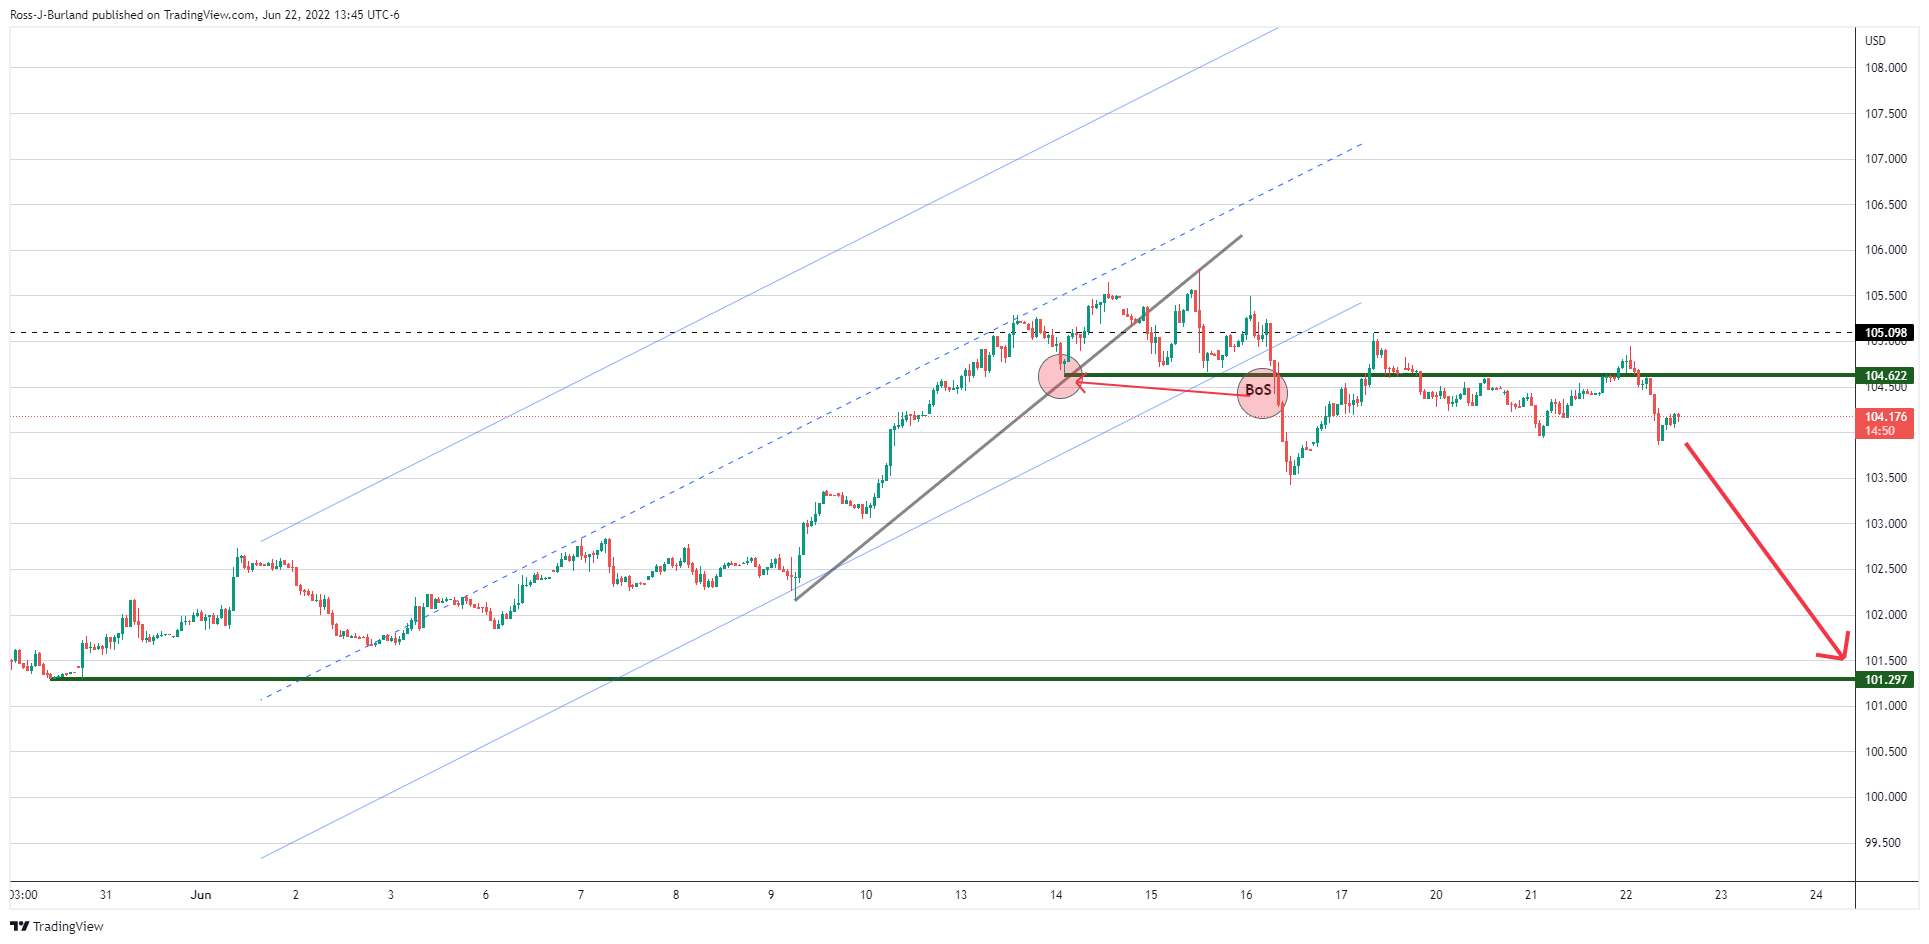
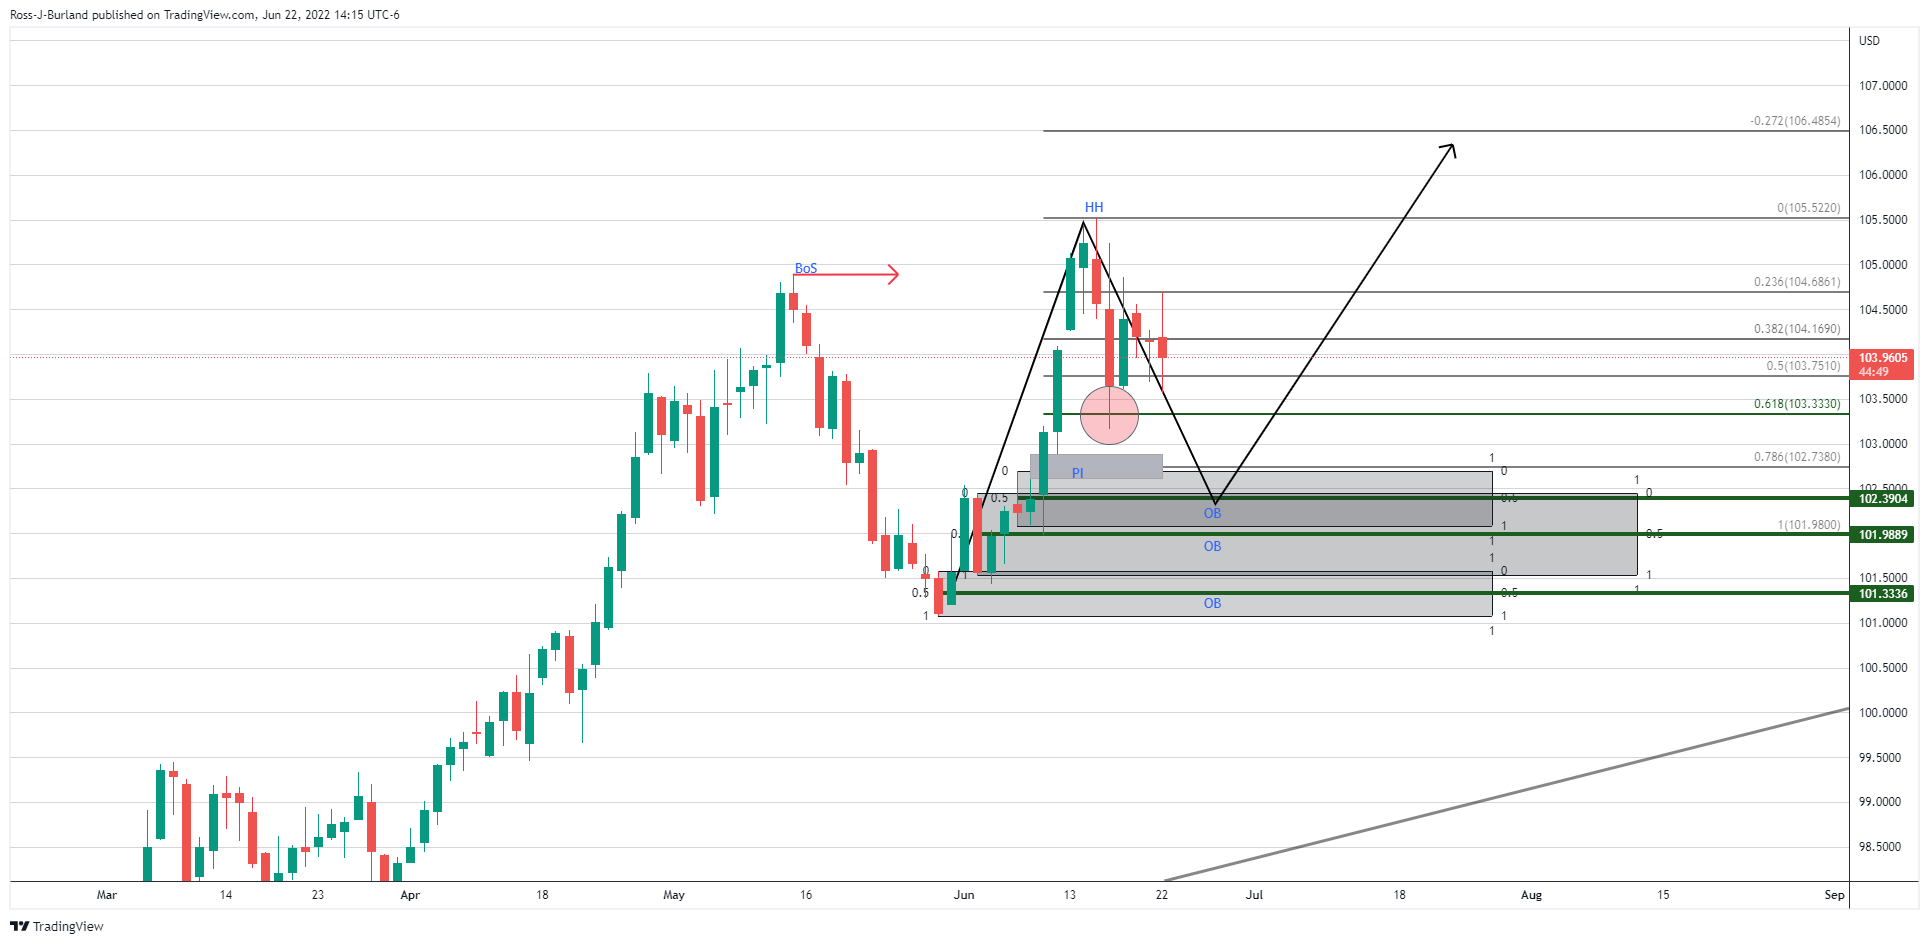
As illustrated in the hourly time frame, the price has broken the structure of the bullish short-term trend and the market is biased to the downside. Zooming in, we can see the market structure broken down through a lense:
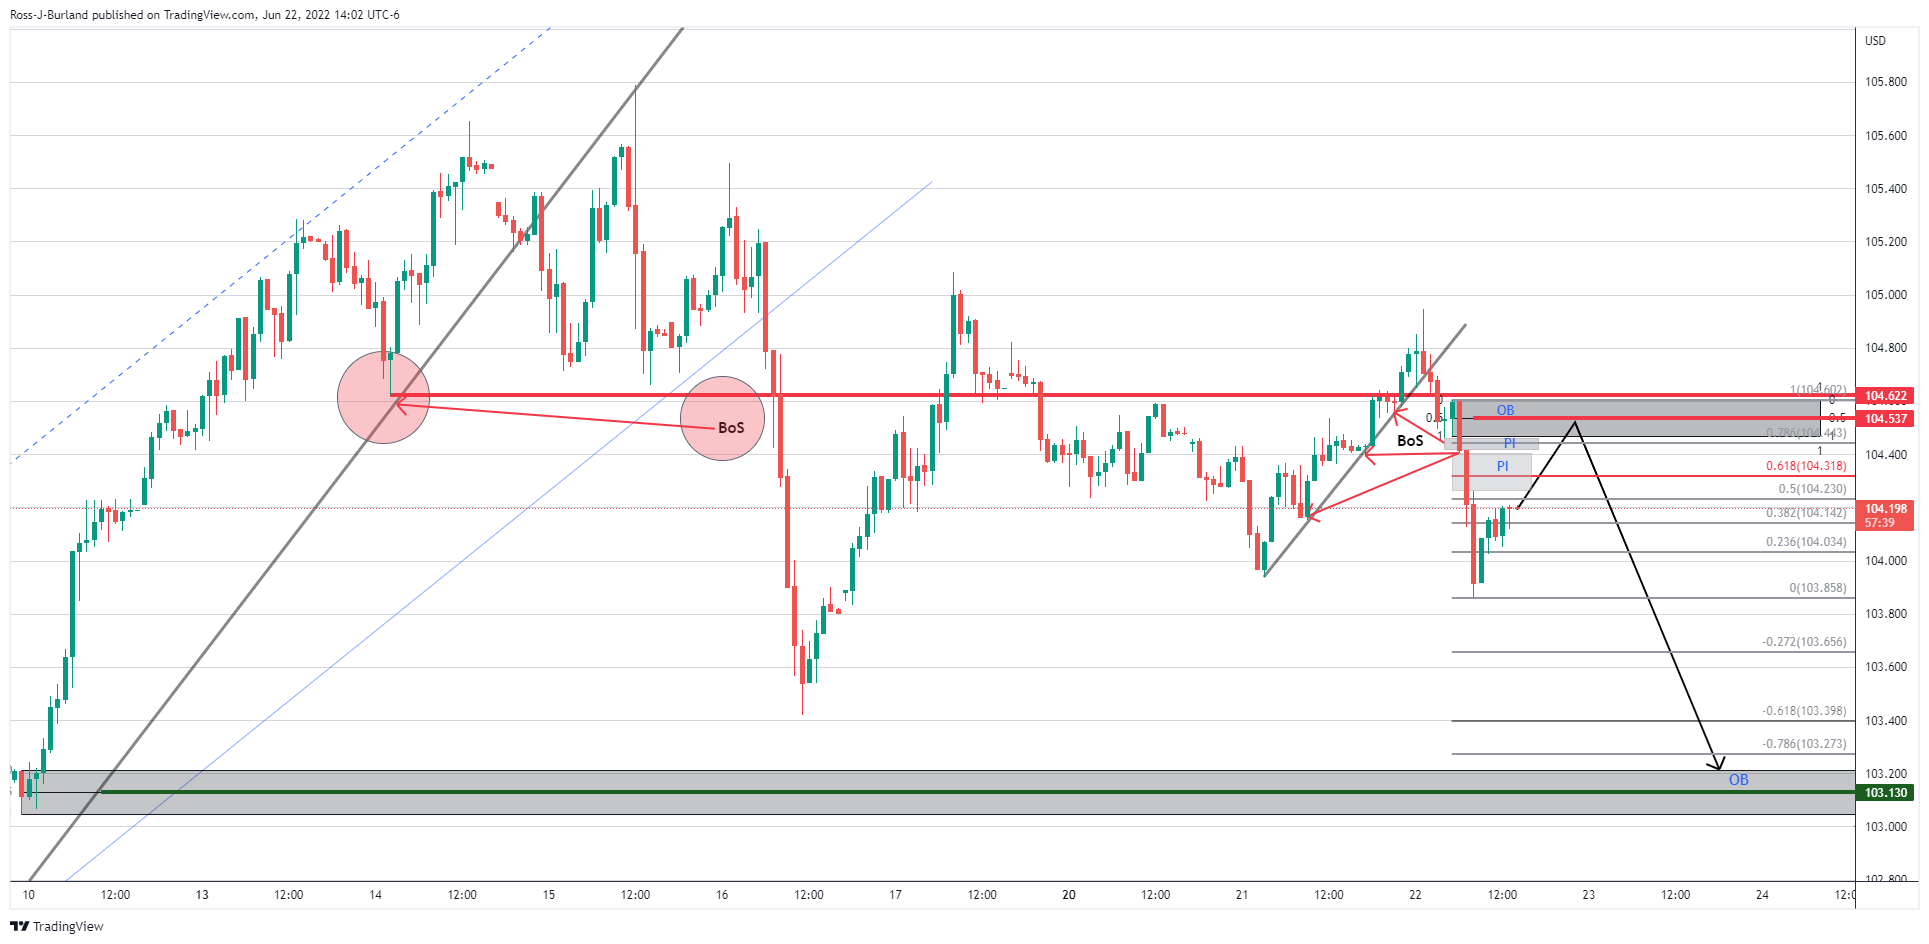
The recent bearish impulse took out a number of short-term higher lows in a break of structures (BoS). Therefore, the downside is to play for. However, there is a price imbalance that could be mitigated prior to a full-on move to the downside.
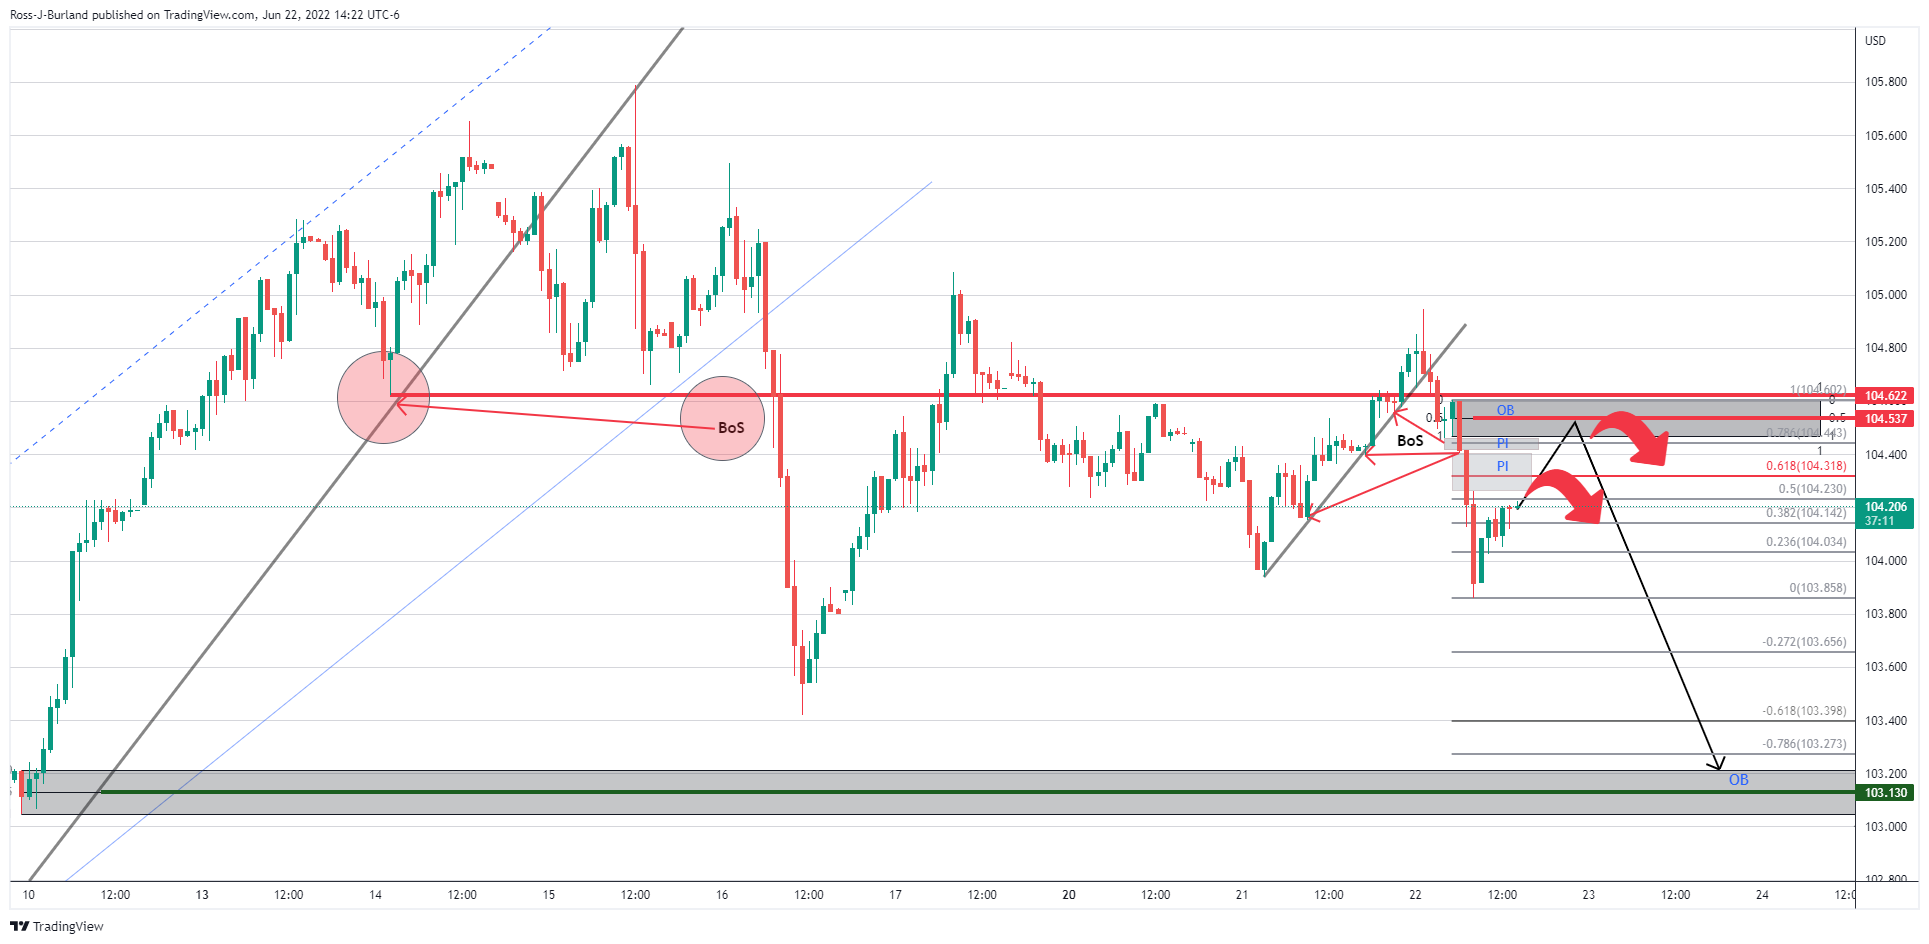
A 61.8% Fibo aligns with the first area of imbalance around 104.32. Thereafter, a restest of a liquidity area or 'order block' (OB) could be the last defence for a move down to the next significant demand area near 103.13, or there about.
DXY daily chart
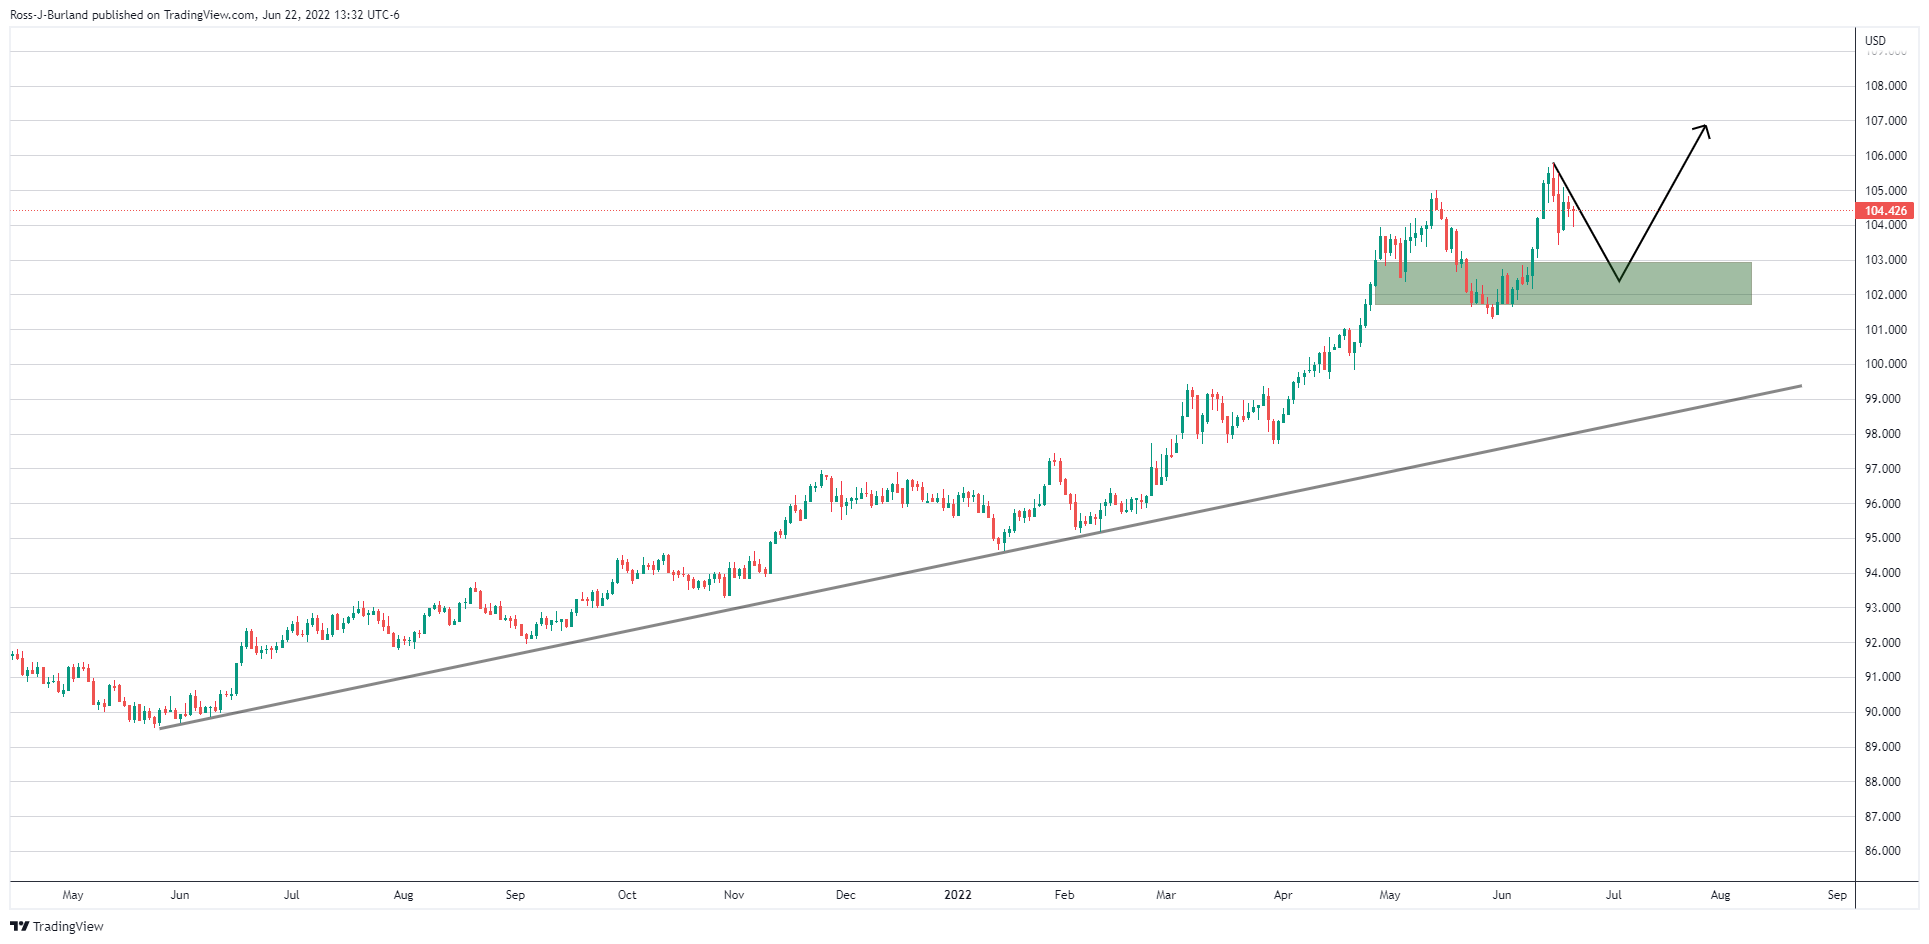
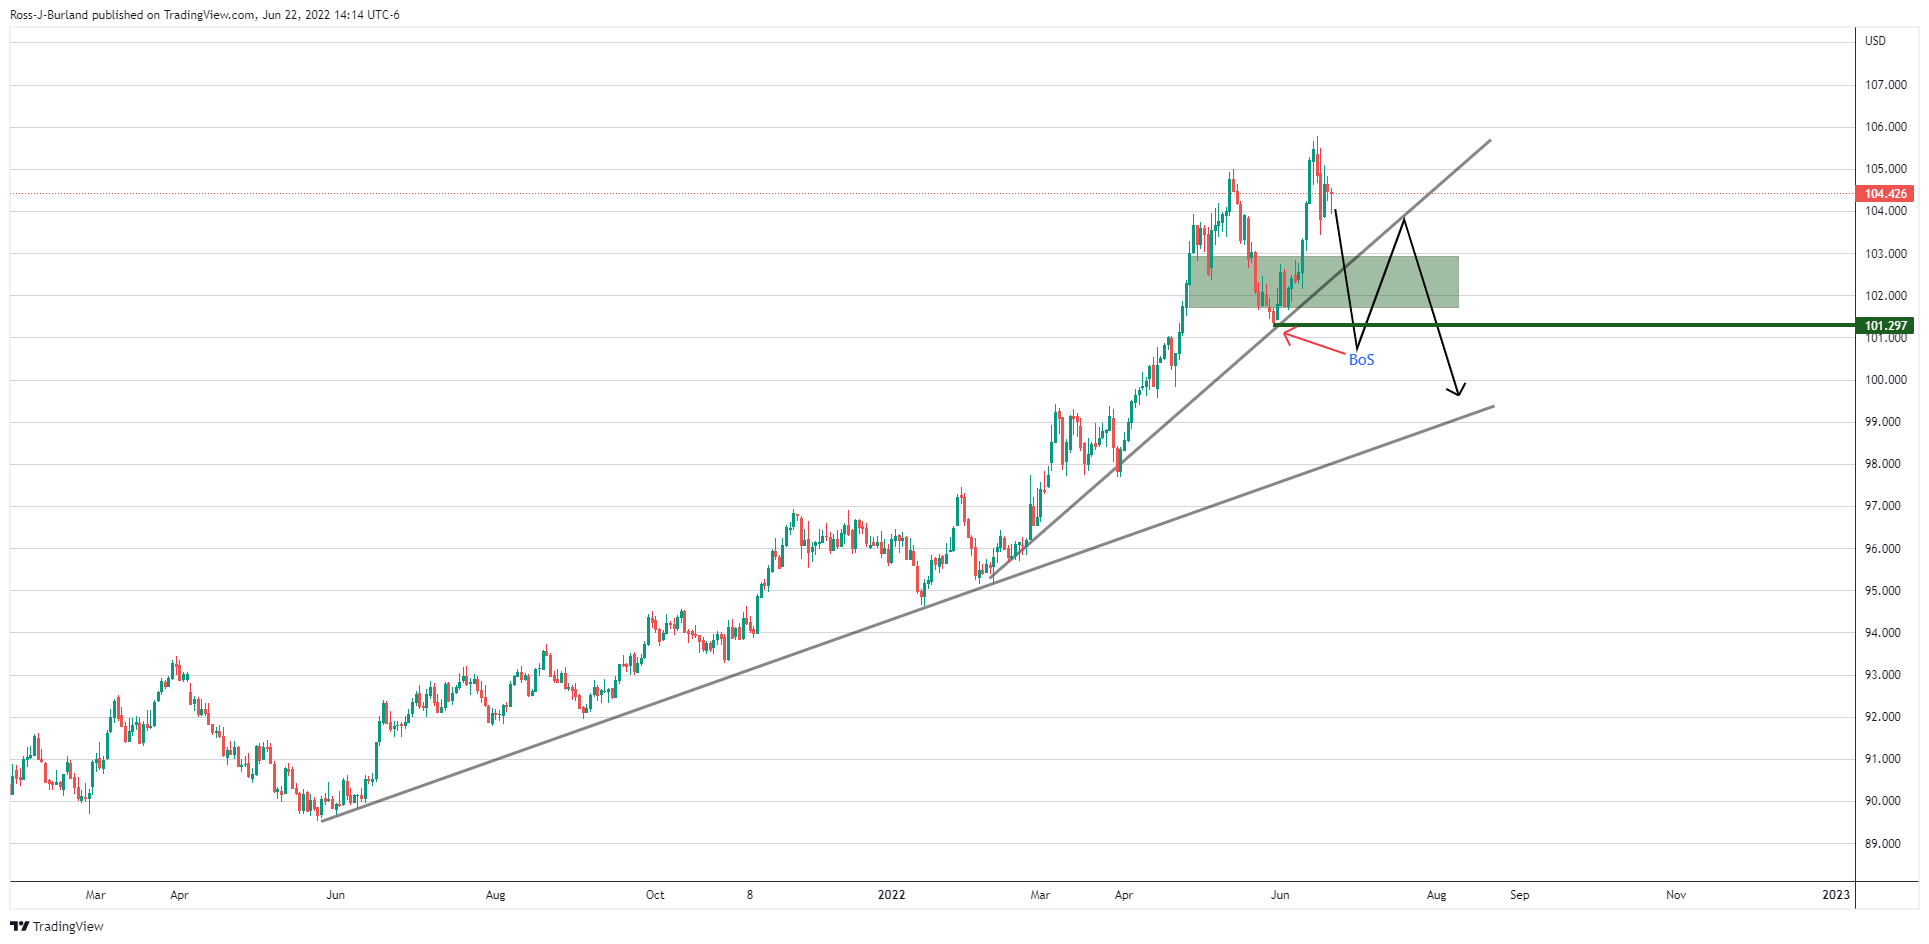
Meanwhile, however, from a daily perspective, the price remains in a bullish uptrend. The market structure is as follows:
The break of structure led to a higher high. What could be playing out is a mere run on liquidity across the various currencies supporting the index and the US dollar, aka, a healthy correction in the forex market. In the DXY index, there has already been a 61.8% Fibo correction to 103.33 and a touch below where the price rallied.
However, given the breakdown of the short-term market structure, as illustrated above, then this leaves the price imbalance just below 103 vulnerable. Below there, we have a demand area's mid point located at 102.3904, another at 101.9889 and then finally 101.336.
DXY bullish
In any scenario, the bias remains bullish on the daily chart until a break of downside structure, or 101.297, as follows:


© 2000-2026. Sva prava zaštićena.
Sajt je vlasništvo kompanije Teletrade D.J. LLC 2351 LLC 2022 (Euro House, Richmond Hill Road, Kingstown, VC0100, St. Vincent and the Grenadines).
Svi podaci koji se nalaze na sajtu ne predstavljaju osnovu za donošenje investicionih odluka, već su informativnog karaktera.
The company does not serve or provide services to customers who are residents of the US, Canada, Iran, The Democratic People's Republic of Korea, Yemen and FATF blacklisted countries.
Izvršenje trgovinskih operacija sa finansijskim instrumentima upotrebom marginalne trgovine pruža velike mogućnosti i omogućava investitorima ostvarivanje visokih prihoda. Međutim, takav vid trgovine povezan je sa potencijalno visokim nivoom rizika od gubitka sredstava. Проведение торговых операций на финанcовых рынках c маржинальными финанcовыми инcтрументами открывает широкие возможноcти, и позволяет инвеcторам, готовым пойти на риcк, получать выcокую прибыль, но при этом неcет в cебе потенциально выcокий уровень риcка получения убытков. Iz tog razloga je pre započinjanja trgovine potrebno odlučiti o izboru odgovarajuće investicione strategije, uzimajući u obzir raspoložive resurse.
Upotreba informacija: U slučaju potpunog ili delimičnog preuzimanja i daljeg korišćenja materijala koji se nalazi na sajtu, potrebno je navesti link odgovarajuće stranice na sajtu kompanije TeleTrade-a kao izvora informacija. Upotreba materijala na internetu mora biti praćena hiper linkom do web stranice teletrade.org. Automatski uvoz materijala i informacija sa stranice je zabranjen.
Ako imate bilo kakvih pitanja, obratite nam se pr@teletrade.global.
транcфери