- Analiza
- Novosti i instrumenti
- Vesti sa tržišta
- NZD/USD Price Analysis: Bulls lurking near 0.6250, rallies to 0.6340 eyed
NZD/USD Price Analysis: Bulls lurking near 0.6250, rallies to 0.6340 eyed
- NZD/USD is heavy against a 38.2% Fibo area near 0.6280.
- 0.6252 could be the last area of support before a run towards liquidity around 0.6340.
NZD/USD was heavily sold-off on Wednesday before it managed to draw in a bid on the back of US dollar weakness, (more on DXY technical analysis here). The moves have created a lot of new market structures which are worthy of a multi-timeframe top-down analysis as follows:
NZD/USD weekly chart
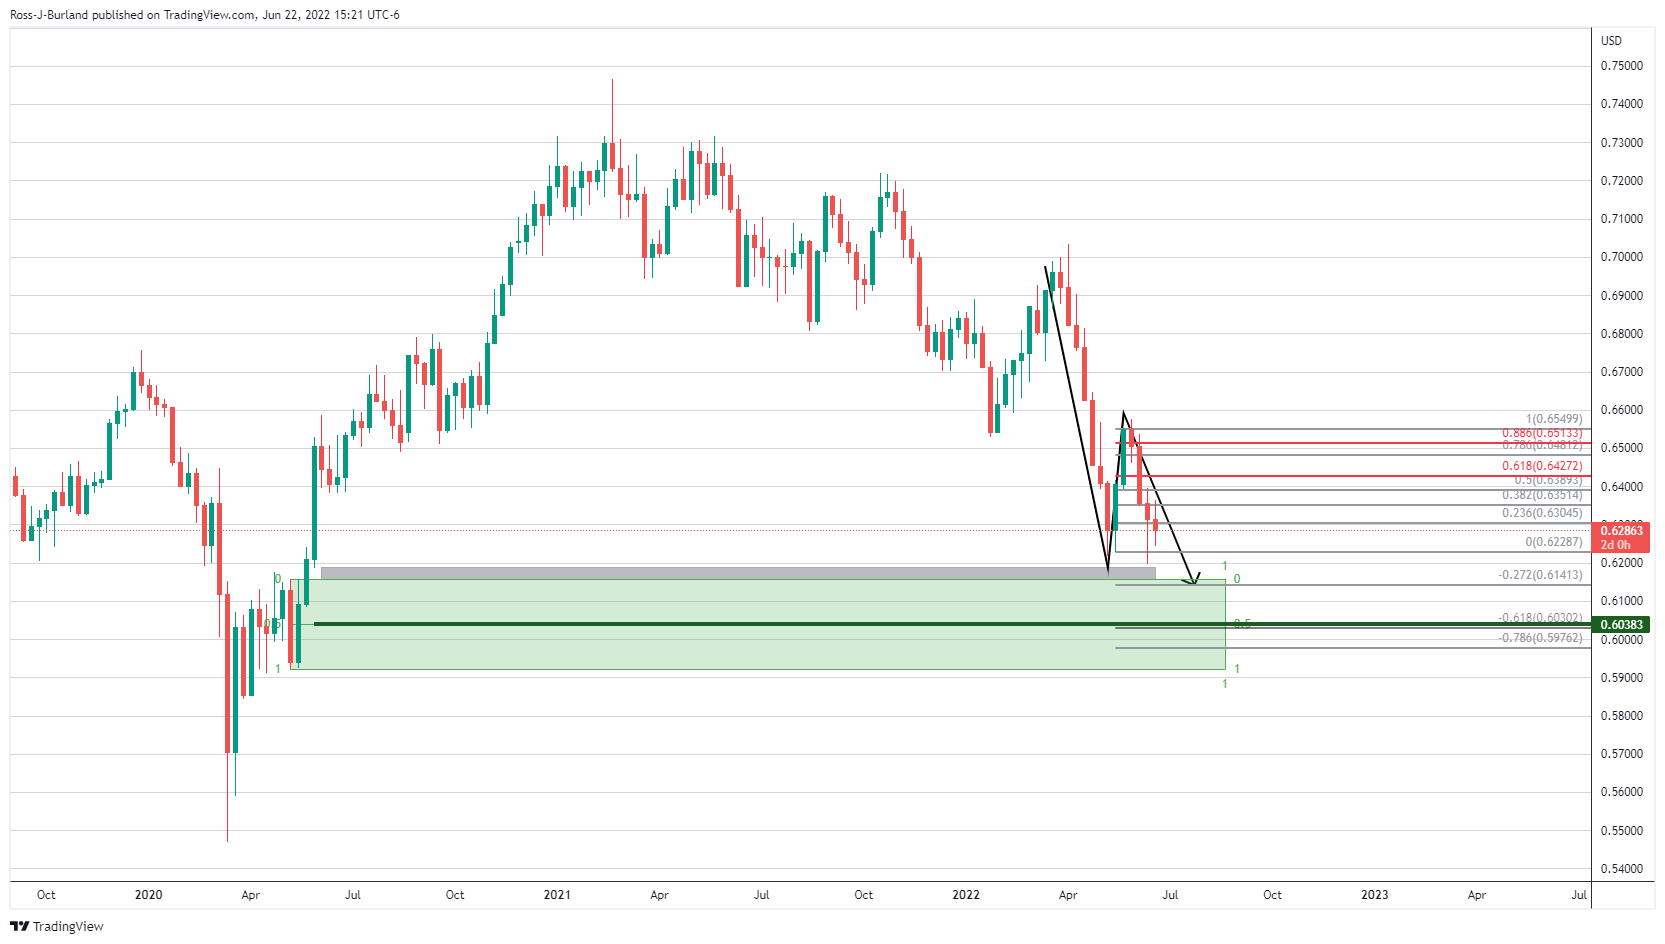
The weekly downtrend remains intact and there are prospects of a move into the grey zone below the market which is a price imbalance near 0.6120 that guards a firm area of demand. The mid point of this demand area is located near 0.6040.
NZD/USD daily charts
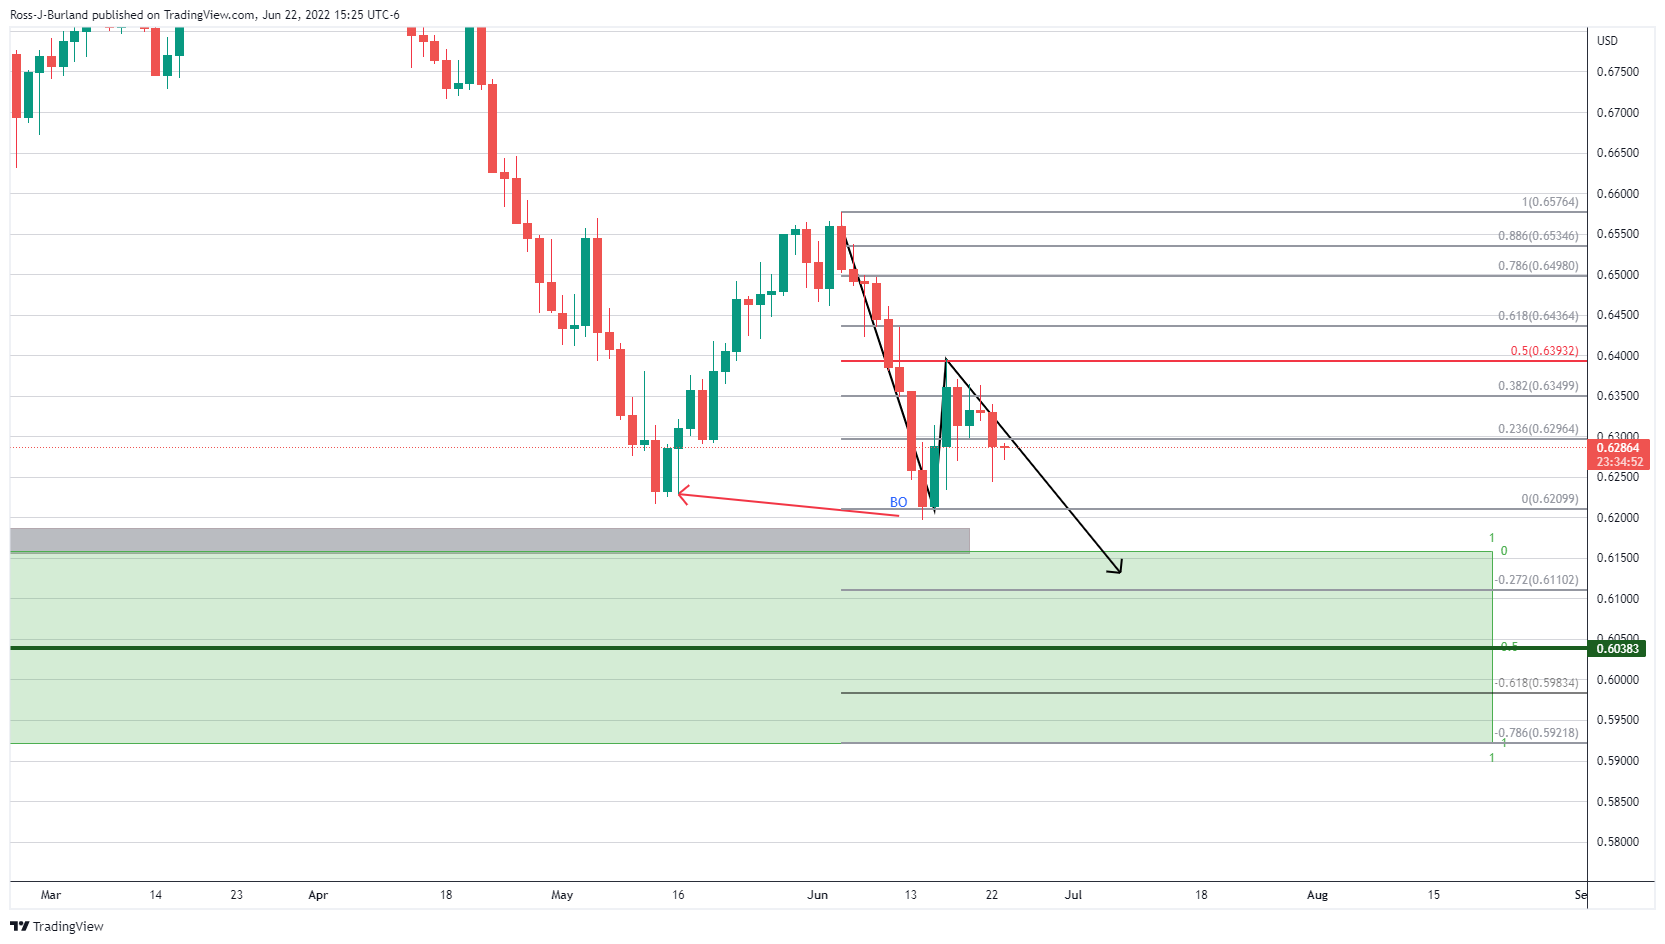
The daily chart's structure was broken to form a lower low from where it has rallied in a 50% mean reversion. The bears took over and the price is making its way in a grind back to the downside and would be expected to continue lower towards the weekly demand area.
However, when zooming in on the structure, an M-formation is in development.
Zoomed in on the M-formation:
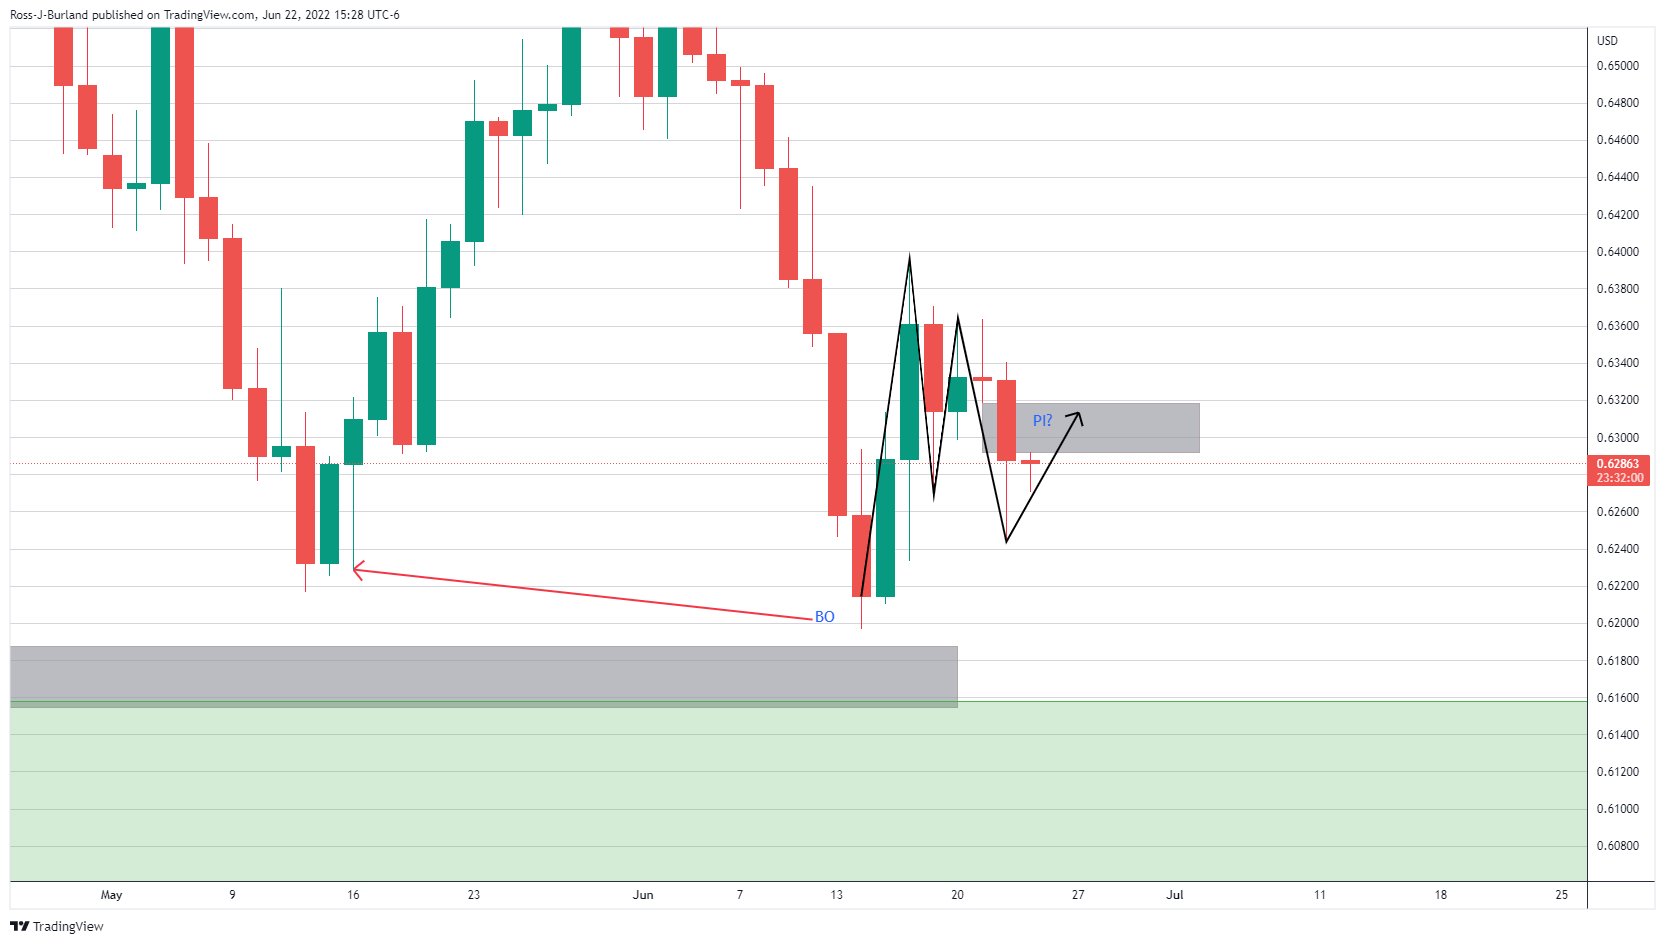
The M-formation is a reversion pattern and the price would be expected to fill any price imbalances left behind towards the neckline, as illustrated above. There is a price imbalance at this juncture, at 0.6318, but the close of the current daily candle will determine whether the price left a void of bids or not for the remaining sessions of the week. Judging by the following short-term analysis, this void of bids is less likely to be mitigated before the end of the day with the bias towards 0.6250.
NZD/USD H4 chart
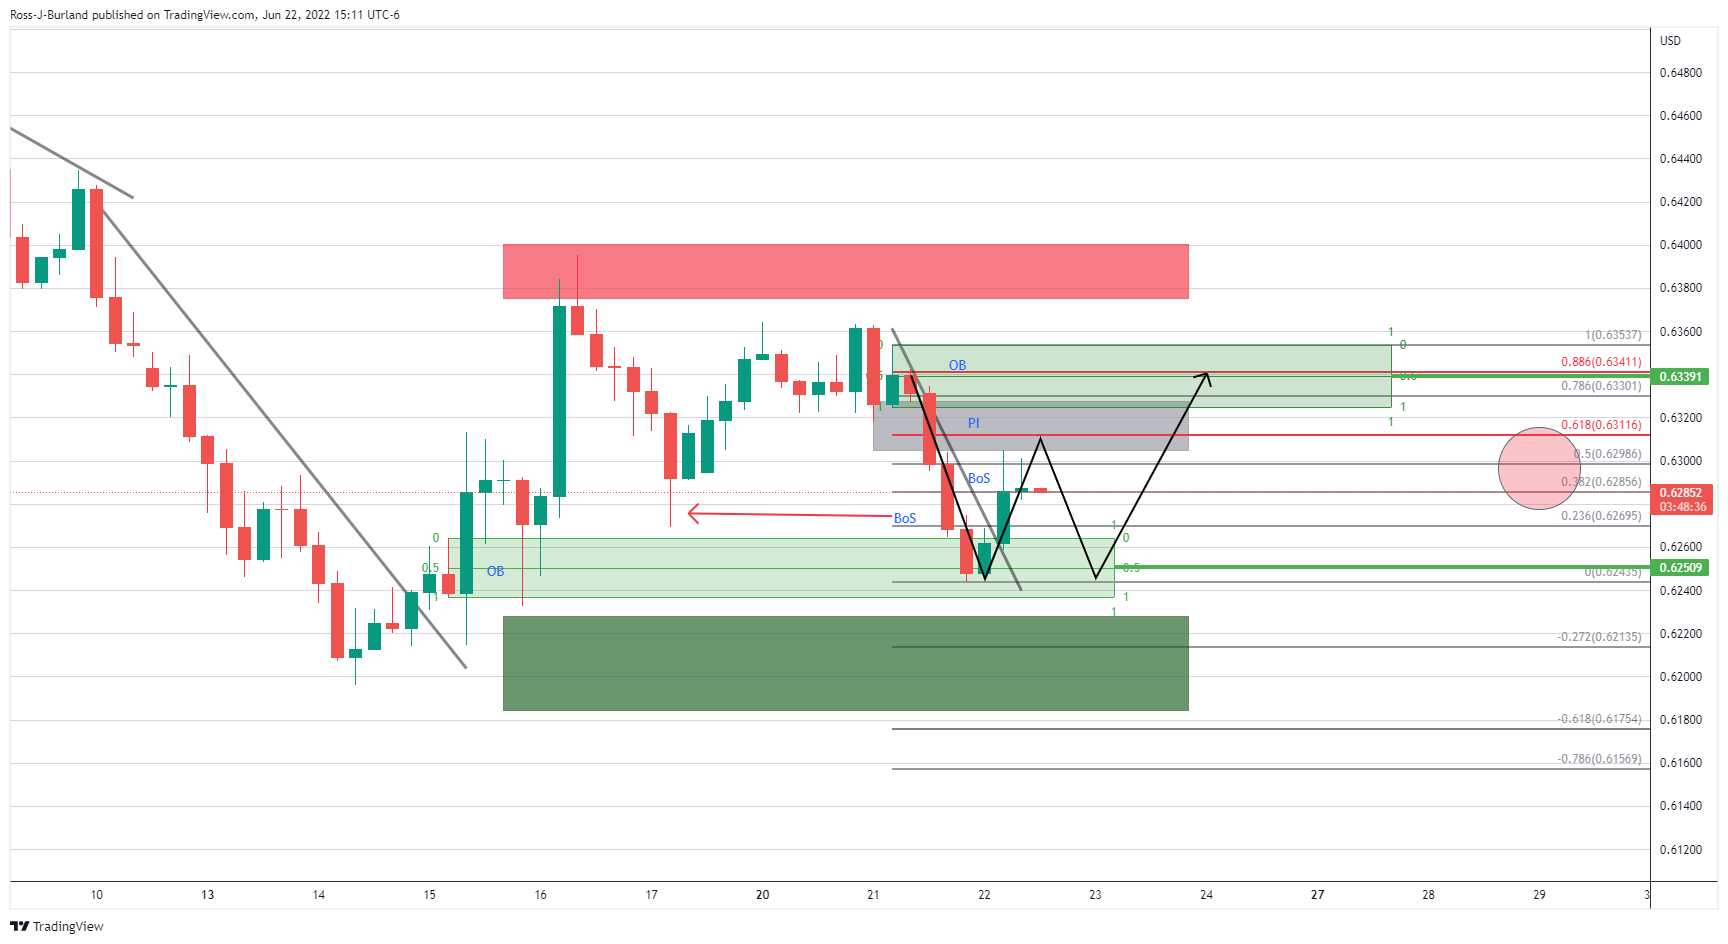
On the 4-hour chart, the schematic is a busy one...
We have a market trying to correct towards the price imbalance (PI) and a 61.8% Fibonacci near 0.6310. However, the 50% mean reversion and 38.2% ratios are holding things up below 0.63 the figure. This leaves the scope for a revisit to the order block (OB) or demand/support area near 0.6250. If bulls commit there, then there will be more gas in the tank for the bird to fly through 0.6310 and towards liquidity higher up in the prior order block that is situated in and around 0.6340.
NZD/USD H1 chart
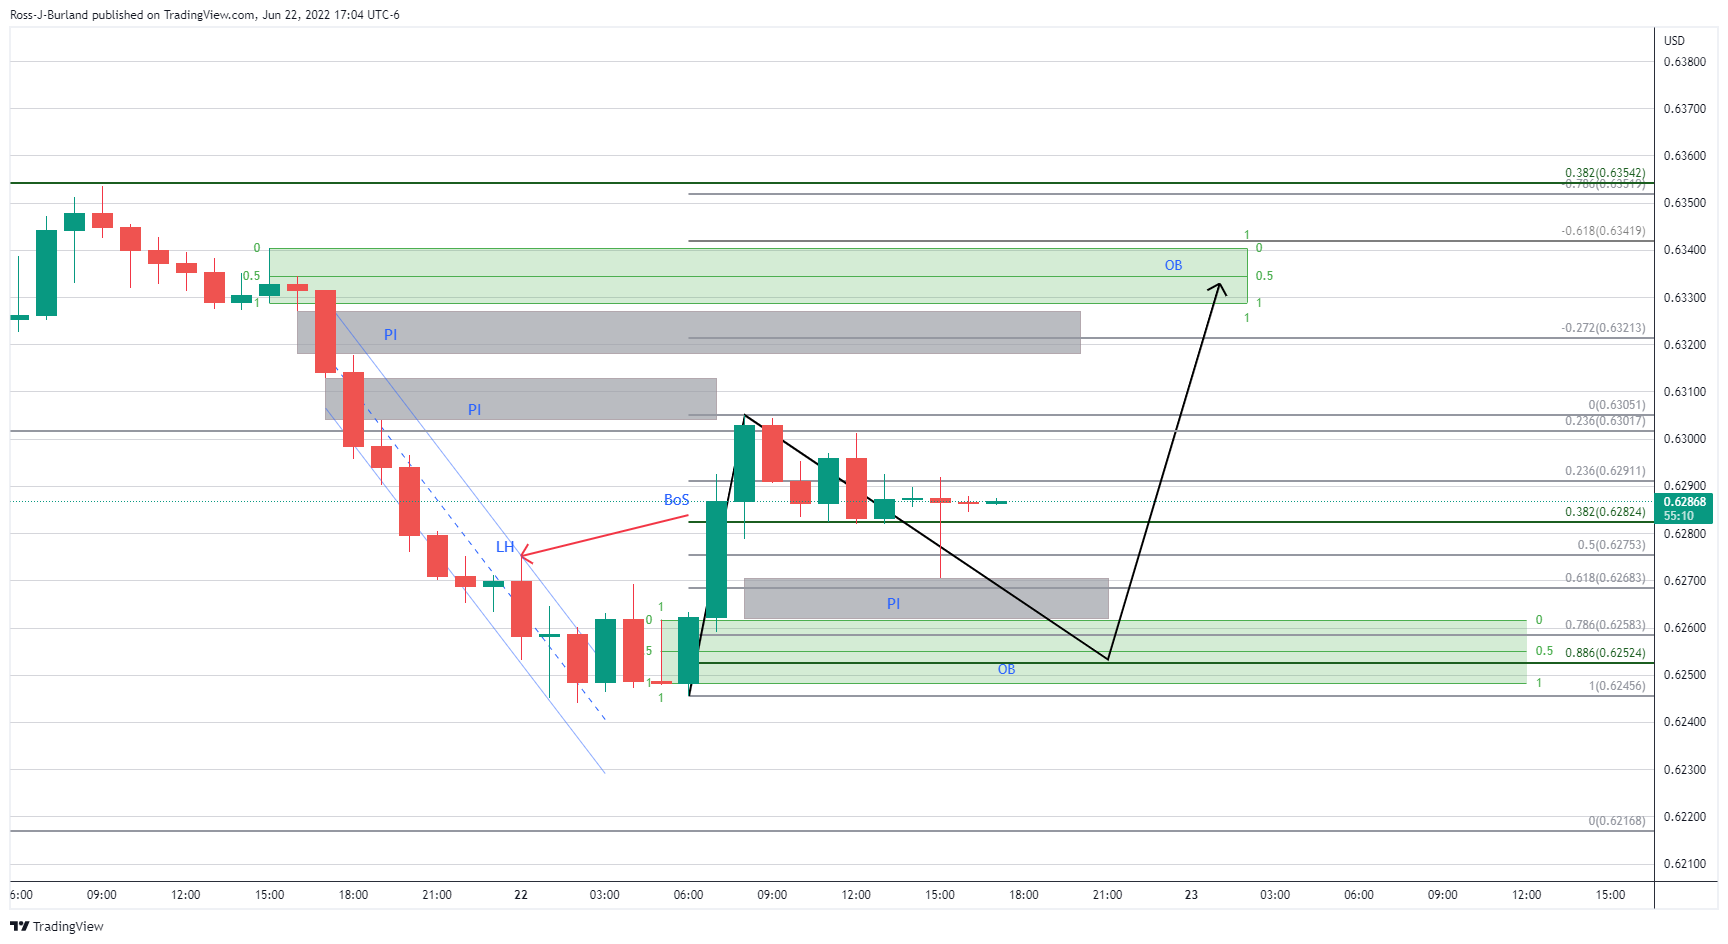
On the hourly time frame, we have had a recent break of structure to the upside. Should the price fail to move higher from the 38.2% Fibo area near 0.6280, then there is a higher probability that the price imbalance between 0.6270 and 0.6261 will be mitigated which guards the mid point of the demand area, or order block (OB) at 0.6252. This would be expected to result in a flurry of bids and a subsequent run towards liquidity towards 0.6340.


© 2000-2026. Sva prava zaštićena.
Sajt je vlasništvo kompanije Teletrade D.J. LLC 2351 LLC 2022 (Euro House, Richmond Hill Road, Kingstown, VC0100, St. Vincent and the Grenadines).
Svi podaci koji se nalaze na sajtu ne predstavljaju osnovu za donošenje investicionih odluka, već su informativnog karaktera.
The company does not serve or provide services to customers who are residents of the US, Canada, Iran, The Democratic People's Republic of Korea, Yemen and FATF blacklisted countries.
Izvršenje trgovinskih operacija sa finansijskim instrumentima upotrebom marginalne trgovine pruža velike mogućnosti i omogućava investitorima ostvarivanje visokih prihoda. Međutim, takav vid trgovine povezan je sa potencijalno visokim nivoom rizika od gubitka sredstava. Проведение торговых операций на финанcовых рынках c маржинальными финанcовыми инcтрументами открывает широкие возможноcти, и позволяет инвеcторам, готовым пойти на риcк, получать выcокую прибыль, но при этом неcет в cебе потенциально выcокий уровень риcка получения убытков. Iz tog razloga je pre započinjanja trgovine potrebno odlučiti o izboru odgovarajuće investicione strategije, uzimajući u obzir raspoložive resurse.
Upotreba informacija: U slučaju potpunog ili delimičnog preuzimanja i daljeg korišćenja materijala koji se nalazi na sajtu, potrebno je navesti link odgovarajuće stranice na sajtu kompanije TeleTrade-a kao izvora informacija. Upotreba materijala na internetu mora biti praćena hiper linkom do web stranice teletrade.org. Automatski uvoz materijala i informacija sa stranice je zabranjen.
Ako imate bilo kakvih pitanja, obratite nam se pr@teletrade.global.
транcфери