- Analiza
- Novosti i instrumenti
- Vesti sa tržišta
- GBP/USD Price Analysis: Retreats from the daily highs, steadily around 1.2080
GBP/USD Price Analysis: Retreats from the daily highs, steadily around 1.2080
- GBP/USD trims some of last Friday’s losses but remains trapped between the 20 and 50-DMA.
- The daily chart depicts the pair trending between a descending channel as sellers eye the 20-day EMA.
- The GBP/USD 4-hour scale depicts the pair as neutral-downward biased and might test the 1.2000 figure, short term.
The GBP/USD records minimal gains after hitting a daily high at 1.2137, shy of the 50-day EMA at 1.2166, which has proven to be solid resistance in the last four days. However, the British pound retreated under 1.2100 but remained above the opening price, recording gains of 0.12%. At the time of writing, the GBP/USD is trading at 1.2081.
GBP/USD Price Analysis: Technical outlook
The GBP/USD daily chart illustrates the major as neutral-to-downward biased. Further confirmation of the previously mentioned is that sellers are gathering momentum, as shown by the Relative Strength Index (RSI), aiming lower, residing below the 50-midline. Also, the major trades within a descending channel and the spot price is 50 pips shy of the 20-day EMA at 1.2039. Once cleared, it would exacerbate a fall towards the bottom of the channel, near the YTD low at 1.1759.
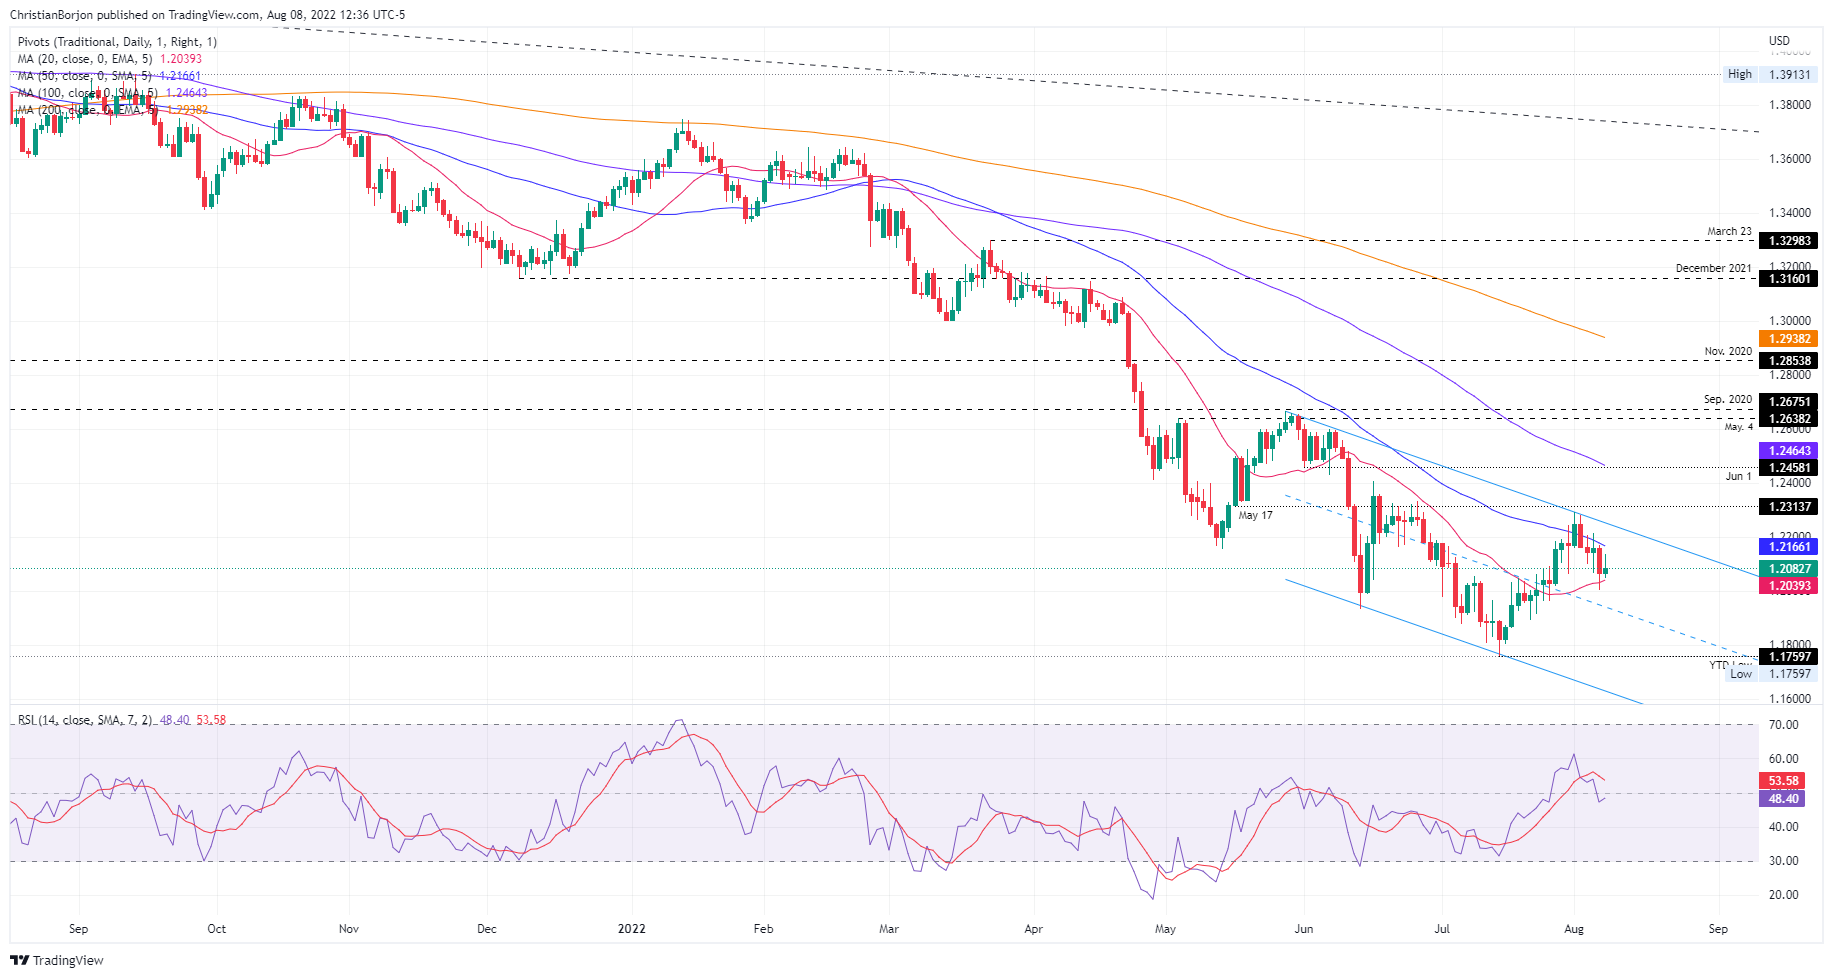 GBP/USD Daily chart
Meanwhile, the GBP/USD 4-hour chart shows that an ascending channel was broken to the downside last Friday, adding further selling pressure on the pair. Worth noting that GBP/USD buyers lifted the pair from the confluence of the 100 and 200-EMAs, near the 1.2040s lows of the day. However, sellers piling around the 20-EMA at 1.2113 weighed on the pair, which slid below the 1.2100 mark.
Hence, the GBP/USD 4-hour chart is still neutral-to-downward biased. Therefore, the GBP/USD first support would be the confluence of the 100 and 200-EMA around 1.2065-68. The break below will send the pair tumbling towards the S1 pivot at 1.1990, followed by the S2 at 1.1910.
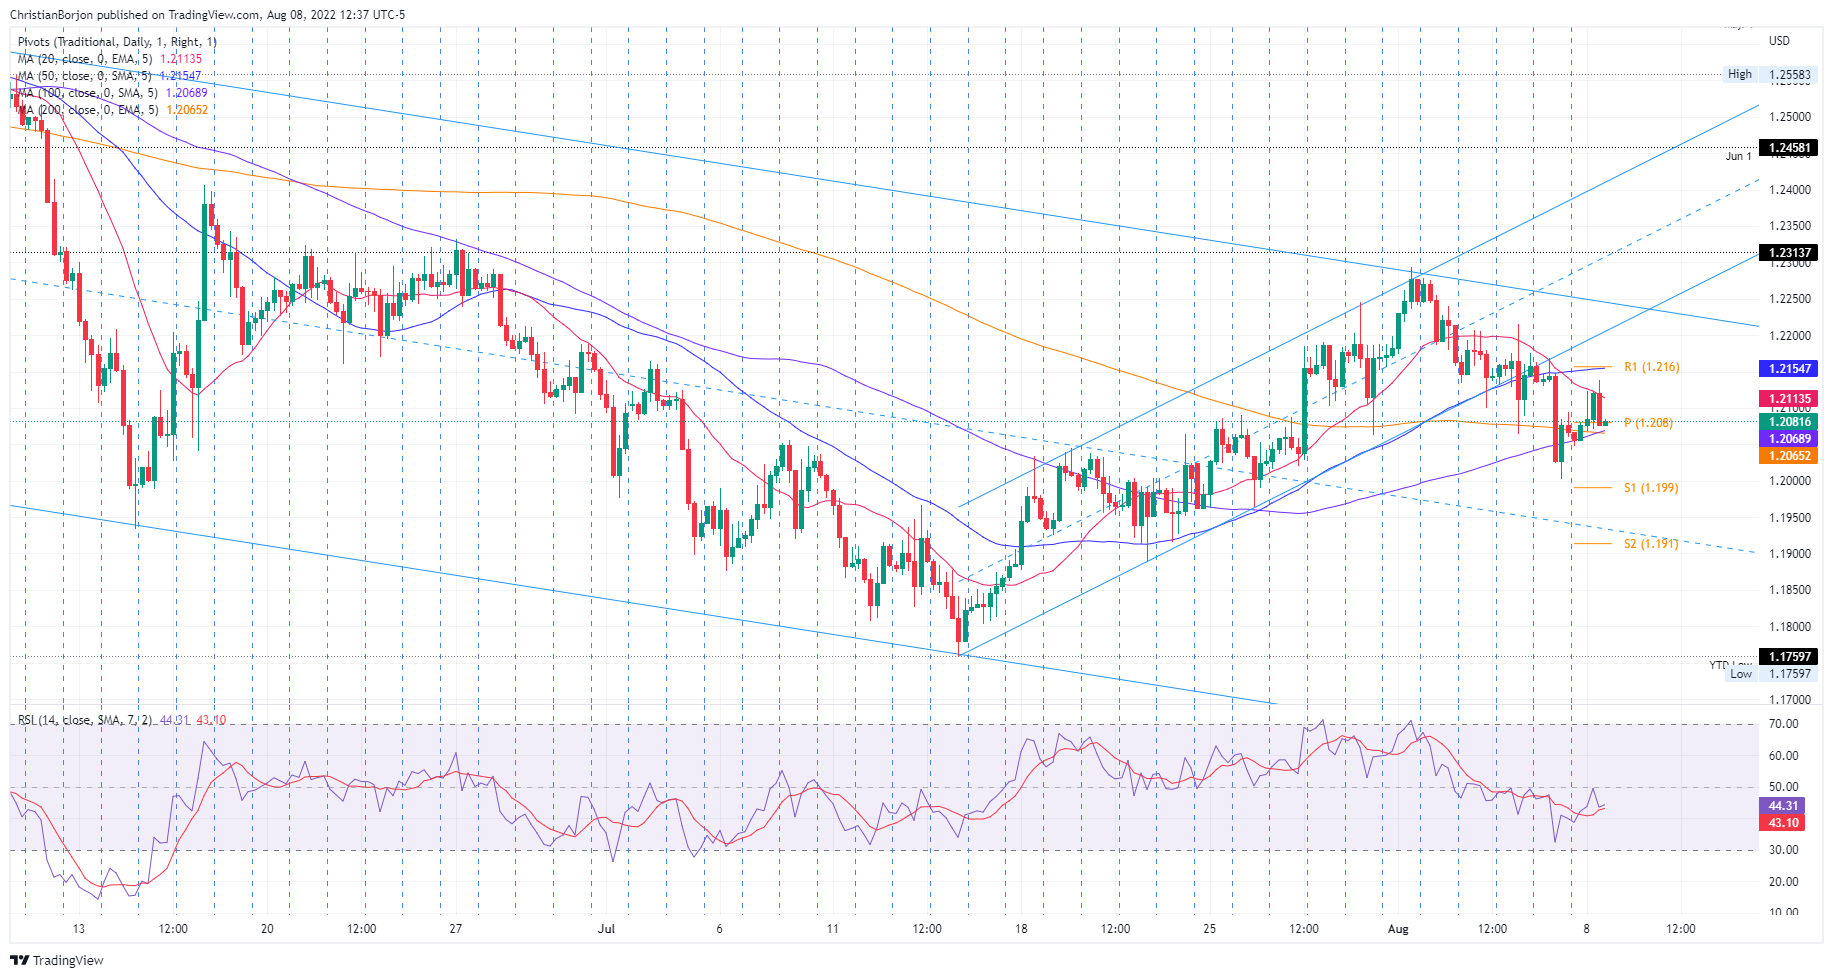 GBP/USD 4-hour chart
GBP/USD Key Technical Levels


© 2000-2026. Sva prava zaštićena.
Sajt je vlasništvo kompanije Teletrade D.J. LLC 2351 LLC 2022 (Euro House, Richmond Hill Road, Kingstown, VC0100, St. Vincent and the Grenadines).
Svi podaci koji se nalaze na sajtu ne predstavljaju osnovu za donošenje investicionih odluka, već su informativnog karaktera.
The company does not serve or provide services to customers who are residents of the US, Canada, Iran, The Democratic People's Republic of Korea, Yemen and FATF blacklisted countries.
Izvršenje trgovinskih operacija sa finansijskim instrumentima upotrebom marginalne trgovine pruža velike mogućnosti i omogućava investitorima ostvarivanje visokih prihoda. Međutim, takav vid trgovine povezan je sa potencijalno visokim nivoom rizika od gubitka sredstava. Проведение торговых операций на финанcовых рынках c маржинальными финанcовыми инcтрументами открывает широкие возможноcти, и позволяет инвеcторам, готовым пойти на риcк, получать выcокую прибыль, но при этом неcет в cебе потенциально выcокий уровень риcка получения убытков. Iz tog razloga je pre započinjanja trgovine potrebno odlučiti o izboru odgovarajuće investicione strategije, uzimajući u obzir raspoložive resurse.
Upotreba informacija: U slučaju potpunog ili delimičnog preuzimanja i daljeg korišćenja materijala koji se nalazi na sajtu, potrebno je navesti link odgovarajuće stranice na sajtu kompanije TeleTrade-a kao izvora informacija. Upotreba materijala na internetu mora biti praćena hiper linkom do web stranice teletrade.org. Automatski uvoz materijala i informacija sa stranice je zabranjen.
Ako imate bilo kakvih pitanja, obratite nam se pr@teletrade.global.
транcфери