- Analiza
- Novosti i instrumenti
- Vesti sa tržišta
- Gold Price Forecast: XAU/USD pokes 2022 low with eyes on $1,610 – Confluence Detector
Gold Price Forecast: XAU/USD pokes 2022 low with eyes on $1,610 – Confluence Detector
- Gold price remains pressured around the two-year low, reversing the previous day’s corrective bounce.
- Fears of recession, firmer yields underpin US dollar’s safe-haven demand and weigh on XAU/USD.
- Multiple key hurdles to the north, risk-off mood keeps sellers hopeful ahead of Fed Chair Powell’s speech.
Gold price (XAU/USD) returns to the bear’s list, after a brief absence the previous day, as the yellow pokes the two-year low marked earlier in the week. In doing so, the quote portrays the market’s rush towards risk safety, especially towards the US dollar, amid fears of economic slowdown. Also keeping the bullion bears hopeful were headlines suggesting more interest rate hikes from the global central banks, as well as downbeat macros from China, one of the key customers of gold. It’s worth noting that the pessimism surrounding Europe and the UK could keep the commodity directed towards the south. However, Fed Chair Jerome Powell’s speech may trigger another corrective rebound if the hawkish tone is missing.
Also read: Gold Price Forecast: XAU/USD remains vulnerable amid surging bond yields, USD
Gold Price: Key levels to watch
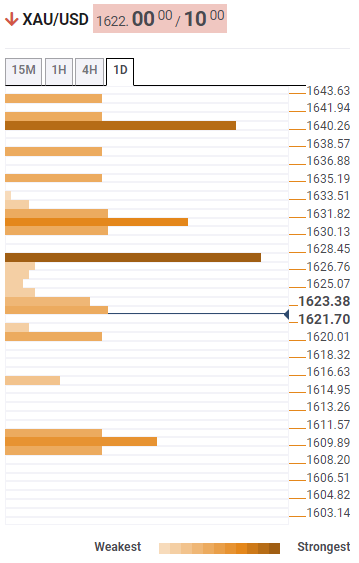
The Technical Confluence Detector shows that the gold price stays decisively below multiple strong resistances with a smooth run towards the south.
That said, a convergence of the Pivot Point one day and one week S2, around $1,610, gains the major attention of the sellers.
On an immediate basis, the lower band of the hourly Bollinger, near $1,620, could limit the XAU/USD downside.
Alternatively, a joint of the Pivot Point one week S1, lower band of the daily Bollinger and SMA50 on 15-minute appears a tough nut to crack for the gold buyers, close to $1,628.
Following that, the SMA 10 on 4H joins the previous high on four-hour formation, as well as the middle band of the hourly Bollinger, to highlight $1,630 as adjacent resistance.
In a case where XAU/USD successfully crosses the $1,630 hurdle, the middle Bollinger band on 4H, the upper Bollinger band on the hourly and previous weekly low will lure the bulls around $1,641.
If at all the gold price rallies beyond the $1,641 hurdle, the odds of witnessing a run-up towards July’s peak near $1,680 can’t be ruled out.
Here is how it looks on the tool
About Technical Confluences Detector
The TCD (Technical Confluences Detector) is a tool to locate and point out those price levels where there is a congestion of indicators, moving averages, Fibonacci levels, Pivot Points, etc. If you are a short-term trader, you will find entry points for counter-trend strategies and hunt a few points at a time. If you are a medium-to-long-term trader, this tool will allow you to know in advance the price levels where a medium-to-long-term trend may stop and rest, where to unwind positions, or where to increase your position size.


© 2000-2026. Sva prava zaštićena.
Sajt je vlasništvo kompanije Teletrade D.J. LLC 2351 LLC 2022 (Euro House, Richmond Hill Road, Kingstown, VC0100, St. Vincent and the Grenadines).
Svi podaci koji se nalaze na sajtu ne predstavljaju osnovu za donošenje investicionih odluka, već su informativnog karaktera.
The company does not serve or provide services to customers who are residents of the US, Canada, Iran, The Democratic People's Republic of Korea, Yemen and FATF blacklisted countries.
Izvršenje trgovinskih operacija sa finansijskim instrumentima upotrebom marginalne trgovine pruža velike mogućnosti i omogućava investitorima ostvarivanje visokih prihoda. Međutim, takav vid trgovine povezan je sa potencijalno visokim nivoom rizika od gubitka sredstava. Проведение торговых операций на финанcовых рынках c маржинальными финанcовыми инcтрументами открывает широкие возможноcти, и позволяет инвеcторам, готовым пойти на риcк, получать выcокую прибыль, но при этом неcет в cебе потенциально выcокий уровень риcка получения убытков. Iz tog razloga je pre započinjanja trgovine potrebno odlučiti o izboru odgovarajuće investicione strategije, uzimajući u obzir raspoložive resurse.
Upotreba informacija: U slučaju potpunog ili delimičnog preuzimanja i daljeg korišćenja materijala koji se nalazi na sajtu, potrebno je navesti link odgovarajuće stranice na sajtu kompanije TeleTrade-a kao izvora informacija. Upotreba materijala na internetu mora biti praćena hiper linkom do web stranice teletrade.org. Automatski uvoz materijala i informacija sa stranice je zabranjen.
Ako imate bilo kakvih pitanja, obratite nam se pr@teletrade.global.
транcфери