- Analiza
- Novosti i instrumenti
- Vesti sa tržišta
- Gold Price Forecast: Acceptance above $1,673 is critical for XAU/USD bulls – Confluence Detector
Gold Price Forecast: Acceptance above $1,673 is critical for XAU/USD bulls – Confluence Detector
- Gold price is attempting a tepid recovery but sellers keep lurking at the $1,673 hurdle.
- US dollar is licking its overnight wounds amid weaker yields amid an extended risk rally.
- XAU/USD remains a ‘sell the bounce trade’ after hot US inflation suggests steeper Fed rate hikes.
Gold price is taking a breather below $1,700 after witnessing a volatile session on Thursday after the US inflation figures surprised the upside and rocked the financial markets. The US Consumer Price Index (CPI) and Core prints beat expectations across the time horizons, bolstering the case for steeper rate hikes by the Fed in the coming months. The yellow metal slumped to monthly lows at $1,644 in a knee-jerk reaction to the red-hot inflation data, as the US dollar spiked with the Treasury yields. However, the metal changed course to recapture $1,650 after Wall Street indices rebounded firmly and snapped the US dollar upsurge. Heading towards the next week, investors reassess the impact of the US inflation data on the Fed rate hike outlook, especially in the face of the upcoming consumer-centric data. Investors will also take note of the UK bond market volatility and looming geopolitical tensions.
Also read: US Retail Sales Preview: Positive surprises eyed for dollar bulls to regain poise
Gold Price: Key levels to watch
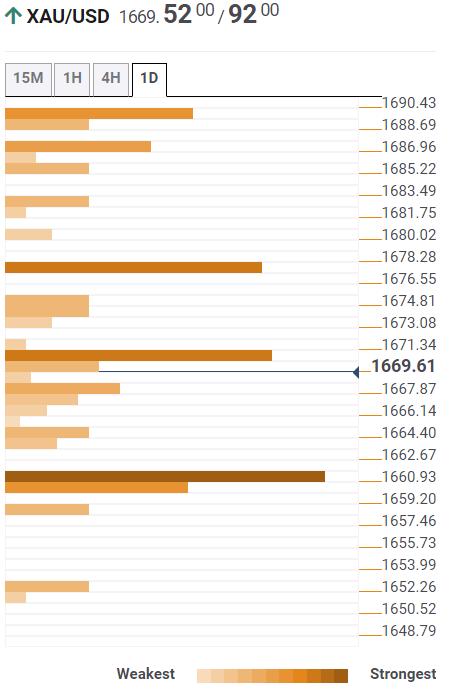
The Technical Confluence Detector shows that the gold price is gyrating below the immediate resistance placed at $1,669, which is the intersection of the SMA10 four-hour and Bollinger Band four-hour Middle.
The next critical hurdle is seen at the convergence of the SMA5 one-day and Bollinger Band one-day Middle at $1,673. The previous year’s low at $1,677 will be a tough nut to crack on the road to recovery. Further up, the previous day’s high of $1,683 will come into play.
On the flip side, the $1,664 demand area will come to the rescue of buyers on the renewed selling.
Sellers need a sustained move below the previous week’s low at $1,660. The next cushion is seen at the Fibonacci 38.2% one-day at $1,658.
Here is how it looks on the tool
About Technical Confluences Detector
The TCD (Technical Confluences Detector) is a tool to locate and point out those price levels where there is a congestion of indicators, moving averages, Fibonacci levels, Pivot Points, etc. If you are a short-term trader, you will find entry points for counter-trend strategies and hunt a few points at a time. If you are a medium-to-long-term trader, this tool will allow you to know in advance the price levels where a medium-to-long-term trend may stop and rest, where to unwind positions, or where to increase your position size.


© 2000-2026. Sva prava zaštićena.
Sajt je vlasništvo kompanije Teletrade D.J. LLC 2351 LLC 2022 (Euro House, Richmond Hill Road, Kingstown, VC0100, St. Vincent and the Grenadines).
Svi podaci koji se nalaze na sajtu ne predstavljaju osnovu za donošenje investicionih odluka, već su informativnog karaktera.
The company does not serve or provide services to customers who are residents of the US, Canada, Iran, The Democratic People's Republic of Korea, Yemen and FATF blacklisted countries.
Izvršenje trgovinskih operacija sa finansijskim instrumentima upotrebom marginalne trgovine pruža velike mogućnosti i omogućava investitorima ostvarivanje visokih prihoda. Međutim, takav vid trgovine povezan je sa potencijalno visokim nivoom rizika od gubitka sredstava. Проведение торговых операций на финанcовых рынках c маржинальными финанcовыми инcтрументами открывает широкие возможноcти, и позволяет инвеcторам, готовым пойти на риcк, получать выcокую прибыль, но при этом неcет в cебе потенциально выcокий уровень риcка получения убытков. Iz tog razloga je pre započinjanja trgovine potrebno odlučiti o izboru odgovarajuće investicione strategije, uzimajući u obzir raspoložive resurse.
Upotreba informacija: U slučaju potpunog ili delimičnog preuzimanja i daljeg korišćenja materijala koji se nalazi na sajtu, potrebno je navesti link odgovarajuće stranice na sajtu kompanije TeleTrade-a kao izvora informacija. Upotreba materijala na internetu mora biti praćena hiper linkom do web stranice teletrade.org. Automatski uvoz materijala i informacija sa stranice je zabranjen.
Ako imate bilo kakvih pitanja, obratite nam se pr@teletrade.global.
транcфери