- Analiza
- Novosti i instrumenti
- Vesti sa tržišta
- Gold Price Analysis: XAU/USD meanders around $1650, capitalizing on a weak US Dollar
Gold Price Analysis: XAU/USD meanders around $1650, capitalizing on a weak US Dollar
- Gold price grinds higher by 0.24%, though facing solid resistance around $1660.
- If XAU/USD clears $1670, a test of $1700 is on the cards.
- A formation of a bullish flag in the XAU/USD hourly chart opens the door for further upside.
Gold price advances steadily during the North American session, though it remains capped below the 20-day Exponential Moving Average (EMA), despite falling US Treasury yields underpinning the yellow metal prices, as gold recovers after hitting a daily low of $1638.40. At the time of writing, the XAU/USD is trading at $1653 a troy ounce, above its opening price by 0.24%.
XAU/USD Price Forecast: Technical outlook
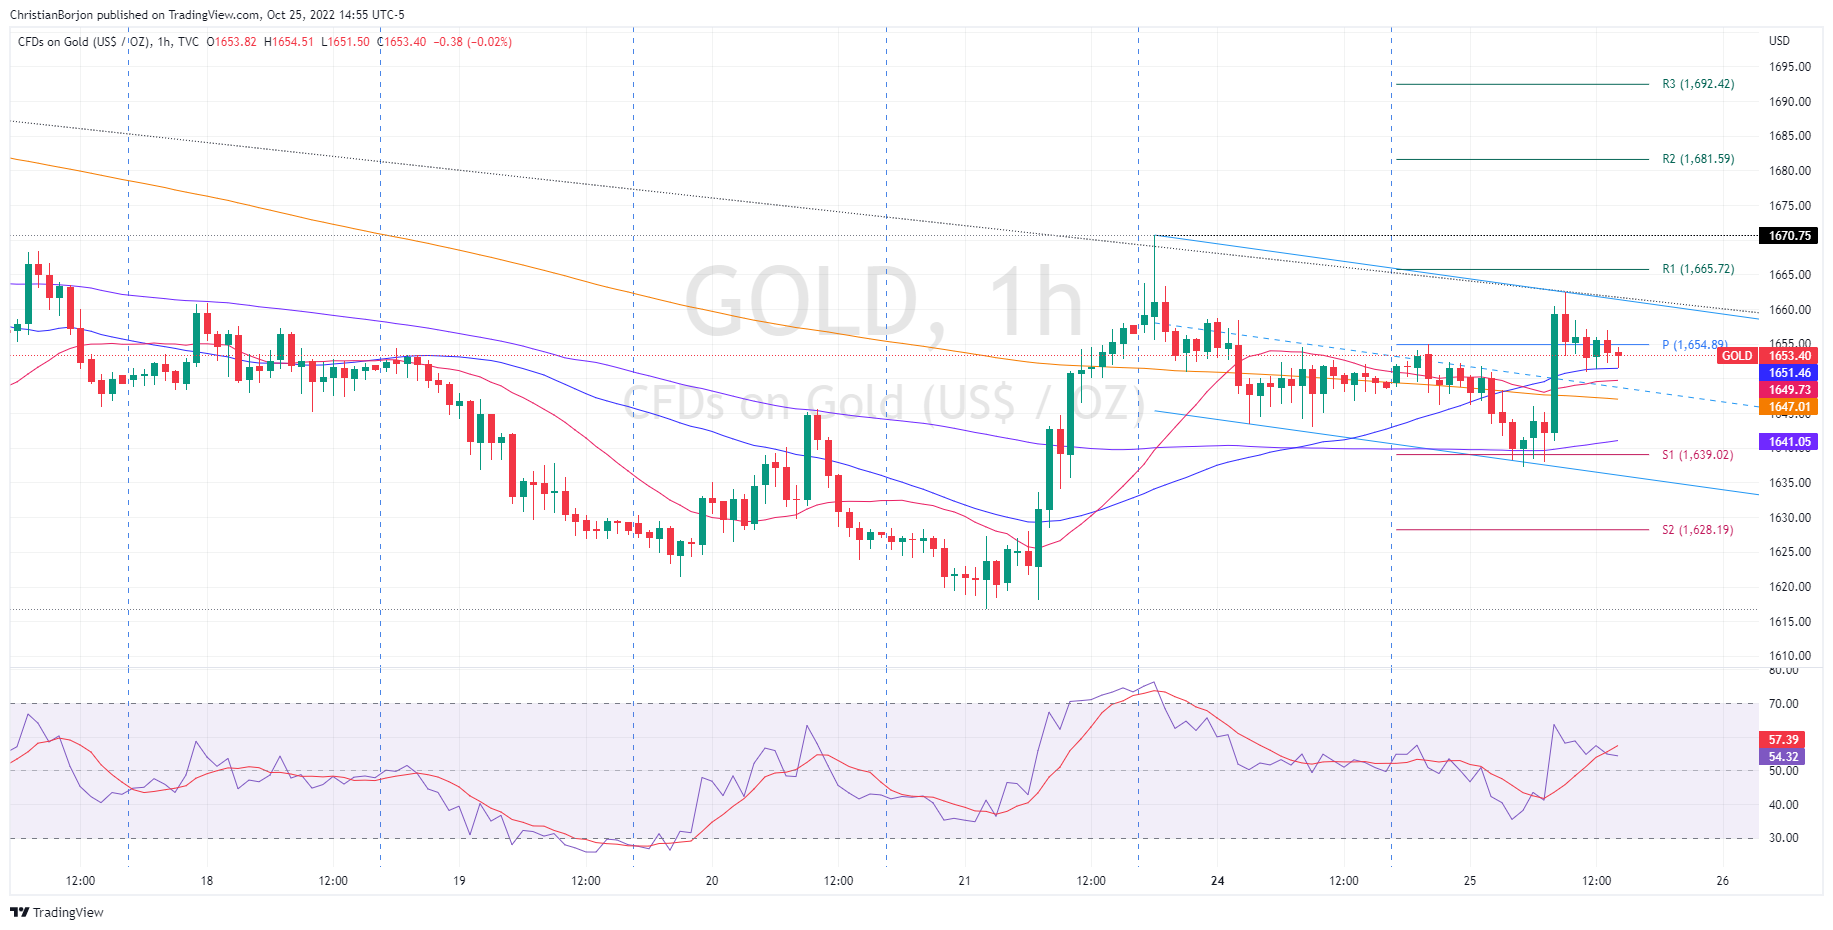
From a daily chart perspective, XAU/USD is downward biased, as it has remained since sliding below the 200-EMA in mid-June 2022. Worth noting that Tuesday’s daily high was shy of hitting a downslope trendline, drawn from October highs, which confluences with the 20-day EMA. So XAU buyers need to clear $1670, to exacerbate a rally towards the 100-day EMA at $1690, ahead of $1700. On the flip side, a daily close below Monday’s low of $1644 would cement gold’s downward biased, which would be unable to capitalize, despite lower US bond yields, opening the door for further losses.
Short-term, the XAU/USD hourly chart illustrates the formation of a bullish flag, opening the door for further gains. Worth noting that gold is neutral-to-upward biased, and once it clears, the October 24 high of $1670 will exacerbate a rally toward $1700.
The XAU/USD first resistance would be the R1 daily pivot at $1665, ahead of $1670. Break above will expose the R2 pivot at $1681, followed by the R3 daily pivot level at $1692.42, ahead of $1700.
On the other hand, if XAU/USD slumps below the confluence of several EMAs, lead by the 50, 20, and 200-EMA around $1647-$1651, would send the yellow-metal price toward the convergence of the 100-EMA and the S1 daily pivot around $1639-41. Once cleared, the following demand zone would be the bullish-flag bottom trendline around $1636.
XAU/USD Key Technical Levels


© 2000-2026. Sva prava zaštićena.
Sajt je vlasništvo kompanije Teletrade D.J. LLC 2351 LLC 2022 (Euro House, Richmond Hill Road, Kingstown, VC0100, St. Vincent and the Grenadines).
Svi podaci koji se nalaze na sajtu ne predstavljaju osnovu za donošenje investicionih odluka, već su informativnog karaktera.
The company does not serve or provide services to customers who are residents of the US, Canada, Iran, The Democratic People's Republic of Korea, Yemen and FATF blacklisted countries.
Izvršenje trgovinskih operacija sa finansijskim instrumentima upotrebom marginalne trgovine pruža velike mogućnosti i omogućava investitorima ostvarivanje visokih prihoda. Međutim, takav vid trgovine povezan je sa potencijalno visokim nivoom rizika od gubitka sredstava. Проведение торговых операций на финанcовых рынках c маржинальными финанcовыми инcтрументами открывает широкие возможноcти, и позволяет инвеcторам, готовым пойти на риcк, получать выcокую прибыль, но при этом неcет в cебе потенциально выcокий уровень риcка получения убытков. Iz tog razloga je pre započinjanja trgovine potrebno odlučiti o izboru odgovarajuće investicione strategije, uzimajući u obzir raspoložive resurse.
Upotreba informacija: U slučaju potpunog ili delimičnog preuzimanja i daljeg korišćenja materijala koji se nalazi na sajtu, potrebno je navesti link odgovarajuće stranice na sajtu kompanije TeleTrade-a kao izvora informacija. Upotreba materijala na internetu mora biti praćena hiper linkom do web stranice teletrade.org. Automatski uvoz materijala i informacija sa stranice je zabranjen.
Ako imate bilo kakvih pitanja, obratite nam se pr@teletrade.global.
транcфери