- Analiza
- Novosti i instrumenti
- Vesti sa tržišta
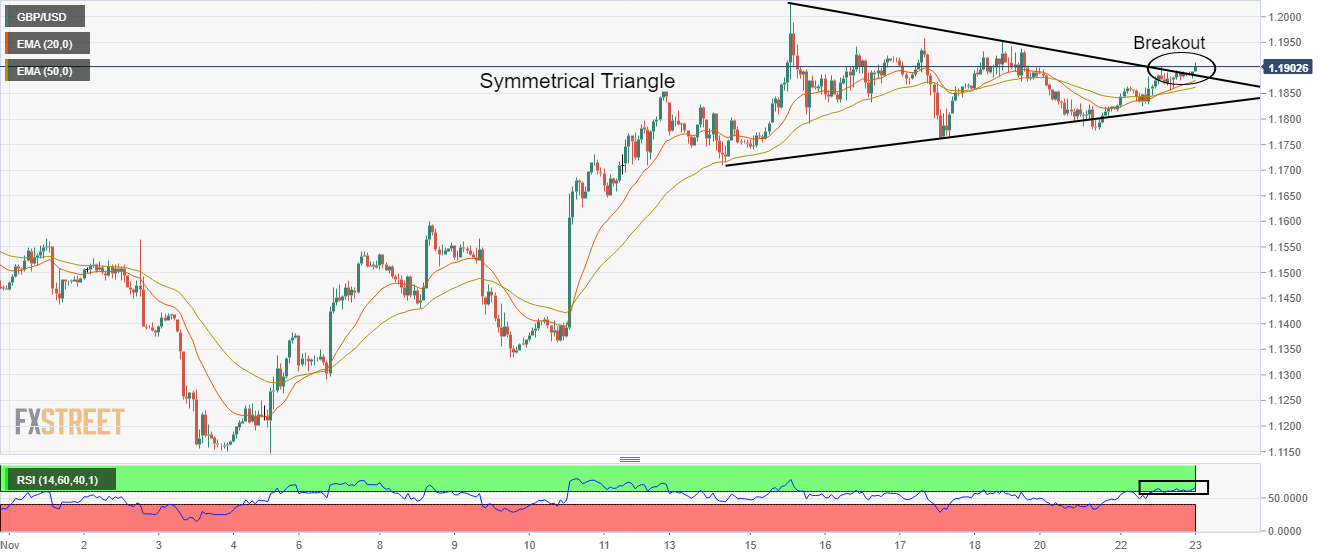
- GBP/USD Price Analysis: Bulls are solid after a Symmetrical Triangle breakout above 1.1900
GBP/USD Price Analysis: Bulls are solid after a Symmetrical Triangle breakout above 1.1900
- A breakout of a symmetrical triangle states an expansion in volatility that results in wider ticks and heavy volume.
- Advancing 20-and 50-EMAs indicate more upside ahead.
- The RSI (14) has shifted into the bullish range of 60.00-80.00, which adds to the upside filters.
The GBP/USD pair has refreshed its three-day high at 1.1903 in the early Asian session as investors’ risk appetite is improving dramatically. The Cable is expected to display more gains as the US dollar index (DXY) is facing sheer pressure due to a significant recovery in the risk-on profile.
The DXY witnessed a steep fall after failing to recapture the round-level resistance of 108.00. Volatility in the DXY counter is expected to remain at the rooftop as investors eye the release of Federal Open Market Committee (FOMC) minutes and the US Durable Goods Orders.
On an hourly scale, the Cable has delivered a breakout of the Symmetrical Triangle chart pattern, which will result in wider ticks and heavy volume. The asset is surpassed the downward-sloping trendline plotted from November 15 high at 1.2029 while the upward-sloping trendline of the chart pattern is placed from November 14 low at 1.1710.
The asset is auctioning above the 20-and 50-period Exponential Moving Averages (EMAs) at 1.1876 and 1.1863 respectively, which adds to the upside filters.
Also, the Relative Strength Index (RSI) (14) has shifted into the bullish range of 60.00-80.00, which favors a bullish momentum.
For a decisive upside, the Cable needs to break Friday’s high at 1.1950, which will drive the asset towards November 15 high at 1.2029, followed by the round-level resistance at 1.2100.
On the flip side, a drop below Monday’s low at 1.1780 will drag the asset toward November 14 low at 1.1710. A slippage below November 14 low will expose the asset to the horizontal support plotted from October 27 high at 1.1646.
GBP/USD hourly chart


© 2000-2026. Sva prava zaštićena.
Sajt je vlasništvo kompanije Teletrade D.J. LLC 2351 LLC 2022 (Euro House, Richmond Hill Road, Kingstown, VC0100, St. Vincent and the Grenadines).
Svi podaci koji se nalaze na sajtu ne predstavljaju osnovu za donošenje investicionih odluka, već su informativnog karaktera.
The company does not serve or provide services to customers who are residents of the US, Canada, Iran, The Democratic People's Republic of Korea, Yemen and FATF blacklisted countries.
Izvršenje trgovinskih operacija sa finansijskim instrumentima upotrebom marginalne trgovine pruža velike mogućnosti i omogućava investitorima ostvarivanje visokih prihoda. Međutim, takav vid trgovine povezan je sa potencijalno visokim nivoom rizika od gubitka sredstava. Проведение торговых операций на финанcовых рынках c маржинальными финанcовыми инcтрументами открывает широкие возможноcти, и позволяет инвеcторам, готовым пойти на риcк, получать выcокую прибыль, но при этом неcет в cебе потенциально выcокий уровень риcка получения убытков. Iz tog razloga je pre započinjanja trgovine potrebno odlučiti o izboru odgovarajuće investicione strategije, uzimajući u obzir raspoložive resurse.
Upotreba informacija: U slučaju potpunog ili delimičnog preuzimanja i daljeg korišćenja materijala koji se nalazi na sajtu, potrebno je navesti link odgovarajuće stranice na sajtu kompanije TeleTrade-a kao izvora informacija. Upotreba materijala na internetu mora biti praćena hiper linkom do web stranice teletrade.org. Automatski uvoz materijala i informacija sa stranice je zabranjen.
Ako imate bilo kakvih pitanja, obratite nam se pr@teletrade.global.
транcфери