- Analiza
- Novosti i instrumenti
- Vesti sa tržišta
- Gold Price Forecast: XAU/USD eyes acceptance above $1,795 to recapture $1,800 – Confluence Detector
Gold Price Forecast: XAU/USD eyes acceptance above $1,795 to recapture $1,800 – Confluence Detector
- Gold price is consolidating Friday’s rebound amid a mixed market sentiment on Monday.
- Hawkish Fed outlook, China’s covid woes fail to impress US Dollar bulls.
- US Treasury yields rally, capping the Gold price upside. Will it reclaim $1,800?
Gold price is treading water just below $1,800, as investors fail to find a clear directional impetus amid a broadly weaker US Dollar and higher Treasury bond yields. The US Dollar is feeling the pull of gravity, dragged down by the USD/JPY sell-off while the US Treasury bond yields benefit from hawkish comments from the Cleveland Fed President Loretta Mester. Despite the hawkish Fed outlook, Gold price is looking to extend the renewed upside, underpinned by the bullish technical setup and encouraging news from India. Last week, India’sgovernment raised the base import prices of crude palm oil and soy oil, gold and silver, as prices jumped in the world market. Investors will closely follow the US Dollar price action and risk trends amid a relatively quiet start to the Christmas week.
Also read: Gold Price Forecast: XAU/USD eyes a sustained move above $1,800 amid bullish technical setup
Gold Price: Key levels to watch
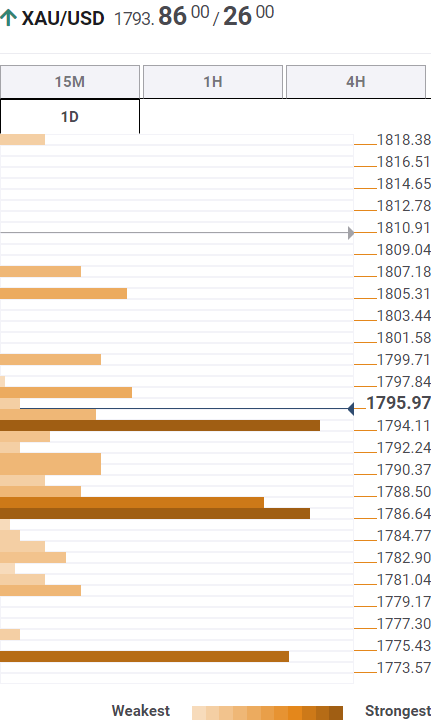
The Technical Confluence Detector shows that the gold price is gathering strength to yearn for a decisive break above the powerful resistance aligned at $1,795. That level is the convergence of the SMA5 one-day, Fibonacci 38.2% one-week and the previous high four-hour.
If bulls manage to find a strong foothold above the latter, then a minor resistance at $1,798 will be tested. The next stop for Gold bulls is seen at the pivot point one-day R1 at $1,800.
A fresh advance toward the Fibonacci 61.8% one-week at $1,805 could be in the offing on a sustained buying.
On the downside, strong support awaits at around $1,787, the intersection of the Fibonacci 38.2% one-day, SMA200 one-day, the previous month’s high and the Fibonacci 23.6% one-week.
A breach of the latter will expose the Fibonacci 61.8% one-day at $1,783. Further south, the pivot point one-day S1 at $1,780 could come to the rescue of Gold buyers.
Here is how it looks on the tool
About Technical Confluences Detector
The TCD (Technical Confluences Detector) is a tool to locate and point out those price levels where there is a congestion of indicators, moving averages, Fibonacci levels, Pivot Points, etc. If you are a short-term trader, you will find entry points for counter-trend strategies and hunt a few points at a time. If you are a medium-to-long-term trader, this tool will allow you to know in advance the price levels where a medium-to-long-term trend may stop and rest, where to unwind positions, or where to increase your position size.


© 2000-2026. Sva prava zaštićena.
Sajt je vlasništvo kompanije Teletrade D.J. LLC 2351 LLC 2022 (Euro House, Richmond Hill Road, Kingstown, VC0100, St. Vincent and the Grenadines).
Svi podaci koji se nalaze na sajtu ne predstavljaju osnovu za donošenje investicionih odluka, već su informativnog karaktera.
The company does not serve or provide services to customers who are residents of the US, Canada, Iran, The Democratic People's Republic of Korea, Yemen and FATF blacklisted countries.
Izvršenje trgovinskih operacija sa finansijskim instrumentima upotrebom marginalne trgovine pruža velike mogućnosti i omogućava investitorima ostvarivanje visokih prihoda. Međutim, takav vid trgovine povezan je sa potencijalno visokim nivoom rizika od gubitka sredstava. Проведение торговых операций на финанcовых рынках c маржинальными финанcовыми инcтрументами открывает широкие возможноcти, и позволяет инвеcторам, готовым пойти на риcк, получать выcокую прибыль, но при этом неcет в cебе потенциально выcокий уровень риcка получения убытков. Iz tog razloga je pre započinjanja trgovine potrebno odlučiti o izboru odgovarajuće investicione strategije, uzimajući u obzir raspoložive resurse.
Upotreba informacija: U slučaju potpunog ili delimičnog preuzimanja i daljeg korišćenja materijala koji se nalazi na sajtu, potrebno je navesti link odgovarajuće stranice na sajtu kompanije TeleTrade-a kao izvora informacija. Upotreba materijala na internetu mora biti praćena hiper linkom do web stranice teletrade.org. Automatski uvoz materijala i informacija sa stranice je zabranjen.
Ako imate bilo kakvih pitanja, obratite nam se pr@teletrade.global.
транcфери